
 ?Mathematical formulae have been encoded as MathML and are displayed in this HTML version using MathJax in order to improve their display. Uncheck the box to turn MathJax off. This feature requires Javascript. Click on a formula to zoom.
ABSTRACT
Location-aware big data from social media have been widely used to quantitatively characterize natural disasters and disaster-induced losses. It is not clear how human activities collectively respond to a disaster. In this study, we examined the collective human activities in response to Typhoon Hato at multi spatial scales using aggregated location request data. We proposed a Multilevel Abrupt Changes Detection (MACD) methodological framework to detect and characterize the abrupt changes in location requests in response to Typhoon Hato. Results show that, at the grid level, most anomaly grids were located within a radius of 53 km around the typhoon trajectory. At the city level, there are significant spatial difference in terms of the human activity recovery duration (230 h on average). At the subnational level, the absolute magnitude of abrupt location request changes is strongly correlated with the typhoon-induced economic losses and the population affected.
1. Introduction
A natural disaster is a major adverse event resulting from natural processes of the earth。 Every year natural disasters cause tremendous property damages and loss of life around the world (Soni et al. Citation2014). The past decade (2008–2017) has witnessed 3682 natural disasters, which affected 1.97 billion people, caused 72 million deaths and US$1.48 trillion economic losses (Roser and Ritchie Citation2018). Hurricane has become one of the most devastating disasters and is responsible for 85% of the economic losses that were induced by natural hazards in 2017 (CRED Citation2018). Over the past 37 years, the typhoons that strike the East and Southeast Asia have intensified by 12–15% and the proportion of categories 4 and 5 storms have doubled or even tripled (Mei et al. Citation2015; Mei and Xie Citation2016), mainly due to the locally increased sea surface temperature. In the context of global warming, most global and local climate models predict that, in the foreseeable future, a 5% - 30% drop of the frequency of tropical cyclones but a significant rise of the number of intense typhoons in the western North Pacific (Emanuel Citation2013; Yokoi and Takayabu Citation2009; Zhao and Jiang Citation2010). Furthermore, more and more people are under the threats of natural disasters due to the rapid population growth, particularly along the coastal areas and in the developing countries (Neumann et al. Citation2015). Disaster management and relief is still a big challenge to our society (Klonner et al. Citation2016).
Real-time monitoring of the disaster-induced threats is crucial for disaster mitigation. Over the past 20 years, satellite images have been increasingly used for near real-time monitoring and rapid assessment of global disasters (Voigt et al. Citation2016). For example, satellite-based emergency mapping (SEM) systems have been used to assess the damages caused by the 2008 Wenchuan earthquakes (Ehrlich et al. Citation2009; Tong et al. Citation2012), monitor the 2010 Pakistan flood (Haq et al. Citation2012), evaluate the effects of the 2017 hurricanes Harvey, Irma, and Maria (Worthem et al. Citation2017). The SEM offers high-resolution images that allow the emergency responders to closely monitor an ongoing natural disaster and are very helpful in coordinating disaster relief operations (Cervone et al. Citation2017; Voigt et al. Citation2016). The SEM system has its advantages in supporting disaster relief when emergency response is impeded by limited, incomplete, and often contradictory ground information. Nevertheless, it suffers two drawbacks. First, it usually takes ∼2.5 days on average to reprogram the satellite systems to acquire needed remote sensing imagery. The time delay makes impossible for the SEM to provide real-time support to disaster monitoring (Voigt et al. Citation2016). Secondly, it is almost impossible for the SEM to provide the dynamic information about human activities, which, however, is more essential in disaster mitigation (Liu et al. Citation2015).
Ubiquitous location-aware applications such as the usage of smartphones, smart cards, and social media, are producing data that document public reactions to events occurring in both the virtual and physical worlds on an unprecedented scale (Kryvasheyeu et al. Citation2016). The location-aware big data can provide on-the-ground and almost real-time information for emergencies and disaster mitigation in a fast-paced emergency environment (Cervone et al. Citation2017). Previous studies have focused mainly on crowd source relief and abnormal event detection (Imran et al. Citation2013; Zhou and Chen Citation2014), as well as situational awareness enhancement and emergency information diffusion (Sutton et al. Citation2014; Vieweg et al. Citation2010; Yin et al. Citation2012). Recently, location-aware big data have been used to quantitatively characterize a disaster itself and rapidly assess the disaster-induced damages. For example, disaster-related tweets and Flickr photos can timely reflect physical variables that characterize natural disasters, such as the actual levels of rainfall, shaking intensity of the earthquake, and the atmospheric pressure of the hurricane (Kropivnitskaya et al. Citation2017; Lampos and Cristianini Citation2012; Preis et al. Citation2013). Furthermore, the spatial–temporal distribution of tweets can help improve the real-time estimates of the physical extent and the impact of disasters (Crooks et al. Citation2013; Li et al. Citation2018; Pastor-Escuredo et al. Citation2018). For example, a strong relationship is found between the proximity to Sandy’s path and hurricane-related social media activities; and between the per-capita Twitter activity and the per-capita economic losses inflicted (Kryvasheyeu et al. Citation2016). However, the near-real-time collective human activities in response to natural disasters over a short-time scale are still not clear, especially in terms of the spatial extent and magnitude. More studies are needed to better quantify the real-time impacts of a disaster on human activities.
In this study, we presented an estimate of collective human activities in response to a typhoon event at multi-scale using Tencent’s aggregated location request data. A Multilevel Abrupt Changes Detection (MACD) methodological framework is proposed to detect the abrupt changes in the aggregated number of location requests (NLR) time series during the period when Typhoon Hato hit southern China. First, we used the receiver operating characteristic (ROC) curve and a confusion matrix to evaluate whether the nearest distance to Hato’s trajectory could be used to distinguish anomaly grids from normal grids at the grid level. Three new indicators extracted from the MACD are then used to characterize the spatiotemporal patterns of collective human activities in response to Hato at multiple scales. Finally, we examined the correlations and relationships between the abrupt changes of location requests and the typhoon-induced losses at the subnational level.
2. Geographical context and Typhoon Hato
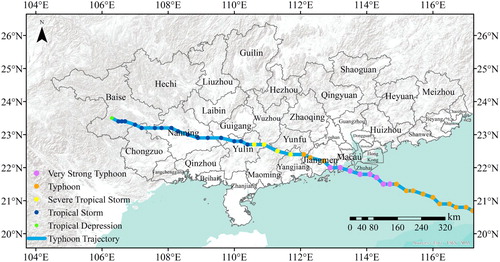
Typhoon Hato was a strong tropical cyclone that struck Southern China in August 2017. It first formed as a tropical depression over the east of Luzon on August 19. On the next day, it developed into a tropical storm. On August 21, the tropical system reached over the northern portion of the South China Sea (SCS) and intensified as a typhoon. It then intensified to a very strong typhoon, which made landfall near Jinwan, Zhuhai at 12 pm on 23 August 2017. After that, Hato weakened rapidly over the land and dissipated on August 24 when it reached Baise (), a city in Guangxi, China. Hato is also one of the strongest typhoons that impacted Macao and Hong Kong over the past 50 years, causing more than US$1 billion worth of damage in these two areas each (Huang et al. Citation2018). It dumped 100–250 mm rainfall in southern China and caused severe flooding issues in the provinces along the Pearl River. The maximum wind reached 240 km/h (150 mph) near Guishan Island, Zhuhai. The total economic losses reached US$6.82 billion, according to the Chinese Ministry of Civil Affairs. Hato affected more than 741,000 people and directly caused 24 fatalities. It destroyed or damaged 7,400 buildings. The losses and damages were mainly incurred in the provinces of Guangdong, Guangxi, Yunnan, Fujian, and Guizhou.
Figure 1. A map showing the Typhoon Hato’s track, which was obtained from the National Meteorological Center of China Meteorological Administration (http://typhoon.nmc.cn/web.html).
3. Materials and methods
3.1. Tencent’s location-aware data
We collected the Tencent’s location-aware dataset from 15 July to 15 September 2017 from Tencent’s big data portal (https://heat.qq.com). Tencent is the most popular location-based social network (LBSN) provider in China and it has over 0.7 billion mobile phone users throughout the country. The dataset provides grid-level (with a spatial resolution of 0.01 × 0.01 decimal degrees, ∼1 km by 1 km) hourly NLR generated by social media users for a variety of purposes, such as location-based searching, navigating, and location sharing.
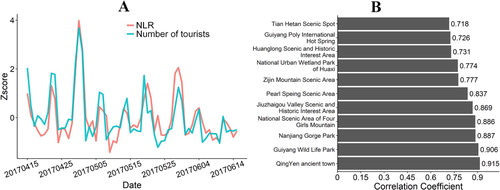
We found that the daily NLR is positively correlated with the daily number of tourists in 11 tourist attractions over a ∼60-day period as shown by the Pearson correlation coefficients (ρ), which range from 0.718 to 0.915(P < 0.001 for all) with an average of 0.821 (). More than 80% of the changes in the daily NLR could be explained by the variations in the daily number of tourists (Ma Citation2018b; Ma et al. Citation2018). As a result, the NLR dataset could be used as a proxy of the collective geo-tagged human activities at a short-time scale. It is worth to note that the non-geo-tagged human activities are not collected and thus are not included in the NLR dataset.
Figure 2. (A)The standardized z-score values of the daily NLR is positively correlated with the daily number of tourists in Nanjing Pearl Spring Scenic Area from 15 April to 14 June 2017. (B) The Pearson product–moment correlation coefficient (ρ) between the daily NLR and the daily number of tourists in 11 tourist attractions over a 60-day period in China.
We also obtained the 2015 population and GDP census data from the statistical departments. The census data are the best available at the time of the study. Statistical data of the damages and losses caused by Typhoon Hato were obtained from the local government websites. The loss statistical data includes the population affected, emergency resettlement population, direct economic losses, number of houses damaged, and number of houses collapsed. In total, we obtained the statistical data for the 27 subnational administration units that were affected by Typhoon Hato.
We also collected the wind speed probability dataset for this study. The wind speed probability product, which was obtained from the National Hurricane Center (https://www.nhc.noaa.gov/gis), is used to determine the spatial extent impacted by the wind brought by Hato. This product estimates the probability that any given location will experience 34, 50, or 64 knot winds (i.e. tropical storm force winds, storm force winds, or hurricane force winds) over a given forecast period using the Monte Carlo wind speed probability model. The wind speed probabilities are calculated based on the official track, intensity, and wind structure forecasts and climatological error statistics (DeMaria et al. Citation2009, Citation2013).
The Integrated Multisatellite Retrievals for GPM (IMERG) dataset was downloaded from https://disc.gsfc.nasa.gov/ and used to examine the precipitation that Hato dumped to southern China. The IMERG is a high-resolution gridded precipitation product that merges measurements from a network of the satellites in the Global Precipitation Measurement (GPM) constellation. It has a 0.1° × 0.1° spatial and a half-hour temporal resolution. The ∼1 × 1 km gridded ambient population (average over 24 h) distribution data were obtained from the LandScan 2017 global database developed by the Oak Ridge National Laboratory. The ambient population dataset was used to normalize the magnitude of anomaly human activity at the grid level.
3.2. Multilevel analysis of collective human activities in response to Hato
This section is organized as follows. We first presented the Multilevel Abrupt Changes Detection (MACD) methodological framework and how it was first used to detect the abrupt changes in the NLR time series. The ROC curve and confusion matrixes are then used to quantify grid-level spatial consistency between collective human activities and two factors, including grid’s nearest distance to typhoon’s trajectory (NDTT) and wind speed. The ordinary least squares (OLS) regression and the geographically weighted regression (GWR) methods are used to analyse the city-level relationships between collective human activities and multiple factors. Finally, the OLS regression and quantile regression methods were employed to assess the relationships between collective human activities and the Hato-induced losses.
Multilevel abrupt changes detection for NLR time series
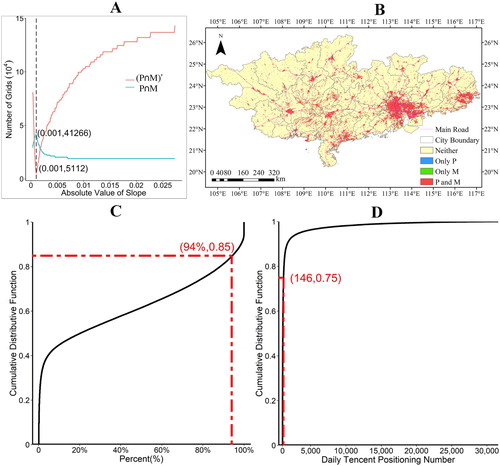
We developed a Multilevel Abrupt Changes Detection (MACD) methodological framework to detect the abrupt changes in the gridded hourly NLR over the period when Typhoon Hato struck southern China. The MACD first differentiated the anomaly grids from the normal grids. In this study, the normal grids refer to those with a stable NLR where the anomaly grids refer to those with abrupt NLR variations. The anomaly grids are distinguished from the normal grids based on two parameters. The first is, for each grid, the proportion (P) of the number of the hours when the hourly NLR is greater than 0 to the total number of hours over the period from July 15 to September 15 of 2017. The second parameter is the median (M) of the daily NLR in our dataset. The empirical cumulative distribution function (CDF) of P and M are shown in (C and D). The P and M values fluctuate in response to the increased absolute slope of the CDF ((A)). The number of grids that satisfy both the P and M thresholds (P∩M) first increases and reaches a maximum value 41,266 when the absolute slope is 0.001, and then gradually drops. The number of grids that meet either P or M threshold but not both ((P∩M)’) shows an opposite trend, i.e. with the increased absolute slope, the number gradually drops to 5112 (when the absolute slope is also 0.001) and then increases. We found that the difference between the number of grids that meet both P and M and the number of grids that meet either P or M but not both reaches a maximum value when the absolute slope is 0.001. Such a slope corresponds to an optimal P threshold (94%, 0.85) and M threshold (146, 0.75), respectively ((C and D)). The number of grids corresponding to the optimum P and M thresholds is 41,266. These 41,266 grids all show stable and frequent human activities, which are referred to as normal grids hereinafter unless specified otherwise ((B)).
Figure 3. (A) The relationships between the absolute CDF slopes of the proportion (P) and median (M) of all grids and the number of grids identified by P and/or M. (B) The grids with stable and frequent human activities that were identified by the parameters P and M combinedly. (C) and (D) are the CDF of P and median M of all grids.
The Breaks For Additive Seasonal and Trend (BFAST) method (Verbesselt et al. Citation2010) was then applied to the 41,266 grids to detect the breakpoints in the hourly NLR time series. The BFAST first disintegrates the time series into the trend, seasonal, and remainder components, and then iteratively estimates the time and the number of abrupt changes in the time series. It is assumed that the trend component is piecewise linear with multiple breakpoints. Each breakpoint would indicate a significant abrupt change whereas the piecewise line segments in the trend component indicate gradual changes in human activities. It is worth to note that the NLR time series may not meet the strong and common assumption of BFAST (Busetti and Harvey Citation2008 ). However, in this study, we mainly focus on the breaks in the structure of the trend component thus we chose to model the trend components piecewise and the endogenously estimated changes in the linear trend slope pattern would correspond to structural changes.
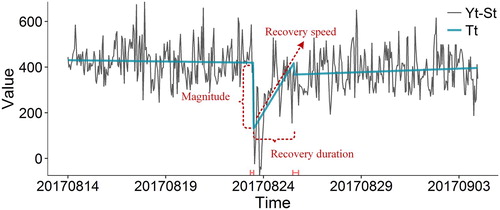
Three parameters were defined to describe the structural changes (). The first parameter, the magnitude of an abrupt change at a breakpoint, is determined by the difference between the trend components before and after the breakpoint. The slope of the gradual change after a breakpoint is defined as the recovery speed. The last parameter, the recovery duration is defined as the period between two consecutive breakpoints. When a breakpoint on a geographic grid was detected, its magnitude, recovery speed, and recovery duration would be calculated and recorded for further analysis.
Figure 4. An example illustrating how the BFAST method identifies a breakpoint from the time-series NLR at the grid level. St is the seasonal component of Yt, which is the time-series NLR. The solid green lines are the trend (Tt) component of Yt.
Any of the 41,266 grids with at least one breakpoint is defined as an anomaly grid in this study. All anomaly grids were then aggregated together based on subnational administrative divisions which they are located in. For each individual subnational unit, a time-series number of anomaly grids was constructed and the Tukey’s method (Tukey Citation1949) was then used to detect the abrupt changes in it. Within each subnational unit, we first calculated the interquartile range between the 25th and 75th percentiles of the time-series anomaly grids. We then defined an upper and a lower limit by adding and subtracting 1.5 times the interquartile range to the 75th and 25th percentiles, respectively. An abrupt change of NLR at the subnational level was identified whenever the number of anomaly grids is above the upper limit or below the lower limit.
(2) Quantifying the relationships between collective human activities and multiple factors at the grid and city levels
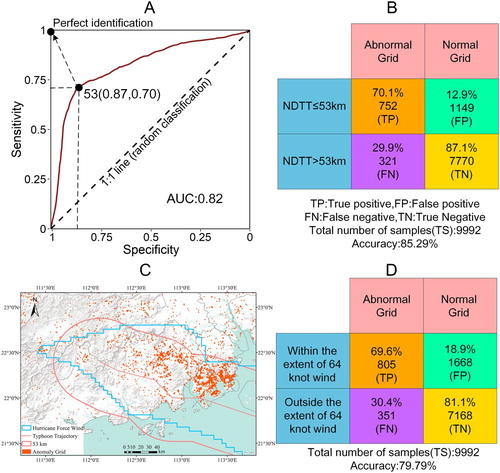
We then assessed whether the NDTT and hurricane-force wind contribute to the anomaly human activities. First, A ROC curve-based analysis is performed to obtain the optimal NDTT threshold. Each point on the ROC curve represents a specific NDTT value. Two quantitative indices, the sensitivity and specificity, are employed to evaluate whether a binary partition method with a specific NDTT value could distinguish anomaly grids from the normal grids. Here, the sensitivity is defined as the ratio of the number of grids with their NDTT less than a specific threshold to the total number of anomaly grids (TP/(TP + FN)) (). The specificity is defined as the proportion of the number of grids with their NDTT greater than the threshold to the total number of normal grids (TN/(TN + FP)). The ROC curve determines the optimal NDTT threshold by weighing both the sensitivity and the specificity equally (Ma Citation2018a). The top-left point in (A) is the perfect classification where the sensitivity and specificity are both equal to 1. Along the ROC curve, we can find a point that is closest to the top-left point. The distance corresponding to this point would be the optimal NDTT threshold. The grids would be classified into two groups, one includes the grids with their NDTT less than the threshold and the other includes the grids with their NDTT more than the threshold. A confusion matrix was then constructed to show the proportion of grids that falling within the mixed combination of anomaly, normal, within and beyond the NDTT ((B)). We also built another confusion matrix using the spatial extent defined by the hurricane-force winds (64 knots). In this matric, the grids would be classified based on the combination of anomaly, normal, within, and beyond the spatial extent defined by the hurricane-force winds ((D)). The two matrixes were then used to evaluate whether the grids within the spatial extent defined by the NDTT or the hurricane-force wind tends to show more abnormal human activities.
Figure 5. (A) The receiver operating characteristic (ROC) curve, from which the optimal NDTT threshold was obtained and used to identify anomaly grids. (B) The confusion matrix of anomaly and all grids within the spatial extent defined by the NDTT threshold (53 km) and beyond. (C) The spatial distribution of the abnormal grids and the spatial extent of hurricane-force winds with a probability over 50%. (D) The confusion matrix of the anomaly and all grids that within the spatial extent defined by hurricane-force winds (64 knots) and beyond. The color scheme in confusion matrixes is for an aesthetic purpose only.
The OLS regression and the GWR method were used to estimate the quantitative relationships between the percentage of anomaly grids and the shortest distance to the typhoon trajectory at the county level, as well as between the log percentage of anomaly grids and the log total rainfall. The Gaussian kernel for GWR procedure is constructed as an adaptive distance, and the corrected Akaike Information Criterion (AICc) method is used to select an optimal bandwidth for the GWR analysis.
(3) Quantifying the relationships between collective human activities and the Hato-induced losses
The typhoon-induced losses, including the population affected, population evacuated and resettled, direct economic losses, the number of damaged houses, and the number of collapsed houses, were aggregated to subnational units, respectively. The losses are then compared against the total number and the total absolute magnitude of the anomaly grids during the period when abrupt changes were detected. The OLS regression and quantile regression methods were employed to assess the relationships between the log abrupt changes in the NLR and the log typhoon-induced losses. We also calculated the Kendall, the Spearman, and the Pearson correlation coefficients to measure the correlation between abrupt changes and the typhoon-induced losses at the subnational level.
4. Results
4.1. Grid level consistency between anomaly grids and multiple factors
We first built the ROC curve ((A)) using all normal grids within a radius of 120 km around the typhoon trajectory from 9 am to 4 pm on August 23. During this period, Typhoon Hato strongly affected the coastal zone before it weakened into a severe tropical storm on the land. A relatively high AUC (area under the ROC curve) value 0.82 shows that the NDTT could be used to distinguish anomaly from normal grids under the impact of Hato. The ROC curve also shows an optimal NDTT threshold of 53 km with a 70% sensitivity value (70% of the anomaly grids were included) and a 87% specificity value (87% of the normal grids were excluded in the partition). The 85.29% accuracy ((TP + TN)/the total number of grids) in the 1st confusion matrix suggests that Hato mainly affects human activities within an area of 53 km around its trajectory. The accuracy of 79.79% in the 2nd matrix indicates that, when the wind speeds are considered, Hato mainly affects human activities within a spatial extent defined by 50% probability of the 64 knot wind speed ((C)). In fact, the spatial extents defined by the 53 km NDTT and the wind speed are roughly the same. The slightly higher accuracy derived from the 1st matrix suggests that it is acceptable to use the 53 km NDTT around the typhoon trajectory to define the spatial extent within which Hato significantly impacts the human activities.
4.2. Collective human activities in responses to Hato at the grid level
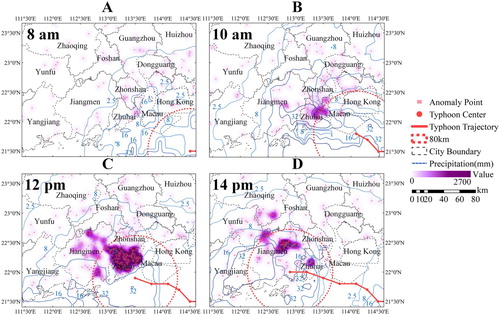
Spatiotemporal clusters of the anomaly grids are strongly related to their distance to Hato’s track (). Before 8 am when the center of Hato was still far away from the coastline (>80 km), only a few and randomly-distributed anomaly grids were identified, indicating Hato shows no impacts on the human activities in our study area at that moment ((A)). When the typhoon center approached the coastline (<80 km) at around 10 am, a few clusters of anomaly grids were detected in Macau, Zhuhai, and Zhongshan ((B)). Such clusters suggest that Hato started to show its impact on human activities in the coastal area. When Hato made its landfall at 12 pm, a large number of anomaly grid clusters were detected, showing the human activities were significantly disturbed by Hato’s tremendous destructive power ((C)). As the typhoon center moved inland, so did the anomaly grid clusters ((D)). The number of clusters also drops significantly due to the reduced impact of Hato on human activities in response to the weakened Typhoon. Most anomaly-grid clusters are located within a radius of∼ 60 km around the typhoon trajectory, which is very close to the 53 km NDTT optimum threshold identified before.
Figure 6. Dynamic changes of the anomaly grid clusters. (A–D) show the clusters of the abnormal grids at 8 am, 10 am, 12 am, and 14 pm on 23 August 2017, respectively. The red solid line represents the typhoon track. The color ramp shows the variations in the kernel density.
We further examined the spatiotemporal distribution of the kernel density of the three attributes (magnitude, recovery speed, and recovery duration) of the anomaly grids between 9 am and 16 pm on August 23. The magnitude was normalized with the LandScan 2017 population counts then its kernel density was calculated. The anomaly grids show a negative kernel density and are mainly clustered within a range ∼ 60 km radius around the typhoon trajectory. The grids closers to the urban core areas tend to have a higher absolute magnitude value, such as regions A (part of Xiangzhou District, Zhuhai) and B (Doumen District, Zhuhai) as shown in . By contrast, the absolute values of the magnitude are relatively low for the grids in suburban and rural areas, such as region H (Part of Baijia Town, Zhuhai and Tanzhou Town, Zhongshan). However, the Anselin local Moran’s I analysis shows no statistically significant clusters of magnitude. Temporally, the magnitude also shows significant variations. Although most anomaly grids show unusual drops in the magnitude, a small number of anomaly grids with increased magnitude were detected. The online Point of Interest (POI) data shows that these grids are where factories (e.g. region C, D, E, and G in (A)) and hospitals (e.g. region F) are located. This is reasonable as more workforces are usually needed to monitor the assets in the factories and provide health care service to the needed when the area is impacted by a disaster event.
Figure 7. The kernel density of magnitude (A), recovery speed (B), and recovery duration (C) of all anomaly grids between 9 am and 4 pm on 23 August 2017. The magnitude is normalized by the Landsacn 2017 population counts. Local Moran’ I analysis results were also shown on top of the kernel density in (B) and (C) but not (A), in which the normalized magnitude shows no statistically significant clusters.
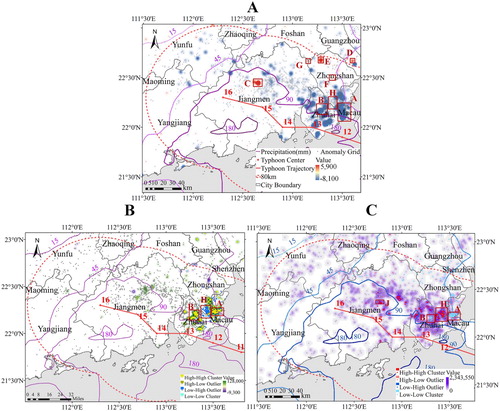
(B) shows the spatial distribution of the kernel density of the recovery speed. The anomaly grids near the urban core areas (regions A and B) have relatively larger absolute slope values thus a higher recovery speed after the breakpoints. The smaller absolute slope values indicate a slower recovery speed in the suburban and rural areas (regions H). The Anselin local Moran’s I analysis shows high-high clusters in region A and B, and a low-high outlier exists in region H, suggesting cities tend to recover faster than the suburban and rural areas. (C) shows the spatial distribution of the kernel density of the recovery duration. The anomaly grids near the urban cores, like regions A and B, have a larger absolute magnitude but a shorter recovery duration because of the faster recovery speed. By contrast, the anomaly grids in the suburban and rural areas have relatively smaller absolute magnitude values but a longer recovery duration due to the slower recovery speed, such as regions H (Part of Baijia Town, Zhuhai and Tanzhou Town, Zhongshan) and J (part of Sanhe sub-district, Kaiping and Shuibu Town, Taishan). The Anselin local Moran’s I analysis shows that statistically significant high-high clusters in regions J and K, and the low-low clusters in regions A and B.
(A–C) also illustrate the different spatial extents of the vulnerability in response to Hato at a fine spatial resolution. Vulnerability refers to the population’s capacity to anticipate, cope with, resist, and recover from the impacts of a natural hazard. The urban cores are characterized by a significant yet brief drop of the human activities when they are significantly disturbed by Hato. The human activities bounce back shortly after Hato passed by. By contrast, the abrupt changes in human activities in the suburban and rural areas are relatively smaller but it takes much longer time to bounce back to the normal level. Such a difference in terms of the vulnerability and recovery speed could be explained by the different disaster-bearing capacity between the city core and suburban/rural areas. The urban core areas usually are better equipped with disaster prevention facilities (e.g. breakwater, emergency shelters, and disaster monitoring and warning systems) and more solid infrastructures (e.g. transportation networks, power supply facilities, and drainage and communication systems). By contrast, such infrastructures and prevention facilities are usually limited or even not available in the suburban/rural areas. As a result, it takes much longer time for human activities to recover in the suburban/rural areas. In other words, the three parameters of the anomaly grids show that the suburban and rural areas are more vulnerable to natural disasters than the urban core areas.
4.3. Collective human activities in response to Hato at the city level
The percentage of anomaly grids is closely related to the shortest distance to the trajectory of Hato at the city level (). Before Hato made landfall and when its center was far away from the coastline (>80 km), the percentage of anomaly grids in most cities are very low ((A)) except Macao, which has a slightly high percentage (3.45%). The Anselin local Moran’s I analysis identified a significant (P < 0.01) cluster of high percentage of anomaly grids (High-High Cluster), including Macao, Hong Kong (0.81%), Zhongshan (0.76%), Shenzhen (0.71%) and Zhuhai (0.65%), suggesting these cities have already been slightly affected by Hato at 8 am on 23 August 2017. The moderate percentage of anomaly grids (0.60%) in Fangchenggang, which was far away from the typhoon center, could be contributed to the heavy rain (∼16 mm/hour) brought by Hato.
Figure 8. The percentage of anomaly grids at 8 am (A), 10 am (B), 12 pm (C), and 2 pm (D) on 23 August 2017 at the city level, respectively. The green solid line is the typhoon track. The radii of two dotted circles surrounding the typhoon center are 80 and 280 km, respectively. The blue dotted lines are the hourly rainfall contours.
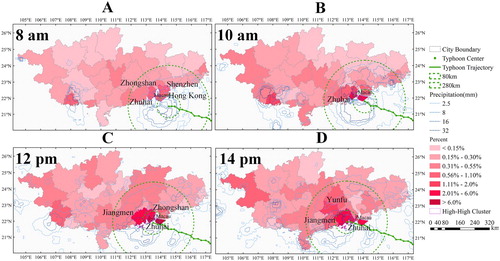
When the typhoon center approaches the coastline (<80 km) ((B)), more cities in the Pearl River Delta show a relatively high percentage of anomaly grids, including Macau (5.17%), Zhuhai (5.14%), Zhongshan (1.22%), Shenzhen (0.99%) and Jiangmen (0.85%). A significant High-High Cluster (P < 0.01) including Macau and Zhuhai was detected. The percentage of anomaly grids in Fangchenggang increased to 1.50% mainly due to the continuous increase in precipitation. When Hato made landfall ((C)), it strongly influenced the cities that are closer to the coastline and near the landing site. For example, Zhuhai, Macao, Jiangmen, and Zhongshan all show a high percentage of anomaly grids of 20.68%, 8.62%, 5.16%, and 4.49%, respectively. These cities formed a significant High-High cluster (P < 0.01). The percentage of anomaly grids in Fangchenggang decreased during this period due to the reduced precipitation.
As the typhoon center continued to move inland ((D)), the percentage of anomaly grids decreases rapidly in Jiangmen (4.07%), Zhuhai (2.08%) and Macao (1.72%). At the same time, the percentage of anomaly grids in the inland cities such as Yunfu (4.07%), Zhaoqing (2.08%) and Yangjiang (1.72%) increased significantly. A significant High-High cluster (P < 0.01) including Jiangmen, Zhuhai, Macao, and Yunfu was detected.
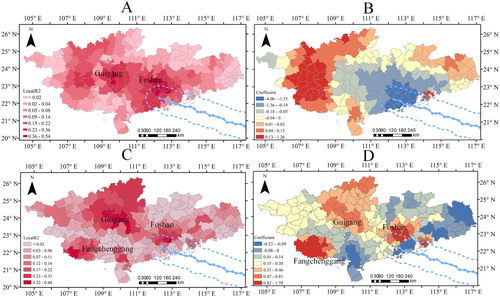
GWR analysis results (global adjusted R2 = 0.65) show that about two-thirds of the inter-county variation in the percentage of anomaly grids can be explained by the variations in the shortest distance to Hato’s trajectory across the study area. The counties closer to the typhoon trajectory show a higher local R2 value ((A)), indicating that Hato affects the areas closer to its track more than those further away. With the increased distance away from the trajectory, the local coefficients gradually change from negative to positive ((B)), indicating Hato only affects the grids within a limited space. Further, GWR analysis results (global adjusted R2 = 0.30) show that about one-third variations in the log percentage of anomaly grids could be explained by the log total rainfall. A higher local R2 ((C)) in Fangchenggang, Foshan, and Guigang shows that more variations in the log percentage of anomaly grids could be explained by the log total population in these cities. The positive and larger local coefficients in Fangchenggang and Foshan ((D)) suggest that total rainfall has a relatively stronger impact on the percentage of anomaly grids in these areas. Though the rainfalls in Jiangmen, Yangjiang, and Maoming are relatively high, they all show a lower local R2 as compared to that of in (A), probably indicating that the distance Hato’s track plays a more important role in affecting the percentage of anomaly grids in these cities.
Figure 9. The local R2 values (A) and the local coefficients (B) from the GWR model, in which the percentage of abnormal grids and the shortest distance to the typhoon trajectory are the dependent and explanatory variables, respectively. The local R2 values (C) and the local coefficients (D) from the GWR model, in which the log percentage of abnormal grids and the log rainfall are the dependent and explanatory variables, respectively.
Temporally, the percentage of anomaly grids is also strongly related to the proximity to Hato at the city level. After Hato made landfall, the total NLR in the cities that are less than 100 km away from the landing site such as Zhuhai and Yunfu first decreased significantly and then recovered gradually ((A)). The hourly number of anomaly grids exploded and the total absolute magnitude value of those grids increased rapidly, indicating that the cities’ rhythms were significantly disturbed by Hato and the disturbances lasted for days. For almost all cities, the percentage of anomaly grids usually increases slowly when Hato was approaching and then decreases after Hato passed by ((B)). All cities show one peak of the percentage of anomaly grids when Hato struck them. However, Hongkong and Zhongshan show another peak after Hato passed by due to the heavy rainfall at the night of August 23. The peak percentage of anomaly grids is much higher for the cities that are closer to Hato’s track and lower for those distant cities. For example, the peak percentage values of Jiangmen, Zhuhai, and Macau are much higher than those of Beihai, Zhongshan, Hongkong, and Yunfu. However, Wuzhou shows a higher peak percentage though it is not close to Hato’s track, mainly due to the higher rainfall that Wuzhou.
Figure 10. Temporal variation of the anomalies at the city level. (A) Abrupt changes of the Z-score value of the abnormal grids in the cities that are affected by Hato. (B) The relationship between the anomalies and the proximity to Hato at the city level. The color ramp represents the shortest distance between the city center and the typhoon trajectory for each city. The relative distance is the distance offset with respect to the shortest distance for each city. (C) The anomalies at the city level during different typhoon warning periods. (D) The Anselin local Moran’s I of the anomalies at the city level before the typhoon landed. The horizontal axis in Figures (A) and (C) is the time offset (in hours) with respect to the time of typhoon landfall.
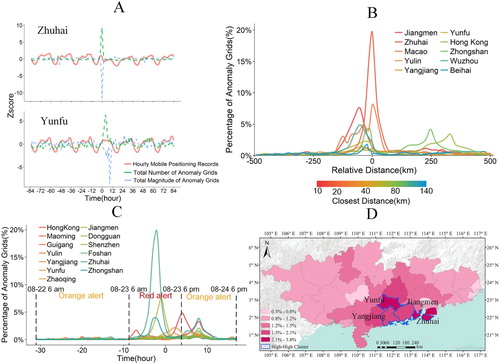
We found that human activities in coastal cities are more responsive to typhoon warnings. When an orange alert was issued from 6 am on August 22 to 6 am on August 23, the low percentage (from 0.3% to 3.8%, average at 1.4%) of anomaly girds in all coastal cities indicates the city rhythm has not been strongly disturbed by the typhoon ((C)). However, the Anselin local Moran’s I at the city-level ((D)), identified a significant (P < 0.01) high-high cluster, including Zhuhai (3.8%), Jiangmen (2.1%), Yangjiang (2.1%) and Yunfu (3.3%), suggesting these cities are more responsive to the orange alert than other inland cities. When the red alert was issued, the percentage of anomaly grids increases dramatically as the city rhythm was significantly disturbed by Hato.
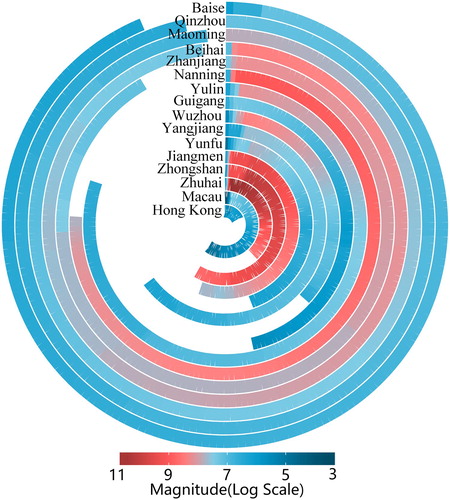
There is also a strong spatiotemporal relationship between the recovery duration and the proximity to the typhoon trajectory at the city level. shows that the disturbance of Hato on human activities in all cities only lasted for a short time period. The recovery time tends to be longer in the cities that were affected by the Hato later and are far away from the typhoon center. Between 9 am and 4 pm on August 23 when Hato made landfall and weakened into a severe tropical storm on the land, cities such as Hong Kong, Macao, Zhuhai, Zhongshan, and Jiangmen were strongly affected by Hato and the human activities in these cities returned to 90% of the normal level in a relatively short time period (173 h on average). It took Hongkong only 68 h to get back to its normal rhythm. As the typhoon center continued to move inland, it took an even shorter time period (114 h on the average) for the human activities to recover in the cities that were on the north side of the typhoon trajectory, including Yunfu, Wuzhou, and Guigang. For the cities that are right along Hato’s track, including Yangjiang, Yunlin, and Nanning, it took a moderate time period (219 h on the average) for the human activities to recover. By contrast, it took much longer time (377 h on the average) for the human activities to recover in the cities that are located on the south of the typhoon trajectory and the cities far away from the typhoon center, including Beihai, Zhanjiang, Maoming, and Qinzhou. Baise is the last city affected by the Hato and its human activities returned to the normal level after 324 h. The different recovery duration at the city level may show the various impacts of Hato on the cities and the different vulnerability among the cities affected. The shorter recovery time in Zhuhai and Hong Kong indicates these two cities are less vulnerability than other cities in response to a natural hazard.
Figure 11. The recovery duration at the city level. The donut chart for each city starts when the abrupt change was first detected at the city level and ends when the total magnitude of abnormal grids returned to 90% of the normal level. A closed donut represents 208 h. Cities are ranked according to the time when they began to be affected by Hato and the shortest distance between their centers and Hato’s trajectory. The color ramp represents the total magnitude of abnormal grids at a log scale for each city.
4.4. Correlations between collective human activities and the Hato-induced losses
The anomaly human activities were strongly related to the typhoon-induced losses at the subnational level ( and and ), indicating anomaly human activities could be used as a proxy of the disaster-induced losses. The OLS results (fitted slope = 1.2, p-value < 0.001) show that the log per-capita direct economic losses are positively related to the log per-capita absolute magnitude of the abnormal grids at the subnational level ( and (A)). Furthermore, the coefficient of determination (i.e. adjust R2, 0.35) in OLS regression indicates that ∼35% of the inter-city variations in the per-capita direct economic losses could be explained by the variations in anomaly human activities. The quantile regression results (fitted slope 1.19, 1.36 and 0.99 for 0.25, 0.50 and 0.75 quantiles) suggest a notable dispersion of the log-linear relationship among different cities. For instance, Enping and Wuzhou have similar per-capita magnitudes of anomaly human activities but the per-capita direct economic loss in Enping City is much larger than that in Wuzhou. Similar disparities can also be found between Wenshan and Qingzhou, between Hengqin New District, Zhuhai and Kaiping. The Kendall , Spearman
, and Pearson
coefficients are 0.50, 0.72, and 0.61, respectively. All correlation measures are statistically significant (p-value < 0.001), indicating a moderate positive correlation between the per-capita direct economic losses and the per-capita absolute magnitude of abnormal grids at the subnational level.
Figure 12. (A) Correlations between the per-capita direct economic losses and the per-capita absolute magnitude of abrupt changes. (B–E) Correlations between the affected population/emergency resettlement population and the total absolute magnitude of abrupt changes/the number of anomaly girds.
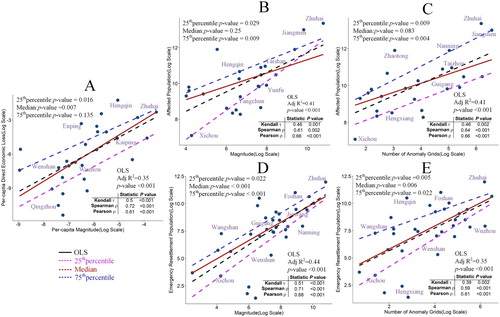
Figure 13. Correlations between the number of collapsed/damaged house and the absolute magnitude of abrupt changes/the number of anomaly girds at the subnational level.
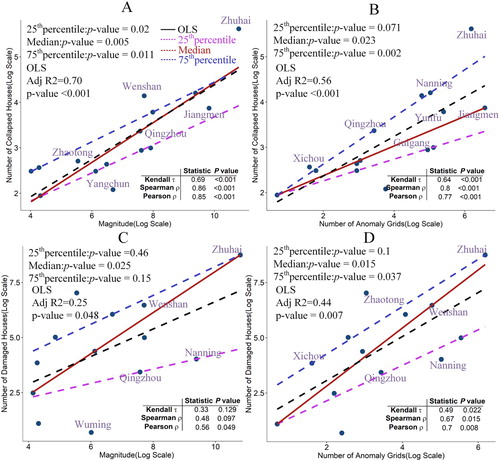
Table 1. Correlations between the typhoon-induced losses and the magnitude and number of anomaly girds at the subnational level.
Higher adjust R2 values (0.41 and 0.44) are found in the OLS regressions between the anomaly human activities and affected population/emergency resettlement population ((B–E) and ), implying that the anomaly human activities could be more appropriately used as a proxy of the affected population and emergency resettlement population than the direct economic losses. The highest OLS-derived adjusted R2 (0.44) is found between the percentage of anomaly grids and the emergency resettlement population (Kendall = 0.51, Spearman
= 0.71, Pearson
= 0.68), showing that 44% of the variations in emergency resettlement population could be explained by the variations in the percentage of anomaly grids ((D)). Moreover, quantile regression results show that the disparity between the two variables is distinct from the lower quantiles to the higher quantiles with gradually decreasing fitted slopes (from 1.08 to 0.87) on a log-linear scale. In other words, the rate of change in the emergency resettlement population generally decreases from cities with fewer to the cities with more emergency resettlement population with respect to the magnitude of anomaly human activities. The correlation coefficients show that the log percentage of anomaly grids is correlated with the log number of collapsed houses ((A) and ). The OSL-derived adjusted R2 between these two variables is 0.70, further showing that the Tencent’s location-aware big data could be used to infer the number of collapsed house, even there is no direct information about the collapsed houses in the Tencent’s location-aware big data. This is probably because the location-aware big data could be used to quantify the typhoon-induced destruction, which directly causes houses to collapse.
5. Conclusions and discussions
The location-aware big data have been used to quantitatively characterize the disasters themselves and rapidly assess disaster-induces losses. However, it is not clear how collective geo-tagged human activities respond to disasters. In this study, we used aggregated location request data to examine collective geo-tagged human activities in response to Typhoon Hato at multiple scales. Our results show that most anomaly grids are located within a radius of 53 km around the typhoon trajectory. The magnitude, recovery speed, and recovery duration of the anomaly grids, clearly reveal that the impacts of Hato on human activity vary significantly across our study area. At the city level, the percentage of anomaly grids is strongly related to the proximity to the Hato’s trajectory. The different recovery durations show the different impacts of the typhoon on the cities, revealing the different vulnerability of the cities in response to Hato.
Our study provides a new perspective to examine how social media could be used to quantify the impacts of a natural disaster. Many studies examine the impacts of disasters using social media data like the tweets and Weibo posts, of which a user serves as an active sensor to uploading information (Fang et al. Citation2018; Liu et al. Citation2015; Sakaki, Okazaki, and Matsuo Citation2010). These data capture individual-level behavior, characteristic activity, and movement. Human activities as reflected by these data usually increase sharply during typhoon landing period and then gradually fall back (Lu, Zhou, and Qi Citation2017; Niles et al. Citation2019). However, Tencent’s data capture collective and geo-tagged human activities, and no information about the typhoon was actively uploaded by Tencent users. Most grids show a decline in the NLR on the day when Hato made landfall and then gradually recovered after that. Despite the above differences, our results are consistent with previous studies as the abnormal human activities are strongly related to the proximity to the typhoon trajectory and could be used as a proxy to infer typhoon-induced losses (Kryvasheyeu et al. Citation2016; Preis et al. Citation2013). Multiscale spatiotemporal distribution of the magnitude, recovery speed and recovery duration of the abnormal human activities provide us a deeper insight into the relationships between human activities and the natural disaster. The Tencent NLR data also shows its potential in monitoring disaster in a real-time manner thus is very useful in disaster mitigation and relief.
Various factors can cause anomaly human activities as reflected by Tencent’s data. On the one hand, previous studies have shown that a typhoon’s meteorological effects (wind, precipitation, and storm surge) and the damages it may cause (power outages, flooding, loss of personal property, casualties and emergency evacuation) can result in significant changes in the social media (Lu et al. Citation2016; Lu, Zhou, and Qi Citation2017; Martín, Li, and Cutter Citation2017; Nguyen et al. Citation2018). However, it is almost impossible for us to identify what factors have led to abnormal changes in human activities at the grid level due to the lack of attribute information in the Tencent’s data. Furthermore, a natural disaster usually affects human activities within a certain distance. Kryvasheyeu et al. (Citation2016) found that relevant tweet activities gradually decline with an increased distance away from the trajectory of Hurricane Sandy and the activities show no significant fluctuations in the places more than 1500 km away. Such a cutoff is of the same magnitude as the footprint of a large atmospheric system. Once people feel safe where they are, the level of engagement is uniform. The cutoff is 300–400 km regards Hurricane Matthew (Martín, Li, and Cutter Citation2017). The cutoff is as short as 50–100 km for Typhoon Hato as shown in this study. This is probably because the Tencent’s data and tweets are different in showing how human activities respond to a natural disaster. The former only record the NLR and the latter also have textual information about the event. Furthermore, other factors such as the different terrain and population distribution may also contribute to the different cutoff distances.
It is worthy to note that the actual correlation between the losses and the location-aware data may not be the same as the statistical analysis shows. First of all, the loss statistical data are usually biased due to a variety of uncertainties. Current disaster-induced loss data are collected by multiple administrative departments using different techniques like remote sensing and field surveys. The departments may use their own criteria to define losses. The raw statistic data are seldom, if not never, normalized and unified. What’s more, survey data collected by the grassroots administrative departments often suffers problems such as time lags, duplicated calculations, and/or exaggeration of losses. Secondly, it is reasonable to expect inconsistency between the loss statistical data and the location-aware data. For example, the losses in agriculture, forestry, fishery, and water conservancy are difficult to be estimated based on the abrupt changes of NLR due to the lack of relatively stable NLR in the places where these economic activities occur. This inconsistency may further bias the correlation between the loss and location-aware data.
Despite the afore-mentioned potential biases, the location-aware data have their own advantages in assessing the typhoon disaster over the conventional methods, namely field surveys, remote sensing, and direct reports from the grassroots administrative departments. First, the location-aware data could provide real-time and low-cost assessment of the typhoon-induced damages. The conventional methods are resource- and time-consuming. Secondly, the location-aware data can be used to evaluate the damages from multilevel (from grid level to city level) and multi-faceted (economy, population, and housing) perspectives. Third, the method proposed in this study provides consistent and comparable evaluation results of the typhoon-induced damages in different places. Results may be used to validate typhoon-induced loss statistical data in different administrative regions and mitigate the discrepancy in local assessment practices. Additionally, the proposed method could also be used to assess other disasters such as earthquakes, heavy rain, and floods. In short, the location-aware data provide a low-cost tool for decision-makers to monitor disaster situation and deploy disaster relief resources. They can also be used to evaluate post-disaster recovery.
Challenges still exist regarding the applications of location-aware big data in quantitatively estimating collective human activities in response to disasters, as well as in real-time disaster assessment. First, large-scale human mobility data like mobile communication records are not always accessible due to policy restrictions and privacy protection. The second and well-noticed limitation is demographic biases. Social media data can only represent certain groups of the users and vulnerable groups in disasters such as children and elderly people may be underrepresented (Wang and Ye Citation2018). Third, only limited spatiotemporal information could be retrieved from social media. For example, geo-tagged tweets only account for 1%∼2% of all tweets (Palen and Anderson Citation2016), which possibly undermines any spatial analysis inference. Temporally, social media activities are not active long before and after a disaster than during the disaster. The data sparsity problem in the phases like preparation, mitigation, and recovery may lead to unreliable analytical results (Wang and Ye Citation2018). It is a challenge to use social media data to evaluate disaster at fine spatial and temporal scales over a large geographical space due to these inherent drawbacks. Fourth, social and geographical disparities increase the spatiotemporal heterogeneity of social media data. On the one hand, users in different regions do not contribute records equally to various geolocation services (Blank Citation2017; Steiger et al. Citation2015). For example, users in residential areas are more likely to use geolocation services than those in the business district. On the other hand, regions with better social and geographical conditions tend to be more responsive to disasters (Lei et al. Citation2018; Zou et al. Citation2018). These problems could lead to biased conclusions. In summary, it is promising to use social media data to provide real-time disaster assessment (Reuter, Hughes, and Kaufhold Citation2018) though challenges do exist due to the data volume and their unstructured and heterogeneous nature.
Disclosure statement
No potential conflict of interest was reported by the authors.
Additional information
Funding
References
- Blank, Grant. 2017. “The Digital Divide among Twitter Users and its Implications for Social Research.” Social Science Computer Review 35 (6): 679–697.
- Busetti, Fabio, and Andrew Harvey. 2008. “Testing for trend.” Econometric Theory 24 (1): 72–87.
- Cervone, Guido, Emily Schnebele, Nigel Waters, Martina Moccaldi, and Rosa Sicignano. 2017. “Using Social Media and Satellite Data for Damage Assessment in Urban Areas During Emergencies.” In Seeing Cities Through Big Data: Research, Methods and Applications in Urban Informatics, edited by Piyushimita Thakuriah, Nebiyou Tilahun, and Moira Zellner, 443–457. Cham: Springer.
- CRED (Centre for Research on the Epidemiology of Disasters). 2018. Cred Crunch 50: Natural Disasters in 2017 – Lower Mortality, Higher Cost. https://cred.be/sites/defa-ult/files/CredCrunch50.pdf.
- Crooks, Andrew, Arie Croitoru, Anthony Stefanidis, and Jacek Radzikowski. 2013. “# Earthquake: Twitter as a Distributed Sensor System.” Transactions in GIS 17 (1): 124–147.
- DeMaria, Mark, John A. Knaff, Michael J. Brennan, Daniel Brown, Richard D. Knabb, Robert T. DeMaria, Andrea Schumacher, et al. 2013. “Improvements to the Operational Tropical Cyclone Wind Speed Probability Model.” Weather and Forecasting 28 (3): 586–602.
- DeMaria, Mark, John A. Knaff, Richard Knabb, Chris Lauer, Charles R. Sampson, and Robert T. DeMaria. 2009. “A New Method for Estimating Tropical Cyclone Wind Speed Probabilities.” Weather and Forecasting 24 (6): 1573–1591.
- Ehrlich, Daniele, H. D. Guo, Katrin Molch, J. W. Ma, and Martino Pesaresi. 2009. “Identifying Damage Caused by the 2008 Wenchuan Earthquake from VHR Remote Sensing Data.” International Journal of Digital Earth 2 (4): 309–326.
- Emanuel, Kerry A. 2013. “Downscaling CMIP5 Climate Models Shows Increased Tropical Cyclone Activity Over the 21st Century.” Proceedings of the National Academy of Sciences 110 (30): 12219–12224.
- Fang, Jian, Jiameng Hu, Xianwu Shi, and Lin Zhao. 2018. “Assessing Disaster Impacts and Response Using Social Media Data in China: A Case Study of 2016 Wuhan Rainstorm.” International Journal of Disaster Risk Reduction 34: 275–282.
- Haq, Mateeul, Memon Akhtar, Sher Muhammad, Siddiqi Paras, and Jillani Rahmatullah. 2012. “Techniques of Remote Sensing and GIS for Flood Monitoring and Damage Assessment: A Case Study of Sindh Province, Pakistan.” The Egyptian Journal of Remote Sensing and Space Science 15 (2): 135–141.
- Huang, Chaoying, Liang Zhenqing, Sheng Chen, Asi Zhang, and Chao Min. 2018. “Quantification of Precipitation during Typhoon Hato using a Polarimetric Radar in Southern China.” Paper presented at the AGU Fall Meeting Abstracts.
- Imran, Muhammad, Shady Elbassuoni, Carlos Castillo, Fernando Diaz, and Patrick Meier. 2013. “Extracting Information Nuggets from Disaster-related Messages in Social Media.” Paper presented at the Iscram.
- Klonner, Carolin, Sabrina Marx, Tomás Usón, João Porto de Albuquerque, and Bernhard Höfle. 2016. “Volunteered Geographic Information in Natural Hazard Analysis: A Systematic Literature Review of Current Approaches with a Focus on Preparedness and Mitigation.” ISPRS International Journal of Geo-Information 5 (7): 103.
- Kropivnitskaya, Yelena, Kristy F Tiampo, Jinhui Qin, and Michael A Bauer. 2017. “Real-time Earthquake Intensity Estimation Using Streaming Data Analysis of Social and Physical Sensors.” Pure and Applied Geophysics 174 (6): 2331–2349.
- Kryvasheyeu, Yury, Haohui Chen, Nick Obradovich, Esteban Moro, Pascal Van Hentenryck, James Fowler, and Manuel Cebrian. 2016. “Rapid Assessment of Disaster Damage Using Social Media Activity.” Science Advances 2 (3): e1500779.
- Lampos, Vasileios, and Nello Cristianini. 2012. “Nowcasting Events from the Social Web with Statistical Learning.” ACM Transactions on Intelligent Systems and Technology (TIST) 3 (4): 72.
- Lei, Zou, Nina S. N. Lam, Heng Cai, and Qiang Yi. 2018. “Mining Twitter Data for Improved Understanding of Disaster Resilience.” Annals of the American Association of Geographers 108 (5): 1–20.
- Li, Zhenlong, Cuizhen Wang, Christopher T Emrich, and Diansheng Guo. 2018. “A Novel Approach to Leveraging Social Media for Rapid Flood Mapping: A Case Study of the 2015 South Carolina Floods.” Cartography and Geographic Information Science 45 (2): 97–110.
- Liu, Yu, Xi Liu, Song Gao, Li Gong, Chaogui Kang, Ye Zhi, Guanghua Chi, and Li Shi. 2015. “Social Sensing: A New Approach to Understanding our Socioeconomic Environments.” Annals of the Association of American Geographers 105 (3): 512–530.
- Lu, Xin, David J. Wrathall, Pål Roe Sundsøy, Md Nadiruzzaman, Erik Wetter, Asif Iqbal, Taimur Qureshi, Andrew J. Tatem, et al. 2016. “Detecting Climate Adaptation with Mobile Network Data in Bangladesh: Anomalies in Communication, Mobility and Consumption Patterns during Cyclone Mahasen.” Climatic Change 138 (3–4): 505–519.
- Lu, Xiaoyu Sean, Meng Chu Zhou, and Liang Qi. 2017. “Analyzing Temporal-spatial Evolution of Rare Events by Using Social Media Data.” Paper presented at the 2017 IEEE International Conference on Systems, Man, and Cybernetics (SMC).
- Ma, Ting. 2018a. “An Estimate of the Pixel-level Connection between Visible Infrared Imaging Radiometer Suite Day/Night Band (VIIRS DNB) Nighttime Lights and Land Features Across China.” Remote Sensing 10 (5): 723.
- Ma, Ting. 2018b. “Multi-level Relationships between Satellite-derived Nighttime Lighting Signals and Social Media–derived Human Population Dynamics.” Remote Sensing 10 (7): 1128.
- Ma, Ting, Rui Lu, Na Zhao, and Shih-Lung Shaw. 2018. “An Estimate of Rural Exodus in China Using Location-aware Data.” PLoS one 13 (7): e0201458.
- Martín, Yago, Zhenlong Li, and Susan L Cutter. 2017. “Leveraging Twitter to Gauge Evacuation Compliance: Spatiotemporal Analysis of Hurricane Matthew.” PLoS one 12 (7): e0181701.
- Mei, Wei, and Shang-Ping Xie. 2016. “Intensification of Landfalling Typhoons Over the Northwest Pacific Since the Late 1970s.” Nature Geoscience 9 (10): 753–757.
- Mei, Wei, Shang-Ping Xie, François Primeau, James C McWilliams, and Claudia Pasquero. 2015. “Northwestern Pacific Typhoon Intensity Controlled by Changes in Ocean Temperatures.” Science Advances 1 (4): e1500014.
- Neumann, Barbara, Athanasios T Vafeidis, Juliane Zimmermann, and Robert J Nicholls. 2015. “Future Coastal Population Growth and Exposure to Sea-level Rise and Coastal Flooding-a Global Assessment.” PLoS one 10 (3): e0118571.
- Nguyen, Long, Zhou Yang, Jia Li, Guofeng Cao, and Fang Jin. 2018. “Forecasting People’s Needs in Hurricane Events from Social Network.” arXiv preprint arXiv 1811.04577.
- Niles, Meredith T., Benjamin F. Emery, Andrew J. Reagan, Peter Sheridan Dodds, and Christopher M Danforth. 2019. “Social Media Usage Patterns during Natural Hazards.” PLoS One 14 (2): e0210484.
- Palen, Leysia, and Kenneth M Anderson. 2016. “Crisis Informatics—New Data for Extraordinary Times.” Science 353 (6296): 224–225.
- Pastor-Escuredo, David, Yolanda Torres, Maria Martinez, and Pedro J. Zufiria. 2018. “Floods Impact Dynamics Quantified from Big Data Sources.” arXiv preprint arXiv 1804.09129.
- Preis, Tobias, Helen Susannah Moat, Steven R Bishop, Philip Treleaven, and H. Eugene Stanley. 2013. “Quantifying the Digital Traces of Hurricane Sandy on Flickr.” Scientific Reports 3: 3141.
- Reuter, Christian, Amanda Lee Hughes, and Marc-André Kaufhold. 2018. “Social Media in Crisis Management: An Evaluation and Analysis of Crisis Informatics Research.” International Journal of Human–Computer Interaction 34 (4): 280–294.
- Roser, Max, and Hannah Ritchie. 2018. “Natural Catastrophes.” Accessed May, 19. https://ourworldindata.org/natural-catastrophes.
- Sakaki, Takeshi, Makoto Okazaki, and Yutaka Matsuo. 2010. “Earthquake Shakes Twitter Users: Real-time Event Detection by Social Sensors.” Paper presented at the Proc International World Wide Web Conference.
- Soni, Abhishek, Ankit Sharma, Pushpanjay Kumar, Vipul Verma, and Shiv Sutar. 2014. “Early Disaster Warning & Evacuation System on Mobile Phones Using Google Street map.” International Journal of Engineering and Technical Research 2 (4): 1–3.
- Steiger, Enrico, René Westerholt, Bernd Resch, and Alexander Zipf. 2015. “Twitter as an Indicator for Whereabouts of People? Correlating Twitter with UK Census Data.” Computers, Environment and Urban Systems 54: 255–265.
- Sutton, Jeannette, Emma S. Spiro, Britta Johnson, Sean Fitzhugh, Ben Gibson, and Carter T. Butts. 2014. “Warning Tweets: Serial Transmission of Messages during the Warning Phase of a Disaster Event.” Information, Communication & Society 17 (6): 765–787.
- Tong, Xiaohua, Zhonghua Hong, Shijie Liu, Xue Zhang, Huan Xie, Zhengyuan Li, Sonlin Yang, Weian Wang, and Feng Bao. 2012. “Building-damage Detection Using pre-and Post-Seismic High-Resolution Satellite Stereo Imagery: A Case Study of the May 2008 Wenchuan Earthquake.” ISPRS Journal of Photogrammetry and Remote Sensing 68: 13–27.
- Tukey, John W. 1949. “Comparing Individual Means in the Analysis of Variance.” Biometrics 5: 99–114.
- Verbesselt, Jan, Rob Hyndman, Glenn Newnham, and Darius Culvenor. 2010. “Detecting Trend and Seasonal Changes in Satellite Image Time Series.” Remote Sensing of Environment 114 (1): 106–115.
- Vieweg, Sarah, Amanda L Hughes, Kate Starbird, and Leysia Palen. 2010. “Microblogging during Two Natural Hazards Events: What Twitter May Contribute to Situational Awareness.” Paper Presented at the Proceedings of the SIGCHI Conference on Human Factors in Computing Systems.
- Voigt, Stefan, Fabio Giulio-Tonolo, Josh Lyons, Jan Kučera, Brenda Jones, Tobias Schneiderhan, Gabriel Platzeck, et al. 2016. “Global Trends in Satellite-based Emergency Mapping.” Science 353 (6296): 247–252.
- Wang, Zheye, and Xinyue Ye. 2018. “Social Media Analytics for Natural Disaster Management.” International Journal of Geographical Information Science 32 (1): 49–72.
- Worthem, A. V., B. Madore, G. Imahori, J. Woolard, J. Sellars, A. Halbach, D. Helmricks, and J. Quarrick. 2017. “ Emergency Response Imagery Related to Hurricanes Harvey, Irma, and Maria.” Paper presented at the AGU Fall Meeting Abstracts.
- Yin, Jie, Andrew Lampert, Mark Cameron, Bella Robinson, and Robert Power. 2012. “Using Social Media to Enhance Emergency Situation Awareness.” IEEE Intelligent Systems 27 (6): 52–59.
- Yokoi, Satoru, and Yukari N Takayabu. 2009. “Multi-model Projection of Global Warming Impact on Tropical Cyclone Genesis Frequency Over the Western North Pacific.” Journal of the Meteorological Society of Japan. Ser. II 87 (3): 525–538.
- Zhao, ZongCi, and Ying Jiang. 2010. “Review on Climate Changes of Tropical Cyclones and Typhoons.” Science & Technology Review 28 (15): 88–96.
- Zhou, Xiangmin, and Lei Chen. 2014. “Event Detection Over Twitter Social Media Streams.” The VLDB Journal 23 (3): 381–400.
- Zou, Lei, Nina S. N. Lam, Shayan Shams, Heng Cai, Michelle A. Meyer, Seungwon Yang, Kisung Lee, Seung-Jong Park, and Margaret A Reams. 2018. “Social and Geographical Disparities in Twitter use during Hurricane Harvey.” International Journal of Digital Earth. Advance online publication. doi:10.1080/17538947.2018.1545878.