
ABSTRACT
Identifying land forms and land cover classes are important tasks in image interpretation. Sometimes, a phenomenon called terrain reversal effect (TRE) causes an inverted perception of 3D forms. When this inversion occurs, valleys appear as ridges and vice versa. While the TRE can severely impair the ability to identify 3D land forms, ‘correcting’ for the TRE in imagery can introduce new problems. Importantly, one of most commonly-proposed methods – shaded relief map (SRM) overlay – appears to impair the ability to identify land cover classes. In this paper, we report a comparative empirical evaluation of an SRM overlay solution, and its ‘enhanced’ versions supported by various other cues (stereopsis, motion, labels). In response to the different solutions, we measure the effectiveness, efficiency, confidence and preferences of our participants in land form and land cover identification tasks. All examined methods significantly improve the ability to detect land forms accurately, but they also impair the ability to identify the land cover classes to different degrees. Additionally, participants’ visualization preferences contradict their performance with them, calling for reflection on the visual effects of the applied correction methods. Based on the study, recommendations concerning the correction of the TRE are drawn, and gaps are identified.
1. Introduction and background
Technical developments in the last few decades provided satellite images and shaded relief maps (SRMs) in unprecedented quality to anyone with Internet access (Çöltekin, Lokka, and Boér Citation2015). These geographic displays are not only of critical importance in many domains that require expertise (e.g. earth sciences, resource management, urban planning or disaster/rescue efforts), but also assist people without expertise in everyday tasks such as wayfinding or planning, e.g. hike or bike trips (Boér, Çöltekin, and Clarke Citation2013). However, both satellite images and SRMs can suffer from a severe visual illusion called the terrain reversal effect (Saraf et al. Citation2007; Bernabé-Poveda and Çöltekin Citation2014), also known as relief inversion (Imhof Citation1967), or false topographic perception phenomenon (Saraf et al. Citation1996).
1.1. Terrain reversal (relief inversion)
To construct three-dimensional objects from a two-dimensional representation, the human visual system (HVS) makes various assumptions, one of which is assuming a single light source that illuminates the scene from above (Cavanagh and Leclerc Citation1989; Kleffner and Ramachandran Citation1992; Lovell, Bloj, and Harris Citation2012; Mamassian and Goutcher Citation2001; Saraf et al. Citation2005; Sun and Perona Citation1998). Perceptual system benefits from such assumptions to maintain a stable and consistent experience (Lovell, Bloj, and Harris Citation2012). If the visual scene contains ambiguity, the HVS relies on these assumptions to ‘make sense’ of the scene (Morgenstern, Murray, and Harris Citation2011). This assumption of the HVS is termed light-from-above prior, and it creates expectations in regarding the position/orientation of shadows in a scene as well as on shape perception (e.g. Mamassian and Goutcher Citation2001; Sun and Perona Citation1998). If the light comes from a direction that conflicts with the expected light direction, various degrees of relief inversion occurs (Biland and Çöltekin Citation2017; Gerardin, Kourtzi, and Mamassian Citation2010).
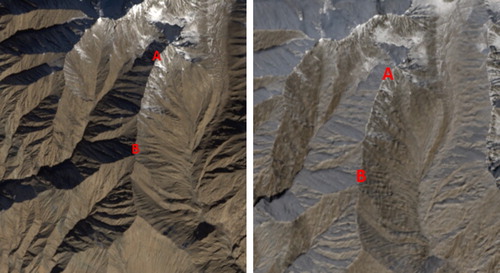
The light-from-above prior affects perception in geographic displays too, causing the terrain reversal effect (TRE) if shadow is the main depth cue (i.e. satellite images, shaded relief maps, and possibly in some contour maps). Perceptual inversions of the topography induced by the TRE can be harmful, especially when people are unaware of its existence (Saraf et al. Citation2007). Biland and Çöltekin (Citation2017) have shown that most people are indeed unaware of the fact they might be affected by the TRE. Being unaware of the TRE can lead to misidentification of land forms and the spatial relationships between land forms (Bernabé-Poveda, Sánchez-Ortega, and Çöltekin Citation2011; Biland and Çöltekin Citation2017; Çöltekin and Biland Citation2018; Çöltekin, Lokka, and Zahner Citation2016). illustrates the TRE on a satellite image (left), along with its corrected version (right) with one of the correction approaches evaluated in this study.
Figure 1. An original satellite image with terrain reversal (right), and the corrected version with an SRM overlay (left) without terrain reversal. The landform marked A–B is a ridge in both images, but it appears as a valley in the left image, and as a ridge in the right, to the majority of people.
1.2. Cue integration theory
The HVS has several mechanisms for perceiving depth, and the depth cues, such as relative size, shadow, perspective or binocular parallax feed these mechanisms (Goldstein and Brockmole Citation2016). In the case of multiple cues, cue integration theory posits that the HVS fuses them to improve depth perception (Lovell, Bloj, and Harris Citation2012). According to the linear cue integration theory; cues have different weights, and each cue is processed separately by the HVS first, then the various depth estimations are combined by assigning weights to each cue according to its reliability compared to other cues in the respective scene (Landy et al. Citation1995; Lovell, Bloj, and Harris Citation2012). Alternatively, a non-linear integration theory suggests that cues complement each other ‘as needed’, either because all or some of them are weak (e.g. Bülthoff and Mallot Citation1988; Hubona et al. Citation1999; Vuong, Domini, and Caudek Citation2006). There are various complex interactions between the cues (Vuong, Domini, and Caudek Citation2006). For example, the depth cues can help with disambiguation of the scene, that is, one cue might reduce the ambiguity of another one. The cues can also ‘veto’ one another, or the stronger ones might override weaker ones in a conflicting situation in a way that almost only the stronger cue contributes to the depth perception (Bülthoff and Mallot Citation1988; Landy et al. Citation1995).
1.3. Correction methods
In the TRE, the key depth cue is shading/shadows. Relying on an understanding of the depth cues, how they might interact, and how they can be manipulated in visuospatial displays; several correction methods have been proposed for the TRE. A categorization of (some of) the proposed correction methods was published by Zhang, Yue, and Yuan (Citation2016). We adopted Zhang et al.’s approach (Citation2016), and extended it, as shown in . Note that while the methods in the category ‘direct change’ () make use of an SRM for correcting the TRE, the methods indicated as ‘indirect change’ methods do not use such a model. Also note that the advantages and disadvantages listed in are mostly based on theoretical positions or qualitative evaluations of the authors who proposed them, and not necessarily supported by empirical evidence. The proposed ‘advantages’ and ‘disadvantages’ might depend on the eventual use case of the images, for example, for pure human viewing (image interpretation), the fact that radiometric information is modified would not matter, but if the images will be subject to image classification methods for spatial analyses, it might be very important to be aware of the consequences.
Table 1. An overview of correction methods for the TRE.
A frequently proposed correction technique is the SRM overlay; in which the satellite images with TRE are overlain with a semi-transparent SRM (e.g. Saraf et al. Citation2005; Citation2007). Traditionally, SRMs are produced with the illumination source at an azimuth angle of 315°, and at 45° altitude, which produces nearly TRE-free SRMs; even though according to a recent empirical study, illumination source at 337.5° is better for removing the TRE (Biland and Çöltekin Citation2017). The recommended opacity levels of the SRM vary, but all based on qualitative reasoning so far. For example, Gil et al. (Citation2014) considered 30% for panchromatic and 50% for multispectral images, but they have not tested these opacity levels in user studies. The SRM overlay has the advantage that the corrected image is already ortho-rectified, oriented towards the north, and the initial radiometric characteristics are kept (Gil et al. Citation2014). Therefore, image classification can be applied afterwards without constraints because the images ‘only’ lay on top of each other as layers, and thus do not interfere with the radiometric values. It is also a simple and fast method (Gil et al. Citation2014). Disadvantages are found in the loss of image sharpness due to the overlay, and the subsequent color desaturation (Gil et al. Citation2014). This is especially unfavorable for images with low spatial resolution. Among the correction methods we identified; the overlay of a semi-transparent SRM is frequently proposed as an effective, robust and feasible solution (Bernabé-Poveda, Manso-Callejo, and Ballari Citation2005; Saraf et al. Citation2005; Wu, Li, and Gao Citation2013).
1.4. Stereo, motion and labels
While shadow is the critical depth cue in the TRE, and the correction methods often manipulate the cast shadows in the image; based on the cue integration theory, we believe other cues might help amplify or suppress the TRE. For the orthogonally viewed satellite images, aside from shadows, stereo and motion might be most relevant for improving depth perception. Furthermore, as satellite maps are usually provided with labels, and labels might serve as additional semantic cues that may counter the TRE or help interpret the land cover, we include labels as one of the variables in this study.
Stereopsis is a strong depth cue, and its effect in-depth perception was shown to be greater than shadows (Bülthoff and Mallot Citation1988; Lovell, Bloj, and Harris Citation2012). While there are many ways to create stereoscopic displays, a common and low-cost method is to create an anaglyph image through color separation (Gargantini, Facoetti, and Vitali Citation2014). Anaglyphs are easy to create, can be used with hard as well as soft-copy images, and can be viewed by multiple users simultaneously. On the other hand, some color information is lost with anaglyph images, and similarly to other stereo displays, anaglyphs can cause nausea, discomfort as well as ‘ghosting’ when the overlapping of the two images is not optimal (Mehrabi et al. Citation2013; Řeřábek et al. Citation2011; Westheimer Citation2011).
Motion is not explored extensively to display depth in visualizations (Willett et al. Citation2015). In nature, either the observer moves in relation to the object creating motion parallax (e.g. Rogers and Graham Citation1979), or the object moves – or is moved by the person – creating object motion. van Beurden, Kuijsters, and IJsselsteijn (Citation2010) have shown that images with object motion as well as motion parallax lead to higher accuracy in 3D shape detection than images without motion, but object motion ‘outperforms’ motion parallax in terms of cognitive load and discomfort.
Both stereo and motion are considered dominant depth cues, and comparative studies suggest similar results regarding the accuracy in 3D shape detection (Çöltekin, Lokka, and Boér Citation2015; Hubona et al. Citation1999; Liu and Todd Citation2004; Řeřábek et al. Citation2011; Todd and Norman Citation2003; Vezzani, Kramer, and Bressan Citation2015).
As mentioned earlier, we investigated the use of labels as additional semantic cues. Labels are clearly not ‘natural’ nor pictorial, but they are important as they are often used in maps, and they can interfere with depth perception and have strong impact on in scene interpretation (Kruijff, Swan, and Feiner Citation2010; Liu, Gould, and Koller Citation2010; Polys, Kim, and Bowman Citation2005; Uratani et al. Citation2005). Labels can potentially be used by the viewers to compensate against the TRE.
2. Objectives
Correcting the TRE in satellite images is of interest to both map providers and users, but the side-effects of the proposed treatments are not well understood. We address this gap through a comprehensive empirical evaluation of various correction methods that are proposed in literature (e.g. Bernabé-Poveda, Manso-Callejo, and Ballari Citation2005; Saraf et al. Citation1996; Saraf et al. Citation2005; Saraf et al. Citation2007; Wu, Li, and Gao Citation2013). To this end, we empirically assess a selected set of promising correction methods to understand which one ‘fixes’ the terrain reversal effect in a way that helps with selected image interpretation tasks and fits well for the goals of satellite map users.
Specifically, we examine the participants’ accuracy, response time, and confidence in land form and land cover recognition tasks using an original satellite image compared to several corrected images (an SRM overlay solution with 65% opacity Relief_65, and combinations of the Relief_65 with labels, stereo, and motion). We also collect participant’s quality ratings and preferences regarding each image type. Based on the cue integration theory, we hypothesize that participants will perform better with the combined methods (Relief_65 with labels, stereo and motion) than with the SRM overlay alone, or the original image, in land form recognition tasks. We expect that SRM overlay will help against the TRE, but impair the accuracy of land cover identification due to opacity masking some photographic detail, however, the additional cues should not necessarily influence the land cover perception. Consequently, we hypothesize that participants will perform best with the original satellite image in land cover recognition tasks, and worse with the SRM-overlain images, irrespective of the additional cues. Furthermore, based on intuition and preliminary observations, we hypothesize that with increasing opacity, people will identify landforms better; whereas the opposite is true for landcover identification (increasing opacity should impair landcover identification).
3. Methods
Our main method is a controlled lab experiment. To inform this controlled experiment, we first conducted an online experiment to specify an important parameter in the SRM overlay method: The opacity levels of the overlain SRM. Below we summarize the methods for both the online and the main experiment.
3.1. Preliminary experiment: the effects of opacity levels in SRM overlays
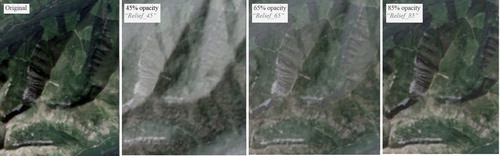
Success of the SRM overlay method largely depends on the opacity levels of the SRM, which is not systematically examined so far. To better inform our stimuli design, we first examined the effects of the SRM overlay with three different opacity levels (45%, 65% and 85%) on TRE correction, and on land cover identification. These opacity levels () were chosen based on previous research (Bernabé-Poveda and Çöltekin Citation2014; Bernabé-Poveda, Manso-Callejo, and Ballari Citation2005; Gil et al. Citation2014). From this point forward, we call the visualization types shown in as Original, Relief_45, Relief_65, Relief_85.
Figure 2. An illustration of how the changing opacity levels affect the outcome with the SRM overlay solution. Left to right: original satellite image, SRM overlain with 45%, 65%, and 85% opacity levels.
In this experiment, 93 participants (52 women, 41 men) solved a total of 80 terrain (TRE) and land cover identification (LC) tasks in randomized order in a 2 × 4 mixed factorial design. Two task types were TRE and LC, and four display (visualization) types were as shown in . While TRE and LC conditions are between-subject, the two factors have a within-subject design. Each display type contained ten items counterbalanced for a variety of factors that could potentially affect the outcome (as described in Section 3.4). Consequently, each participant solved 80 tasks with an average task completion time of 29 minutes. In this study, we were mainly interested in response accuracy, which is reported under ‘Preliminary Experiment’ in the Results section.
3.2. Main experiment: design
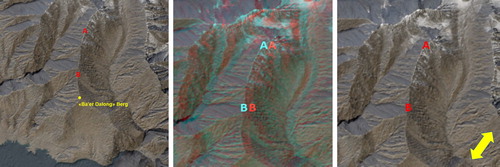
Based on our findings in the online study, we picked the Relief_65 as the functional ‘middle-ground’, and adopted it as the SRM correction for the main experiment. Because this is a compromise solution and is imperfect on both accounts (TRE and LC); we further investigated if (and how much) this method would be supported by adding other cues in the visualization, inspired by the cue integration theories. Thus, the independent variables in the main experiment are five visualization (display) types: The original satellite image was retained as a baseline, and Relief_65 as the main solution. Then, selected additional cues were added on the Relief_65. Namely, we created three more display types (visualizations): Relief_65 + labels, Relief_65 + stereo, Relief_65 + motion. Examples for these three combined correction methods are shown in .
Figure 3. Examples of added cues on the SRM overlay. Left to right: with labels, with anaglyph stereo (needs red/cyan glasses for 3D viewing), with motion (arrow represents the presence of motion, in the experiment this was an animation).
As dependent variables, we measured participants’ response accuracy, response time with each visualization type when they worked with the experimental tasks, and their confidence in their responses, as well as their preferences and their quality ratings for the examined displays. We hypothesized that the ‘best correction method’ among the tested ones should lead to high accuracy in both TRE and LC tasks, a low response time, and an overall positive subjective experience based on confidence, preference and quality metrics.
3.3. Participants
A total of 35 people (17 women, 18 men, average age: 32.14) participated in the study. We had three inclusion criteria: Participants should (1) not be experts in geography and related domains, (2) not have taken part in the preliminary study, and (3) be able to see in stereo.
3.4. Materials
We utilized a commercial questionnaire tool for collecting participants’ background information and subjective ratings. To test stereo abilities, we used a free service provided by a university (http://3d.mcgill.ca/cbc/). The stimuli were obtained using satellite images and DEMs from the EarthExplorer4 of USGS5 (https://earthexplorer.usgs.gov/). Satellite images with TRE, and without well-known landmarks, were chosen from North America, Canada and China. Using an appropriate scale, we obscured the graphic location of the terrains, and counterbalanced for convex and concave forms, as well as for land cover types and land form orientation (facing north, northeast, south and southwest). We downloaded the DEMs using SRTM data from ASTER GDEM V26 at 1 arc-second (approximately 30 m) resolution. For the hill shading of SRM overlays, the azimuth was set to 315° and the altitude of the light source to 45°, following the cartographic convention (Biland and Çöltekin Citation2017; Gil et al. Citation2010). The first of the additional cues we explored was the use of labels. For control purposes, we added only one label per image related to the 3D feature. We counterbalanced the amount of help participants might get from the labels by assigning either ‘difficult’ labels containing proper but unfamiliar names of geographical features or ‘easy’ ones including nouns for land forms (e.g. ‘hill’, ‘lake’ etc.) in equal numbers for each condition. The second additional cue we explored is a well-known contributor to depth perception: stereopsis. Stereo images were created using the ghost-reducing function of StereoPhotoMaker (http://stereo.jpn.org/eng/stphmkr/). Participants used anaglyph glasses (red/cyan) for the experimental block that included stereo images. The third depth cue we examine, also an important contributor to depth perception, is motion. We implemented motion as a ‘wiggle’ image (as a diagonal and low flashing animation) using StereoPhotoMaker using stereoscopic image pairs as input. All five visualization types were kept constant in scale and extent in all conditions.
3.5. Procedure
The study was conducted in a controlled laboratory at the Department of Geography of the University of Zurich. Upon arriving at the lab, participants signed a consent form, filled a questionnaire containing demographic questions, and took the stereoscopic vision test. We then briefed the participants about the setup and tasks, and the main experiment began. We instructed participants to answer the questions as quickly as possible, and according to what they see (i.e. not to what they interpret). As the experiment began, participants solved a total of 100 land form (TRE) and land cover (LC) identification tasks () based on 10 images in each visualization type (i.e. 50 images × 2 task types).
Table 2. Example tasks for TRE and LC.
To measure confidence, for the TRE-questions, the Likert answers clearly a valley and clearly a ridge implies that participants are very confident in their responses, thus we gave them 2 points. For answers a valley and a ridge we gave them 1 point for confidence; and if they marked ambiguous, we gave them 0 points. For the LC-questions, there is a clear right/wrong response. If participants marked not sure they got 0 points, while they received 2 points if they responded the question. Based on this, we calculated a mean confidence score ranging between 0 and 2 for both task types. Once they finished the main tasks, participants provided their subjective ratings of quality of each visualization type, and their preferences among them. Participants’ rated the quality of each visualization in an explicit 5-point Likert scale and to rate preference, they ordered visualizations (5 ‘best’, 1 ‘worst’).
The questions and experiment blocks were randomized to counterbalance for possible order effects. The entire experiment lasted around 60 minutes.
4. Results
4.1. Preliminary experiment
As expected, analyzing the number of correct answers reveal a clear conflict: Higher levels of opacity increases performance with TRE tasks, yet, impairs it in LC tasks ().
Figure 4. Results of the online study. More opaque overlays ‘fix’ the TRE better (darker gray bars show a declining trend for accuracy as the transparency increases), whereas more transparent overlays are better for landcover identification (lighter gray bars show an increasing trend for accuracy). Note the answers with the original satellite image do not even reach 50% accuracy for TRE questions. Error bars: SEM. ***p < .001, *p < .05 (n = 93). Also see .
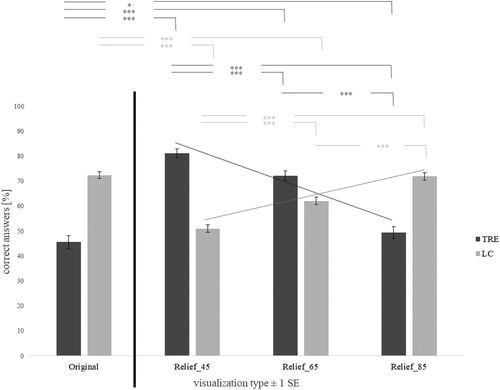
As and show, all observed differences are statistically significant with medium to high effect sizes, except in one case. That is, all corrections lead to better landform identification scores and Relif_45 and Relief_65 impair the landcover identification, but Relif_85 does not. The trade-off between TRE tasks and LC tasks is therefore clearly evidenced.
Table 3. Numerical summary of the statistical analyses of the effect of each degree of opacity vs. the original satellite image in the two tasks of interest. SD standard deviation. p-values and effect sizes are based on Friedman and Wilcoxon tests.
4.2. Main experiment
4.2.1. Performance
and show the percentage of correct answers in all tested conditions for both task types.
Figure 5. Correct answers for each visualization type in the main experiment, separated by task type. Differences between the original and all of the correction methods are statistically significant, and stereo impairs the LC ability compared to the Relief_65 SRM overlay. ***p < .001. Error bars: ± 1 SEM.
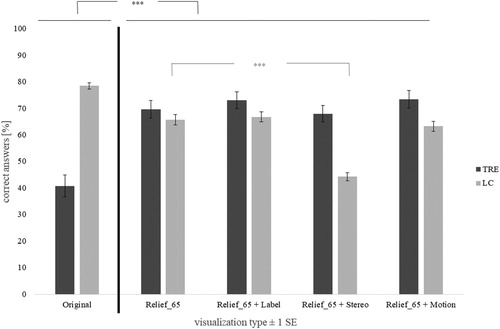
As shows, all correction methods provide improvements in TRE tasks and they impair performance in LC tasks, and all observed differences are statistically significant. Thus, the clear conflict we observed earlier (what fixes TRE creates problems for LC) is persistent also after we added new cues in the visualizations. Surprisingly, many participants do not notice this conflict though. Only about half of the participants (49%) reported noticing that there was a conflict between the perceived landforms and land cover.
Since we were set to examine how much the added cues help on top of the SRM overlay solution, we examined the observed differences between the SRM overlay and all others. While descriptive statistics suggest some trends (see ), none of the additional cues improved accuracy statistically significantly compared to the SRM overlay with 65% opacity (Relief_65). In fact, in stereo (cyan/red anaglyph), condition people did particularly badly in LC tasks.
Table 4. Mean accuracy in examined conditions. SD: Standard deviation. p-values and effect sizes are based on Friedman and Wilcoxon tests.
Response times were not affected by task type or by visualization type, and there was no speed-accuracy trade-off; thus we will not elaborate it further.
4.3. Confidence
After establishing that there was a main effect, we conducted pairwise Wilcoxon tests on the confidence scores. For the TRE-questions, differences in participants’ confidence with the Relief_65 (Mdn = 1.80, z=−2.07, p = .038, r = .35), and Relief_65 + Stereo (Mdn = 1.70, z=−2.15, p = .031, r = .36) are lower than the Original (Mdn = 1.80). For the LC-questions, Relief_65 (Mdn = 2.0, z=−2.24, p = .025, r = .38) and the Relief_65 + Motion (Mdn = 2.00, z=−2.88, p = .004, r = .49) yielded lower confidence ratings than with the Original (Mdn = 2.00).
4.4. Quality rating
For the TRE-questions, participants rated the quality of the Original (Mdn = 5.00) higher than (only) Relief_65 + Motion (Mdn = 4.00, z=−2.71, p = .007, r = .46), and the Relief_65 (Mdn = 4.00, z=−2.29, p = .022, r = .39). For the LC-questions, quality ratings for all of the ‘corrected’ visualizations were lower than the Original (Mdn = 4.00): Relief_65 (Mdn = 3.00 z=−4.35, p = .000, r = .73), Relief_65 + Label (Mdn = 4.00, z=−4.25, p = .000, r = .72), Relief_65 Stereo (Mdn = 3.00, z=−4.36, p = .000, r = .74), as well as Relief_65 + Motion (Mdn = 3.00, z=−4.09, p = .000, r = .69).
4.5. Overall preference
As shows, participants overall prefer the Original to the others, closely followed by Relief_65 + label.
Figure 6. Mean preference score [0 ≤ score ≤ 5] for each visualization type, separated by task type. ***p < .001. Error bars ± SEM.
![Figure 6. Mean preference score [0 ≤ score ≤ 5] for each visualization type, separated by task type. ***p < .001. Error bars ± SEM.](/cms/asset/931afd88-faaa-4163-8849-8d493244f497/tjde_a_1681526_f0006_ob.jpg)
Wilcoxon tests for pairwise comparisons show that participants prefer the Original (Mdn = 5.00) to the Relief_65 (Mdn = 3.00, z=−4.73, p = .000, r = .80), to Relief_65 + Stereo (Mdn = 2.00, z=−4.05, p = .000, r = .09) as well as to Relief_65 + Motion (Mdn = 1.00, z=−5.04, p = .000, r = .68). Preference ratings for the Original and Label’ do not differ.
5. Discussion
5.1. Landform and land cover identification performance
For the two different task types we studied, we hypothesized that (1) Participants would perform best with the original satellite images for the land cover identification (LC) tasks, and overlaying an SRM (irrespective of opacity levels, or added cues) would negatively affect success for this task type; and (2) We would see the opposite for the landform identification tasks, because participants would benefit from the correcting the TRE. We take accuracy in either of the two tasks as the main performance measure, because participant’s response times did not differ between any of the tested conditions. Below we first discuss our findings for landform identification (TRE) tasks, followed by a discussion of the land cover identification (LC) tasks.
5.1.1. Landform identification (i.e. TRE tasks)
As expected, we see improvements in landform identification (i.e. TRE tasks) with the corrected images in varying degrees (68% < M < 73%, see ) compared to the original satellite images (M = 40.9%). Note that the 40.9% accuracy in landform identification with the original satellite images in our experiment is comparable to the 40.3% observed by Bernabé-Poveda and Çöltekin (Citation2014). It is important to highlight the fact that ∼60% of the participants cannot correctly identify valleys and ridges in the original satellite images in the selected set; but it is also interesting that ∼40% of them can. We believe this ∼40% success despite the presence of TRE, might be explained by scene interpretation rather than 3D perception. About half of the participants reported noticing contradictions in the scene (such as snow in valley floors), and accordingly, might have concluded that the landform should be a valley or ridge. An earlier study by Çöltekin and Biland (Citation2018) reported results that support this proposition. This interpretation process may be unconscious and might affect the actual depth perception based on participants’ informal expressions (anecdotal).
Adding an SRM overlay with 65% opacity on top of the original image adjusts the shadows, and increases the accuracy (from 40.3% with the original images) to a much higher level (69.7%). However, adding more depth cues neither result in a higher accuracy nor in a faster completion time. This observation supports the theory that depth cues are not integrated linearly when they co-occur in an image (Bülthoff and Mallot Citation1988; Landy et al. Citation1995; Vuong, Domini, and Caudek Citation2006). Here, it is more probable that single depth cues ‘veto’ each other depending on their relative reliability in each satellite image scenery. It is also possible that the added depth cues could make the 3D shapes more pronounced and make the TRE stronger, and once the valley or ridge is clearer, a viewer might wonder, for example, how is it possible to have a river flowing on a ridge. To tease these two effects apart, a dedicated experiment can be conducted as a future study.
5.1.2. Land cover identification (LC) tasks
For land cover (LC) identification questions, as expected, overall, we see the opposite of the TRE tasks: Original image yields the best results (78.5%) and the others all impair successful land cover identification in varying degrees (ranging from 44.3% to 66.8%). SRM overlay (with 65% opacity) alone leads to a considerable decrease in landform identification accuracy from the original 78.5% to 65.7%, whereas adding labels on top of the SRM overlay bumps the accuracy up a tiny bit (66.8%), but motion impairs LC identification performance slightly (63.3%). Overall, adding labels or motion on top of the SRM overlay essentially does not change the outcome. Stereo, on the other hand, yielded particularly – and at first, surprisingly – poor LC identification performance (44.4%). An obvious explanation for this is that we used anaglyph method to create stereo images: An additional color-reduction was introduced on top of an already color-masking SRM overlay. This combined color reduction might have faded the subtle color differences that allow identifying land cover types (e.g. forestland, grassland, rock/sand, snow/ice). This effect should be further tested to better understand how stereoscopic depth perception interacts with the TRE, ideally in comparison with other stereoscopic viewing methods.
5.1.3. Improving the solutions
Overall, as hypothesized, solutions that improve performance with TRE tasks, impair performance in LC tasks. This is important to remember for those who are attempting to remove the terrain reversal effect. Perhaps a key thought is that instead of trying to find a solution to fit both needs, one should provide one solution per need and warn the users; and importantly, enable them to interactively change the display. One might provide the user an ‘SRM overlay’ layer to switch on and off, thus enabling the imagery for either type of image interpretation tasks. This would work only if we know that the scene is prone to TRE, otherwise one might introduce TRE to a clean image (Bernabé-Poveda and Çöltekin Citation2014). A machine learning approach to identify whether the image might be prone to TRE first, then offer a solution is also an interesting future direction. Also important to note that the full potential of the discussed methods also depend on how they are implemented.
5.2. Confidence
Confidence when identifying a landform under a visual illusion – such as it is the case with the terrain reversal effect – can be complex to interpret. If people see a valley that is, in fact, a ridge, and mark ‘clearly a valley’ (thus highly confident) we assume that the illusion is strong. Our findings in this study, similar to previous work, confirm that the illusion was strong, as participants were consistently very confident when answering all TRE questions. Similar to Biland and Çöltekin (Citation2017), this finding stands in contrast to participants’ self-evaluation: 49% of the participants stated after the study that they realized the terrain reversal effect. It might be that participants were unaware of the TRE during the completion of the study, but only realized afterwards with what they were informed, or they were answering based on perceived 3D shape (as they were instructed), even if they noted logical inconsistencies in land cover information.
Participants were overall more confident with the LC-questions than with the TRE-questions. This is expected, because with the land cover identification tasks, a depth illusion should not be really relevant. On the other hand, masking the scene by adding a semi-transparent layer does occlude some important color and texture information that is critical for identifying the land cover. Thus, the fact that participants mostly felt confident with the LC tasks is perhaps a bit naïve, as their performance could have been better.
5.3. Quality ratings and preference
As expected, participants rated the quality of original image higher than the corrected versions. Because all corrected versions had the SRM overlay which acts as a mask, it is understandable that participants considered these images as ‘lower quality’. This is especially reflected in LC-tasks, where participants were told to identify land cover features that were essentially ‘behind a curtain’. Participants’ visualization preferences correspond only partially with their quality ratings. Participants preferred the original most, followed by the label; SRM overlay and stereo had nearly identical rating, whereas motion received the poorest preference ratings. High preference for the unaltered original, similar to the quality rating, is in some way self-exploratory. Image simply looks ‘cleaner’. Adding labels on top of the SRM overlay brings the preference rating surprisingly close to the original, suggesting that participants might find some comfort in cognitive cues such as text in a scene interpretation task. The fact that participants did not like the motion (animated wiggle image) is also an interesting finding. In various previous studies, it has been shown that people like animated and interactive displays (Hegarty et al. Citation2009). In this case, perhaps the constant wiggling annoyed the participants; even though it provides a sense of depth, it might be unnecessarily overstimulating the peripheral vision (Demšar and Çöltekin Citation2017).
5.4. Conclusions, recommendations and research gaps
Successful interpretation of satellite images involves the correct recognition of land forms and land cover. Only if both parts are equally interpretable, the visualization is useful for a large range of people. Although the ability to perceive land form and land cover can be investigated separately for each visualization type, these two tasks cannot be split up in actual applications of satellite images. While generating images, there is a constant search for the best compromise between good perception of form and communicating other information as for example about the land cover (Willett et al. Citation2015). It is therefore a requirement that an application-oriented method to correct the terrain reversal effect integrates both abilities. Our study not only provides further evidence on the prevalence of the perceptual issues with satellite images, but provides a through comparative investigation of possible solutions against the TRE. Identifying the best correction method depends on the purpose of the visualization, and the tasks that the individuals want to (or must) accomplish. First thing to ensure is that image providers as well as the users are aware that perceptual issues exist, and that manipulating the familiar appearance a satellite image might influence both performance and preference of the users.
We hypothesized that participants perform better in land form recognition tasks with combined methods than with simple ones. We did not observe an effect confirming this idea. Adding further cues (labels, and the two depth cues stereo and motion) on top of the SRM overlay did not improve performance, although we maintain that more testing is needed to better understand how cue integration theory would be exploited best in this context. Another key finding in this study is that the subjective experience (preference and quality rating) of the participants opposed their performance (accuracy and response time). It has been previously shown that participants’ preferred display types do not necessarily correspond to the displays with which individuals perform best (Brügger, Fabrikant, and Çöltekin Citation2017; Hegarty et al. Citation2009). From the perspective of a visualization expert, this is important to be aware, and balance between functional, yet desirable solutions.
All in all, given varying individual factors, scene content, goals (e.g. land form vs. land cover identification), and depth cue combinations; it is nearly impossible to select one single correction method with the aim to correct the terrain reversal effect in all possible situations. If the advantages and disadvantages of the different methods investigated in this project are cumulated and analyzed in absolute terms, none of the methods are perfect to correct the terrain reversal effect in satellite images. Nevertheless, the SRM overlay method as a possible approach to correct the terrain reversal effect is still a useful for better land form perception. One key issue with the main solution (SRM overlay) we used is the harmful reduction of color information because of the SRM overlay mask. Future work is needed to maintain the spectral information of the satellite image, thus preserve information that is relevant to classification and interpretation tasks.
Furthermore, understanding the interaction between performance and subjective experience of individuals is important for evaluating correction methods. This might be even more interesting to investigate when interactivity is added to the display (Řeřábek et al. Citation2011; Willett et al. Citation2015). Finally, two application-oriented issues could be subject to further studies: on the one hand, the feasibility of a developed method should be considered. Not only is it important that a method works, but also that it provides a good cost–benefit ratio.
Acknowledgements
The authors thank Dr Robert Hess and Dr Jeremy Cooperstock for providing the online stereo test and Dr Philip Jörg and Marcel Deggeller for the helpful comments during the stimuli design. We are grateful to all our participants for their patient collaboration as well as the reviewers for their valuable time and intellectual effort. We also would like to thank Miguel A. Bernabe-Poveda for inspiring this research series in our team.
Disclosure statement
No potential conflict of interest was reported by the authors.
Additional information
Funding
Related Research Data
References
- Bernabé-Poveda, M., and A. Çöltekin. 2014. “Prevalence of the Terrain Reversal Effect in Satellite Imagery.” International Journal of Digital Earth 08 (08): 640–655. doi:10.1080/17538947.2014.942714.
- Bernabé-Poveda, M. A., M. A. Manso-Callejo, and D. Ballari. 2005. “Correction of Relief Inversion in Images Served by a Web Map Server.” Proceedings of the XXII. International cartographic Conference (ICC), A Coruña, Spain.
- Bernabé-Poveda, M., I. Sánchez-Ortega, and A. Çöltekin. 2011. “Techniques for Highlighting Relief on Orthoimagery.” Procedia – Social and Behavioral Sciences 21: 346–352. doi:10.1016/j.sbspro.2011.07.028.
- Biland, J., and A. Çöltekin. 2017. “An Empirical Assessment of the Impact of the Light Direction on the Relief Inversion Effect in Shaded Relief Maps : NNW is Better Than NW.” Cartography and Geographic Information Science. 44 (4): 358–372. doi:10.1080/15230406.2016.1185647.
- Boér, A., A. Çöltekin, and K. C. Clarke. 2013. “An Evaluation of Web-Based Geovisualizations for Different Levels of Abstraction and Realism – What do Users Predict?” Proceedings of the International Cartograhic Conference, ICC 2013, Dresden, Germany, Dresden, International Cartographic Association.
- Brügger, A., S. I. Fabrikant, and A. Çöltekin. 2017. “An Empirical Evaluation of Three Elevation Change Symbolization Methods Along Routes in Bicycle Maps.” Cartography and Geographic Information Science 44 (5): 436–451. doi:10.1080/15230406.2016.1193766.
- Bülthoff, H. H., and H. A. Mallot. 1988. “Integration of Depth Modules: Stereo and Shading.” Journal of the Optical Society of America. A, Optics and Image Science 5 (10): 1749–1758. doi:10.1364/JOSAA.5.001749.
- Cavanagh, P., and Y. G. Leclerc. 1989. “Shape from Shadows.” Journal of Experimental Psychology. Human Perception and Performance 15 (1): 3–27. doi:10.1037/0096-1523.15.1.3.
- Çöltekin, A., and J. Biland. 2018. “Comparing the Terrain Reversal Effect in Satellite Images and in Shaded Relief Maps: An Examination of the Effects of Color and Texture on 3D Shape Perception From Shading.” International Journal of Digital Earth 12 (4): 442–459. doi:10.1080/17538947.2018.1447030.
- Çöltekin, A., I. Lokka, and A. Boér. 2015. “The Utilization of Publicly Available Map Types by Non-experts – A Choice Experiment.” In Proceedings of the 27th International Cartographic Conference (ICC2015), 23–28. Rio de Janeiro, Brazil.
- Çöltekin, A., I. E. Lokka, and M. Zahner. 2016. “ On the Usability and Usefulness of 3D (geo)Visualizations – A Focus on Virtual Reality Environments.” International Archives of Photogrammetry, Remote Sensing and spatial information sciences, 41. Prague.
- Demšar, U., and A. Çöltekin. 2017. “Quantifying Gaze and Mouse Interactions on Spatial Visual Interfaces with a new Movement Analytics Methodology.” PLOS ONE 12 (8): e0181818. doi:10.1371/journal.pone.0181818.
- Gargantini, A., G. Facoetti, and A. Vitali. 2014. “A Random Dot Stereoacuity Test Based on 3D Technology.” Proceedings of the 8th International Conference on Pervasive Computing Technologies for Healthcare, 5, 3–7. doi:10.4108/icst.pervasivehealth.2014.255333.
- Gerardin, P., Z. Kourtzi, and P. Mamassian. 2010. “Prior Knowledge of Illumination for 3D Perception in the Human Brain.” Proceedings of the National Academy of Sciences 107 (37): 16309–16314. doi:10.1073/pnas.1006285107.
- Gil, M. L., M. Arza, J. Ortiz, and A. Avila. 2014. “DEM Shading Method for the Correction of Pseudoscopic Effect on Multi-platform Satellite Imagery.” GIScience & Remote Sensing 51 (6): 630–643. doi:10.1080/15481603.2014.988433.
- Gil, M., J. Ortiz, T. Rego, and L. Gelpi. 2010. “The Correction of the Pseudoscopic Effect on Quickbird Satellite Imagery.” Survey Review 42 (318): 318–326. doi:10.1179/003962610X12747001420465.
- Goldstein, E. B., and J. R. Brockmole. 2016. “Perceiving Depth and Size.” In Sensation and Perception. Chapter 10, edited by E. B. Goldstein and J. R. Brockmole, 227–257. Pacific Grove, CA: Wadsworth.
- Hegarty, M., H. S. Smallman, A. T. Stull, and M. S. Canham. 2009. “Naïve Cartography: How Intuitions About Display Configuration Can Hurt Performance.” Cartographica: The International Journal for Geographic Information and Geovisualization 44 (3): 171–186. doi:10.3138/carto.44.3.171.
- Hubona, G., P. N. Wheeler, G. W. Shirah, and M. Brandt. 1999. “The Relative Contributions of Stereo.” Lighting and Background Scenes in Promoting 3D Depth Visualization 1: 1–25.
- Imhof, E. 1967. “Shading and Shadows.” Cartographic Relief Representation 2007: 159–212.
- Kleffner, D. A., and V. S. Ramachandran. 1992. “On the Perception of Shape from Shading.” Perception & Psychophysics 52 (1): 18–36. http://www.ncbi.nlm.nih.gov/pubmed/1635855. doi: 10.3758/BF03206757
- Kruijff, E., J. E. Swan, and S. Feiner. 2010. “Perceptual Issues in Augmented Reality Revisited.” In 2010 IEEE International Symposium on mixed and Augmented Reality, 3–12. IEEE.
- Landy, M. S., L. T. Maloney, E. B. Johnston, and M. J. Young. 1995. Measurement and Modeling of Depth Cue 35 (3): 389–412.
- Liu, B., S. Gould, and D. Koller. 2010. “Single Image Depth Estimation from Predicted Semantic Labels.” 2010 IEEE Computer Society Conference on Computer Vision and Pattern Recognition 1253–1260. doi:10.1109/CVPR.2010.5539823.
- Liu, B., and J. T. Todd. 2004. “Perceptual Biases in the Interpretation of 3D Shape from Shading.” Vision Research 44 (18): 2135–2145. doi:10.1016/j.visres.2004.03.024.
- Lovell, P. G., M. Bloj, and J. M. Harris. 2012. “Optimal Integration of Shading and Binocular Disparity for Depth Perception.” Journal of Vision 12 (1): 1–1. doi:10.1167/12.1.1.
- Mamassian, P., and R. Goutcher. 2001. Prior Knowledge on the Illumination Position Brief Article Prior Knowledge on the Illumination Position 81: 1–9. doi:10.1016/S0010-0277(01)00116-0.
- Mehrabi, M., E. M. Peek, B. C. Wuensche, and C. Lutteroth. 2013. “Making 3D Work: A Classification of Visual Depth Cues, 3D Display Technologies and Their Applications.” Proceedings of the Fourteenth Australasian user Interface Conference, 139, 91–100.
- Morgenstern, Y., R. F. Murray, and L. R. Harris. 2011. “The Human Visual System’s Assumption That Light Comes from Above is Weak.” Proceedings of the National Academy of Sciences 108 (30): 12551–12553. doi:10.1073/pnas.1100794108.
- Polys, N. F., S. Kim, and D. A. Bowman. 2005. “Effects of Information Layout, Screen Size, and Field of View on User Performance in Information-Rich Virtual Environments.” Computer Animation and Virtual Worlds 18 (1): 19–38. doi: 10.1002/cav.159
- Řeřábek, M., L. Goldmann, J. S. Lee, and T. Ebrahimi. 2011. “Motion Parallax Based Restitution of 3D Images on Legacy Consumer Mobile Devices.” MMSP 2011 – IEEE International Workshop on Multimedia Signal Processing. doi:10.1109/MMSP.2011.6093789.
- Rogers, B., and M. Graham. 1979. “Motion Parallax as an Independent cue for Depth Perception.” Perception 38 (6): 125–134. doi:10.1068/p080125.
- Saraf, A. K., J. D. Das, B. Agarwal, and R. M. Sundaram. 1996. “False Topography Perception Phenomena and its Correction.” International Journal of Remote Sensing 17 (18): 3725–3733. doi:10.1080/01431169608949180.
- Saraf, A. K., P. Ghosh, B. Sarma, and S. Choudhury. 2005. “Development of a New Image Correction Technique to Remove False Topographic Perception Phenomena.” International Journal of Remote Sensing 26 (8): 1523–1529. doi:10.1080/0143116031000101648.
- Saraf, A., S. Sinha, P. Ghosh, and S. Choudhury. 2007. “A new Technique to Remove False Topographic Perception Phenomenon and Its Impacts in Image Interpretation.” International Journal of Remote Sensing 28 (5): 811–821. doi:10.1080/01431160701269796.
- Sun, J., and P. Perona. 1998. “Where Is the sun?” Nature Neuroscience, 183–184. doi:10.1038/630.
- Todd, J. T., and J. F. Norman. 2003. “The Visual Perception of 3-D Shape From Multiple Cues: Are Observers Capable of Perceiving Metric Structure?” Perception & Psychophysics 65 (1): 31–47. doi:10.3758/BF03194781.
- Uratani, K., T. Machida, K. Kiyokawa, and H. Takemura. 2005, March. “A Study of Depth Visualization Techniques for Virtual Annotations in Augmented Reality.” IEEE Proceedings. VR 2005. Virtual Reality, 2005, 295–296. IEEE.
- van Beurden, M. H., A. Kuijsters, and W. A. IJsselsteijn. 2010, June. “Performance of a Path Tracing Task Using Stereoscopic and Motion Based Depth Cues.” 2010 s International Workshop on quality of Multimedia experience (QoMEX), 176–181. IEEE. doi:10.1109/QOMEX.2010.5516268.
- Vezzani, S., P. Kramer, and P. Bressan. 2015. “Stereokinetic Effect, Kinetic Depth Effect, and Structure From Motion.” Oxford Handbook of Perceptual Organization, November 2015. doi:10.1093/oxfordhb/9780199686858.013.053.
- Vuong, Q. C., F. Domini, and C. Caudek. 2006. “Disparity and Shading Cues Cooperate for Surface Interpolation.” Perception 35 (2): 145–155. doi:10.1068/p5315.
- Westheimer, G. 2011. “Three-dimensional Displays and Stereo Vision.” Proceedings. Biological Sciences/The Royal Society 278 (1716): 2241–2248. doi:10.1098/rspb.2010.2777.
- Willett, W., B. Jenny, T. Isenberg, and P. Dragicevic. 2015. “Lightweight Relief Shearing for Enhanced Terrain Perception on Interactive Maps.” In Proceedings of the 33rd ACM Conference on human factors in Computing Systems (CHI 2015), 3563–3572. ACM. doi:10.1145/2702123.2702172.
- Wu, B., H. Li, and Y. Gao. 2013. “Investigation and Remediation of False Topographic Perception Phenomena Observed on Chang’E-1 Lunar Imagery.” Planetary and Space Science 75: 158–166. doi:10.1016/j.pss.2012.10.018.
- Zhang, W., C. Yue, and H. Yuan. 2016. “False Topographic Perception Phenomena Correction by Topographic Normalization Model.” In 2016 IEEE International Geoscience and Remote Sensing Symposium (IGARSS), 3013–3016. IEEE. doi:10.1109/IGARSS.2016.7729779.