
 ?Mathematical formulae have been encoded as MathML and are displayed in this HTML version using MathJax in order to improve their display. Uncheck the box to turn MathJax off. This feature requires Javascript. Click on a formula to zoom.
ABSTRACT
Flood visualization is an effective and intuitive tool for representing flood information from abstract spatiotemporal data. With the growing demand for flood disaster visualizations and mitigation, augmented flood visualizations that support decision makers’ perspectives are needed, which can be enhanced by emerging augmented reality (AR) and 3D printing technologies. This paper proposes an innovative flood AR visualization method based on a 3D-printed terrain model and investigates essential techniques, such as the suitable size calculation of the terrain models, the adaptive processing of flood data, and hybridizing virtual flood and terrain models. A prototype experimental system (PES) based on the proposed method and a comparison experimental system (CES) based on a virtual terrain are developed to conduct comparative experiments, which combine the system performance and questionnaire method to evaluate the efficiency and usability of the proposed method. The statistical results indicate that the method is useful for assisting participants in understanding the flood hazard and providing a more intuitive and realistic visual experience compared with that of the traditional AR flood visualization method. The frame rate is stable at 60 frames per second (FPS), which means that the proposed method is more efficient than the traditional AR flood visualization method.
1. Introduction
Flooding is a widespread natural hazard that severely threatens lives and property. The relevant government department and stakeholders are dedicated to taking various measures to mitigate damage caused by flooding. Flood hazard mitigation is a complicated process involving many natural, social and economic factors and, therefore, requires collaboration among participants from different domains (Piazza, Heller, and Fjeld Citation2009; Jonkman and Dawson Citation2012; Desportes, Waddell, and Hordijk Citation2016; Šašinka et al. Citation2019). However, participants with diverse academic backgrounds may have limited hydrological or map-reading skills. Therefore, it is crucial to find a feasible approach to ensure that all participants can understand the flooding process. Flood visualization utilizing graphical language to intuitively represent floods could convey useful information from abstract flood data (Liu et al. Citation2018). As an effective flood information expression tool, various forms of flood visualizations have been widely utilized in flood risk management, flood emergency management, and decision-making fields (Nóbrega et al. Citation2008; Seipel and Lim Citation2017; Di Salvo et al. Citation2018; Saha et al. Citation2018; Macchione et al. Citation2019). For instance, the EU asks all member countries to make flood disaster maps and risk maps (de Moel, van Alphen, and Aerts Citation2009). However, there is no universal or optimal approach by which to visualize floods (Pappenberger et al. Citation2013), which mainly depends on the purpose of flood visualization. In flood emergency management and decision making, the objective of flood visualization is to help participants from different backgrounds understand the flooding process intuitively and efficiently.
The information delivery capacity is an essential factor that affects the effectiveness of the expression of the flood. According to the visual representation dimensions of the carrier, flood visualizations can be divided into three categories: two-dimensional (2D) visualizations, screen-based three-dimensional (3D) visualizations, and stereoscopic 3D visualizations. 2D flood visualizations are mainly integrated with a geographic information system (GIS) or a hydrographic software platform as a graphical output component (Di Salvo et al. Citation2018), both of which are easy to implement and have high graphics-rendering efficiencies (Hadimlioglu and King Citation2019). However, the visualization effect is not intuitive and is not suitable for nonprofessional users due to poor topographic auxiliary information, so it is mainly used by experts for flood analysis (Lai et al. Citation2011). Screen-based 3D visualizations with lighting, textures, and animations can render a virtual, interactive 3D flood scene from different perspectives with the use of a keyboard and a mouse, and the flood effect is more intuitive and realistic than a 2D visualization (Zlatanova and Holweg Citation2004; Liang, Gong, and Li Citation2015; Herman, Russnák, and Řezník Citation2017; Macchione et al. Citation2019). However, due to the limitations of screen visualizations, screen-based 3D visualizations are essentially 2D projections of 3D scenes; thus, the distance and direction of the flood scene cannot be perceived intuitively, which could also result in increasing the mental workload of the viewer of the flood scene (Rase Citation2011; Boyce et al. Citation2019). In addition, it is inconvenient to interact with a 2D or 3D scene using a keyboard or mouse, which interrupts the continuity of the information retrieved from 3D flood scenes (Billinghurst and Kato Citation2002; MacEachren et al. Citation2004).
Virtual reality (VR) and augmented reality (AR) are new techniques for flood visualization that could provide a stereoscopic 3D visualization environment and a user-friendly interactive interface through natural body posture. VR flood visualizations are more intuitive and realistic than are screen-based 3D visualizations and involve more natural human–computer interactions (Philips et al. Citation2015; Chen and Lin Citation2018; Massaâbi et al. Citation2018). However, VR creates a totally immersive virtual environment isolating users from the real-world circumstances, which also impedes interactions with other users. AR flood visualization superimposes virtual flood scenes over the real environment; therefore, virtual floods and real environments could be observed synchronously, which could address the issue that exists in current VR flood visualizations.
AR is an intuitive visualization and interactive approach for geovisualization (Mathiesen et al. Citation2012; Ramos et al. Citation2018). Researchers have conducted studies on AR flood visualization. Haynes and Lange (Citation2016) proposed a mobile AR flood visualization application that was used by citizens to observe the inundation of floods in a real environment, and the researchers found that AR visualization could enhance the flood awareness of citizens who have limited map-reading experience. Mirauda et al. (Citation2017, Citation2018) developed a mobile AR platform prototype to monitor water resources, which improves the efficiency of field surveys and ‘helps them to move quickly within the critical areas during a flood event’. Soon after, the same team developed an AR flood management application to assist with flood field surveys, and the results show that AR flood visualizations can enhance the understanding of the relationship between floods and the environment and improve the awareness of flood risks. Haynes, Hehl-Lange, and Lange (Citation2018) presented a mobile AR flood visualization prototype for visualizing floods on-site in an outdoor environment, and the platform was used as a flood risk management (FRM) tool for water experts. However, for flood mitigation decision makers, it is crucial to observe the entire flood circumstances, which cannot be met by an on-site AR flood visualization.
The overall perspective of AR flood visualization involves overlaying the scaled-down virtual flood scene onto the real environment, which could provide a better visual perspective for flood mitigation or decision making. Hedley et al. (Citation2002) proposed an AR hybrid geovisualization interface that could be used for emergency management, and the virtual terrain model was superimposed onto a 2D digital map through a paper terrain marker. In the model, the texture changes when other categories of markers are close to the terrain markers, such as hydrographic or soil markers. In addition, some researchers have also used a projector to project river or flood textures onto a sandbox surface to represent the relationship between floods and the terrain (Vaughan, Vaughan, and Seeley Citation2017; Harmon et al. Citation2018), which could effectively improve the flood awareness of the participants (Kundu and Nawaz Citation2017). Although the above approaches are feasible to provide an overarching perspective on AR flood visualization, there are still some problems that need to be solved. First, rendering a fine-terrain model in a scene could dramatically increase the data volume to be rendered, which leads to a low frame rate and scene latency (Wang et al. Citation2018). Second, the sandbox approach could address the over-rendering issue, but it is a challenge to create an accurate sandbox model of the real environment, and the projected 2D texture on a 3D surface may be distorted. In this paper, we propose an innovative method for AR flood visualization based on a 3D-printed terrain model (Flood AR Visualization 3D Physical Terrain, FARV3DPT). The essential methods and technologies of its implementation are investigated, and based on this method, we developed a prototype system and conducted user experiments to validate the efficiency and usability of the proposed method. Our study is an attempt to expand the approaches to AR geovisualization to meet the interaction and visualization requirements of Digital Earth at the individual viewpoint and, finally, to achieve the examples in ‘digital earth examples of use in 2020’ (Craglia et al. Citation2012).
The remainder of this paper is as follows: section 2 introduces the principles and methodological framework of FARV3DPT, and some key methods are introduced in detail. In section 3, a prototype is implemented based on the methodological framework. Section 4 describes the experimental procedures and the analysis of the experimental results. Section 5 discusses the results. Finally, section 6 presents the conclusions of this study.
2. Methods
2.1. AR flood visualization principles
FARV3DPT superimposes the virtual flood scene onto a physical terrain model (PTM), which intuitively expresses the relationship of flood and terrain environment. Slocum et al. (Citation2001) investigated the key factors in designing an effective immersive geospatial virtual environment with immersion, interactivity, information intensity and intelligent objects. However, they focused on the principle of creating an entirely virtual geographical environment but did not consider the relationship between the virtual and real environments. In AR flood visualization, flooding and PTMs could both affect the perception and cognition of flood processes. Incorrect flood and PTM spatial relationships may cause cognitive confusion. Therefore, we propose the following visualization principles based on the characteristics of AR visualizations:
Accuracy: the virtual flood scene should be spatially superimposed onto a PTM accurately. A strict spatial correlation between the flood and the terrain is needed because an incorrect spatial correspondence may cause cognitive confusion related to the flood scene (e.g. if a flood was superimposed onto a ridge). Therefore, an accurate superimposition is the foundation of AR flood visualizations (FARV3DPT).
Occlusion: the occlusion relationship between a virtual flood and the PTM should be rendered correctly. When the viewpoint moves, the flood object should be occluded if it is behind the PTM, and otherwise, the PTM should be occluded by the flood.
High efficiency: to achieve a smooth flood visualization and interaction effect, the AR scene should be rendered efficiently. A low rendering rate leads to AR scene latency when viewpoint moves, which might result in motion sickness and uncomfortable users. Furthermore, a low frame rate could result in an interactive cursor latency with the gaze viewpoint, which could reduce the interaction efficiency.
Discernable: the flood object should be clearly contrasted with the PTM in the visual representation. In an AR flood visualization, users are more concerned about the information related to the flood disaster (e.g. the extent and depth) rather than the terrain, which is used as a background to assist in the understanding of the flood. Complicated real environmental structures (e.g. a terrain mode decorated with graduated colors or realistic textures) could increase the visual noise and reduce the efficacy of retrieving information from the visual scene.
2.2. FARV3DPT method framework
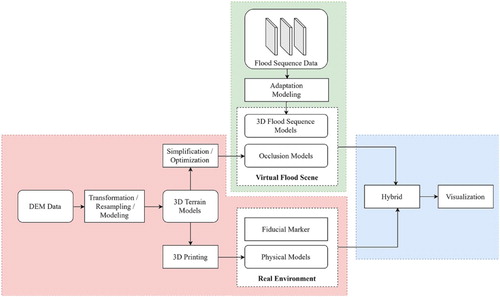
The objectives of FARV3DPT are to create a hybrid flood visualization environment that can accurately and effectively superimpose a virtual flood scene onto PTM and correctly express the occlusion between them. Based on both the objectives and the principle mentioned in section 2.1, we propose a methodological framework that describes the main procedures starting from the initial flood data to the flood visualization. The framework has three main parts:
Create 3D printable digital terrain models and occlusion models using digital elevation model (DEM) data (the red block);
Modify the initial flood data and create sequential 3D models of the flood and flood scenes (the green block);
Visualize the AR flood by merging the virtual flood scene and the PTMs using a fiducial marker (the blue block).
describes the main procedural flow of the FARV3DPT framework. Some key technology and methods of each procedure will be introduced in sections 2.2.1–2.2.3.
Figure 1. Methodological framework of FARV3DPT.
2.2.1. 3D-printed PTM creation
Physical topographic maps are a long-established cartography technology. The traditional process of making such a map is complicated and time consuming; thus, it is not widely adopted in cartography (Caldwell Citation2001). With the development of 3D printing, it takes only a few hours to print a 3D physical terrain map from the corresponding 3D digital model.
Calculate the suitable size of the PTM
Theoretically, the PTM could be any size by joining separately printed submodels: from small, handheld models to medium models that are fixed to the desktop, and even a real 1:1 scale model. The appropriate size depends on its application scenarios. In this paper, the PTM was used as a background environment to assist in flood visualization using an AR device. Therefore, the PTM size should match the field of view (FOV) and the interaction characteristics of the AR device.
The FOV is a crucial restriction factor of the PTM size. Currently, all commercial AR devices (e.g. HoloLens and Magic Leap) have a narrow FOV; therefore, the AR visualization is similar to a step-by-step scan of the real environment with a small window. Related research has suggested that a narrow FOV could reduce the efficiency of visual searches (Trepkowski et al. Citation2019) and could negatively influence spatial perception and cognition (Kruijff, Swan, and Feiner Citation2010; Sabelman and Lam Citation2015). For an AR flood visualization, it is crucial to retrieve the entire flood scene (including the PTM) from the AR display all at once. Thus, the suitable size of the PTM should be calculated according to the FOV of the AR device. In addition, if the PTM size exceeds the maximum-supported printing size of a 3D printer, the model can be divided into several subparts, which are printed separately and then spliced.
The AR camera is a standard perspective camera, as shown in . The dimensions of the FOV are determined by horizontal view angle α, the vertical view angle β, and the distance to the camera d.
Figure 2. Visual model of the AR camera. The green rectangle represents the maximum visual extent of the virtual scene at a distance d.
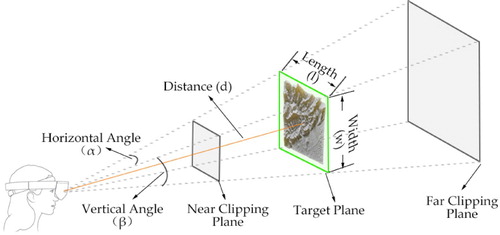
The maximum length (the horizontal direction) L and the maximum width (the vertical direction) W of the AR FOV for a distance d are calculated according to formulas (1) and (2), respectively.(1)
(1)
(2)
(2) To match the PTM with the size of the AR FOV, as noted in , the PTM’s length l ≤ L, width w ≤ W, and height h will be calculated according to the reduction ratio and the exaggeration coefficient denoted by the vertical exaggeration (VE) of the terrain data, which will be explained in section 2.2.2.
Create the 3D digital model of the PTM
Creating the corresponding digital model is the first step in making the PTM, which is similar to designing the digital map before printing a paper map. The PTM consists of three parts (): the terrain surface, the bounding box, and the base. The 3D digital model is typically created by utilizing DEM data according to parameters of the PTM and the 3D printer. The main steps are as follows:
Locate the geospatial extent of the flood zone and collect DEM data.
Determine the appropriate elevation exaggeration factor.
Figure 3. The structure of a 3D-printed digital terrain model. The red region represents the base, the green region represents the bounding box, and the yellow region represents the terrain surface.
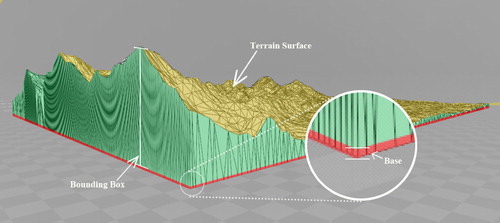
If the value domain of the elevation is much less than that of horizontal distance, the same horizontal and vertical model scale can lead to poor terrain details. To address this issue, a typical approach is to multiply the reduced scale by the VE and enhance the visual effects. The VE can be identified dynamically and is a balance between the visual effects and rationale rather than an optimal value.
Generate the vertices of the 3D model.
The 3D-printed terrain model can be generated from DEM data by utilizing the method proposed by Hasiuk et al. (Citation2017). The main procedure of the method is that first, the DEM data are projected to the Universal Transverse Mercator (UTM) coordinate system and the rasters are resampled. Then the vertices of the mesh are calculated according to the PTM’s length l, width w, vertical exaggeration coefficient VE and print resolution. Finally, the mesh is exported to a 3D printable model (e.g. an STL format file).
2.2.2. AR dynamic flood scene modeling
A dynamic flood scene is a virtual environment that can express the spatiotemporal flood process and provide a natural interaction interface through body motions. The flooding process is realistically simulated by comprehensively applying light, shadow, colors, and animations.
3D Flood modeling
The flood is loaded into the scene in the format of a 3D model object. It is a computationally intensive and time-consuming task to create a flood model from a very large set of points in real time, especially in an AR device with a relatively low computational capacity. Therefore, we created a series of offline flood model files that store the extent and depth information and an index file that stores the index of the flood model at different times.
Currently, not all 3D engines support directly parsing 3D files (e.g. FBX and OBJ files) into 3D models and loading them into the scene at runtime. In this paper, we designed a binary 3D file structure to store the 3D flood models. Thus, they can be implemented and parsed efficiently. The file has three main parts: vertex coordinates represented by the world coordinate system, a mesh index generated using the Delaunay algorithm, and vertex colors calculated using the flood depth.
Dispatch of flood sequence models
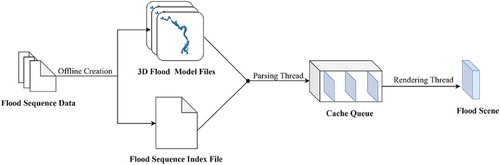
The flood model should be accessed and parsed quickly to meet the requirements of rendering a smooth flood diffusion process. There are two time-consuming procedures in the scene rendering: accessing the model file from a local disk or the net and parsing the file and generating a 3D mesh of the flood. We could read all the flood models into RAM and parse them before loading them into the scene; however, it might take a long time and much RAM usage to load and parse massive flood files all at once and may even be impossible considering the relative lower rendering capacity of current AR devices. Here, we designed a caching sequence architecture to optimize the rendering procedure. As shown in , the reading thread is responsible for reading and parsing the files into a flood model object and then caching them into a sequence. The rendering thread (main thread) asynchronously accesses the sequence to retrieve the flood models and then renders them.
Figure 4. The procedure of modeling and dispatching a flood.
2.2.3. Fusion of a virtual flood and a PTM
Flood data PTM-adapted processing procedure
Raw flood data are composed of a series of discrete points, which are typically represented by geographic coordinate or projected plane coordinate systems. The origin of both coordinate systems is related to a certain location in the real world. However, the AR flood scene is represented by a 3D Cartesian coordinate system, also known as the world coordinate system, which is a coordinate system unrelated to the real world. All these coordinate systems cannot be automatically transformed by the 3D engine; thus, the flood data cannot be directly utilized in the AR scene. In addition, both the horizontal and vertical scales of the raw data are different from those of the PTM. Therefore, the raw data should be processed in advance to match the requirements of the AR flood scene. The detailed processing procedures are as follows:
Coordinate transformation
If the data are represented in a geographic coordinate system, the flood data should be projected into a plane coordinate system using the UTM projection parameters consistent with the DEM. Then, the flood data should be overlaid with the DEM to retrieve the elevation. Finally, each flood point represented in (x, y, h, d) format, where x and y denote the planar location coordinates, h denotes the elevation, and d indicates the depth of the flood.
(2) Calculate the reduction ratio
The lower-left (southwest) corner O(x0, y0) of the study area is set as the coordinate origin, and the upper right (northeast) corner P(xmax, ymax) is set as the maximum coordinate. The minimal elevation is retrieved from the flood data and is denoted by h0. The reduction ratio is calculated in the length and width directions by formulas (3) and (4), respectively, which are denoted by Slength and Swidth.(3)
(3)
(4)
(4) Here, l and w are the length and width, respectively, of the PTM calculated in section 2.2.1. In general, the reduction ratios Slength and Swidth have the same value; therefore, we use Sh instead. Sv represents the reduction ratio in the vertical direction (elevation), considering the exaggeration coefficient VE. It can be calculated by formula (5).
(5)
(5)
(3) Retrieve the new coordinates of the flood
For the i-th point P(xi, yi, hi, di) of the flood data, the reduced coordinates P(x, y, h, d) that are relative to the origin O(x0, y0) and the minimal elevation h0 are calculated in formulas (6) to (9). It should be noted that the physical terrain has a base height, so the height h should be calculated by taking into account the base height Δh.(6)
(6)
(7)
(7)
(8)
(8)
(9)
(9)
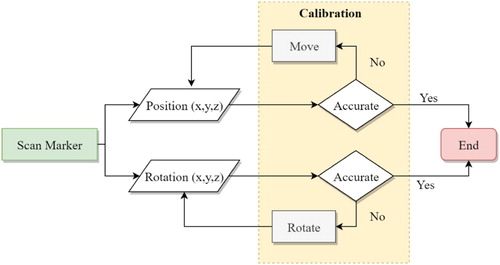
PTM location and calibration
The AR device should first recognize the PTM and retrieve the position and orientation relative to the virtual space before superimposing the virtual flood scene onto the PTM. Currently, it is challenging to recognize the PTM by computer vision directly through a camera; thus, we attach a fiducial marker at the bottom of the PTM to mark it. The fiducial marker is a quick response (QR) code-like AR tag that can be efficiently recognized by a camera. Fiducial markers are widely adopted in AR, one of which, with known size, can be used as an anchor to connect the virtual scene to the real environment. We can indirectly retrieve the accurate position and rotation of the PTM by recognizing the fiducial marker rather than the PTM itself. However, the recognition accuracy could be affected by the conditions of the real environment, such as variable lighting conditions, which could result in position or orientation errors and reduce the mixed accuracy. To address this issue, we add an interactive manual calibration procedure after automatically recognition by the camera ().
Occlusion in the visual representation
Figure 5. Procedure of registration and calibration.
It is crucial to represent the occlusion relationship between virtual flood scene and PTM because incorrect occlusion could cause cognitive confusion. Therefore, the virtual scene should dynamically detect the spatial structure of the PTM. There are two feasible means to accomplish this task: (1) reconstructing the spatial construction in real time by sensors in the AR device (e.g. simultaneous localization and mapping [SLAM]) and (2) utilizing a prefabricated geometry model as the environment structure. In this paper, the PTM is a relatively small object with a fine and complicated spatial structure. The accuracy of the environment reconstructed through AR device sensors cannot meet the requirement of occlusion calculations between the PTM and the virtual scene. Therefore, we adopt the second method, which utilizes the digital model of the PTM in the virtual scene to achieve accurate occlusion.
The PTM can provide fine topography background information in the visual representation, so we simplify the digital model mesh by reserving the main spatial construction to optimize the graphics rendering performance of the AR device. In addition, the mesh was only used for depth testing in the rendering pipeline to reduce the number of graphics computations.
3. Prototype system
3.1. Study area
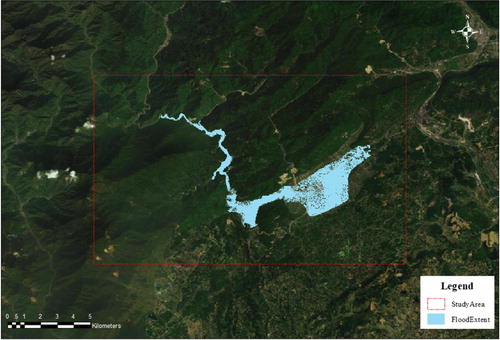
To verify the proposed method, we take a barrier lake dam-break scenario of Xiaojiaqiao as the study case. The barrier lake was formed by a landslide during the Wenchuan earthquake in 2008, which was located in Anxian District (31.62°N, 104.33°E), Sichuan Province, China. The study area was selected according to the simulated flood extent. As shown in , the study area is about 10.8 km by 7.3 km.
Figure 6. The study area.
3.2. Material and data
3.2.1. Flood data
In this paper, we utilized the cellular automata (CA) algorithm to simulate the flooding process caused by the Xiaojiaqiao barrier lake dam break (Li et al. Citation2013). The inputs of the CA algorithm include the hydrographic information (e.g. the depth and extent) and 10-meter resolution DEM data. The outputs are the flood data of the whole process, which is represented by a series of discrete point sets. Each point in one point set consists of position and depth information.
3.2.2. AR device
AR devices can be divided into handheld devices and helmet-mounted displays (HMD) according to their usage. Compared with a handheld AR device, such as a mobile smartphone, HMD AR supports stereoscopic vision and provides a natural seamless interaction interface through body and head actions. Furthermore, the use of HMD AR is hands free, which means that the users can continue to manipulate the other existing flood systems. Thus, HMD AR is more suitable for AR flood visualization than handheld devices. Microsoft HoloLens is currently the most powerful commercial HMD AR system. Wang et al. (Citation2018) evaluated the performance and effect of geovisualization using HoloLens, and the results show that HoloLens is an effective device for visualizing 3D spatial data. Thus, we chose HoloLens as our AR device for this paper.
3.2.3. 3D-printed terrain models
According to the FOV (30° by 17.5°) of HoloLens, the maximum visible extent in a real environment is calculated with the average observing distance by formula (1). In this paper, the average observing distance is chosen as 1 meter, which is convincing enough for the participant to touch the PTM to share the points of interest (POIs) with other participants, and the resulting maximum visible extent is 530 mm by 316 mm. Considering the maximum printing size limitation of our printer (200 mm by 200 mm), we designed a PTM size of 400 mm by 284 mm, which is slightly smaller than the maximum allowable size.
The PTM terrain 3D models were created from DEM data, in which a 1:50000 scale contour map with 10-m intervals was scanned, georeferenced to the UTM Zone 49 projection and WGS 1984 coordinate system and then digitized. The contour map (coded as H48E003010) was authorized and provided by the Sichuan Bureau of Surveying, Mapping and Geoinformation. Finally, a digital elevation model (DEM) with a 10-m resolution was generated with the ANUDEM interpolation algorithm in the ‘Topo to Raster tool’ in the default settings in ArcGIS software. The DEM was adequate for meeting the precision requirements of 3D terrain model reconstruction. As shown in , the PTM was divided into 4 submodels of the same size (approximately 200 mm by 142 mm) for separate printing.
Figure 7. (a) Digital terrain models consisting of 4 submodels for 3D printing, and (b) the physical terrain of the digital models printed by a 3D printer.
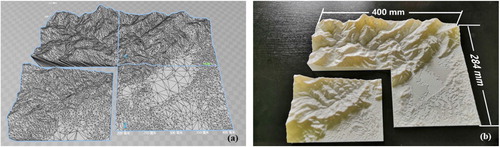
We used Allcct Yinke 200, a consumer-level fused deposition modelling (FDM)-type 3D printer, to fabricate the PTM from the digital model. The printing material of the PTM can directly affect the visualization effect. According to the principle of discernibility in section 2.1, we chose white polylactic acid (PLA) as the printing material, which does not interfere with the color of the virtual scene (b). Compared with most thermoplastic polymers, PLA is derived from renewable resources like corn starch or sugar cane, so it is an inexpensive, recyclable and environmentally friendly material.
3.3. System implementation
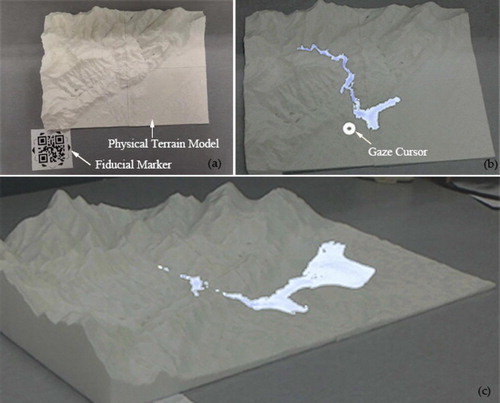
We designed and implemented the prototype system based on the framework described in section 2.2. The system mainly consists of two parts: hardware and software. The hardware includes the PTM and the fiducial marker (a), and the software is the AR flood scene application (b and c), which was developed using the Unity 3D game engine. The 3D flood models in the scene were generated from local storage files and were rendered asynchronously. Vuforia v2.3 was adopted as the AR engine to recognize the fiducial marker and to retrieve the position and location of the PTM. The AR engine was closed once the fiducial marker was recognized. MixedRealityToolkit-Unity 2019 was used to release the scene to a Visual Studio project, and finally, the project was compiled into a binary Universal Windows Platform (UWP) application by Visual Studio 2017 and then deployed on HoloLens.
Figure 8. (a) A fiducial marker is attached to the PTM. (b) The virtual flood scene is accurately superimposed onto the PTM, and (c) the flood is correctly occluded by the PTM when the viewpoint changes.
4. Experiments
Here, we validate the efficiency and usability of the proposed FARV3DPT approach. The following questions are answered in this section. (1) Is FARV3DPT an effective tool for assisting users in comprehending a flood disaster? (2) Is the mixed accuracy and occlusion relationship between the virtual flood scene and the PTM visually correct? (3) Is the visualization performance and effect better than the existing conventional AR flood visualization method? Thus, we conducted two experiments to answer the above questions. The first experiment is a visualization performance experiment, which collects performance parameters during system operation; the other experiment is a system usability experiment, which collects evaluation data in the form of a questionnaire.
4.1. Experimental systems
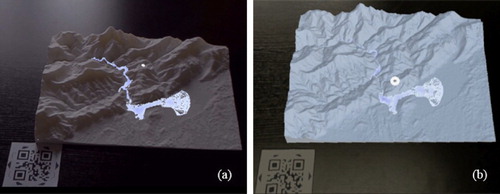
We utilized two systems to conduct the comparison experiments. The first system is the prototype experiment system (PES), which is implemented in section 3. The other system is a comparison experiment system (CES), which is a typical, traditional AR flood visualization approach that takes the flood and the terrain as an integrative virtual scene object. As shown in (a) and (b), the unique differences between the CES and the PES is the terrain model, which was replaced by a 3D digital model in the CES. The other functions and configurations of both systems are exactly identical, such as the light conditions and the data accessing and rendering procedures.
Figure 9. Visualization effect of (a) the PES and (b) the CES.
4.2. System performance experiment
The objective of the performance experiment is to quantitatively evaluate the performance of the PES and the CES by recording the performance parameters, including the frame rate (in frames per second, FPS) and graphics processing unit (GPU) usage. We used the same HoloLens AR device to run both systems to avoid the influence factors from a different device. The parameters were retrieved through a Windows device portal provided by HoloLens rather than recorded by the experimental systems, as an extra, irrelevant function could also affect the accuracy of the collected performance data.
4.3. System usability experiment
4.3.1. Questionnaire
The questionnaire was used to evaluate user experience after using the systems. The flood visualization usability and effect evaluation belong to the subjective feelings of participants that cannot be quantitatively evaluated from system parameters. The Post-Study System Usability Questionnaire (PSSUQ) is a standard questionnaire that has been widely used to evaluate the perceived satisfaction with a software system after use (Sauro and Lewis Citation2016). In this paper, we designed a questionnaire based on the design principle of the PSSUQ. As shown in , the questionnaire comprises six questions, and each question is scored in the range of 1–7 points. It should be noted that the score and the satisfaction level of the questionnaire are negatively correlated in the PSSUQ, which means that a low score indicates a high degree of satisfaction. In our questionnaire, a 1 denotes strong agreement, a 7 denotes strong disagreement, and a 4 denotes a neutral opinion.
Table 1. List of questions in the questionnaire.
4.3.2. Procedure
We recruited 34 participants (aged between 21 and 33 years old) to participate in this study, who were GIS postgraduates at Hebei Normal University and undergraduates of surveying and mapping at Hebei Vocational College of Rail Transportation. All individuals had 2D map-reading experience, and 4 had engaged in flood disaster-related projects. None had previous experience using any HMD AR system. The 34 participants were randomly assigned to one of two groups: group A and group B. The experimental environment was in a laboratory with closed curtains and lighting provided by a fluorescent lamp. To maintain the same lighting conditions with the virtual flood scene, the PTM was placed directly below the lamp to simulate a 90° illumination angle in a real-world circumstance. The experimental device was HoloLens AR glasses, and all other applications were closed before running the PES and the CES.
Considering that none of the participants had used a HoloLens or AR applications previously, we employed 2 assistants to help the participants during the experiment. Each participant needed to experience both the PES and the CES sequentially. To avoid the influence of the sequence on the experimental results, group A and group B utilized the systems in the opposite order. In our case, the participants in group A first experienced the PES, and then the CES; for the participants in group B, the order was reversed. To avoid the impact of the questionnaire content on the results, the questionnaire was not given to the participants until both systems were experienced. Taking group A as an example, the detailed procedure of the experiment is as follows:
The assistants helped a participant put on the AR device and instructed them in how to manipulate the system;
The participants first experienced the PES;
The participants then experienced the CES after finishing step (2);
The participants received two questionnaires, one for each system and scored all the questions from 1 to 7;
The procedure for group B is the same as those above except step (2) and step (3) were switched.
4.4. Results
We retrieved all 68 questionnaires (34 for each system) after the experiment and identified 60 valid questionnaires after validation. Then, we calculated the average score for each question for both systems, which was used as the baseline data for further statistical analysis.
As shown in , all the average scores from the questionnaires for both systems are less than 4 (the neutral point), and the scores for the PES are less than those for the CES, except the Q5 score.
Figure 10. The average scores for the six questions concerning the PES and the CES.
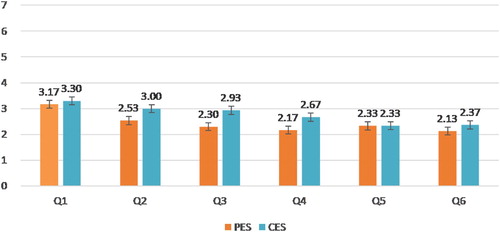
In our PSSUQ-like questionnaire, the scores range from 1 to 7, the middle score 4 represents a neutral point, which means that the participant has no attitude; a score less than 4 means that the participant agrees with the premise of the question. To validate whether the scores of the PES are statistically significantly less than 4 points, we used 4 points as the test value and conducted a one-sample t-test; the results are shown in .
Table 2. Statistical test scale of the PES usability validation.
To validate whether the mean difference between the PES and the CES is statistically significant, we conducted a paired-samples t-test. The results are shown in .
Table 3. Statistical test scale of the usability comparison between the PES and the CES.
5. Discussion
5.1. FARV3DPT applicability
To validate whether FARV3DPT is an effective method to represent flood information, Q1, Q2 and Q3 of the PES were selected as the evaluating indicators. According to the results of the hypothesis test in , FARV3DPT is an effective method to help participants understand the flood hazard (Q1, MD = −0.83, p < 0.05), the virtual flood looks visually realistic (Q2, MD = −1.47, p < 0.001), and flood scenes, including the flood and the PTM, could be comprehended intuitively (Q3, MD = −1.70, p < 0.001).
The registration accuracy and occlusion relationship between flooding and PTM are fundamental to FARV3DPT. In , the results of Q5 (MD = −1.67, p < 0.001) and Q6 (MD = −1.87, p < 0.001) show that the mixed position and occlusion are correct, and the results in show that there is no significant difference in Q5 (MD = 0, p > 0.05) and Q6 (MD = −0.23, p > 0.05) between the PES and the CES, which also indicates that the relationship is correct. In the CES, the relationship is always correct and does not change because the virtual flood and virtual terrain are correspondingly rendered.
5.2. Advantage analysis
Visualization efficiency
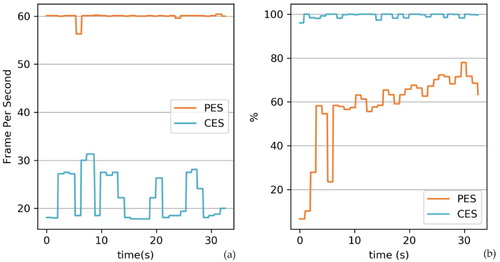
The frame rate and GPU utilization were adopted to evaluate the visualization efficiency of PES and CES. As shown in (a), the frame rate of the PES (orange curve) is stable at 60 FPS, which is the maximum frame rate supported by HoloLens. However, the average frame rate of the CES (blue curve) is approximately 22 FPS, which is much lower than that of the PES. In contrast, in (b), the GPU utilization of the CES, represented by the blue curve, is higher than that of the PES, represented by the orange curve. In summary, the PES could maintain a higher frame rate with lower GPU utilization than the CES, which indicates that flood AR visualization with the PTM has a distinct advantage in the visualization efficiency compared with that with a virtual terrain.
(2) Visualization effect
Figure 11. Test of the system performance differences between the PES and the CES on (a) the frame rate and (b) GPU usage.
The above statistical analyses indicate that the PES is an intuitive and efficient method for flood visualization. To evaluate the visualization effect of the PES, we selected Q2, Q3, and Q4 as the evaluating indicators to investigate where statistically significant differences exist in those questions between the PES and the CES. As shown in , the virtual flood is more realistic in the PES than in the CES (Q2, MD = −0.47, p < 0.05), and the flood scene (including physical terrain or virtual terrain) is more intuitive (Q3, MD = −0.63, p < 0.05) in the PES than in the CES, which indicates that the PES has a significant advantage in the visualization effect over the CES. Additionally, the terrain model is important background information, which assists the participant in comprehensively understanding the position and extent of flooding intuitively and correctly. The statistical result of Q4 (MD = −0.5, p < 0.05) indicates that the PTM can provide a better spatial reference than the virtual terrain, which suggests that the PTM has a positive effect in flood visualization.
In summary, the statistical results show that the FARV3DPT method is better for the visual expression of flood scenes compared to the traditional AR geovisualization method. However, there may be some possible limitations in this study. Considering that none of the participants had previous HMD AR device experience and that the interactive metaphor of HoloLens is so different from traditional keyboard and mouse interaction, since our main goal is to evaluate the visual effect of the proposed method, practical spatial task experiments that required accurate human–computer interaction were not considered in this study. Only subjective user evaluation data was collected from the questionnaires, which was only related to observations. Task-based quantitative experiment data, such as the finishing time and location accuracy, could be more accurate for evaluating the proposed method. Fortunately, with the further development of AR capacity, the newly released HoloLens 2 device supports natural-gesture interaction and eye tracking, which makes it feasible to collect more quantitative data on human actions to support the task-based experiments.
6. Conclusions
In this paper, we proposed an innovative flood AR visualization method, FARV3DPT, which can provide an intuitive and efficient 3D flood visualization and interactive environment for stakeholders, especially those with limited hydrographic knowledge and map-reading skills. We investigated the key methods and techniques of the implementation of the proposed approach and developed a prototype (PES) to validate the effectiveness of the methods through two experiments.
In our experiments, subjective user data was collected and analyzed for system usability evaluation, which, to some extent, proved that the proposed method can provide a more intuitive and efficient environment in which to understand flood hazards. Some conclusions drawn from our experiments can be more reliable, such as the occlusion relationship between the PTM and virtual flood scene and the system efficiency obtained from the frame rate statistics. In follow-up research, experiments including practical spatial tasks should be performed to gain more insight into how the FARV3DPT method can assist policy-makers in real flood incidents, and more quantitative physiological indicators such as eye movement can also be considered in the evaluation.
FARV3DPT is a versatile method for AR geovisualization that is suitable for not just flood visualization. Geovisualization in other domains could benefit from our research. The method supports any spatiotemporal data with position coordinates, such as traffic flow data, trajectory data, and traditional point, polyline, and polygon data. Moreover, the method is not bound to a particular AR device. Other HMD AR systems, such as Magic Leap and even a low-cost Cardboard AR viewer, could also be adopted as the visualization display. These characteristics ensure that FARV3DPT is a promising and feasible AR geovisualization method.
Acknowledgements
The authors would like to thank all participants in the experiment and the editor and anonymous reviewers for their careful reading and constructive suggestions. We also want to thank the Sichuan Bureau of Surveying, Mapping and Geoinformation for providing the paper contour map.
Disclosure statement
No potential conflict of interest was reported by the authors.
Additional information
Funding
Related Research Data
References
- Billinghurst, Mark, and Hirokazu Kato. 2002. “Collaborative Augmented Reality.” Communications of the ACM 45 (7): 64–70. doi: 10.1145/514236.514265
- Boyce, Michael W., Charles P. Rowan, Paul L. Shorter, Jason D. Moss, Charles R. Amburn, Christopher J. Garneau, and Robert A. Sottilare. 2019. “The Impact of Surface Projection on Military Tactics Comprehension.” Military Psychology 31 (1): 45–59. doi: 10.1080/08995605.2018.1529487
- Caldwell, Douglas R. 2001. “Physical Terrain Modeling for Geographic Visualization.” Cartographic Perspectives 38: 66–72. doi: 10.14714/CP38.795
- Chen, Min, and Hui Lin. 2018. “Virtual Geographic Environments (VGEs): Originating from or Beyond Virtual Reality (VR)?” International Journal of Digital Earth 11 (4): 329–333. doi:10.1080/17538947.2017.1419452.
- Craglia, Max, Kees de Bie, Davina Jackson, Martino Pesaresi, Gábor Remetey-Fülöpp, Changlin Wang, Alessandro Annoni, Ling Bian, Fred Campbell, and Manfred Ehlers. 2012. “Digital Earth 2020: Towards the Vision for the Next Decade.” International Journal of Digital Earth 5 (1): 4–21. doi: 10.1080/17538947.2011.638500
- de Moel, H., J. van Alphen, and J. C. J. H. Aerts. 2009. “Flood Maps in Europe-Methods, Availability and Use.” Natural Hazards and Earth System Sciences 9 (2): 289–301. doi: 10.5194/nhess-9-289-2009
- Desportes, I., J. Waddell, and M. Hordijk. 2016. “Improving Flood Risk Governance Through Multi-Stakeholder Collaboration: A Case Study of Sweet Home Informal Settlement, Cape Town.” South African Geographical Journal 98 (1): 61–83. doi: 10.1080/03736245.2015.1052842
- Di Salvo, Cristina, Francesco Pennica, Giancarlo Ciotoli, and Gian Paolo Cavinato. 2018. “A GIS-Based Procedure for Preliminary Mapping of Pluvial Flood Risk at Metropolitan Scale.” Environmental Modelling & Software 107: 64–84. doi: 10.1016/j.envsoft.2018.05.020
- Hadimlioglu, I. Alihan, and Scott A. King. 2019. “Visualization of Flooding Using Adaptive Spatial Resolution.” ISPRS International Journal of Geo-Information 8 (5): 204. doi: 10.3390/ijgi8050204
- Harmon, Brendan A., Anna Petrasova, Vaclav Petras, Helena Mitasova, and Ross Meentemeyer. 2018. “Tangible Topographic Modeling for Landscape Architects.” International Journal of Architectural Computing 16 (1): 4–21. doi: 10.1177/1478077117749959
- Hasiuk, Franciszek J., Chris Harding, Alex Raymond Renner, and Eliot Winer. 2017. “TouchTerrain: A Simple Web-Tool for Creating 3D-Printable Topographic Models.” Computers & Geosciences 109: 25–31. doi: 10.1016/j.cageo.2017.07.005
- Haynes, Paul, Sigrid Hehl-Lange, and Eckart Lange. 2018. “Mobile Augmented Reality for Flood Visualisation.” Environmental Modelling & Software 109: 380–389. doi: 10.1016/j.envsoft.2018.05.012
- Haynes, Paul, and Eckart Lange. 2016. “Mobile Augmented Reality for Flood Visualisation in Urban Riverside Landscapes.” JoDLA–Journal of Digital Landscape Architecture 1: 254–262.
- Hedley, Nicholas R., Mark Billinghurst, Lori Postner, Richard May, and Hirokazu Kato. 2002. “Explorations in the Use of Augmented Reality for Geographic Visualization.” Presence: Teleoperators and Virtual Environments 11 (2): 119–133. doi: 10.1162/1054746021470577
- Herman, Lukáš, Jan Russnák, and Tomáš Řezník. 2017. “Flood Modelling and Visualizations of Floods Through 3D Open Data.” Paper presented at the International Symposium on Environmental Software Systems.
- Jonkman, Sebastiaan N., and Richard J. Dawson. 2012. “Issues and Challenges in Flood Risk Management—Editorial for the Special Issue on Flood Risk Management.” Water 4 (4): 785–792. doi: 10.3390/w4040785
- Kruijff, Ernst, J. Edward Swan, and Steven Feiner. 2010. “Perceptual Issues in Augmented Reality Revisited.” Paper presented at the 2010 IEEE International Symposium on Mixed and Augmented Reality.
- Kundu, S. N., and Muhammad Nawaz. 2017. “Geospatial Risk Communication and Visualization of Natural Hazards Using Augmented Reality Constructs.” Paper presented at the Global Civil Engineering Conference.
- Lai, Jihn-Sung, Wen-Yi Chang, Ying-Chieh Chan, Shih-Chung Kang, and Yih-Chi Tan. 2011. “Development of a 3D Virtual Environment for Improving Public Participation: Case Study – The Yuansantze Flood Diversion Works Project.” Advanced Engineering Informatics 25 (2): 208–223. doi: 10.1016/j.aei.2010.05.008
- Li, Yi, Jianhua Gong, Jun Zhu, Yiquan Song, Ya Hu, and Lei Ye. 2013. “Spatiotemporal Simulation and Risk Analysis of Dam-Break Flooding Based on Cellular Automata.” International Journal of Geographical Information Science 27 (10): 2043–2059. doi: 10.1080/13658816.2013.786081
- Liang, Jianming, Jianhua Gong, and Yi Li. 2015. “Realistic Rendering for Physically Based Shallow Water Simulation in Virtual Geographic Environments (VGEs).” Annals of GIS 21 (4): 301–312. doi: 10.1080/19475683.2015.1050064
- Liu, X. J., D. H. Zhong, D. W. Tong, Z. Y. Zhou, X. F. Ao, and W. Q. Li. 2018. “Dynamic Visualisation of Storm Surge Flood Routing Based on Three-Dimensional Numerical Simulation.” Journal of Flood Risk Management 11: S729–SS49. doi: 10.1111/jfr3.12252
- Macchione, Francesco, Pierfranco Costabile, Carmelina Costanzo, and Rosa De Santis. 2019. “Moving to 3-D Flood Hazard Maps for Enhancing Risk Communication.” Environmental Modelling & Software 111: 510–522. doi: 10.1016/j.envsoft.2018.11.005
- MacEachren, Alan M., Mark Gahegan, William Pike, Isaac Brewer, Guoray Cai, Eugene Lengerich, and F. Hardistry. 2004. “Geovisualization for Knowledge Construction and Decision Support.” IEEE Computer Graphics and Applications 24 (1): 13–17. doi: 10.1109/MCG.2004.1255801
- Massaâbi, Marwa, Olfa Layouni, Wided Ben Moussa Oueslati, and Fahad Alahmari. 2018. “An Immersive System for 3D Floods Visualization and Analysis.” Paper presented at the International Conference on Immersive Learning.
- Mathiesen, Dylan, Trina Myers, Ian Atkinson, and Jarrod Trevathan. 2012. “Geological Visualisation with Augmented Reality.” Paper presented at the 2012 15th International Conference on Network-Based Information Systems.
- Mirauda, Domenica, Ugo Erra, Roberto Agatiello, and Marco Cerverizzo. 2017. “Applications of Mobile Augmented Reality to Water Resources Management.” Water 9 (9): 699. doi: 10.3390/w9090699
- Mirauda, Domenica, Ugo Erra, Roberto Agatiello, and Marco Cerverizzo. 2018. “Mobile Augmented Reality for Flood Events Management.” Water Studies 47: 418–424.
- Nóbrega, Rui, André Sabino, Armanda Rodrigues, and Nuno Correia. 2008. “Flood Emergency Interaction and Visualization System.” Paper presented at the International Conference on Advances in Visual Information Systems.
- Pappenberger, Florian, Elisabeth Stephens, Jutta Thielen, Peter Salamon, David Demeritt, Schalk Jan Van Andel, Fredrik Wetterhall, and Lorenzo Alfieri. 2013. “Visualizing Probabilistic Flood Forecast Information: Expert Preferences and Perceptions of Best Practice in Uncertainty Communication.” Hydrological Processes 27 (1): 132–146. doi: 10.1002/hyp.9253
- Philips, Andrea, Ariane Walz, Andreas Bergner, Thomas Graeff, Maik Heistermann, Sarah Kienzler, Oliver Korup, Torsten Lipp, Wolfgang Schwanghart, and Gerold Zeilinger. 2015. “Immersive 3D Geovisualization in Higher Education.” Journal of Geography in Higher Education 39 (3): 437–449. doi: 10.1080/03098265.2015.1066314
- Piazza, Tommaso, Hannes Heller, and Morten Fjeld. 2009. “Cermit: Co-Located and Remote Collaborative System for Emergency Response Management.” Proc. SIGRAD, 12–20.
- Ramos, Francisco, Sergio Trilles, Joaquín Torres-Sospedra, and Francisco Perales. 2018. “New Trends in Using Augmented Reality Apps for Smart City Contexts.” ISPRS International Journal of Geo-Information 7 (12): 478. doi: 10.3390/ijgi7120478
- Rase, Wolf-Dieter. 2011. “Creating Physical 3D Maps Using Rapid Prototyping Techniques.” In True-3D in Cartography, edited by Manfred Buchroithner, 119–134. Heidelberg, Berlin, Germany: Springer.
- Sabelman, Eric E., and Roger Lam. 2015. “The Real-Life Dangers of Augmented Reality.” IEEE Spectrum 52 (7): 48–53. doi: 10.1109/MSPEC.2015.7131695
- Saha, Sudipto, Shashank Shekhar, Sounak Sadhukhan, and Prasun Das. 2018. “An Analytics Dashboard Visualization for Flood Decision Support System.” Journal of Visualization 21 (2): 295–307. doi: 10.1007/s12650-017-0453-3
- Šašinka, Čeněk, Zdeněk Stachoň, Michal Sedlák, Jiří Chmelík, Lukáš Herman, Petr Kubíček, Alžběta Šašinková, Milan Doležal, Hynek Tejkl, and Tomáš Urbánek. 2019. “Collaborative Immersive Virtual Environments for Education in Geography.” ISPRS International Journal of Geo-Information 8 (1): 3. doi: 10.3390/ijgi8010003
- Sauro, Jeff, and James R. Lewis. 2016. Quantifying the User Experience: Practical Statistics for User Research. Cambridge, Massachusetts, United States: Morgan Kaufmann.
- Seipel, Stefan, and Nancy Joy Lim. 2017. “Color Map Design for Visualization in Flood Risk Assessment.” International Journal of Geographical Information Science 31 (11): 2286–2309. doi: 10.1080/13658816.2017.1349318
- Slocum, Terry A., Connie Blok, Bin Jiang, Alexandra Koussoulakou, Daniel R. Montello, Sven Fuhrmann, and Nicholas R. Hedley. 2001. “Cognitive and Usability Issues in Geovisualization.” Cartography and Geographic Information Science 28 (1): 61–75. doi: 10.1559/152304001782173998
- Trepkowski, Christina, David Eibich, Jens Maiero, Alexander Marquardt, Ernst Kruijff, and Steven K. Feiner. 2019. “The Effect of Narrow Field of View and Information Density on Visual Search Performance in Augmented Reality.” Paper presented at the IEEE VR 2019: the 26th IEEE Conference on Virtual Reality and 3D User Interfaces, Osaka, Japan.
- Vaughan, Karen L., Robert E. Vaughan, and Janel M. Seeley. 2017. “Experiential Learning in Soil Science: Use of an Augmented Reality Sandbox.” Natural Sciences Education 46 (1). doi:10.4195/nse2017.09.0021 doi: 10.4195/nse2016.11.0031
- Wang, Wei, Xingxing Wu, Guanchen Chen, and Zeqiang Chen. 2018. “Holo3DGIS: Leveraging Microsoft HoloLens in 3D Geographic Information.” ISPRS International Journal of Geo-Information 7 (2): 60–76. doi: 10.3390/ijgi7020060
- Zlatanova, Siyka, and Daniel Holweg. 2004. “3D Geo-Information in Emergency Response: A Framework.” Paper presented at the Proceedings of the 4th International Symposium on Mobile Mapping Technology (MMT’2004), March.