
ABSTRACT
Maps based on virtual reality (VR) are evolving and are being increasingly used in the field of geography. However, the advantages of VR based on the map use processes of users over desktop-based environments (DEs) are not fully understood. In this study, an experiment was conducted in which 120 participants performed map use tasks using maps and globes in VR and DE. The participants’ eye movements and questionnaires were collected to compare the map use performance differences. We analyzed the general metrics, information searching and processing metrics of participants (e.g. response time, RT; average fixation duration, AFD; average saccade duration, ASD; saccade frequency, SF, etc.) using maps and globes in different environments. We found that the participants using VR processed information more efficiently (AFDDE = 233.34 ms, AFDVR = 173.09 ms), and the participants using DE had both a significantly shorter response time (RTDE = 88.68 s, RTVR = 124.05 s) and a shorter visual search time (ASDDE = 60.78 ms, ASDVR = 112.13 ms; SFDE = 6.30, SFVR = 2.07). We also found similarities in accuracy, satisfaction and readability. These results are helpful for designing VR maps that can adapt to human cognition and reflect the advantages of VR.
1. Introduction
In recent years, virtual reality (VR; e.g. head-mounted displays) technology has been popularized in various geographical fields, such as geovisualization (Stojšić et al. Citation2016; Hruby, Ressl, and de la Borbolla del Valle Citation2019), spatial cognition (Schrom-Feiertag, Settgast, and Seer Citation2017; Carbonell-Carrera and Saorin Citation2017), environmental simulation (Lütjens et al. Citation2019), geography education (Lisichenko Citation2015) and field research (Zhao et al. Citation2018). Because it offers a highly realistic experience and immersive interactions, VR can effectively simulate real environments (Hruby, Ressl, and de la Borbolla del Valle Citation2019; Stojšić et al. Citation2016). Some researchers believe that, compared with traditional desktop-based environments (DEs), VR can facilitate the process of geographic information communication and lead to better user performance because the former are based on common screens, mice and keyboards as input/output devices (Renner, Velichkovsky, and Helmert Citation2014; Zhao et al. Citation2018).
As the two types most commonly used to express geographical information, maps and globes have been created in DEs for many map use studies (Popelka and Dolezalova Citation2016; Alaçam and Dalcı Citation2009; Ooms et al. Citation2012). These map use studies have concluded that many factors—such as different map types (Battersby and Montello Citation2009), symbol representations (Garlandini and Fabrikant Citation2009), and map use tasks (Koua, MacEachren, and Kraak Citation2006)—can impact map use processes. Although some studies have been conducted on the above factors in 2D and 3D environments (Carbonell-Carrera, Jaeger, and Shipley Citation2018; Carbonell-Carrera et al. Citation2017), the different effects of DEs and VR on map use processes remain to be discussed and studied.
In this article, we present a user study comparing map use performance in VR and a DE. We designed a two-factorial (VR/DE x maps/globes) experiment and recruited participants to complete a series of map use tasks in either VR or a DE. The participants’ eye movement data and questionnaire responses were collected in the experiment (described in Section 3). By quantitatively analyzing the participants’ accuracy, response time, eye-movement metrics and questionnaire results (described in Section 4), we discuss the benefits and drawbacks of both environments in relation to the different representation types and map use tasks (described in Section 5). Finally, we end the article with concluding remarks (Section 6).
2. Related works
2.1. Immersive virtual environments and desktop-based environments in map use studies
Before the advent of immersive VR devices, DEs were the platforms used for most electronic maps, including maps and globes. Although such desktop-based maps have been assessed in many map use studies, the influence of such platforms was not questioned. Instead, the elements and features of the maps have tended to vary across map use studies. For example, regarding the background color, research conducted by Deeb et al. (Citation2015) indicated that the design of map labels should not be influenced by the map's background color. Regarding labels, Liao et al. (Citation2019) concluded that an increase in a map’s label density could reduce the use performance of users. Regarding map projections, Šavrič et al. (Citation2015) compared the effects of different projections on the map use performance of users, and Robinson projections were the most preferred and effective. Regarding representation types, Popelka and Dolezalova (Citation2016) researched use performance differences based on the point features of maps and globes, and the results showed that the determination of the point feature size on globes was slower than that on maps. Different map use tasks have a significant influence on map use performance (Koua, MacEachren, and Kraak Citation2006), such as the use strategy and task order. In addition, interactions have become increasingly important since interactive maps have become popular. Some map use studies have involved analyses of interactive processes (Manson et al. Citation2012; Wisniewski et al. Citation2009). The conclusions of the abovementioned studies are credible under a DE.
With the development of VR technology, map applications based on VR have emerged. For example, Herman, Kvarda, and Stachoň (Citation2018) built the Carthoreality Map Room in VR for students to learn cartography. Šašinka et al. (Citation2019) used collaborative VR devices to teach the principle of contours. In the abovementioned applications, maps in VR have unique advantages, such as the suitability of three-dimensional maps (Hruby, Ressl, and de la Borbolla del Valle Citation2019) or user interest in use maps (Šašinka et al. Citation2019). However, from another perspective, new questions have emerged from map use studies in VR.
The first question is whether the conclusions drawn using DEs are valid when using VR. Yang et al. (Citation2018) conducted a research in this field and focused on comparative studies of map use in VR. These authors compared map and globe use performance in VR and found that exocentric globes were the most effective visualization method. In subsequent studies, Yang et al. (Citation2019) further compared performance differences under different origin-destination (OD) flow map representations in VR. The authors found that 3D flows on maps were most effective for expressing information. Additionally, research on the effects of maps in VR is ongoing. Carbonell-Carrera and Saorín (Citation2017) used questionnaires to assess map use performance related to spatial training in VR and found that maps in VR could promote the acquisition of spatial knowledge.
The second question is how map use performance in VR differs from that in DEs. To date, the answers to this question have been only speculative. On the one hand, most articles have a positive opinion regarding maps in VR. Cummings and Bailenson (Citation2016) believed that increased immersion, which is defined as the technical quality of VR, could model the real world more precisely and provide more realism to the user than could methods in DEs. Hruby, Ressl, and de la Borbolla del Valle (Citation2019) concluded that maps in VR are more consistent with the Gore (Citation1998) concept of future geovisualization than maps in DEs because VR can overcome the shortcomings of 3D reductions on 2D computer displays. On the other hand, negative results have also been reported. Huang and Chen (Citation2019) noted the shortcomings of the current globes in VR related to interactions. Empirical comparative studies still need to be conducted on this topic. Therefore, this article mainly focuses on an empirical comparison of user map use performance in different environments to explore the reasons for these differences.
2.2. Methods used to evaluate map use performance
Over the last century, Nielsen (Citation1994) introduced three metrics—effectiveness (accuracy), efficiency (response time) and satisfaction with usability engineering—to evaluate map use performance. Slocum et al. (Citation2001) summarized the cognition and usability of maps on a theoretical level and believed that map use performance differs in specific tasks. Subsequently, researchers began to compare map use performance differences across different variables based on the abovementioned methods and theories. Such studies included different background colors (Deeb et al. Citation2015), map tasks (Koua, MacEachren, and Kraak Citation2006) and map applications (Skarlatidou and Haklay Citation2006). Such methods could help researchers draw conclusions based on the results; however, these studies ignored the process of map use.
In addition, other research methods have been used. Questionnaires represent the most common method used to compare differences in map use studies, especially those using map evaluations (Kerkovits and Szigeti Citation2018; Šavrič et al. Citation2015). Similar to questionnaires, the Likert Scale has been used to assess the processes involved when participants use maps from multiple dimensions (Carbonell-Carrera, Jaeger, and Shipley Citation2018). Another method is the think-aloud protocol. Gołębiowska (Citation2015) used the think-aloud protocol to study the effect of the legend layout on the usability of thematic maps, and De Roo, Bourgeois, and De Maeyer (Citation2017) used the think-aloud protocol to verify the usability of a globe-based archeological application. This method can record the map use process effectively but may distract the participant (Donker and Markopoulos Citation2002; Çöltekin et al. Citation2009). User logging is a useful method for analyzing the use performance of interactive maps (Kubíček et al. Citation2019; Herman, Juřík, et al. Citation2018). From collect logging using the mouse and keyboard, researchers can learn the map use processes reflected in behavior. Additionally, Schnur, Bektaş, and Çöltekin (Citation2018) used mathematical models to compare map complexity differences among three types of web maps.
Eye tracking is a direct method used to study map use performance (Ooms, De Maeyer, and Fack Citation2010). Çöltekin et al. (Citation2009) integrated eye tracking and a traditional usability assessment into map use research; subsequently, eye tracking has been applied to studies researching the use of different map types. These studies include enhanced imagery evaluation (Dong et al. Citation2014), evaluations of the size and color of the text on maps (Brychtova and Coltekin Citation2016), comparisons of 3D maps and 2D maps (Lei et al. Citation2016), and analyses of the features of flow maps (Dong, Wang, et al. Citation2018). A combination of eye tracking and other methods has been used in recent studies with confirmed effectiveness (Liao et al. Citation2017; Dong, Jiang, et al. Citation2018). In summary, a method should be used that can both display subjective evaluations and objectively reflect the process of map use. In this study, eye tracking and questionnaires were used in combination to examine map use.
The combination of a head-mounted display (HMD) and eye trackers enables eye-tracking studies in VR. Recently, numerous eye-tracking experiments and studies have been conducted in VR (Schrom-Feiertag, Settgast, and Seer Citation2017; Piumsomboon et al. Citation2017; Soler et al. Citation2017). However, the processing and analysis of eye-tracking data in VR, such as fixation point generation and dynamic fixation point matching, still involve many challenges. To address such challenges, Ooms et al. (Citation2015) developed a technology in conjunction with JNativeHook and pyHook, two Python libraries, to record user interactions for dynamic map evaluations. De Beugher et al. (Citation2012) used the scale-invariant feature transform (SIFT) and fast library for approximate nearest neighbors (FLANN) algorithms to identify images in each frame of a video and matched the static fixation points to a standard image. In our study, an improved eye-tracking method was used to evaluate the map use performance of users in different environments.
3. Methods
3.1. Participants
We designed the following between-subject two-variable experiment: 2 virtual environments (a DE and VR) × 2 types (map and globe). All participants were recruited through the Internet at Beijing Normal University. In December 2018, 120 participants (50 males and 70 females) were recruited for the experiment. The participants’ ages ranged between 19 and 25 years (Mean = 22, SD = 1.7). The participants were undergraduate or graduate students at Beijing Normal University in the Department of Geographical Science, School of Chinese Language and Literature, or Department of Psychology.
Based on the questionnaire, none of the participants had eye disorders (such as high myopia, weak color vision or astigmatism), and participants had not used VR before or used VR occasionally. Additionally, all participants were very unfamiliar with world history in 1804. A chi-square test of the map use ability of users based on self-evaluation scores (1-very bad to 7-very good) revealed no significant difference in the number of participants at each ability level. Therefore, the impact of map use ability among different participants was eliminated.
The participants were divided into four groups, and each group was associated with a combination of the two variables (). During the experiment, a quiet and well-lit experimental environment was maintained for the participants. If the participants felt simulator sickness, the experiment was immediately aborted. The participants’ data were excluded from the analysis if their eye-tracking sampling rate was less than 70%. Ultimately, 12 participants were excluded (9 participants for a low sampling rate and 3 participants for simulator sickness), and the data from the remaining 108 participants were retained. The experiment was reviewed and approved by the university’s institutional review board. All participants provided written consent and were compensated for their participation. If the participant completed the entire experiment, he/she received a test compensation of 40 RMB.
Table 1. Four groups in the experiment.
3.2. Hardware
For the DE experiment, we used a Tobii TX300 eye tracker (Tobii AB, Sweden; www.tobii.com) at a sampling frequency of 300 Hz. The eye tracker was connected to a laptop with a screen resolution of 1980 × 1080. Tobii Studio 3.5 was installed on a laptop for data collection and processing. For the VR experiment, we used an SMI VR eye tracker (Apple Inc., USA; www.smivision.com) at a sampling frequency of 90 Hz. The eye tracker was embedded in an HTC VIVE HMD (HTC Inc.; https://www.htc.com) with a screen resolution of 2160 × 1200; this device was connected to a laptop. The graphics cards of both laptops were NVIDIA GeForce GTX 1070 cards with 8 GB GPUs. All equipment was placed in the laboratory to ensure constant light conditions and a noise-free environment.
3.3. Software
For the DE experiment, we developed a desktop-based answering system, which was built in HTML5, allowing the participants to interact with the system. The participants could pan/rotate and zoom the map as necessary using mice. For the VR experiment, we used a Vizard engine (https://www.worldviz.com/vizard) to build a virtual answering system in an HMD through which the participants could answer questions by means of VR controllers. Using the left mouse button (in the DE experiment) or the left VR controller touchpad (in the VR experiment), participants could pan or rotate the map. Using the right mouse button (in the DE experiment) or the right VR controller touchpad (in the VR experiment), participants could zoom the map in or out. The same pan/rotate/zoom distance was used for the mouse and controller per unit of time; thus, the operations in the two environments were equivalent.
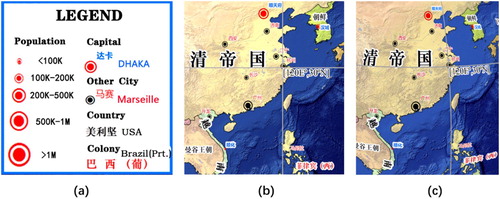
To minimize the impact of the prior geographical knowledge of the participants, we created an 1804 world political map as our base map. The original data were obtained from the Internet (OliieBye Citation2015). The map showed the borders and capitals of countries worldwide in 1804. Then, we used the urban population dataset from 1800 (https://en.wikipedia.org/wiki/Historical_urban_community_sizes) to show the populations of the capitals and some important cities. The populations were represented by point features with the graduated symbols visualization method.
Using the base map, a map and globe were generated as materials (). The amount and complexity of the information embedded in the map and globe were the same, i.e. both materials were informationally equivalent (Çöltekin et al. Citation2009; Larkin and Simon Citation1987). No scale problem was caused by the multilevel scales of both stimuli, and the information was consistent at all scales. To demonstrate the necessary distortion of the map, the map used an equidistant cylindrical projection, which is distorted in both angle and area. As a supplement, the map and globe were marked with latitude and longitude lines, and a legend was created. The interval between the latitude and longitude lines was 30°. To estimate the distance and area, the distances between the two longitude lines and latitude lines was provided. The legend included representation information for capitals or other cities, countries or colonies, and the urban population.
Figure 1. Legend and details of the map and globe: (a) Legend with translated notes; (b) Details of the map; (c) Details of the globe. For clarity, the scales of (b) and (c) are not consistent with that of (a).
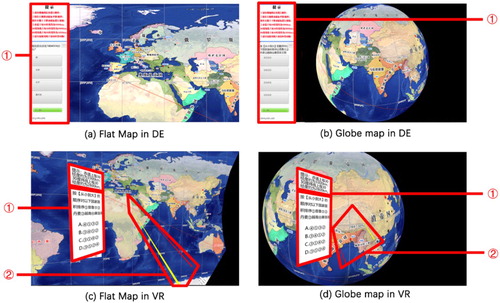
The user interfaces are shown in . In the DE, a map or a globe was placed on the right side of the screen, and the question and some hints were placed on the left ((a) & (b)). In VR, a map or a globe was placed directly in front of the participants, and the question and hints were aligned with the participants’ heads and two laser pointers with VR controllers ((c) & (d)). The purpose of the above design was to minimize the operational difficulty of the participants, allowing them to concentrate on the stimuli.
Figure 2. Interface of the stimuli: ① Question and hints; ② Laser pointers used by the VR controllers.
3.4. Procedures
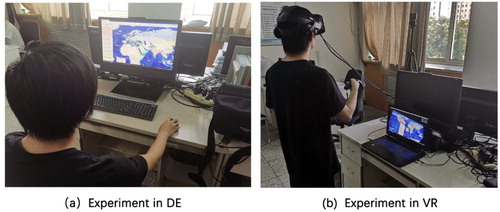
All experiments were conducted in the Department of Geographical Science, Beijing Normal University. First, considering simulations of actual use, the participants in Groups MD and GD remained standing and wore the HMD as shown in (a), and those in Groups MV and GV sat in front of a desktop eye tracker as shown in (b). After a 5-point calibration process, the participants learned about the experimental process, the operational method and the precautions of the experiment through an introduction interface. The participants were familiarized with the experimental process through a practice question. The experiment formally began after finishing the practice question, which took approximately 5 min.
Figure 3. Typical scenes during the experiment.
The participants were presented with 6 orderly single-choice questions and informed that they needed to find the information on the map/globe to answer these questions as quickly as possible. The questions are shown in . Each question represents a common map use task, including 2 estimation tasks (area estimation and distance estimation), 2 ranking tasks (attribute ranking and area ranking), and 2 association tasks (point-polygon association and polygon-polygon association). To balance the learning effects, the order of the questions was randomized, and the participants were informed that using contemporary geographical knowledge may lead to incorrect answers.
Table 2. Task type and sample questions.
After answering each question, the participants’ visual perspective was reset to the initial states, and the system recorded the answers that the participants selected and the amount of time used. During the experiment, all eye-tracking data, video data and interactive data (including zooming, panning or rotating) of the participants were recorded for the analysis. Finally, the participants completed a questionnaire, which included scale information regarding their satisfaction with the map design and readability and how they felt about the experiment. The average time for the entire experiment was 15–20 min. The windows were kept closed and constant light conditions were maintained throughout the experiments.
3.5. Data preprocessing
We exported the raw gaze data from the two experiments and identified the fixations from the raw gaze data using the velocity-threshold (I-VT) algorithm (Salvucci and Goldberg Citation2000). The fixation data were used for further analysis.
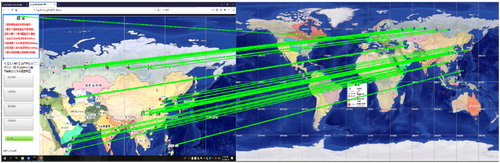
Another preprocessing step involved processing the eye movement data with dynamic stimuli in the DE experiment (see Section 2.2). Because the experiments allowed user interactions (zooming, panning or rotating), the eye movement data could not be directly compared across different participants. Therefore, we conducted an automatic spatial adjustment of all fixations using image feature detection and matching algorithms (). For each video frame, we first computed the SIFT descriptors (Lowe Citation2004), then matched the descriptors with those of the reference map (i.e. the base map) using the FLANN algorithm (Muja and Lowe Citation2014). During the image-matching process, a transformation matrix was generated. We used the transformation matrix to adjust the fixations to the reference map. Thus, all fixations were spatially adjusted. These steps were implemented using the Python open source library in OpenCV2 (https://opencv.org/).
Figure 4. Illustration of spatial fixation adjustment. Each video frame image (left, 1920 × 1080) was adjusted to the reference map (right, 6000 × 3000) using descriptor matching (green lines).
3.6. Analysis
Five sets of quantitative metrics were calculated from the experiments. These metrics have been commonly used in previous eye-tracking studies to measure map use performance (Çöltekin et al. Citation2009; Liao et al. Citation2017; Manson et al. Citation2012).
General metrics. Accuracy and response time are classic usability metrics used to measure the effectiveness and efficiency of map use tasks, respectively.
Information-searching metrics. Two information-searching metrics are available. (a) The first metric is the average saccade duration (ASD). Because users cannot perform information coding (Duchowsky Citation2007) during saccades and can only search for targets, the saccade duration reflects the time that participants spent on visual searching. (b) The second metric is the saccade frequency (SF), which is defined as the number of saccades per second. A high saccade frequency indicates a high visual search efficiency (Garlandini and Fabrikant Citation2009).
Information-processing metrics. Two information-processing metrics are available. (a) The first metric is the average fixation duration (AFD), which represents the difficulty in interpreting visual information during the experiment; a long duration indicates difficulty in information processing (Antes, Chang, and Mullis Citation1985; Popelka and Brychtova Citation2013). (b) The second metric is the fixation frequency (FF), which is the number of fixation points per second, representing the information-processing efficiency.
Interaction metrics. Two interaction metrics are available. (a) The first metric is the zoom-in/zoom-out count (ZC), which is defined as the number of times that participants performed scaling operations during a task. The participants may have zoomed-in on an area during the experiment because the stimuli were not visible or information searching was required at a small scale. When a user zoomed in or out more, searching for the information at different scales became more difficult (Manson et al. Citation2012). (b) The second metric is the pan/rotate count (PRC), which is similar to the zoom count and is defined as the average number of times the participants panned (or rotated) the image. When the PRC was higher, the participants required a greater number of interactions, leading to difficulty in information searching and processing.
Subjective rating metrics. The following satisfaction metrics were obtained from the participants via a questionnaire after the experiment: satisfaction with the design of the map/globe (SA) and readability (SR). The two metrics are represented by a seven-point scale, where 1 indicates very satisfied/very easy to read and 7 indicates very dissatisfied/very difficult to read.
The metrics among the four groups were assumed to have no differences. After preliminary testing for a normal distribution (kurtosis and skewness test), we found that at least one data point did not follow a normal distribution. Based on the results, we used a non-parametric test to determine the significance of the response time, information-processing, information-searching and interaction metrics. A Kruskal–Wallis H test was applied for pairwise comparisons among the four groups. A chi-square test was used to analyze the accuracy and subjective rating metrics. All analyses were performed using IBM SPSS 22.0.
4. Results
4.1. Estimation tasks
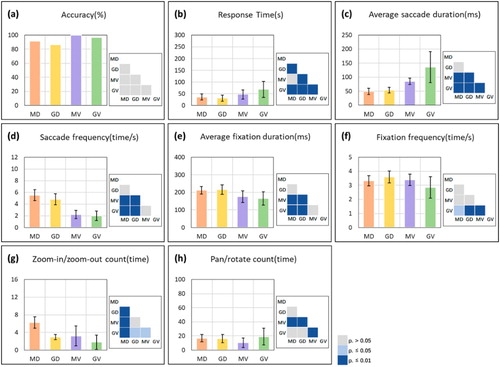
The metrics of the area and the distance estimation task results are shown in (Supplemental Table 1) and (Supplemental Table 2), respectively. None of the four groups displayed significant trends related to accuracy in the two estimation tasks ((a) & 6(a)). The differences in response time were significant. First, the participants in the MD groups spent significantly longer times than those in the MV groups when conducting area estimation (RTMD = 147.83 s, RTMV = 91.16 s, p. MD-MV = 0.000, (b)). Second, the differences in the response time between the two globe groups were mainly detected in the distance estimation task. The participants using the DE were significantly faster in estimating the polygon areas than those using VR (RTGD = 132.86 s, RTGV = 108.75 s, p. MD-GD = 0.010, (b)).
Figure 5. Descriptive statistics and the significance test results for the area estimation task metrics. The error bars indicate the standard errors of each metric’s data.
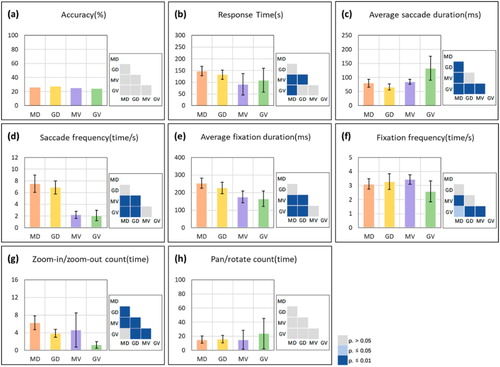
Figure 6. Descriptive statistics and the significance test results for the distance estimation task metrics. The error bars indicate the standard errors of each metric’s data.
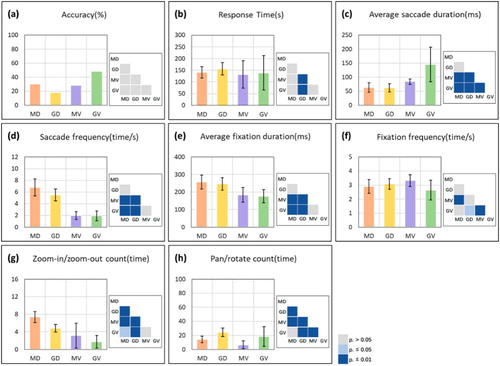
Additionally, Groups MV and GV had significantly longer saccade durations than Groups MD and GD; these differences were very significant in both tasks ((c) & 6(c)). Second, in estimation tasks, the virtual map was more advantageous than the globe in terms of the average saccade duration (ASDMV = 84.73 ms, ASDGV = 132.69 ms, p. MV-GV = 0.000, (c); ASDMV = 84.11 ms, ASDGV = 145.18 ms, p. MV-GV = 0.001, (d)). Humans find it difficult to estimate a curve or a region on a surface (Shepard, Citation1988). Considering the obstacles caused by the visible areas, the participants could not see the whole curve/region from any perspective. Regarding the saccade frequency, the results were similar to those for the saccade duration. The participants in the VR groups had a significantly lower search frequency than those in the DE groups ((d) & 6(d)).
Based on the comparison of the different environments, the participants in the VR group had a shorter information-processing duration than those in the DE groups, and this difference was significant for the distance and area estimation tasks ((e) & 6(e)). The advantages were also reflected in the fixation frequency. First, the participants in the VR groups had a significantly lower search frequency than those in the DE groups for both the map and globe ((f) & 6(f)). Second, in the internal comparison between the two VR groups, the participants using the map had a higher search efficiency when estimating the area and distance than those using the globe (SFMV = 3.43, SFGV = 2.59, p. MV-GV = 0.000, (f); SFMV = 3.32, SFGV = 2.63, p. MV-GV = 0.000, (f)).
According to the results of the interaction metrics, the differences in the zoom-in and zoom-out counts were very significant. First, except for comparing Groups MV and GV in the distance estimation task, the differences were significant for both different environments and different types. The results showed that the participants using maps in the DE performed significantly more zoom-in and zoom-out operations than the participants in the other groups, and the participants using the globe in VR displayed the opposite trend ((g) & 6(g)). Second, in the distance estimation task, the pan/rotate count for Group GV was significantly larger than that for the other groups, revealing that the participants using the globe in VR had more difficulty with the search operations ((h)). However, the abovementioned differences were not observed for the area estimation task.
4.2. Ranking tasks
The statistical results of the metrics for the two ranking tasks are shown in (Supplemental Table 3) and (Supplemental Table 4). A significant difference in accuracy was observed only in the area ranking task, in which the participants using the desktop globe had more correct answers than those using VR (ACGD = 78.26%, ACMV = 39.29%, ACGV = 34.48%, p. GD-MV = 0.004, p. GD-GV = 0.001, (a)). Regarding the response time, first, similar to the findings for certain estimation tasks, the participants in VR spent a significantly longer time completing tasks than those in the DE. However, this finding was observed only for map use ((b) & 8(b)). Notably, the response time in the VR groups was variable, especially during the attribute ranking task, and the average standard deviation exceeded 90 s ((b)). Second, in both ranking tasks, the map was more advantageous in terms of efficiency than was the globe (RTMD = 71.54 s, RTGD = 103.75 s, p. MD-GD = 0.000, (b); RTMD = 77.90 s, RTGD = 65.51 s, p. MD-GD = 0.010, (b)).
Figure 7. Descriptive statistics and the significance test results for the attribute ranking task metrics. The error bars indicate the standard errors of each metric’s data.
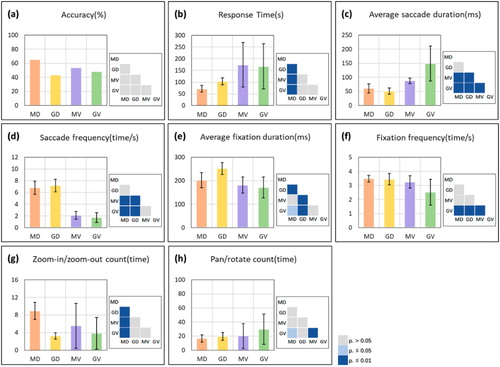
Figure 8. Descriptive statistics and the significance test results for the area ranking task metrics. The error bars indicate the standard errors of each metric’s data.
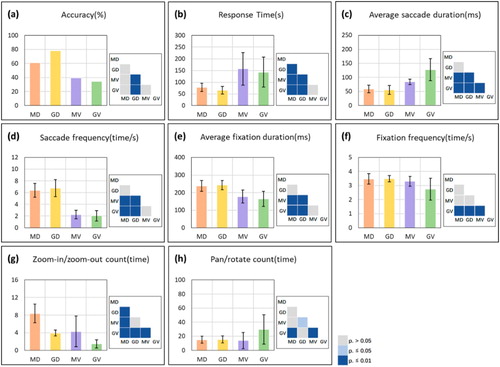
In terms of information-searching metrics, the ranking tasks and estimation tasks displayed highly significant similarity trends. For both the attribute and area ranking tasks, participants in the DE had a significantly shorter saccade duration than those in VR, regardless of whether they used a map or globe ((c) & 8(c)). In addition, the significance of the saccade frequency is similar to that for the estimation task results ((d) & 8(d)).
For the fixation duration, a significant difference was observed between Groups MD and GD in the attribute ranking task as follows: the fixation duration using the globe was significantly longer than the fixation duration using the map (AFDMD = 202.12 ms, AFDGD = 252.81 ms, p. MD-GD = 0.000, (e)). The narrow visual field of the globe could represent a weakness because the visible area provided by the globe is only a part of the Earth. Other interesting results were observed for the area ranking task, in which the participants in the DE had significantly longer fixation durations than those in VR (AFDMD = 238.57 ms, AFDMV = 177.32 ms, p. MD-GD = 0.000; AFDGD = 242.93 ms, AFDGV = 164.80 ms, p. MD-GD = 0.000, (e)). Regarding the fixation frequency for two ranking tasks, the main significant differences were observed for the globe in VR. Compared with Group GV, Groups GD and MV had significantly higher information-processing efficiencies during the experiment ((f) & 8(f)), and the results were confirmed in both the attribute and area ranking tasks.
The differences were significant for interactive metrics. When using a map in the DE, participants needed to perform significantly more zoom-in or zoom-out interactions compared to the globe in the DE and the map in VR ((g) & 8(g)). In addition, although it was not significant in the attribute ranking task, we observed that the zoom operations for the participants in Group GV were significantly lower than those for Groups GD and MV in the area ranking task (ZCGV = 1.46, ZCGD = 3.95, ZCMV = 4.31, p. GV-GD = 0.000, p. GV-MV = 0.000, (g)). However, for the number of rotations, the results were quite different. Participants who used the globe in VR needed more rotation interactions than those who used the globe in the DE (PRCMV = 20.27, PRCGV = 26.77, p. MV-GV = 0.000, (h); PRCMV = 13.96, PRCGV = 29.81, p. MV-GV = 0.000, (h)).
4.3. Association tasks
(Supplemental Table 5) and (Supplemental Table 6) show the experimental results for association task indicators. Similar to the estimation and ranking tasks, quite a few metrics had high similar significance levels in the association tasks, e.g. the accuracy, average saccade duration, average fixation duration, and saccade frequency. Such results showed that, in different tasks, the values of the abovementioned metrics are stable, especially for the information-searching metrics.
Figure 9. Descriptive statistics and the significance test results for the point-polygon association task metrics. The error bars indicate the standard errors of each metric’s data.
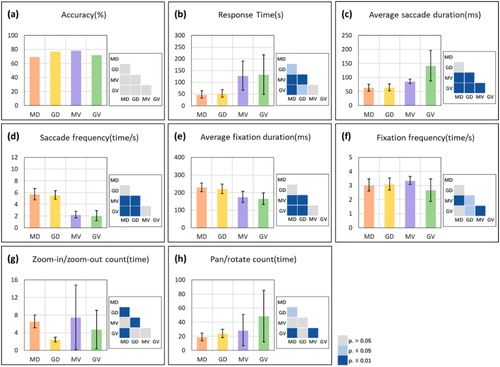
Figure 10. Descriptive statistics and the significance test results for the polygon-polygon association task metrics. The error bars indicate the standard errors of each metric’s data.
However, associated tasks had some other results. First, when conducting the polygon-polygon association task, VR participants using the globe took more time than participants using the map (RTGV = 68.74 s, RTMV = 47.05 s, p. GV-MV = 0.006, (b)). Second, the map in VR displayed a significant advantage in the fixation frequency compared to the map in the DE (FFMV = 3.36, FFMD = 3.04, p. MV-MD = 0.003, (f)). A significant difference was observed in point-polygon association tasks but not in polygon-polygon association tasks. Finally, for interactive metrics, the globe in the DE had a significant advantage in zoom operations ((g) & 10(g)), and the globe in VR had a significant disadvantage in pan or rotate operations ((h) & 10(h)).
A horizontal difference comparison must be made among six different tasks. First, the map tasks vary in difficulty, with area and distance being the most difficult to estimate, followed by ranking and other association tasks, according to the accuracy and response time. Second, when participants performed different map use tasks, their interaction behaviors differed. For example, participants needed to compare multiple regions when conducting ranking tasks, and participants only needed to collect information in one region when performing estimation tasks. Therefore, ranking tasks required more zoom and pan/rotate interactions. Finally, the effect of different map use tasks on participants’ eye-tracking metrics was smaller than the effects associated with different environments (a DE or VR) and different representation types (map or globe).
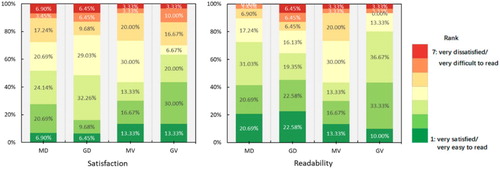
4.4. Subjective rating metrics
The distribution of satisfaction and readability data is shown in . The satisfaction and readability data were analyzed using a chi-square test, which indicated that none of the differences was significant. Numerically, the highest satisfaction was observed for the globe in VR, and the lowest satisfaction was observed for the globe in the DE (SAGD = 3.71, SAGV = 3.27). Regarding readability, the participants thought that the map in the DE was easy to read and that the globe in VR was difficult to read (SRGV = 3.16, SRMD = 2.79).
Figure 11. Different scales distribution results of satisfaction and readability.
5. Discussion
5.1. Differences between VR and the DE
The results are summarized in . This figure ranks the metrics of the different environments and map use tasks based on significance and the metric meanings. Each block presents the relative strengths and weaknesses of the metrics for certain environments.
Figure 12. Relative map use performance among different groups based on various metrics and tasks.
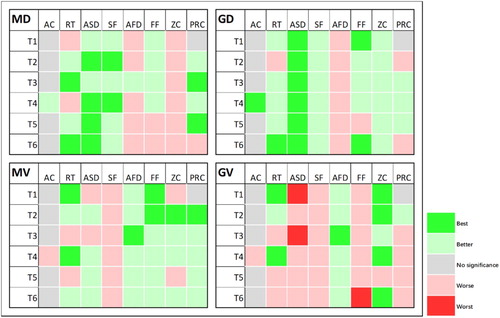
First, the response time results indicate that VR and the DE significantly differ in terms of the efficiency of map use. Low efficiency was detected in some participants in the VR groups. In T3 (attribute ranking task) and T4 (area ranking task), some participants even required five minutes to complete the task ((b) & 8(b)). This information allows us to infer that the participants faced considerable difficulty before they were fully adapted to VR. For comparison, among the participants in the DE groups, completing the tasks was similar to the process of browsing a web-based map.
Second, regarding information searching, the saccade duration and frequency results show that information is more difficult and less efficient to find in VR, and these results are not affected by the differences across tasks (– (c) & (d)). Through interviews with the participants after the experiment, we found that, in VR, except for the region being viewed, the other areas are blurred in the users’ field of vision (FOV). The HMD has a dynamic blur-rendering strategy that simulates the selective visual attention of human beings (Desimone and Duncan Citation1995). Such a technique improves the refreshing rate, but, since the peripheral area is ambiguous, the rate is very much influenced by users’ peripheral vision, which has been shown to be important for environmental perception (Rayner Citation2009; Franchak and Adolph Citation2010). In addition, the current HMD simulation of the human FOV has not reached the standard of the real environment, which is approximately 150° ∼ 160°. Both the dynamic blur rendering and the small FOV pose difficulties for information searching (Buttussi and Chittaro Citation2018), thereby increasing increase the response time.
Third, regarding information processing, a key finding is that high immersion in VR greatly improved the map use process of users (– (e)). With a DE, regardless of how well users concentrate on using a map, the surrounding environment causes distractions. In contrast, with VR, the users’ visual attention is entirely focused on the map; thus, the efficiency of information processing could be significantly improved. Furthermore, if a user is fully immersed in VR, he/she could sense ‘spatial presence,’ so the users and maps are on the same scale in the same coordinate system. This advantage may also explain the success of virtual geography education and spatial training in a previous study concerning VR (Herman, Kvarda, and Stachoň Citation2018; Carbonell-Carrera and Saorín Citation2017).
5.2. Similarities between the immersive virtual and desktop-based environments
Although various differences exist, three similarities emerged in the map use performance between the two virtual environments. First, the accuracy results show that the participants’ map use effectiveness is similar across virtual environments. Although the users’ map use efficiency differs between the two different environments (see 5.1), this result does not affect the judgment effectiveness of the map use of users. In addition, the feasibility of the map application is ensured under VR, and the portability of the map application is achieved in a DE. From the perspective of effectiveness, simply, most current digital maps can be imported into VR.
Second, when focusing on virtual environments, the significance results for different map types are similar. This finding is interesting because in previous research concerning DEs, the use of different map types represented a main factor that influenced the map use performance of users (Battersby and Montello Citation2009). Therefore, the map use performance differences caused by virtual environments are greater than the differences caused by the map types. The reason for this conclusion is likely because the high immersion and high spatial presence generated by VR yield unique use performance for users.
Finally, regarding satisfaction and readability, similarities were observed () between a DE and VR. The results are logical for the following reasons: during the process of using maps or globes in VR, the users did not have more friendly interactions than they did when using a DE, such as those noted in other reports and research. In Yang's studies, globes in VR were the most satisfying or easiest to read (Yang et al. Citation2019). Conversely, confusion regarding the operations, experiences of simulator sickness, and the heavy weight of the HMD severely affected users’ perceptions of maps and globes and evoked many negative emotions among the users (Kim et al. Citation2018). After the experiment, a VR participant stated, ‘This HMD made me dizzy and distracted me from answering the questions.’ On the one hand, as the realism of VR improves, the incidence of simulator sickness will decrease. On the other hand, simulator sickness cannot be eliminated completely because virtual environments are not real environments. Notably, during the experiment, many participants who wear glasses felt discomfort in the nasal region, and some participants with large head sizes found it difficult to wear the HMD, which has a customizable range of only 8 cm. These limitations may affect the future development of maps in VR.
The readability results could be explained from a cognitive scientific perspective. First-time users retain geographic information gained from their childhood, which is usually derived from a flat paper map rather than a globe shown on a digital monitor or in VR. Therefore, users’ spatial cognition is based on maps, especially world maps. Moreover, people who do not often travel globally are more inclined to perceive the Earth as flat (Carbon Citation2010). From this perspective, users are more accustomed to using maps on screens that are similar to paper maps than they are to using globes and maps in VR.
6. Conclusion and future work
Through experiments and data analysis, we have provided the following three important findings about map use in DEs and VR. First, we found that the users that used VR processed information in highly efficient ways (AFDDE = 233.34 ms, AFDVR = 173.09 ms) and that users that used a DE had a significantly shorter response time and visual search duration (RTDE = 88.68 s, RTVR = 124.05 s; ASDDE = 60.78 ms, ASDVR = 112.13 ms; SFDE = 6.30, SFVR = 2.07). High immersion could be the reason for the advantages of information processing, and the visual search disadvantage of VR is most likely due to device limitations. Second, we found that the differences in the map use performance between virtual environments were greater than the differences caused by the representation types and map use tasks. Both value differences and significant number differences between VR and the DE were larger than those between the map and globe. Additionally, the users using VR and the DE were similar in terms of their accuracy, satisfaction and readability results. These metrics yielded almost no significant difference between VR and the DE.
According to the accuracy and response time, estimation is the most difficult task, followed by the ranking and association tasks. For four eye-tracking metrics, the significance of the results was minimally affected by the representation type or different tasks. However, when participants conduct different map use tasks, their interaction behaviors can be very different. For example, ranking tasks require more zoom and pan/rotate interactions.
We could conduct further future studies involving VR maps, since this study has some limitations. The type and number of map use tasks (such as direction estimation and navigation) could be extended to increase the validity of the conclusions. The sex, age range, game experiment and map-reading ability of the participants may also impact the conclusions of the study. In addition, other VR devices (such as a cave automatic virtual environment, CAVE) could have different effects on map use performance.
The conclusions of this study have implications for improving the usability of map applications and are helpful for designing new map or globe types in VR that can adapt to human cognition and reflect the advantages of VR. New visualization methods designed for geographical information in VR could be a potential direction for future works.
Supplementary_Material
Download MS Word (25.1 KB)Disclosure statement
No potential conflict of interest was reported by the author(s).
ORCID
Weihua Dong http://orcid.org/0000-0001-6097-7946
Tianyu Yang http://orcid.org/0000-0003-0281-4801
Hua Liao http://orcid.org/0000-0002-6304-329X
Liqiu Meng http://orcid.org/0000-0001-8787-3418
Additional information
Funding
Related Research Data
References
- Alaçam, Ö, and M. Dalcı. 2009. “A Usability Study of Webmaps with Eye Tracking Tool: The Effects of Iconic Representation of Information.” Paper presented at the International Conference on Human-Computer Interaction.
- Antes, J. R., K. Chang, and C. Mullis. 1985. “The Visual Effect of Map Design: An Eye-Movement Analysis.” The American Cartographer 12 (2): 143–155. doi:10.1559/152304085783915036.
- Battersby, S. E., and D. R. Montello. 2009. “Area Estimation of World Regions and the Projection of the Global-Scale Cognitive Map.” Annals of the Association of American Geographers 99 (2): 273–291. doi:10.1080/00045600802683734.
- Brychtova, A., and A. Coltekin. 2016. “An Empirical User Study for Measuring the Influence of Colour Distance and Font Size in Map Reading Using Eye Tracking.” Cartographic Journal the 53 (3): 202–212. doi:10.1179/1743277414y.0000000103.
- Buttussi, F., and L. Chittaro. 2018. “Effects of Different Types of Virtual Reality Display on Presence and Learning in a Safety Training Scenario.” IEEE Transactions on Visualization and Computer Graphics 24 (2): 1063–1076. doi:10.1109/tvcg.2017.2653117.
- Carbon, C. C. 2010. “The Earth Is Flat When Personally Significant Experiences with the Sphericity of the Earth Are Absent.” Cognition 116 (1): 130–135. doi:10.1016/j.cognition.2010.03.009.
- Carbonell-Carrera, C., B. V. Avarvarei, E. L. Chelariu, L. Draghia, and S. C. Avarvarei. 2017. “Map-Reading Skill Development with 3d Technologies.” Journal of Geography 116 (5): 197–205. doi:10.1080/00221341.2016.1248857.
- Carbonell-Carrera, C., A. Jaeger, and T. Shipley. 2018. “2d Cartography Training: Has the Time Come for a Paradigm Shift?” ISPRS International Journal of Geo-Information 7 (5): 197. doi:10.3390/ijgi7050197.
- Carbonell-Carrera, C., and J. L. Saorin. 2017. “Virtual Learning Environments to Enhance Spatial Orientation.” Eurasia J. Math. Sci. Technol. Educ 14: 709–719. doi:10.12973/ejmste/79171.
- Carbonell-Carrera, C., and J. L. Saorín. 2017. “Geospatial Google Street View with Virtual Reality: A Motivational Approach for Spatial Training Education.” ISPRS International Journal of Geo-Information 6 (9): 261. doi:10.3390/ijgi6090261.
- Çöltekin, A., B. Heil, S. Garlandini, and S. I. Fabrikant. 2009. “Evaluating the Effectiveness of Interactive Map Interface Designs: A Case Study Integrating Usability Metrics with Eye-Movement Analysis.” Cartography and Geographic Information Science 36 (1): 5–17. doi:10.1559/152304009787340197.
- Cummings, J. J., and J. N. Bailenson. 2016. “How Immersive Is Enough? A Meta-Analysis of the Effect of Immersive Technology on User Presence.” Media Psychology 19 (2): 272–309. doi:10.1080/15213269.2015.1015740.
- De Beugher, S., Y. Ichiche, G. Brône, and T. Goedemé. 2012. “Automatic Analysis of Eye-tracking Data Using Object Detection Algorithms.” Paper Presented at the 2012 ACM Conference on Ubiquitous Computing: Workshop Session: Perasive Eye Tracking and Mobile Eye-based Interaction, Pittsburgh, PA.
- Deeb, R., K. Ooms, V. V. Eetvelde, and P. D. Maeyer. 2015. “Towards a Deeper Understanding of Cartographic Text Visualisation: Assessment of User Preferences and Colour Influence.” The Cartographic Journal 52 (4): 325–335. doi:10.1179/1743277413y.0000000073.
- De Roo, B., J. Bourgeois, and P. De Maeyer. 2017. “Usability Assessment of a Virtual Globe-Based 4d Archaeological Gis.” Advances in 3d Geoinformation, 323-35 Springer. doi:10.1007/978-3-319-25691-7_18.
- Desimone, R., and J. Duncan. 1995. “Neural Mechanisms of Selective Visual Attention.” Annual Review of Neuroscience 18 (1): 193–222. doi:10.1146/annurev.neuro.18.1.193 doi: 10.1146/annurev.ne.18.030195.001205
- Dong, W., L. Hua, R. E. Roth, and S. Wang. 2014. “Eye Tracking to Explore the Potential of Enhanced Imagery Basemaps in Web Mapping.” Cartographic Journal the 51 (4): 313–329. doi:10.1179/1743277413y.0000000071.
- Dong, W., Y. Jiang, L. Zheng, B. Liu, and L. Meng. 2018. “Assessing Map-Reading Skills Using Eye Tracking and Bayesian Structural Equation Modelling.” Sustainability 10 (9): 3050. doi:10.3390/su10093050.
- Dong, W., S. Wang, Y. Chen, and L. Meng. 2018. “Using Eye Tracking to Evaluate the Usability of Flow Maps.” ISPRS International Journal of Geo-Information 7 (7): 281. doi:10.3390/ijgi7070281.
- Donker, A., and P. Markopoulos. 2002. “A Comparison of Think-Aloud, Questionnaires and Interviews for Testing Usability with Children.” People and Computers Xvi-Memorable yet Invisible, 305–316 Springer. doi:10.1007/978-1-4471-0105-5_18.
- Duchowsky, A. 2007. Eye Tracking Methodology: Theory and Practice. London: Springer Verlag. doi:10.1007/978-1-4471-3750-4.
- Franchak, J. M., and K. E. Adolph. 2010. “Visually Guided Navigation: Head-Mounted Eye-Tracking of Natural Locomotion in Children and Adults.” Vision Research 50 (24): 2766–2774. doi:10.1016/j.visres.2010.09.024.
- Garlandini, S., and S. I. Fabrikant. 2009. “Evaluating the Effectiveness and Efficiency of Visual Variables for Geographic Information Visualization.” Paper presented at the International Conference on Spatial Information Theory.
- Gołębiowska, I. 2015. “Legend Layouts for Thematic Maps: A Case Study Integrating Usability Metrics with the Thinking Aloud Method.” The Cartographic Journal 52 (1): 28–40. doi:10.1179/1743277413y.0000000045.
- Gore, A. 1998. “The Digital Earth: Understanding Our Planet in the 21st Century.” Australian Surveyor 43 (2): 89–91. doi:10.1080/00050348.1998.10558728.
- Herman, L., V. Juřík, Z. Stachoň, D. Vrbík, J. Russnák, and T. Řezník. 2018. “Evaluation of User Performance in Interactive and Static 3d Maps.” ISPRS International Journal of Geo-Information 7 (11): 415. doi:10.3390/ijgi7110415.
- Herman, L., O. Kvarda, and Z. Stachoň. 2018. “Cheap and Immersive Virtual Reality: Application in Cartography.” International Archives of the Photogrammetry, Remote Sensing & Spatial Information Sciences. doi:10.5194/isprs-archives-xlii-4-261-2018.
- Hruby, F., R. Ressl, and G. de la Borbolla del Valle. 2019. “Geovisualization with Immersive Virtual Environments in Theory and Practice.” International Journal of Digital Earth 12 (2): 123–136. doi:10.3390/ijgi7110415 doi: 10.1080/17538947.2018.1501106
- Huang, W., and J. Chen. 2019. “A Multi-Scale Vr Navigation Method for Vr Globes.” International Journal of Digital Earth 12 (2): 228–249. doi:10.1080/17538947.2018.1426646.
- Kerkovits, K., and C. Szigeti. 2018. “Relationships between the Distortions in Map Projections and the Usability of Small-Scale Maps”.
- Kim, H. K., J. Park, Y. Choi, and M. Choe. 2018. “Virtual Reality Sickness Questionnaire (Vrsq): Motion Sickness Measurement Index in a Virtual Reality Environment.” Applied Ergonomics 69: 66–73. doi:10.1016/j.apergo.2017.12.016.
- Koua, E. L., A. MacEachren, and M. J. Kraak. 2006. “Evaluating the Usability of Visualization Methods in an Exploratory Geovisualization Environment.” International Journal of Geographical Information Science 20 (4): 425–448. doi:10.1080/13658810600607550.
- Kubíček, P., Č Šašinka, Z. Stachoň, L. Herman, V. Juřík, T. Urbánek, and J. Chmelík. 2019. “Identification of Altitude Profiles in 3d Geovisualizations: The Role of Interaction and Spatial Abilities.” International Journal of Digital Earth 12 (2): 156–172. doi:10.1080/17538947.2017.1382581.
- Larkin, J. H., and H. A. Simon. 1987. “Why a Diagram Is (Sometimes) Worth Ten Thousand Words.” Cognitive Science 11 (1): 65–100. doi:10.1111/j.1551-6708.1987.tb00863.x.
- Lei, T. C., S. C. Wu, C. W. Chao, and S. H. Lee. 2016. “Evaluating Differences in Spatial Visual Attention in Wayfinding Strategy When Using 2d and 3d Electronic Maps.” GeoJournal 81 (2): 153–167. doi:10.1007/s10708-014-9605-3.
- Liao, H., W. Dong, C. Peng, and H. Liu. 2017. “Exploring Differences of Visual Attention in Pedestrian Navigation When Using 2d Maps and 3d Geo-Browsers.” Cartography and Geographic Information Science 44 (6): 474–490. doi:10.1080/15230406.2016.1174886.
- Liao, H., X. Wang, W. Dong, and L. Meng. 2019. “Measuring the Influence of Map Label Density on Perceived Complexity: A User Study Using Eye Tracking.” Cartography and Geographic Information Science 46 (3): 210–227. doi:10.1080/15230406.2018.1434016.
- Lisichenko, R. 2015. “Issues Surrounding the Use of Virtual Reality in Geographic Education.” The Geography Teacher 12 (4): 159–166. doi:10.1080/19338341.2015.1133441.
- Lowe, D. G. 2004. “Distinctive Image Features from Scale-Invariant Keypoints.” International Journal of Computer Vision 60 (2): 91–110. doi:10.1023/b:visi.0000029664.99615.94.
- Lütjens, M., T. P. Kersten, B. Dorschel, and F. Tschirschwitz. 2019. “Virtual Reality in Cartography: Immersive 3d Visualization of the Arctic Clyde Inlet (Canada) Using Digital Elevation Models and Bathymetric Data.” Multimodal Technologies and Interaction 3 (1): 9. doi:10.3390/mti3010009.
- Manson, S. M., L. Kne, K. R. Dyke, J. Shannon, and S. Eria. 2012. “Using Eye-Tracking and Mouse Metrics to Test Usability of Web Mapping Navigation.” Cartography and Geographic Information Science 39 (1): 48–60. doi:10.1559/1523040639148.
- Muja, M., and D. G. Lowe. 2014. “Scalable Nearest Neighbor Algorithms for High Dimensional Data.” IEEE Transactions on Pattern Analysis and Machine Intelligence 36 (11): 2227–2240. doi:10.1109/tpami.2014.2321376.
- Nielsen, J. 1994. Usability Engineering. Amsterdam: Elsevier.
- OliieBye. 2015. “History of the World: Every Year.” https://www.youtube.com/watch?v=ymI5Uv5cGU4.
- Ooms, K., A. Coltekin, P. De Maeyer, L. Dupont, S. Fabrikant, A. Incoul, M. Kuhn, H. Slabbinck, P. Vansteenkiste, and L. Van der Haegen. 2015. “Combining User Logging with Eye Tracking for Interactive and Dynamic Applications.” Behavior Research Methods 47 (4): 977–993. doi:10.3758/s13428-014-0542-3.
- Ooms, K., P. De Maeyer, and V. Fack. 2010. “Analyzing Eye Movement Patterns to Improve Map Design.” Paper presented at the 18th International research symposium on computer-based cartography and GIScience (AutoCarto 2010): Geospatial data and geovisualization for the environments, security, and society.
- Ooms, K., P. D. Maeyer, V. Fack, E. V. Assche, and F. Witlox. 2012. “Investigating the Effectiveness of an Efficient Label Placement Method Using Eye Movement Data.” The Cartographic Journal 49 (3): 234–246. doi:10.1179/1743277412y.0000000010.
- Piumsomboon, T., G. Lee, R. W. Lindeman, and M. Billinghurst. 2017. “Exploring Natural Eye-Gaze-Based Interaction for Immersive Virtual Reality.” Paper presented at the 2017 IEEE Symposium on 3D User Interfaces (3DUI).
- Popelka, S., and A. Brychtova. 2013. “Eye-Tracking Study on Different Perception of 2d and 3d Terrain Visualisation.” The Cartographic Journal 50 (3): 240–246. doi:10.1179/1743277413y.0000000058.
- Popelka, S., and J. Dolezalova. 2016. “Differences Between 2d Map and Virtual Globe Containing Point Symbols–an Eye-Tracking Study.” International Multidisciplinary Scientific GeoConference: SGEM: Surveying Geology & Mining Ecology Management 3: 175–182. doi:10.5593/sgem2016/b23/s11.023.
- Rayner, K. 2009. “Eye Movements and Attention in Reading, Scene Perception, and Visual Search.” The Quarterly Journal of Experimental Psychology 62 (8): 1457–1506. doi:10.1016/s0926-907x(05)80003-0 doi: 10.1080/17470210902816461
- Renner, R., B. Velichkovsky, and J. Helmert. 2014. “The Perception of Egocentric Distances in Virtual Environments.” ACM Comput. Surv.(to Appear, 2014). doi:10.1145/2543581.2543590.
- Salvucci, D. D., and J. H. Goldberg. 2000. “Identifying Fixations and Saccades in Eye-Tracking Protocols.” Paper presented at the Proceedings of the 2000 symposium on Eye tracking research & applications.
- Šašinka, Č, Z. Stachoň, M. Sedlák, J. Chmelík, L. Herman, P. Kubíček, A. Šašinková, M. Doležal, H. Tejkl, and T. Urbánek. 2019. “Collaborative Immersive Virtual Environments for Education in Geography.” ISPRS International Journal of Geo-Information 8 (1): 3. doi:10.3390/ijgi8010003.
- Šavrič, B., B. Jenny, D. White, and D. R. Strebe. 2015. “User Preferences for World Map Projections.” Cartography and Geographic Information Science 42 (5): 398–409. doi:10.1080/15230406.2015.1014425.
- Schnur, S., K. Bektaş, and A. Çöltekin. 2018. “Measured and Perceived Visual Complexity: A Comparative Study among Three Online Map Providers.” Cartography and Geographic Information Science 45 (3): 238–254. doi:10.1080/15230406.2017.1323676.
- Schrom-Feiertag, H., V. Settgast, and S. Seer. 2017. “Evaluation of Indoor Guidance Systems Using Eye Tracking in an Immersive Virtual Environment.” Spatial Cognition & Computation 17 (1-2): 163–183. doi:10.1080/13875868.2016.1228654.
- Shepard, R. N. 1988. “The Role of Transformations in Spatial Cognition.” Spatial Cognition: Brain Bases and Development 81–110.
- Skarlatidou, A., and M. Haklay. 2006. “Public Web Mapping: Preliminary Usability Evaluation.” Paper presented at the GIS Research UK.
- Slocum, T. A., C. Blok, B. Jiang, A. Koussoulakou, D. R. Montello, S. Fuhrmann, and N. R. Hedley. 2001. “Cognitive and Usability Issues in Geovisualization.” Cartography and Geographic Information Science 28 (1): 61–75. doi:10.1559/152304001782173998.
- Soler, J. L., J. Ferreira, M. Contero, and M. Alcañiz. 2017. “The Power of Sight: Using Eye Tracking to Assess Learning Experience (Lx) in Virtual Reality Environments.” INTED2017 proceedings, 8684-9. doi:10.21125/inted.2017.2060.
- Stojšić, I., A. I. Džigurski, O. Maričić, L. I. Bibić, and S. Đ Vučković. 2016. “Possible Application of Virtual Reality in Geography Teaching.” Journal of Subject Didactics 1 (2): 83–96. doi:10.5281/zenodo.438169.
- Wisniewski, P. K., O. Pala, H. R. Lipford, and D. C. Wilson. 2009. “Grounding Geovisualization Interface Design: A Study of Interactive Map Use.” Paper presented at the CHI'09 Extended Abstracts on Human Factors in Computing Systems.
- Yang, Y., T. Dwyer, B. Jenny, K. Marriott, M. Cordeil, and H. Chen. 2019. “Origin-Destination Flow Maps in Immersive Environments.” IEEE Transactions on Visualization and Computer Graphics 25 (1): 693–703. doi:10.1109/tvcg.2018.2865192.
- Yang, Y., B. Jenny, T. Dwyer, K. Marriott, H. Chen, and M. Cordeil. 2018. “Maps and Globes in Virtual Reality.” Paper presented at the Computer Graphics Forum.
- Zhao, J., J. O. Wallgruen, P. C. La Femina, R. A. DiBiase, J. C. Carr, and A. Klippel. 2018. “Toward a Universal Workbench for Visualization and Quantitative Exploration of Earth Science Data in Immersive Virtual Reality.” Paper presented at the AGU Fall Meeting Abstracts.