
 ?Mathematical formulae have been encoded as MathML and are displayed in this HTML version using MathJax in order to improve their display. Uncheck the box to turn MathJax off. This feature requires Javascript. Click on a formula to zoom.
ABSTRACT
The zircon U-Pb chronology database provides a good opportunity to obtain important zircon growth peak periods in the Earth's history so as to study the origin and evolution of the crust. It should be noted that research preference affects the objectivity of zircon sampling, leading to hot data in the database and age statistics. To evaluate the influence of hot data on statistical results, the W and Y indexes are introduced. Using a Gaussian model of multipeak fitting of zircon U-Pb age frequencies, we identify seven major growth peaks in zircons from the Chinese continental crust, which are 2498.95, 1855.82, 828.88, 444.29, 249.46, 131.96, and 58.21 Ma. Due to differences in the time scales of zircon growth peaks, these peaks can be divided into two categories: first-order zircon growth peaks (I) and second-order zircon growth peaks (II), which represent longer and shorter time scales, perhaps due to different kinds of geological dynamics, respectively. In addition, there are clear correspondences between these ages and various geological events recognized by most scholars, namely, the Wutai orogeny, Lvliang orogeny, Jinning orogeny, Caledonian orogeny, Indosinian orogeny, Yanshanian orogeny, and Himalayan orogeny, respectively.
1. Introduction
Zircon occurs in trace amounts in a wide variety of quartz-bearing igneous rocks. It is physically and chemically robust under a wide range of geological pressures and temperatures, so it is also common in metamorphic rocks and as a detrital mineral in sediments and sedimentary rocks. Crystallizing zircon incorporates a variety of trace elements, including Hf, the rare earth elements, U, and Th. Because it incorporates little Pb and has a high closure temperature for trace element diffusion, zircon is widely used for geochronology using the radioactive decay of U and Th to Pb (Williams Citation2015). Since zircon can survive the partial melting of its host rock (Williams Citation2015), it is not unusual for zircon grains from igneous or metamorphic rocks to undergo a complex history of magmatic activity and metamorphic events. In addition, the high-resolution ion probes makes it possible to study individual grains containing several generations of growth (Davis, Williams, and Krogh Citation2003; Pell, Williams, and Chivas Citation1997; Armstrong et al. Citation1990; Kalsbeek and Nutman Citation1996; Williams Citation1992). Therefore, from the perspective of zircon growth, we can digitize the solid Earth and use the methods of big data to discuss the episodes of large-scale magmatic activity and metamorphic events in geological history. Geochronological big data not only make geochronology more quantitative but also provide chances to study it over time, space and higher dimensions (Puetz et al. Citation2018; Fang et al. Citation2018; Wu et al. Citation2019). In addition, scientific understanding beyond the meaning of geochronology itself can be drawn, and a new understanding of geodynamics and earth system science can be obtained through data analysis.
Although the zircon U-Pb geochronology database is of great significance to the study of geoscience, the existence of hot data, which originates in excessive research on some specific areas or topics, affects the objectivity of the database to a certain extent. Ideally, to calculate the U-Pb age distribution of zircons in the continental crust, simple random sampling of zircons in the continental crust should be performed (Puetz et al. Citation2018). However, under practical research conditions, random sampling is difficult to achieve. Especially in some cases, researchers have been more inclined to study areas of research focus, namely, areas that are popular among researchers and prone to over-sampling. In addition, researchers typically gather zircons by a combination of convenience sampling (predetermined site selection based on specific geological questions under investigation) and cluster sampling (collecting a cluster of zircons at the site, rather than a single zircon grain) (Puetz et al. Citation2018). Therefore, hot data are inevitable in the U-Pb geochronology database. However, hot data caused by nonrandom samples increase the likelihood of biased estimates (Etikan, Musa, and Alkassim Citation2016).
On the basis of previous research, further statistical analysis and processing of zircon U-Pb ages from the perspective of time are conducted in this paper, which is organized as follows: in Section 2 we describe the database used in this research and the methods applied on the age error fitting and Gaussian multipeak fitting. Section 3 presents the results of the computations. Section 4 discusses measuring the impact of hot data, different time scales of zircon growth peaks, zircon growth of various lithologies and the correspondence between zircon growth peaks and geological events. Finally, in Section 5 we summarize our work and draw conclusions.
2. Data and methods
2.1. Data
The data used in this study are obtained from a database that houses single-grain zircon U-Pb geochronological data for the Chinese continental crust (Fang et al. Citation2018; Wu et al. Citation2019). The database has 543,978 geochronological records and incorporates its data from more 10,000 journals accessed through the China National Knowledge Infrastructure (CNKI) and Elsevier Science, covering to the end of 2017. The geochronological data within the database comprise eight major data categories: data number, element and isotope contents, isotope ratios and their errors, ages and their errors, experimental methods, sample background, quality control, and other supplementary data. According to the lithology of the zircon host rock, the U-Pb chronological data in the database can be divided into three categories: sedimentary rock, igneous rock and metamorphic rock. However, the host rocks of some U-Pb samples are unknown. The database records are segregated into four lithology classifications: 164,845 sedimentary, 232,747 igneous, 123,594 metamorphic (including gneiss), and 22,792 with unknown lithologies.
2.2. Methods
2.2.1. Age error fitting
The first step was to obtain concordant ages from the database. Concordant ages were evaluated from ages derived from 206Pb/238U, 207Pb/235U and 207Pb/206Pb ratios. If the age data for a given sample point had all three age types and these three values were consistent within a 1σ absolute error range (or the sample point had only two age types, with both values within a 1σ absolute error range), then they were considered concordant ages (Spencer, Kirkland, and Taylor Citation2016).
The second step calculated the fitting curves of age errors. Absolute errors of different ages were calculated on the basis of the concordant ages. To make statistical age errors close to real errors, the idea of the Riemann sum (Guillemin Citation1997; Philippe and Robert Citation2001) was introduced into the calculation of age errors. The time-axis resolution was set to 1 Ma in this research. Then, mean age errors in each age interval were calculated to obtain error curves that changed with age. Considering the various chronometers, we performed separate statistical analyses on the ages from 206Pb/238U, 207Pb/235U and 207Pb/206Pb ratios, before which abnormal data were removed using the box plot method (Williamson, Parker, and Kendrick Citation1989). For each age interval, an expected value for the age errors in each interval was calculated and assigned its median value, yielding a series of age-error data. Next, scatter plots were drawn with the absolute error of age plotted along the vertical axis (y) and age along the horizontal axis (x). These scatter plots were fitted using various functions. The BoxLucas1 model (Fang et al. Citation2018; Wu et al. Citation2019) was used to fit the ages derived from 206Pb/238U and 207Pb/235U ratios:(1)
(1)
In contrast, the fitting function for the 207Pb/206Pb age was the Log3P1 model (Fang et al. Citation2018; Wu et al. Citation2019), given by:(2)
(2)
The third step was to predict age errors. Based on the fitting curves of age errors, the prediction interval of age error at the 95% confidence level was calculated. The fitting results of each curve are shown in . Scatter diagrams of age errors, as well as fitting curves and prediction interval zones, are shown in .
Figure 1. Absolute age error scatter plots, error fitting curves and prediction interval zones at the 95% confidence level: (a) 206Pb/238U ages; (b) 207Pb/235U ages; (c) 207Pb/206Pb ages.
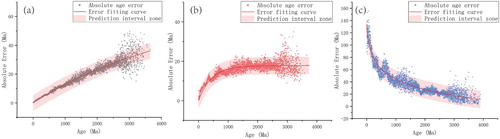
Table 1. Error fitting curves for different age types.
In the final step, the recommended ages were derived based on the statistic results of the database. By comparing the absolute error curves of all three age types, we could obtain ages with the smallest errors in different times, that is, the recommended age. According to the fitting function of the error curves, intersection points were calculated to obtain the thresholds of the recommended ages. The ages derived from 206Pb/238U, 207Pb/235U and 207Pb/206Pb ratios were the recommended ages for zircons younger than 1394.64 Ma, between 1394.64 and 2994.46 Ma and older than 2994.46 Ma, respectively. Since the majority of zircon ages are younger than 2994.46 Ma in the database, only 206Pb/238U and 207Pb/235U ages were included in subsequent statistics.
2.2.2. Gaussian multipeak fitting
Concordant ages were binned with 5 Ma resolution and frequencies of 206Pb/238U, 207Pb/235U and 207Pb/206Pb ages were counted, and Gaussian multipeak fitting (Guo Citation2011) was carried out to explore the characteristics of zircon growth in geological history. The Gauss model in the Origin software was used for Gaussian multipeak fitting, and the specific equation is as follows:
(3)
(3) where y0 is offset, A is area, w is width and xc is center.
The Levenberg–Marquardt optimization algorithm (Singh, Gupta, and Gupta Citation2007) was used for Gaussian multipeak fitting, which might obtain local optimum results. Considering this factor, the initial values of Gaussian peaks were set before implementing fitting depending on the visualization of the age frequency histogram so that the global optimum was obtained.
The mean value (xc), standard deviation (σ), FWHM (full width at half maxima) and height of each single Gaussian peak were obtained by Gaussian multipeak fitting. To measure the relationship between the standard deviation of the Gaussian peak () and that of the experiment (
), the W index was defined as follows:
(4)
(4)
In the formula above, the experimental standard deviation () represents the upper limit of the prediction interval of the absolute age error fitting curve at the 95% confidence level. To measure the aspect ratio of a Gauss peak, the Y index was defined as follows:
(5)
(5)
To fully study peak periods of zircon growth in geological history, this paper presents Gaussian multipeak fitting for the zircon U-Pb geochronology data of all lithologies and of single lithologies (sedimentary rock, igneous rock and metamorphic rock). To analyze zircon growth at different time scales, the first step was to apply Gaussian multipeak fitting to data for the whole geological history to identify great zircon growth peaks on a long-term scale. The second step was to research zircon growth in detail on a shorter time scale, dividing geological history into four stages, namely, stage IV, stage III, stage II and stage I. The Section 4.3 results identify these temporal stages. Then, Gaussian multipeak fitting was applied to the data of each stage, after which a series of peaks were obtained, which represented secondary geological events within great peaks.
3. Results
3.1. All lithologies
Age frequency statistics and Gaussian multipeak fitting were conducted on 206Pb/238U and 207Pb/235U ages of all lithologies, which could obtain the mean value, standard deviation, W index (Equation (4)), and Y index (Equation (5)) of zircon growth peaks (Gaussian peaks), as well as the upper limit of prediction interval for the absolute error of the mean value at the 95% confidence level. The results are shown in and . What should be noted is the criteria of the concordant ages, the concordance of which is for each sample test point, i.e. each data record in the database. Considering this, when hundreds of thousands of records are calculated for statistics, results of different age types are unnecessary to be the same. However, it is apparent that the peak periods of zircon growth obtained from 206Pb/238U and 207Pb/235U ages are almost the same in this study.
Table 2. Zircon growth peaks of 206Pb/238U ages.
Table 3. Zircon growth peaks of 207Pb/235U ages.
The statistical results are of great geological significance and correspond well to major geological events in geological history: the Himalayan orogeny, Yanshanian orogeny, Indosinian orogeny, Caledonian orogeny, Jinning orogeny, Lvliang orogeny and Wutai orogeny. Although these results were obtained through big data statistics, which largely eliminated human factors and had strong credibility, there were also some problems affecting the objectivity of the data.
Because of convenience sampling, cluster sampling and hot research sampling, scholars have oversampled zircon in some regions. The existence of these hot data may cause deviations in the big data analytical results. However, hot data are difficult to identify and eliminate. First, geochronological studies around the world are continuing, with the amount of zircon U-Pb data continuing to increase, so there is no objective standard for the quantity of zircon U-Pb age data that a region should contain. Second, when there are too many zircon U-Pb age entries in an area, we do not have a proper and scientific method to determine whether the large quantity in this area is due to hot research or to the original large zircon quantity in this area.
For different lithologies, the sources of hot data ought to be various. Given this situation, the age data of each lithology were separated for statistics, aiming to decipher some implications.
3.2. Single lithology
Similar to the method described in section 3.1, age frequency statistics and Gaussian multipeak fitting were conducted on 206Pb/238U and 207Pb/235U ages of each single lithology (sedimentary rock, igneous rock and metamorphic rock), which yielded the mean value, standard deviation, W index, and Y index of zircon growth peaks (Gaussian peaks), as well as the upper limit of the prediction interval for the absolute error of the mean value at the 95% confidence level. The results are shown in and ().
Figure 2. Gaussian multipeak fitting of zircon growth for great geological events in the whole Earth history: (a) 206Pb/238U ages of all lithologies; (b) 207Pb/235U ages of all lithologies; (c) 206Pb/238U ages of sedimentary rocks; (d) 207Pb/235U ages of sedimentary rocks; (E) 206Pb/238U ages of igneous rocks; (f) 207Pb/235U ages of igneous rocks; (g) 206Pb/238U ages of metamorphic rocks; (H) 207Pb/235U ages of metamorphic rocks.
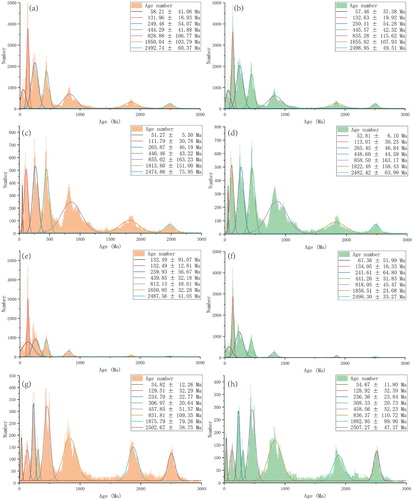
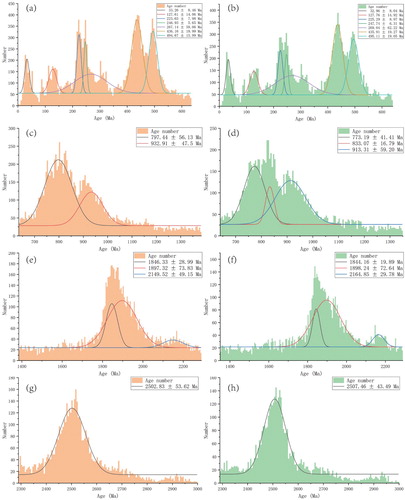
Figure 3. Gaussian multipeak fitting of zircon growth for detailed geological events at each stage using zircons from all lithologies: (a) Stage IV 206Pb/238U ages; (b) Stage IV 207Pb/235U ages; (c) Stage III 206Pb/238U ages; (d) Stage III 207Pb/235U ages; (E) Stage II 206Pb/238U ages; (f) Stage II 207Pb/235U ages; (g) Stage I 206Pb/238U ages; (H) Stage I 207Pb/235U ages.
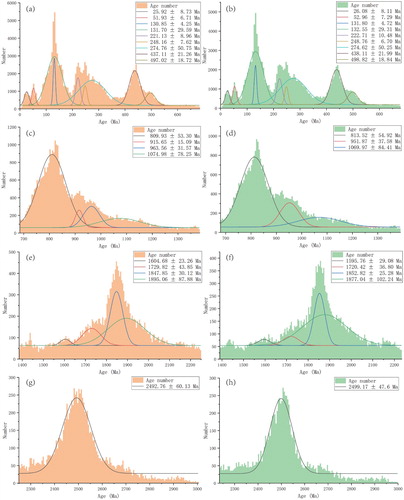
Figure 4. Gaussian multipeak fitting of zircon growth for detailed geological events in each stage using zircons from sedimentary rocks. The plot structure and conventions are the same as those in .
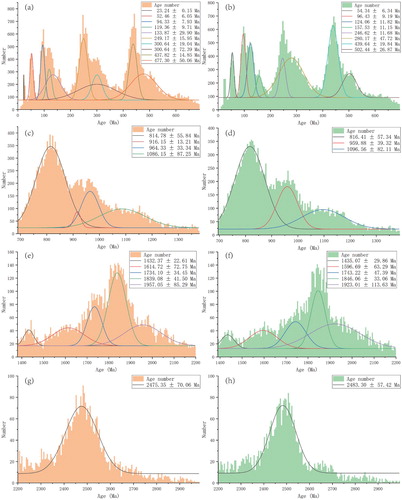
Figure 5. Gaussian multipeak fitting of zircon growth for detailed geological events at each stage using zircons from igneous rocks. The plot structure and conventions are the same as those in .
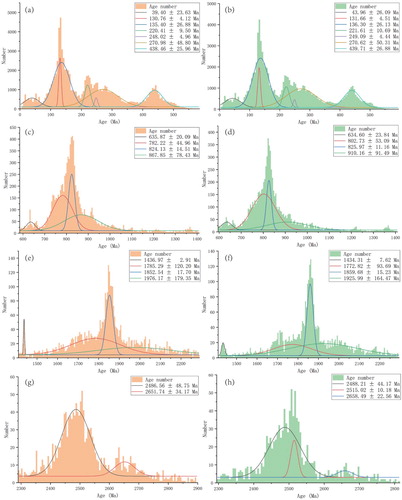
Figure 6. Gaussian multipeak fitting of zircon growth for detailed geological events in each stage using zircons from metamorphic rocks. The plot structure and conventions are the same as those in .
4. Discussion
4.1. Measurement of hot spot data effect
4.1.1. W index
When certain areas are over-sampled, redundant zircon growth peaks (hot data peaks) would be derived due to these hot data. Fortunately, the statistical method of mean squared weighted deviations or MSWD (Wendt and Carl Citation1991) provides a reference to analyze the characteristics of hot data peaks. The MSWD is the square of the deviation of each data point from the fitting line divided by the degrees of freedom (the number of data points minus 2), which is commonly used in statistical tests of regression validity, such as the validity of isochronal regression. MSWD measures the degree of data point deviation from the fitting or the degree of data point dispersion relative to the expected dispersion of experimental analytical error. If MSWD < 1, the data points are more concentrated than those expected from experimental analysis errors. From the mathematical point of view, although the data display a good linear relationship, this result actually occurs because the quoted analysis error is overestimated or the error of the experimental instrument is large. If MSWD > 1, the data points are more diffuse than those expected from experimental analysis errors, which indicates that the fitting validity is poor or that it is an error isochrone.
In this study, the idea of MSWD is introduced into the analysis of the W index, which means the ratio of the Gaussian standard deviation to the experimental standard deviation. The premise is that the experimental standard deviation is the upper limit of the prediction interval of the absolute age error fitting curve at the 95% confidence level. If W < 1 or W ≈ 1, the standard deviation of the zircon growth peak is too small, even smaller than the experimental analytical standard deviation. In this case, the peak of zircon growth is probably caused by research focused on regional events, that is, the hot spot effect. Therefore, the Gaussian standard deviation of the hot peak is not more than but roughly at the same level as the experimental analytical error. If W > 1, the span of the zircon growth peak is larger than that of the hot peak. The larger the W, the longer the time span of the zircon growth peak relative to the hot peak is, which can cover a hot peak to a greater extent and weaken the influence of hot spot data on the overall data statistics. Furthermore, as the amount of data increases, the hot data effect decreases.
To analyze the hot spot effect on the zircon growth peaks in geological history, the Gaussian multipeak fitting results of small events in different stages were studied, and their W indexes were analyzed. As described above, the larger the W value is, the smaller the influence of hot data on the peak of zircon growth. Take the statistical results for zircon data of all lithologies as an example. There are some zircon growth peaks corresponding to relatively low W indexes. It is apparent that the Gaussian standard deviations of these peaks are smaller than those of the experiments; thus, the peaks are greatly influenced by hot data, indicating that the peaks with low W indexes should be explained with great caution. The specific zircon growth peaks and their corresponding W indexes are as follows: for 206Pb/238U ages (), 130.85 ± 4.25 Ma, 248.16 ± 7.62 Ma, 915.65 ± 15.09 Ma and 1604.68 ± 23.26 Ma correspond to low W indexes of 0.58, 0.86, 0.87 and 0.94, respectively; for 207Pb/235U ages (), 131.80 ± 4.72 Ma, 222.71 ± 10.48 Ma and 248.76 ± 6.70 Ma present low W indexes of only 0.52, 0.91 and 0.55, respectively.
Of course, the higher the better is not always true for the W index. A peak of zircon growth with an overly large W index also needs to be constrained. See section 4.1.2 for details.
4.1.2. Y index
Although regional zircon sampling biases lead to hot peaks of zircon growth, this fact does not exclude that scholars carried out geochronological tests on samples of each age in order to study comprehensively, which would produce homogenization effects on age frequency; that is, the age frequency of zircons in each age would tend to be the same. Equation (3) shows that the Gaussian multipeak fitting function has an intercept term y0, while the Gaussian function actually has no intercept as follows:(6)
(6) where a is amplitude, µ is mean and
is standard error. In other words, the intercept term y0, which does not exist in the real Gaussian distribution, is also a reflection of the homogenization effect. When the homogenization effect is relatively weak, the age frequency of each age does not completely converge but produces a ‘zircon growth peak’ with a very small height but a very large width (i.e. a large time span). To analyze this special hot spot effect, i.e. the homogenization effect, measurement of the Y index is introduced.
The Y index indicates the aspect ratio of a Gaussian peak. The larger the Y index is, the bigger the homogenization effect on the zircon growth peak. If a Y index is too large, i.e. larger than 1, it indicates that the zircon growth peak is too flat to have practical geological significance. This situation can be exemplified by the statistical results for zircon data of all lithologies presented in and . The Y indexes of some zircon growth peaks are relatively high. Therefore, these peaks are too flat to have significant geological meanings, even though they have relatively large W indexes and are hardly affected by hot data. In more detail, the zircon growth peaks with 206Pb/238U ages of 1074.98 ± 78.25 Ma, 1604.68 ± 23.26 Ma, 1729.82 ± 43.85 Ma and 1895.06 ± 87.88 Ma have high Y indexes of 1.76, 1.86, 1.29 and 1.63, respectively (). In , the peaks with 207Pb/235U ages of 1069.97 ± 84.41 Ma, 1595.76 ± 29.08 Ma, 1720.42 ± 36.80 Ma and 1877.04 ± 102.24 Ma, are shown with high Y indexes approximately equal to or larger than 2.
4.2. Time scale of geological events
In regard to the durations of zircon growth events throughout geological history, their variety is apparent. According to the age error fitting curves obtained in section 2.2.1, absolute errors of 206Pb/238U and 207Pb/235U ages increase with ages which result in time scales of zircon growth that cannot be classified simply by the standard deviation of a Gaussian peak, since with increasing age, the standard deviation of the Gaussian peak increases as well (shown in ), displaying a ‘longer’ duration of the geological event. The standard deviations of zircon growth peaks of 206Pb/238U and 207Pb/235U ages are drawn in scatter plots. The points on each scatter plot are obviously divided into two regions, i.e. upper left and lower right, as shown in . Considering the standard deviation of the zircon growth peak and the age-error, zircon growth events are divided into two scales based on the scatter plots. Given the influence of dating error, zircon growth peaks with younger ages are preferred to distinguish time scales. In detail, standard deviation of 20 Ma (roughly, 10–30Ma) is recommended to be the threshold according to .
Figure 7. Distribution of means and standard deviations of zircon growth peaks for all lithologies. (A) 206Pb/238U ages; (b) 207Pb/235U ages.
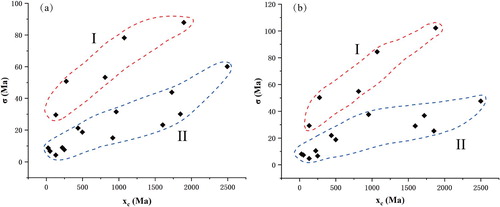
First-order zircon growth peaks (I): the zircon growth during each peak lasts for a long time, i.e. the vertical axis intercept of the classification is larger than 20 Ma. The Gaussian peaks correspond to the Lvliang orogeny, Jinning orogeny, Indosinian orogeny and Yanshanian orogeny. With long time spans, these events were likely caused by plate movements, such as supercontinent breakup, or climate events that last for several cycles, such as snowball Earth events.
Second-order zircon growth peaks (II): the duration of zircon growth is relatively short, i.e. the vertical axis intercept of the classification is smaller than 20 Ma. Such peaks are probably caused by short-term tectonic or climate events, including the Wutai orogeny, Caledonian orogeny, and a series of events around the Lvliang orogeny and Indosinian orogeny. The growth of the earth's crust results from the combination of internal and external dynamic. During the orogenic process, climatic factor could induce crustal decompression and metamorphism, with the growth of zircon. In the past 20 years, researches on young active orogeny, especially Himalayan orogeny, indicate that the dynamics of subduction and mountain-building can be controlled by the processes of erosion, and ultimately climate (Beaumont et al. Citation2001; Zeitler et al. Citation2001; Lamb and Davis Citation2003; Yu et al. Citation2011; Tu et al. Citation2015).
For all the long-duration events (i.e. first-order zircon growth peaks), the W indices are high, which means these events are hardly influenced by hot spot data effect. However, events with larger Y indices do not necessarily last long, but with larger difference in statistic results of 206Pb/238U and 207Pb/235U ages, maybe for strong homogenization effect.
4.3. Zircon growth of a single lithology
To study the similarities and differences in zircon growth peaks derived from different single lithologies, the growth situations of zircon in section 3.2 were compared with one another, while the Gaussian peaks greatly influenced by hot data were not considered.
Stage I: Sedimentary rocks, igneous rocks and metamorphic rocks all have significant zircon growth peaks close to 2.50 Ga, while igneous rocks also include an active period of zircon growth at approximately 2.65 Ga.
Stage II: Significant zircon growth peaks close to 1.85 Ga are present in sedimentary rocks, igneous rocks and metamorphic rocks.
Stage III: At 0.80–0.82 Ga, there are obvious zircon growth peaks in all three lithologies; it should be noted that before 0.9 Ga, igneous zircons did not grow in large quantities, but there are zircon growth peaks in sedimentary rocks at 0.96 Ga and in metamorphic rocks at 0.93 Ga.
Stage IV: There are apparent zircon growth peaks at ca. 0.44 Ga (sedimentary rock: 437.82 ± 14.85 Ma, igneous rock: 438.46 ± 25.96 Ma, and metamorphic rock: 436.16 ± 19.99 Ma), 0.25–0.27 Ga (sedimentary rock: 249.17 ± 15.95 Ma, igneous rock: 270.98 ± 48.80 Ma, and metamorphic rock: 267.14 ± 59.06 Ma) and ca. 0.13 Ga (sedimentary rock: 133.87 ± 29.90 Ma, igneous rock: 135.40 ± 26.88 Ma, and metamorphic rock: 127.61 ± 14.0 Ma) for all three lithologies. There are also zircon growth peaks at 0.48-0.49 Ga in sedimentary rocks and metamorphic rocks, in detail, 477.30 ± 50.06 Ma in sedimentary rocks and 494.67 ± 15.99 Ma in metamorphic rocks. Moreover, zircon growth peaks are found at 94.33 ± 7.93 Ma, 119.36 ± 9.71 Ma and 300.64 ± 19.04 Ma in sedimentary rocks and at 39.40 ± 23.63 Ma and 220.41 ± 9.50 Ma in igneous rocks.
The growth peaks of zircons from different single lithologies have a generally consistent evolution trend in geological history, which verifies the scientificity of big data analysis as well as the unity between statistical results and geological events. Yet, there are some disagreements, which may result from the formation and evolution characteristics of different types of rocks.
4.4. Zircon growth and geological events
Peak at 2.50 Ga (207Pb/235U age: 2498.95 ± 49.51 Ma): The peak of zircon growth is consistent with the beginning of the Proterozoic and the period of Wutai orogeny in the North China Craton. The time node of 2.50 Ga, which is the boundary between the Archean and Proterozoic, the end of the era of granite-greenstone terrane development and the onset of an oxygen atmosphere, is of great significance in geological history. During 2.55–2.50 Ga, an abnormally large granitic intrusion was exposed in the eastern part of the North China Craton. A mantle plume and the large amount of heat generated by the plume resulted in widespread melting of the upper mantle and lower crust (Zhao Citation2009), forming great quantities of granitic magma (TTG), which promoted large-scale formation of zircons. Zircon dating shows that both the Hengshan and Fuping complexes were intruded by major granitoid bodies between 2.52 and 2.48 Ga (Kröner et al. Citation2005a). Kusky (Citation2011a) proposed that from 2.55–2.5 Ga, an arc terrain (the Wutai arc) with a forearc ophiolite belt on its leading edge (Kusky, Li, and Tucker Citation2001; Kusky et al. Citation2004, Citation2011; Kusky and Li Citation2010) collided with the passive margin on the western edge of the Eastern Block, above a west-dipping subduction zone (Zhao et al. Citation2012).
Peak at 1.85 Ga (207Pb/235U age: 1855.82 ± 107.93 Ma): This zircon growth peak corresponds to the beginning of the Paleoproterozoic Satherian Period and is consistent with the Lvliang orogeny, which occurred at ∼1.85 Ga, representing the main deformation and metamorphism of the Paleoproterozoic basement of the North China Craton. All metamorphic ages obtained for the Trans-North China Orogen are approximately 1.85 Ga, which establishes that the final amalgamation of the Western and Eastern blocks of the craton occurred at ∼1.85 Ga (Zhao et al. Citation2012). In addition, the Columbia (Nuna) supercontinent was formed at 1.80–1.60 Ga (Pisarevsky et al. Citation2014; Nordsvan et al. Citation2018; Kirscher et al. Citation2019), the time of which is most likely relevant to this peak. At 1.8 Ga, the collision between the northern North China Craton and the Columbia supercontinent (Kusky Citation2011a) led to a wide range of high-grade metamorphism and obscured previous geological events, containing typical rocks in Mount Wutai and Mount Heng.
Peak at 0.83 Ga (206Pb/238U age: 828.88 ± 106.77 Ma): This peak corresponds to the Jinning orogeny. The Jinning orogeny represented a collision orogenic event between the Yangtze ancient landmass and the Southeast ancient landmass of China, which occurred from the late Mesoproterozoic to early Neoproterozoic and lasted approximately 200 Ma, from 1000 Ma to 800 Ma (Hao, Li, and Hu Citation1992). The Jinning orogeny began at the end of Mesoproterozoic (1000 Ma), ended the Mesoproterozoic marine sedimentation in the area and caused the rock to deform and metamorphose. In the early Neoproterozoic (900 ± 50 Ma), magmatic intrusions and large-scale uplift occurred until new transgressive sedimentation began (800 Ma). The area as a whole was on land and experienced weathering and erosion, so that the synorogenic intrusive body was denuded to the Earth's surface. Furthermore, this peak is likely to be relevant to the breakup-convergence cycle of the Rodinia supercontinent, which is a late Mesoproterozoic to Neoproterozoic supercontinent that was assembled at 1100–900 Ma and broke up at 830–720 Ma (Ernst et al. Citation2008; Ernst et al. Citation2016; Zhang et al. Citation2012e; Lü et al. Citation2018). New observations and age data from China suggest that the breakup of Rodinia started with plume-related magmatism at 830–800 Ma (Zhang et al. Citation2012e; Cui et al. Citation2012). It has been suggested that the rifting away of South China from Laurentia was initiated by a ca. 780 Ma mantle plume during the breakup of Rodinia, with the mantle plume activity causing widespread crustal growth in South China in the Neoproterozoic (830–740 Ma) (Wang et al. Citation2010).
Peak at 0.44 Ga (206Pb/238U age: 444.29 ± 41.88 Ma): This zircon growth peak corresponds to the boundary between the Ordovician and Silurian Periods during the Caledonian orogeny and Guangxi orogeny (in China). The Guangxi orogeny proposed by Ting (Citation1929) represented a tectonic movement indicated by an unconformity between the Devonian and its underlying strata that prevailed across South China, which began in the Late Ordovician Katian age (453.0 ± 0.7–445.2 ± 1.4 Ma) (Chen et al. Citation2010) and resulted in large-scale granitic magma emplacement and a small amount of intermediate-basic magmatic activity distributed between the Yangtze and Huaxia regions. The ages of A-type granites and basic rocks formed against an extensional background are concentrated from 450–415 Ma (Yao et al. Citation2012; Wang et al. Citation2013; Feng et al. Citation2014; Zhong et al. Citation2014), and the time of metamorphism is mainly concentrated between 450 and 420 Ma (Li et al. Citation2011; Chen et al. Citation2014; Wang et al. Citation2013).
Peak at 0.25 Ga (206Pb/238U age: 249.46 ± 54.07 Ma): This peak corresponds to the boundary between the Paleozoic and Mesozoic Eras in the active stage of Indosinian orogeny. Professor Huang Jiqing proposed the Indosinian cycle in 1945 as the first part of the Alpine cycle in Asia, during which crustal movement of regional folds occurred in the northwest Zhejiang region for the first time (You and Huang Citation1983). During the Middle and Late Triassic, the main episode of early Indosinian orogeny (Huaiyang orogeny) occurred. In terms of structural changes, the eastern continental margin active belt and other places in China were generally uplifted. Regarding magmatic activity, the magmatic intrusion of the early Indosinian period and the main episode of Indosinian are reflected in the Jiangnan uplift belt and the Fujian-Guangdong, Jiaodong-Liaoning, Jilin-Heilongjiang and Qinling belts (Cui and Li Citation1983). The Late Permian to Triassic was a critical period in the amalgamation of the South China Craton and is marked by widespread tectonothermal activity, namely the Indosinian orogeny (Yang et al. Citation2012; Wang et al. Citation2013).
Peak at 0.13 Ga (206Pb/238U age: 131.96 ± 18.93 Ma): This peak is consistent with the Yanshanian orogeny. The Yanshanian orogeny was a strong tectonic movement during the Jurassic and Cretaceous in eastern China. Widespread magmatism related to the Yanshanian orogeny has been documented to have formed a very large late Mesozoic magmatic belt in East Asia (Deng et al. Citation2015). Numerous ages and structural constraints consistently indicate that the Yanshanian orogeny was characterized by alternating stages of crustal shortening at ∼170–136 Ma (Dong et al. Citation2018) and crustal extension at ∼135–90 Ma (Niu et al. Citation2004; Li et al. Citation2013b; Chen et al. Citation2014; Xia et al. Citation2016).
Peak at 0.06 Ga (206Pb/238U age: 58.21 ± 41.06 Ma): This peak corresponds to the Himalayan orogeny. The closure of the northward-subducting Neotethyan lithosphere and the onset of collision between India and Asia to initiate the Himalaya orogeny have been dated to the middle Paleocene (59 ± 1 Ma; DeCelles et al. Citation2014; Wu et al. Citation2014; Hu et al. Citation2015). During the early Himalayan orogeny, the Indian Plate collided widely with Eurasia, and strong tectonic deformation and active tectonic movement occurred in the western part of China, resulting in a widespread unconformity contact relationship. The formation of lithospheric extensional basins in South China and large-scale volcanic eruptions (92–38 Ma) mainly occurred in the Middle and Late Cretaceous to Tertiary. In the early Eocene, the source area of volcanism changed suddenly from the lower crust to the upper mantle, indicating large-scale extension and thinning of the lithosphere in South China at this time (Jia, He, and Lu Citation2004).
5. Conclusions
We had previously studied the episodes and spatial distribution of zircon growth in the Chinese continental crust, but it is not comprehensive enough (Fang et al. Citation2018; Wu et al. Citation2019). In this work, we implemented further statistical analysis and processing on zircon U-Pb ages from the perspective of time.
The single-grain zircon U-Pb chronology database of the Chinese continental crust provides a good platform for big data analysis. By analyzing the chronological data, a series of important zircon growth peak periods in Earth history can be obtained. However, hot data affect the objectivity of the database. To evaluate the impact of hot data on statistical results, the W and Y indexes are introduced in this paper to measure the influences of hot spot and homogenization effects on zircon growth peaks, respectively, by which the range of zircon growth peaks is restricted.
Considering the differences in the time scales of zircon growth peaks, these peaks are divided into two categories. First-order zircon growth peaks (I) have long durations, which may be caused by plate movements or climate events that last for multiple cycles, such as supercontinent breakup and snowball Earth events. Second-order zircon growth peaks (II) have relatively short durations of zircon growth, which may result from factors such as short-term tectonic or climate events. Standard deviation of 20 Ma (roughly, 10–30Ma) is recommended to be the threshold of the vertical axis intercept of the category.
The growth peaks of zircons from different single lithologies are generally similar in geological history. But, there are some disagreements, which may result from the formation and evolution characteristics of different lithologies.
The peak periods of zircon growth obtained in this contribution correspond to major geological events of crustal evolution, which are listed as follows: 2498.95 ± 49.51 Ma, Wutai orogeny; 1855.82 ± 107.93 Ma, Lvliang orogeny; 828.88 ± 106.77 Ma, Jinning orogeny; 444.29 ± 41.88 Ma, Caledonian orogeny; 249.46 ± 54.07 Ma, Indosinian orogeny; 131.96 ± 18.93 Ma, Yanshanian orogeny; and 58.21 ± 41.06 Ma, Himalayan orogeny.
Acknowledgments
We acknowledge the single-grain zircon U-Pb geochronological database of the Chinese continental crust (Fang et al. Citation2018; Wu et al. Citation2019), which incorporates data from more than 10,000 articles accessed through the China National Knowledge Infrastructure (CNKI) and Elsevier Science, covering to the end of 2017.
Disclosure statement
No potential conflict of interest was reported by the author(s).
Additional information
Funding
References
- Armstrong, R. A., W. Compston, M. J. de Wit, and I. S. Williams. 1990. “The Stratigraphy of the 3.5-3.2 Ga Barberton Greenstone Belt Revisited: A Single Zircon ion Microprobe Study.” Earth and Planetary Science Letters 101 (1): 90–106. doi: 10.1016/0012-821X(90)90127-J
- Beaumont, C., R. A. Jamieson, M. H. Nguyen, and B. Lee. 2001. “Himalayan Tectonics Explained by Extrusion of a low-Viscosity Crustal Channel Coupled to Focused Surface Denudation.” Nature 414 (6865): 738–742. doi: 10.1038/414738a
- Chen, X., Y. D. Zhang, J. X. Fan, J. F. Cheng, and Q. J. Li. 2010. “Ordovician Graptolite-Bearing Strata in Southern Jiangxi with a Special Reference to the Kwangsian Orogeny.” Science China (Earth Sciences) 53 (11): 1602–1610. doi: 10.1007/s11430-010-4117-6
- Chen, Y., G. Zhu, D. Z. Jiang, and S. Z. Lin. 2014. “Deformation Characteristics and Formation Mechanism of the Yunmengshan Metamorphic Core Complex.” Chinese Science Bulletin 59: 2419–2438. doi: 10.1007/s11434-014-0167-z
- Cui, X. Z., X. S. Jiang, J. Wang, J. W. Zhuo, G. Q. Xiong, J. Z. Lu, J. H. Liu, Z. J. Wang, and Q. Deng. 2012. “Zircon U-Pb age of Jinkouhe Diabase Dykes in Ebian Area of Western Sichuan Province and its Implications for the Breakup of Rodinia.” Geol. Bull. China 31 (7): 1131–1141. (in Chinese with English abstract).
- Cui, S. Q., and J. R. Li. 1983. “On the Indosinian Movement of China's Coastal Pacific Belt.” Acta Geologica Sinica 1: 51–61.
- Davis, D. W., I. S. Williams, and T. E. Krogh. 2003. “Historical Development of Zircon Geochronology.” Reviews in Mineralogy and Geochemistry 53 (1): 145–181. doi: 10.2113/0530145
- DeCelles, P. G., P. Kapp, G. E. Gehrels, and L. Ding. 2014. “Paleocene-Eocene Foreland Basin Evolution in the Himalaya of Southern Tibet and Nepal: Implications for the age of Initial India-Asia Collision.” Tectonics 33: 824–849. doi: 10.1002/2014TC003522
- Deng, J. F., Y. F. Feng, Y. J. Di, C. Liu, Q. H. Xiao, S. G. Su, G. C. Zhao, F. Meng, and R. F. Che. 2015. “The Intrusive Spatial-Temporal Evolutional Framework in the Paleo-Asian Tectonic Domain.” Geology Reviews 61: 1211–1224.
- Dong, S. W., Y. Q. Zhang, H. L. Li, W. Shi, H. M. Xue, J. H. Li, S. Q. Huang, and Y. C. Wang. 2018. “The Yanshan Orogeny and Late Mesozoic Multi-Plate Convergence in East Asia—Commemorating 90th Years of the “Yanshan Orogeny.” Science China (Earth Sciences) 61 (12): 196–217. doi: 10.1007/s11430-017-9297-y
- Ernst, R. E., M. A. Hamilton, U. Söderlund, J. A. Hanes, D. P. Gladkochub, A. V. Okrugin, T. Kolotilina, et al. 2016. “Long-lived Connection Between Southern Siberia and Northern Laurentia in the Proterozoic.” Nature Geoscience 9: 464–469. doi: 10.1038/ngeo2700
- Ernst, R. E., M. T. D. Wingate, K. L. Buchan, and Z. X. Li. 2008. “Global Record of 1600–700 Ma Large Igneous Provinces (LIPs): Implications for the Reconstruction of the Proposed Nuna (Columbia) and Rodinia Supercontinents.” Precambrian Research 160: 159–178. doi: 10.1016/j.precamres.2007.04.019
- Etikan, I., S. A. Musa, and R. S. Alkassim. 2016. “Comparison of Convenience Sampling and Purposive Sampling.” American Journal of Theoretical and Applied Statistics 5 (1): 1–4. doi: 10.11648/j.ajtas.20160501.11
- Fang, X. J., Y. J. Wu, S. S. Liao, L. Z. Xue, Z. Chen, B. Song, L. Zhang, and J. Q. Ji. 2018. “Preliminary Analysis of the Chinese Sublibrary of the Chinese Crust Single-Grain Zircon U Pb Geochronology Database.” Acta Petrologica Sinica 34 (11): 3252–3265. (in Chinese).
- Feng, S. J., K. D. Zhao, H. F. Ling, P. R. Chen, W. F. Chen, T. Sun, S. Y. Jiang, and W. Pu. 2014. “Geochronology, Elemental and Nd-Hf Isotopic Geochemistry of Devonian A-Type Granites in Central Jiangxi, South China: Constraints on Petrogenesis and Post-Collisional Extension of the Wuyi-Yunkai Orogeny.” Lithos 206–207: 1–18. doi: 10.1016/j.lithos.2014.07.007
- Guillemin, V. 1997. “Riemann-Roch for Toric Orbifolds.” Journal of Differential Geometry 45: 53–73. doi:10.4310/jdg/1214459754.
- Guo, H. 2011. “A Simple Algorithm for Fitting a Gaussian Function [DSP Tips and Tricks].” IEEE Signal. Processing Magazine 28 (5): 134–137. doi: 10.1109/MSP.2011.941846
- Hao, J., Y. J. Li, and W. H. Hu. 1992. “Relevant Issues of Jinning Movement and Sinian System.” Regional Geology of China 2: 131–140. (in Chinese).
- Hu, X., E. Garzanti, T. Moore, and I. Raffi. 2015. “Direct Stratigraphic Dating of India-Asia Collision Onset at the Selandian (Middle Paleocene, 59 ± 1 Ma).” Geology 43: 859–862. doi: 10.1130/G36872.1
- Jia, C. Z., D. F. He, and J. M. Lu. 2004. “Episodes and Geodynamic Setting of Himalayan Movement in China.” Oil and Gas Geology 25 (2): 121–125. 169.
- Kalsbeek, F., and A. P. Nutman. 1996. “Anatomy of the Early Proterozoic Nagssugtoqidian Orogeny, West Greenland, Explored by Reconnaissance SHRIMP U-Pb Zircon Dating.” Geology 24: 515–518. doi: 10.1130/0091-7613(1996)024<0515:AOTEPN>2.3.CO;2
- Kirscher, U., Y. Liu, Z. X. Li, R. N. Mitchell, S. A. Pisarevsky, S. W. Denyszyn, and A. Nordsvan. 2019. “Paleomagnetism of the Hart Dolerite (Kimberley, Western Australia) – a two-Stage Assembly of the Supercontinent Nuna?” Precambrian Research 329: 170–181. doi: 10.1016/j.precamres.2018.12.026
- Kröner, A., S. A. Wilde, J. H. Li, and K. Y. Wang. 2005a. “Age and Evolution of a Late Archaean to Early Palaeozoic Upper to Lower Crustal Section in the Wutaishan/Hengshan/Fuping Terrain of Northern China.” Journal of Asian Earth Sciences 24: 577–595. doi: 10.1016/j.jseaes.2004.01.001
- Kusky, T. M. 2011a. “Geophysical and Geological Tests of Tectonic Models of the North China Craton.” Gondwana Research 20 (1): 26–35. doi: 10.1016/j.gr.2011.01.004
- Kusky, T. M., and J. H. Li. 2010. “Origin and Emplacement of Ophiolites of the Central Orogenic Belt, North China Craton.” Journal of Earth Sciences 21: 744–781.
- Kusky, T. M., Z. H. Li, A. Glass, and H. A. Huang. 2004. “Archean Ophiolites and Ophiolite Fragments of the North China Craton.” In Precambrian Ophiolites and Related Rocks. Developments in Precambrian Geology, edited by T. M. Kusky, vol. 13, 223–274. Amsterdam: Elsevier.
- Kusky, T. M., J. H. Li, and R. D. Tucker. 2001. “The Archean Dongwanzi Ophiolite Complex, North China Craton: 2. 505-Billion-Year-old Oceanic Crust and Mantle.” Science 292: 1142–1145. doi: 10.1126/science.1059426
- Kusky, T. M., L. Wang, Y. Dilek, P. Robinson, S. B. Peng, and X. Y. Huang. 2011. “Application of the Modern Ophiolite Concept with Special Reference to Precambrian Ophiolites.” Science in China Series D: Earth Sciences 54: 1–27. doi: 10.1007/s11430-011-4175-4
- Lamb, S., and P. Davis. 2003. “Cenozoic Climate Change as a Possible Cause for the Rise of the Andes.” Nature 425 (6960): 792–797. doi: 10.1038/nature02049
- Li, L., M. Sun, Y. Wang, G. Xing, G. Zhao, K. Cai, and Y. Z. Zhang. 2011. “Geochronological and Geochemical Study of Palaeoproterozoic Gneissic Granites and Clinopyroxenite Xenoliths from NW Fujian, SE China: Implications for the Crustal Evolution of the Cathaysia Block.” Journal of Asian Earth Sciences 41 (2): 204–212. doi: 10.1016/j.jseaes.2011.01.017
- Li, J. H., Y. Q. Zhang, S. W. Dong, J. B. Su, J. J. Cui, and W. Shi. 2013b. “The Hengshan low-Angle Normal Fault Zone: Structural and Geochronological Constraints on the Late Mesozoic Crustal Extension in South China.” Tectonophysics 606: 97–115. doi: 10.1016/j.tecto.2013.05.013
- Lü, L. S., H. B. Li, X. N. Yang, J. Liu, B. Mao, and B. L. Li. 2018. “Neoproterozoic Magmatic Ni–Cu–(PGE) Sulfide Deposits Related to the Assembly and Breakup of the Rodinia Supercontinent in China: an Overview.” Ore Geology Reviews 99: 282–302. doi: 10.1016/j.oregeorev.2018.06.015
- Niu, B. G., Z. J. He, J. S. Ren, B. Song, and L. W. Xiao. 2004. “SHRIMP Geochronology of Volcanics of the Zhangjiakou and Yixian Formations, Northern Hebei Province, with a Discussion on the age of the Xing’anling Group of the Great Hinggan Mountains and Volcanic Strata of the Southeastern Coastal Area of China.” Acta Geologica Sinica-English Edition 78: 1214–1228. doi: 10.1111/j.1755-6724.2004.tb00778.x
- Nordsvan, A. R., W. J. Collins, Z. X. Li, C. J. Spencer, A. Pourteau, I. W. Withnall, P. G. Betts, and S. Volante. 2018. “Laurentian Crust in Northeast Australia: Implications for the Assembly of the Supercontinent Nuna.” Geology 46 (3): 251–254. doi: 10.1130/G39980.1
- Pell, S. D., T. S. Williams, and A. R. Chivas. 1997. “The use of Protolith Zircon-age Fingerprints in Determining the Protosource Areas for Some Australian Dune Sands.” Sedimentary Geology 109 (3): 233–260. doi: 10.1016/S0037-0738(96)00061-9
- Philippe, A., and C. P. Robert. 2001. “Riemann Sums for MCMC Estimation and Convergence Monitoring.” Statistics and Computing 11: 103–115. doi:10.1023/A:1008926514119.
- Pisarevsky, S. A., S. A. Elming, L. J. Pesonen, and Z. X. Li. 2014. “Mesoproterozoic Paleogeography: Supercontinent and Beyond.” Precambrian Research 244: 207–225. doi: 10.1016/j.precamres.2013.05.014
- Puetz, S. J., C. E. Ganade, U. Zimmermann, and G. Borchardt. 2018. “Statistical Analyses of Global u-pb Database 2017.” Geoscience Frontiers 9 (1): 121–145. doi: 10.1016/j.gsf.2017.06.001
- Singh, V., I. Gupta, and H. O. Gupta. 2007. “ANN-based Estimator for Distillation Using Levenberg–Marquardt Approach.” Engineering Applications of Artificial Intelligence 20 (2): 249–259. doi: 10.1016/j.engappai.2006.06.017
- Spencer, C. J., C. L. Kirkland, and R. J. M. Taylor. 2016. “Strategies Towards Statistically Robust Interpretations of in Situ U–Pb Zircon Geochronology.” Geoscience Frontiers 7 (4): 581–589. doi:10.1016/j.gsf.2015.11.006.
- Ting, V. K. 1929. “The Orogenic Movement in China.” Bulletin of the Geological Society of China 8 (1): 151–170.
- Tu, J. Y., J. Q. Ji, D. X. Sun, J. F. Gong, D. L. Zhong, and B. F. Han. 2015. “Thermal Structure, Rock Exhumation, and Glacial Erosion of the Namche Barwa Peak, Constraints From Thermochronological Data.” Journal of Asian Earth Sciences 105: 223–233. doi: 10.1016/j.jseaes.2015.03.035
- Wang, Y., W. Fan, G. Zhang, and Y. Zhang. 2013. “Phanerozoic Tectonics of the South China Block: key Observations and Controversies.” Gondwana Research 23 (4): 1273–1305. doi: 10.1016/j.gr.2012.02.019
- Wang, Q., D. A. Wyman, Z. X. Li, Z. W. Bao, Z. H. Zhao, Y. X. Wang, P. Jian, Y. H. Yang, and L. L. Chen. 2010. “Petrology, Geochronology and Geochemistry of ca. 780Ma A-Type Granites in South China: Petrogenesis and Implications for Crustal Growth During the Breakup of the Supercontinent Rodinia.” Precambrian Research 178 (1-4): 185–208. doi: 10.1016/j.precamres.2010.02.004
- Wang, Y., A. Zhang, W. Fan, Y. Zhang, and Y. Zhang. 2013. “Origin of Paleosubduction-Modified Mantle for Silurian Gabbro in the Cathaysia Block: Geochronological and Geochemical Evidence.” Lithos 160–161: 37–54. doi: 10.1016/j.lithos.2012.11.004
- Wendt, I., and C. Carl. 1991. “The Statistical Distribution of the Mean Squared Weighted Deviation.” Chemical Geology Isotope Geoscience Section 86: 275–285. doi: 10.1016/0168-9622(91)90010-T
- Williams, I. S. 1992. “Some Observations on the use of Zircon U-Pb Geochronology in the Study of Granitic Rocks.” Transactions of the Royal Society of Edinburgh: Earth Sciences 83 (1-2): 447–458. doi: 10.1017/S0263593300008129
- Williams, I. S. 2015. “Zircon.” In Encyclopedia of Astrobiology, edited by M. Gargaud, 1790–1791. Berlin: Springer.
- Williamson, D. F., R. A. Parker, and J. S. Kendrick. 1989. “The box Plot: A Simple Visual Method to Interpret Data.” Annals of Internal Medicine 110 (11): 916–921. doi: 10.7326/0003-4819-110-11-916
- Wu, Y. J., X. J. Fang, S. S. Liao, L. Z. Xue, Z. Chen, J. N. Yang, Y. M. Lu, et al. 2019. “Zircon U-Pb Geochronology of the Chinese Continental Crust: a Preliminary Analysis of the Elsevier Science Database.” Big Earth Data 3 (1): 26–44. doi:10.1080/20964471.2019.1576261.
- Wu, F. Y., W. Q. Ji, J. G. Wang, C. Z. Liu, S. L. Chung, and P. D. Clift. 2014. “Zircon U-Pb and Hf Isotopic Constraints on the Onset Time of India-Asia Collision.” American Journal of Science 314: 548–579. doi: 10.2475/02.2014.04
- Xia, Z. M., J. L. Liu, J. L. Ni, T. T. Zhang, X. M. Shi, and Y. Wu. 2016. “Structure, Evolution and Regional Tectonic Implications of the Queshan Metamorphic Core Complex in Eastern Jiaodong Peninsula of China.” Science China-Earth Sciences 59: 997–1013. doi: 10.1007/s11430-015-5259-3
- Yang, J., P. A. Cawood, Y. Du, H. Huang, and L. Hu. 2012. “Detrital Record of Indosinian Mountain Building in sw China: Provenance of the Middle Triassic Turbidites in the Youjiang Basin.” Tectonophysics 574–575: 105–117. doi: 10.1016/j.tecto.2012.08.027
- Yao, W. H., Z. X. Li, W. X. Li, X. C. Wang, X. H. Li, and J. H. Yang. 2012. “Post-kinematic Lithospheric Delamination of the Wuyi–Yunkai Orogen in South China: Evidence From ca. 435Ma High-Mg Basalts.” Lithos 154: 115–129. doi: 10.1016/j.lithos.2012.06.033
- You, Y., and J. Q. Huang. 1983. Indosinian Movement in Northwest Zhejiang. Collected Works of the Chinese Academy of Geological Sciences (1981), 189–190.
- Yu, X. J., J. Q. Ji, J. F. Gong, D. X. Sun, J. C. Qing, L. N. Wang, D. L. Zhong, and Z. C. Zhang. 2011. “Evidences of Rapid Erosion Driven by Climate in the Yarlung Zangbo (Tsangpo) Great Canyon, the Eastern Himalayan Syntaxis.” Chinese Science Bulletin 56: 1123–1130. doi:10.1007/s11434-011-4419-x.
- Zeitler, P. K., A. S. Meltzer, P. O. Koons, D. Craw, B. Hallet, C. P. Chamberlain, W. S. F. Kidd, et al. 2001. “Erosion-Himalayan Geodynamics and the Geomorphology of Metamorphism.” GSA Today 11: 4–9. doi: 10.1130/1052-5173(2001)011<0004:EHGATG>2.0.CO;2
- Zhang, Z. C., J. L. Kang, T. Kusky, M. Santosh, H. Huang, D. Y. Zhang, and J. Zhu. 2012. “Geochronology, Geochemistry and Petrogenesis of Neoproterozoic Basalts from Sugetbrak, Northwest Tarim Block, China, Implications for the Onset of Rodinia Supercontinent Breakup.” Precambrian Research 220–221: 158–176. doi: 10.1016/j.precamres.2012.08.002
- Zhao, G. C. 2009. “Metamorphic Evolution of Major Tectonic Units in the Basement of the North China Craton: Key Issues and Discussion.” Acta Petrologica Sinica 25 (8): 1772–1792.
- Zhao, G. C., P. A. Cawood, S. Z. Li, S. A. Wilde, M. Sun, J. Zhang, Y. H. He, and C. Q. Yin. 2012. “Amalgamation of the North China Craton: key Issues and Discussion.” Precambrian Research 222–223: 55–76. doi: 10.1016/j.precamres.2012.09.016
- Zhong, Y., C. Ma, L. Liu, J. Zhao, J. Zheng, J. Nong, and Z. J. Zhang. 2014. “Ordovician Appinites in the Wugongshan Domain of the Cathaysia Block, South China: Geochronological and Geochemical Evidence for Intrusion Into a Local Extensional Zone Within an Intracontinental Regime.” Lithos 198–199: 202–216. doi: 10.1016/j.lithos.2014.04.002