
 ?Mathematical formulae have been encoded as MathML and are displayed in this HTML version using MathJax in order to improve their display. Uncheck the box to turn MathJax off. This feature requires Javascript. Click on a formula to zoom.
ABSTRACT
Virtual Landslide Disaster environments are important for multilevel simulation, analysis and decision-making about Landslide Disasters. However, in the existing related studies, complex disaster scene objects and relationships are not deeply analyzed, and the scene contents are fixed, which is not conducive to meeting multilevel visualization task requirements for diverse users. To resolve the above issues, a construction method for Personalized Virtual Landslide Disaster Environments Based on Knowledge Graphs and Deep Neural networks is proposed in this paper. The characteristics of relationships among users, scenes and data were first discussed in detail; then, a knowledge graph of virtual Landslide Disaster environments was established to clarify the complex relationships among disaster scene objects, and a Deep Neural network was introduced to mine the user history information and the relationships among object entities in the knowledge graph. Therefore, a personalized Landslide Disaster scene data recommendation mechanism was proposed. Finally, a prototype system was developed, and an experimental analysis was conducted. The experimental results show that the method can be used to recommend intelligently appropriate disaster information and scene data to diverse users. The recommendation accuracy stabilizes above 80% – a level able to effectively support The Construction of Personalized Virtual Landslide Disaster environments.
1. Introduction
Landslide disasters are the most frequent natural disasters in mountainous areas; they are characterized by high speeds, broad impacts and destructiveness, and can cause extensive property losses and loss of life (Cui Citation2014; Fan et al. Citation2016; Gariano and Guzzetti Citation2016; Segoni, Piciullo, and Gariano Citation2018). Virtual landslide disaster environments are used to simulate the geographic environment and disaster evolution process and provide multilevel disaster simulation, analysis and prediction capabilities to assist in easily understanding and exploring disaster scene (Bainbridge Citation2007; Dransch, Rotzoll, and Poser Citation2010; Li et al. Citation2013; Denolle et al. Citation2014; Evans et al. Citation2014; Zhang et al. Citation2019; Li et al. Citation2019). Therefore, a proper and efficient method for constructing virtual disaster environments is particularly important to efficiently support the simulation, analysis and decision-making that occur after landslide disasters (Chen et al. Citation2013; Lin, Chen, and Lu Citation2013a; Lin et al. Citation2013b; Lin et al. Citation2015a; Chen et al. Citation2015; Lin et al. Citation2016; Lü et al. Citation2018; Chen and Lin Citation2018).
With the rapid development of space-air-ground integrated observation technologies, acquired landslide disaster scene information usually contains multisource scene data and disaster information with complex structures and intertwined relationships. These data include basic geospatial data, disaster information data, real-time monitoring data and disaster thematic analysis data, which together constitute a complex virtual landslide disaster environment (Sheridan et al. Citation2002; Grolinger et al. Citation2013; Imran et al. Citation2014; Fan et al. Citation2015). The types of people involved in landslide disasters can be divided into four categories: ordinary people, disaster victims, rescue teams and guidance experts and the multilevel visualization tasks of these diverse users are discussed in detail in the paper Zhang et al. (Citation2019). Ordinary people are not stakeholders in disaster; they have no special requirements for disaster information and are mainly concerned with the overall disaster simulation scene, which corresponds to disaster scene view-only visualization task. Disaster victims are mainly concerned with disaster information and rescue progress, which corresponds to disaster information analytical visualization task. Rescue teams are mainly concerned with disaster information and rescue plans in target rescue areas, which corresponds to disaster rescue explorative visualization task. Guidance experts are mainly concerned with obtaining overall disaster and rescue progress information to better guide rescue work, which corresponds to disaster rescue explorative visualization task. Therefore, it is necessary not only to clarify the relationships among disaster scene objects but also to consider the different visualization preferences and information requirements of diverse users (Steichen et al. Citation2014; Peng et al. Citation2018).
Many studies have been conducted regarding disaster scene construction. Chen et al. (Citation2016) developed a three-dimensional (3D) landslide disaster visualization and integrated management platform. First, 3D visualization platforms for earthquake disaster analysis and rescue were developed, and then disaster scenes were constructed by analyzing multisource earthquake disaster data (Li et al. Citation2015; Fan et al. Citation2009). Some scholars have simulated flood evolution and analyzed disaster information based on monitored data (Bian and Han Citation2015; Zhu et al. Citation2015; Yin et al. Citation2015). Methods for the construction of fire disaster scenes were proposed to simulate dynamic evolution process of fire based on various factors that affect fire evolution (Chen, Liu, and Wu Citation2018; Li et al. Citation2018). However, these studies did not deeply analyze the complex disaster scene objects or the relationships among these scene objects; they constructed only simple disaster scenes and visual disaster evolution processes. However, such techniques are difficult to apply to construct complex virtual landslide disaster environments.
The following describes some of the primary studies of disaster scene construction through analyzing the scene objects and relationships in disaster scenes. The characteristics and relationships of observation and monitoring data in disasters were analyzed, and fusion visualization methods were proposed to simulate the disaster evolution process and analyze disaster information (Ding, Zhu, and Lin Citation2014; Li et al. Citation2019). Ahmad et al. (Citation2019) discussed a method for constructing a disaster domain ontology by considering various disaster scene data, disaster information and emergency services. However, the above studies did not consider the multilevel visualization task requirements of the diverse users involved in disasters. Considering these issues, some scholars analyzed the performances of diverse types of terminals used by diverse users in disasters to effectively support efficient flood disaster visualization for diverse terminals (Liu et al. Citation2017; Hu et al. Citation2018). Although much outstanding work has been implemented, none of these studies deeply analyzed the different visualization preferences and disaster information requirements of the diverse users. The above methods for constructing disaster scenes have difficulty effectively supporting the construction of personalized virtual landslide disaster environments suitable for diverse users. As mentioned above, no research exists that has proposed a method to clarify the characteristics and relationships among users, scenes and data in landslide disasters or to meet the visualization task requirements of diverse users to construct personalized virtual landslide disaster environments.
A knowledge graph is used to clarify complex domain knowledge and relationships, and it is possible to perform deep mining of the relationships and characteristics contained in the knowledge graph (Wang et al. Citation2014; Lin et al. Citation2015b; Xu, Pei, and Yao Citation2010; Liu et al. Citation2016). Geographic knowledge graphs store geographical entities and semantic relationships that clearly describe geographical environments (Lu, Yu, and Qiu Citation2017; Jiang et al. Citation2018). Therefore, the complex domain knowledge and relationships in disaster scenes can be clarified by constructing geographic knowledge graphs, which can then be used to guide the construction of complex 3D scenes (Purohit, Kanagasabai, and Deshpande Citation2019).
Existing studies of scene construction guided by domain knowledge are introduced as follows. Some scholars proposed spatial semantic knowledge expression methods, which were applied to guide the construction of battlefield scenes, indoor and outdoor scenes (Coyne et al. Citation2012; Chang, Savva, and Manning Citation2014; Liang et al. Citation2018; Wang et al. Citation2019). Some scholars analyzed disaster domain knowledge and constructed disaster domain ontologies and knowledge graphs to guide disaster scene construction and disaster information fusion visualization (Ma et al. Citation2016; Li et al. Citation2019). However, the above studies focused only on 3D scene visualization and used only simple structures with fixed contents, making it difficult to use these techniques to address the complex relationships among landslide disaster scene objects. Moreover, because the semantic relationships are not fully mined from the knowledge graph, and the visualization task requirements of diverse users are not considered, it is difficult to construct personalized virtual landslide disaster environments from the available data.
Deep neural networks can be used to mine the characteristics and semantic information contained in knowledge graphs. Similar data mining techniques have been used to improve the data recommendation accuracy in personalized data recommendation systems (Wang et al. Citation2018a, Citation2018b). However, few studies have attempted to apply deep neural networks to construct personalized virtual scenes – especially personalized virtual disaster environments (Covington, Adams, and Sargin Citation2016; Chang et al. Citation2019; Jia et al. Citation2019).
To resolve the above issues, a novel construction method for personalized virtual landslide disaster environments based on knowledge graphs and deep neural networks is proposed in this paper. The proposed method concentrates on the construction of the knowledge graph of the virtual landslide disaster environment and on a personalized landslide disaster scene data recommendation mechanism based on collaborative filtering and deep learning. The remainder of this paper is organized as follows. Section 2 presents the overall framework for constructing personalized virtual landslide disaster environments. Then, a method for constructing a knowledge graph of a virtual landslide disaster environment and a personalized recommendation mechanism for disaster scene data based on collaborative filtering and deep learning are proposed. Section 3 describes the development of a prototype system and the experimental analysis. Section 4 presents the study conclusions and provides a brief discussion of future work.
2. Methodology
2.1. Overall framework
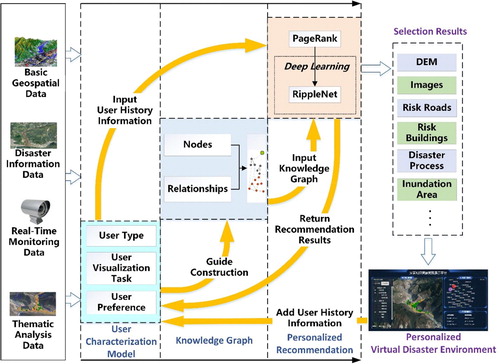
shows the overall framework of the method proposed in this paper. First, the proposed user characterization model guides the knowledge graph construction of the virtual landslide disaster environment. Then, the relationships and characteristics in the knowledge graph and the user preferences are employed to create personalized disaster scene data recommendations based on collaborative filtering and deep learning. In this mechanism, collaborative filtering is introduced to solve the ‘cold start’ problem, and the recommendation results of collaborative filtering and deep learning are comprehensively considered. Finally, the comprehensive recommendation datasets are calculated and shown to users, and the user selections are recorded as further user history information that enriches user preferences in the user characterization model to enable improved future recommendations.
Figure 1. Overall framework.
2.2. User characterization model
Based on the multilevel visualization task requirements and knowledge background of diverse users, the user characterization model is proposed in this paper, which is defined as follows:(1)
(1)
In Formula (1), the parameter represents a user type, which includes guidance experts, rescue teams, disaster victims and ordinary people. The parameter
represents the multilevel visualization tasks of diverse users, which are discussed in detail in Zhang et al. (Citation2019) and introduced in Section 1. The parameter
represents user visualization preferences that are obtained from user history information, which is the result of selecting disaster scene data. Because the data selection results of a user can reflect the user’s preference for the disaster scene, the preference index is recorded in the parameter
, which is the number of times that one type of user selects these data. In the subsequent construction of the knowledge graph, this parameter will be added as the edge weight of the knowledge graph. The user characteristics are clearly described based on considering the visualization tasks and preferences of diverse users. To clarify the relationships among disaster scene objects, the user characterization model is used to guide knowledge modeling of the virtual landslide disaster environment and construct a knowledge graph.
2.3. Knowledge graph construction for virtual landslide disaster environments
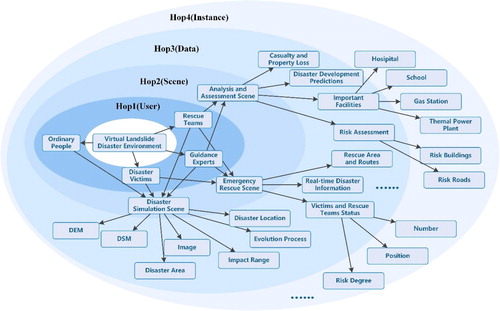
The process of knowledge graph construction for virtual landslide disaster environments is shown in . First, a domain ontology is constructed to clarify the characteristics and relationships among users, scenes, and data in landslide disasters. The domain knowledge analysis of the virtual landslide disaster environment is divided into four parts: user characteristic analysis, scene characteristic analysis, data characteristic analysis and semantic relationship analysis, for which detailed descriptions are listed in –, respectively. A virtual landslide disaster environment ontology is constructed according to the domain knowledge analysis, and the conceptual hierarchy of the ontology is shown in .
Figure 2. Knowledge graph construction for virtual landslide disaster environments.
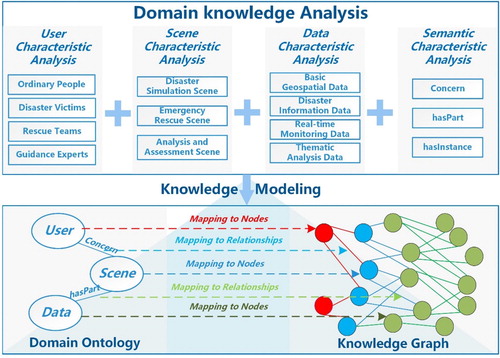
Figure 3. Conceptual hierarchy of virtual landslide disaster environment ontology.
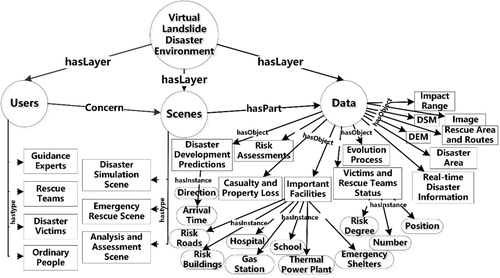
Table 1. User characteristic analysis.
Table 2. Scene characteristic analysis.
Table 3. Data characteristic analysis.
Table 4. Semantic relationship analysis.
The ontology is used as a knowledge template for the virtual landslide disaster environment, which is mapped to a graph structure. The user, scene and data objects in the ontology are mapped to knowledge graph nodes; the various types of semantic relationships are mapped to the relationships in the knowledge graph.
2.4. Personalized recommendations for landslide disaster scene data
Many entities and relationships exist in the knowledge graph. A type of deep neural network named RippleNet has been applied in personalized recommendation tasks to mine these complex semantic relationships and characteristics. However, when a given type of user selects disaster scene data and constructs a disaster scene at the beginning several times, no prior user history information exists or limited user history information is avaliable, which constitutes a problem called ‘cold start’ in the recommendation field. To resolve the cold start problem, a novel personalized recommendation mechanism for landslide disaster scene data based on collaborative filtering and deep learning is proposed, as shown in . When no user history information exists, the knowledge graph is used to make rough recommendations based on collaborative filtering. In every subsequent recommendation, the recommendation datasets can be calculated more comprehensively by considering a recommendation based on both collaborative filtering and deep learning. Then, the predicted disaster scene data with the preference indices are recommended to the user. Finally, the user selects the required data from the recommendation dataset, resulting in the construction of a personalized virtual landslide disaster environment. The user's selected results are added to that user history information to improve future recommendations.
Figure 4. Personalized landslide disaster scene data recommendation process.
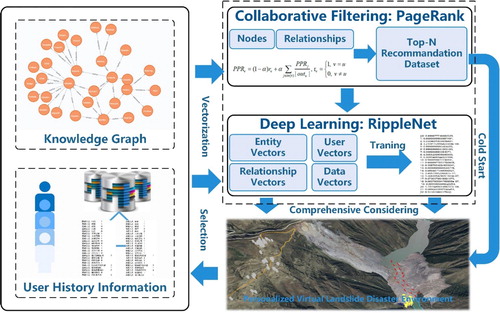
In this paper, a collaborative filtering method called the personalized PageRank algorithm is used to make rough recommendations. In this algorithm, a user node is taken as input. The scene data nodes and semantic relationships in the knowledge graph are used to calculate the semantic relevance of all scene data nodes relative to the input user node. Based on the semantic relevance among the user node and scene data nodes, the recommended data nodes are sorted to generate a top-N recommendation dataset. The personalized PageRank algorithm is shown in Formula (2).(2)
(2) where
represents the semantic relevance among the data node v/node j and the user node
. The output is the predicted probability with which the user would select this scene data;
is a damping factor whose value is usually 0.85, which can prevent decreases in semantic correlation accuracy caused by the clustering of some nodes due to the existence of isolated nodes;
represents the initial vector;
represents the set of nodes pointing to node v; and
represents the number of nodes pointed to by node v.
In this paper, a deep learning algorithm named RippleNet (which is one type of deep neural network) is used to make precise recommendations. The principle underlying this algorithm is shown in , which depicts the spreading process of each user's preference in the entire knowledge graph of the virtual landslide disaster environment. In the algorithm, the knowledge graph is first vectorized into its constituent entity vectors and relationship vectors; the user type and user history information are vectorized to user vectors; the disaster scene data are vectorized to data vectors; and the above vectors are used as the input to the algorithm. Then, the user's preference index for the scene data is calculated, and a top-N recommendation dataset is generated. A final comprehensive recommendation dataset is generated by considering the results of both the rough and precise recommendations. Finally, users can select the required data based on the final recommendation dataset to construct a personalized virtual landslide disaster environment.
Figure 5. Principle of the RippleNet algorithm for personalized recommendations.
3. System implementation and experimental analysis
3.1. Prototype system and case area
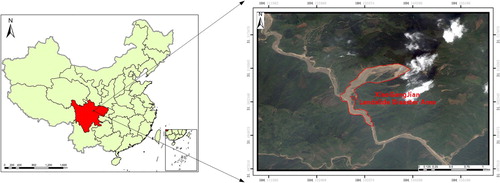
In this paper, a landslide disaster that occurred on 19 January 2016 in XiaoGangJian, Sichuan Province, China was selected as a case area for conducting the experimental analysis. shows the case area. The landslide disaster occurred on the road from Hanwang to Qingping in mountainous area, the data need to be acquired through space-air-ground integrated observation technologies where a large number of houses and some important facilities such as schools are located, and it results in acquired landslide disaster scene information usually contains multisource scene data and disaster information with complex structures and intertwined relationships.
Figure 6. Case area: a landslide disaster in XiaoGangJian, Sichuan Province, China.
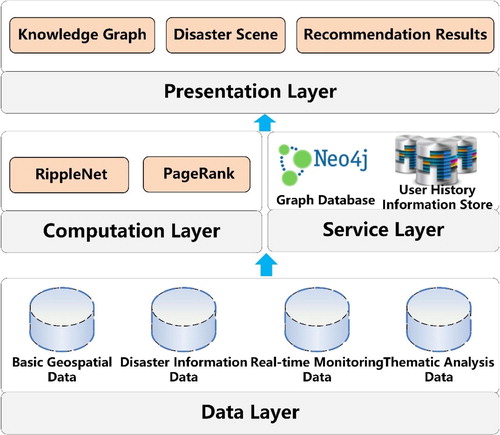
A plugin-free browser/server (B/S) prototype system was developed based on WebGL. The framework of the prototype system is shown in , and it is divided four layers: data layer, computation layer, service layer and presentation layer. The data layer included all required disaster scene data. The computation layer was used to implement the computation of the neural deep network and personalized PageRank, and then the recommendation results would be returned to the presentation layer. The service layer was used to manage the knowledge graph, provided a graph data service and stored user history information. The presentation layer showed the disaster scene, detailed information on the knowledge graph, and the recommendation datasets for users.
Figure 7. Framework of the prototype system.
The prototype system was run and tested on a desktop terminal. The terminal was equipped with an Intel Core i7 CPU @ 2.6 GHz with 32 GB of memory and an NVIDIA GeForce RTX2080MQ GPU with 8 GB of memory. The software installed on the terminal included a Windows 10 OS, Chrome Navigator, Neo4J Graph Database and a NodeJS Server. The development environment was WebStorm IDE and Spyder IDE.
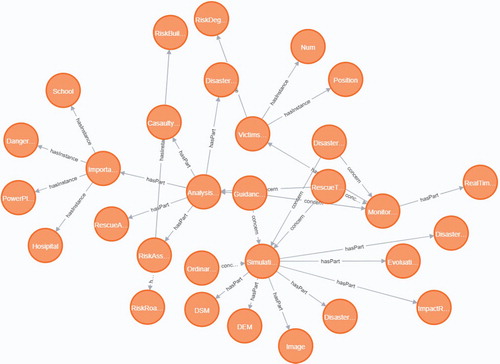
The Neo4J Graph Database was used to design and visualize the knowledge graph of the virtual landslide disaster environment in the experiment. shows the knowledge graph constructed for the experiment.
Figure 8. The knowledge graph constructed for the experiment.
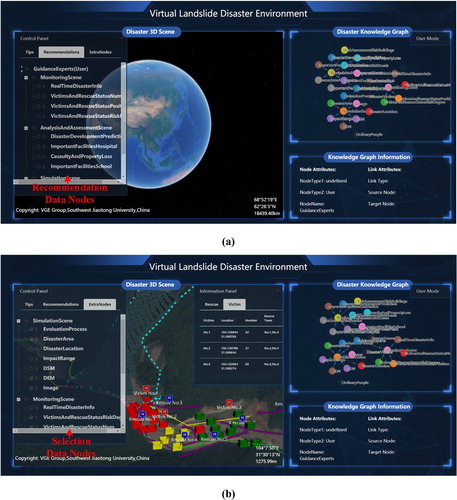
The prototype system interface is shown in . The system provides basic geographical scene visualization, disaster process simulation, scene interaction analysis and three functional modes: global mode, query mode and user mode. Global mode is the default at system initialization, which shows the overall knowledge graph and the relevant statistical information of the virtual landslide disaster environment. Users can click a corresponding user node to enter user mode. In user mode, the system displays the recommendation dataset in the recommendation tab in tree form so that users can select and construct the required disaster scene. Other data nodes are provided in the extra nodes tab as a supplement to the recommendation dataset. The system records the user history information, which will be used to improve future personalized recommendation of disaster scene data for the selected user type. The user can also choose to click scene nodes or data nodes in the knowledge graph to enter query mode; then, the system will display detailed semantic information related to the selected node and its relationships.
Figure 9. The prototype system interface.
3.2. Experimental process
According to the literature (Wang et al. Citation2018a) and the knowledge graph of the virtual landslide disaster environment, the hyperparameters of RippleNet in the experiment were set as follows: the epoch was set to 30, which affected the fitting effect in training. The batch size was set to 10, which affected the training efficiency and optimization. The initial learning rate was set to 0.02, which was used to control the learning progress of RippleNet. The hop was set to 4, which is the same as the hierarchies of knowledge graph.
To verify the effectiveness of this method, 415 people were invited to help conduct the experiment. Among these, 140 were not related to the disaster (ordinary people), 68 people had experienced the disaster (disaster victims), 92 were professionals from relevant emergency agencies (rescue teams), and 115 were experts in relevant fields (guidance experts). The experiment recorded the data nodes recommended by the system and the actual data nodes selected by the user after each user entered user mode. Then, the recommendation accuracy was proposed to evaluate the experimental effect, and it is defined as follows:(3)
(3) where
represents the recommendation accuracy.
represents the data nodes recommended by the system and
represents the actual data nodes selected by the user.
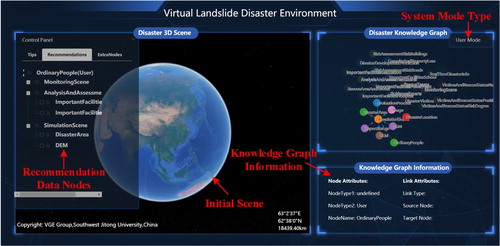
Taking an experiment conducted by an ordinary people user type as an example, the recommendation data nodes included Casualty and Property Loss, Risk Assessments-Buildings, Risk Assessments-Roads, Important Facilities-Hospital, Important Facilities-School, Image, Disaster Area, Disaster Evolution Process, DSM, and DEM. The user-selected data nodes included Risk Assessments-Buildings, Risk Assessments-Roads, Important Facilities-Hospital, Image, Disaster Area, Disaster Evolution Process, and DEM. The result of the virtual landslide disaster environment construction for this user is shown in .
Figure 10. Recommendation and selection results for an ordinary people user type: (a) recommendation results, (b) selected results.
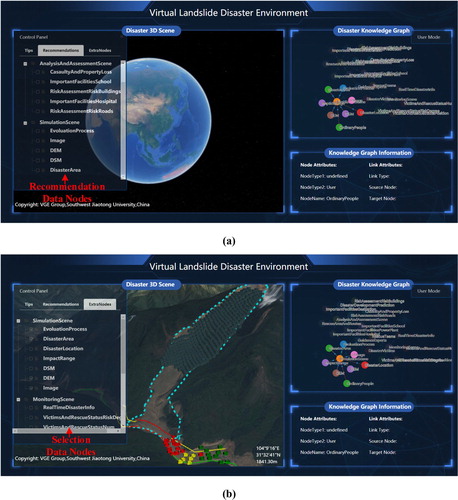
Taking an experiment conducted by a disaster victims user type as an example, the recommendation data nodes included Real-time Disaster Information, Victims and Rescue Teams Status-Position, Rescue Area and Routes, Risk Assessments-Buildings. The user-selected data nodes included Victims and Rescue Teams Status-Number, Victims and Rescue Teams Status-Position, Rescue Area and Routes, Risk Assessments-Buildings, Image, and DEM. The result of the virtual landslide disaster environment construction for this user is shown in .
Figure 11. Recommendation and selection results for a disaster victims user type: (a) recommendation results, (b) selected results.
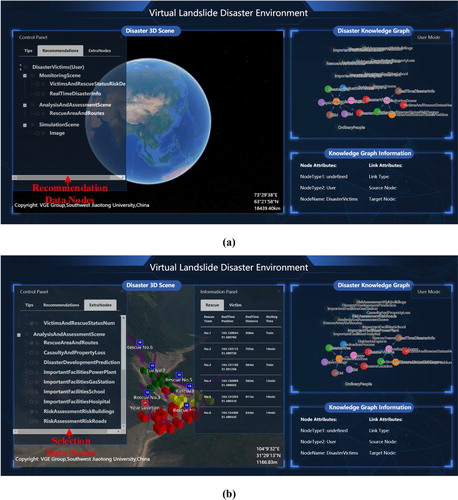
Taking an experiment conducted by a rescue teams user type as an example, the recommendation data nodes included Real-time Disaster Information, Victims and Rescue Teams Status-Number, Victims and Rescue Teams Status-Position, Victims and Rescue Teams Status-Risk Degree, Rescue Area and Routes, Risk Assessments-Building, Disaster Impact Range, Image, DEM. The user-selected data nodes included Victims and Rescue Teams Status-Number, Victims and Rescue Teams Status-Position, Rescue Area and Routes, Disaster Impact Range, Risk Assessments-Buildings, Risk Assessments-Roads, Image, and DEM. The result of the virtual landslide disaster environment construction for this user is shown in .
Figure 12. Recommendation and selection results for a rescue teams member user type: (a) recommendation results, (b) selected results.
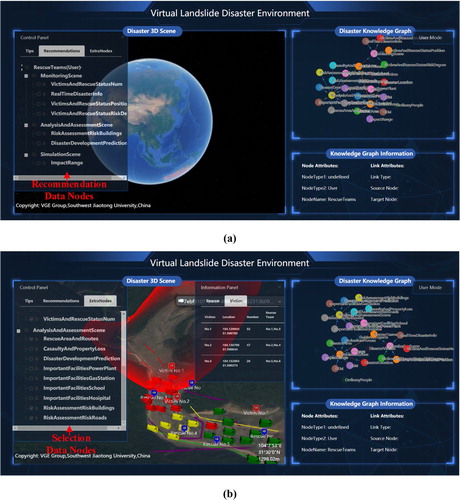
Taking an experiment conducted by a guidance experts user type as an example, the recommendation data nodes included Real-time Disaster Information, Important Facilities-Hospital, Important Facilities-School, Casualty and Property Loss, Victims and Rescue Teams Status-Number, Victims and Rescue Teams Status-Position, Victims and Rescue Teams Status-Risk Degree, Rescue Area and Routes, Risk Assessments-Building, Disaster Impact Range, Image, DEM, and Disaster Evolution Process. The user-selected data nodes included Victims and Rescue Teams Status-Number, Victims and Rescue Teams Status-Position, Victims and Rescue Teams Status-Risk Degree, Rescue Area and Routes, Disaster Impact Range, Risk Assessments-Buildings, Risk Assessments-Roads, Image, DEM, and Disaster Evolution Process. The result of the virtual landslide disaster environment construction for this user is shown in .
Figure 13. Recommendation and selection results for a guidance experts user type: (a) recommendation results, (b) selected results.
3.3. Experimental analysis
The experiment recorded the recommendation accuracy after each recommendation and created a line chart to display the recommendation accuracy trends in the experiment, as shown in . In , these data labels show information about the user type, user number and recommendation accuracy of this experiment to provide detail for the experiments.
Figure 14. Recommendation accuracy trends during the experiment.
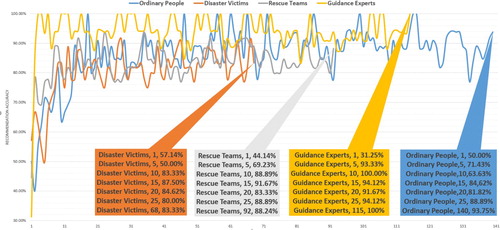
In conclusion, the recommendation accuracy trends show that the recommendation accuracy gradually increases. The experimental results for four types of users are analyzed as follows.
The selections of the ordinary people user type are random, because they are not stockholders in the disaster, which resulted in the recommendation accuracy of approximately ten users at the beginning of the experiment being below 70%. As the user history information accumulated, the recommendation accuracy gradually increased, finally stabilizing above 80%.
Most of the disaster victims user type selected only data nodes related to their own and rescue progress. This type of user is intimately connected to the disaster; therefore, the number of nodes that they care about is small, and the initial recommendation accuracy was only approximately 60%. As the user history information accumulated, the recommendation accuracy gradually increased, finally stabilizing above 80%.
The rescue teams user type undertake rescue work, most of them selected data nodes related to rescue plans and target victim statuses; their visualization task requirements are similar to those of disaster victims user type. However, the members of this group have professional knowledge; thus, they also selected some relevant data nodes that can affect rescue work. As the user history information accumulated, the recommendation accuracy gradually increased beyond 70% and eventually stabilized at approximately 80%.
The guidance experts user type need to consider the overall emergency and rescue; consequently, they need to pay attention to more data nodes. As the user history information accumulated, the recommendation accuracy stabilized at more than 90%, sometimes even reaching 100%. In summary, the method proposed in this paper can construct personalized virtual landslide disaster environments to meet the multilevel visualization task requirements of diverse users.
The experimental results and analysis show that although there is little user history information in the early stage of the experiment, the recommendation accuracy maintains a certain level based on the collaborative filtering method. As the user history information accumulates, the recommendation accuracy gradually increases and stabilizes at a high level based on deep learning. The effectiveness of the proposed method in this paper is demonstrated through the experiments.
4. Conclusions and future work
This paper presents a procedural construction method for personalized virtual landslide disaster environments based on knowledge graphs and deep neural networks. For complex scene data and disaster information, the proposed method better clarifies the characteristics of and semantic relationships among users, scenes and data in landslide disasters compared with traditional methods via the construction of knowledge graphs of virtual landslide disaster environments. The traditional recommendation methods are mostly based on collaborative filtering, and the proposed method innovatively introduced a deep neural network for personalized recommendation to deeply mine the knowledge graph and user history information. The prototype system can visualize the required virtual landslide disaster scene for multitype users. The experimental results show that the method proposed in this paper is suitable for the personalized construction of virtual landslide disaster environments and prove the feasibility of the proposed method. The main contributions of this paper are summarized as follows.
First, a user characterization model was constructed, and the characteristics and semantic relationships of the users, scenes and data in landslide disasters were analyzed deeply and used to construct a knowledge graph of virtual landslide disaster environments that clarifies the complex scene objects and their relationships. The characteristics and semantic information in the knowledge graph are mined deeply to support subsequent personalized recommendations.
Second, a collaborative filtering method named PageRank was applied to make rough recommendations to resolve the ‘cold start’ problem in personalized disaster scene data recommendations. Then, a deep neural network named RippleNet was applied to make precise recommendations; the final recommendation dataset is generated by comprehensively considering the results of both the rough and precise recommendations. This approach supports the construction of personalized virtual landslide disaster environments for diverse users.
Third, this paper proposed a universal construction method and provided a standard construction procedure of virtual disaster environments, which can be used for personalized recommendation of multitype disaster scene data and is suitable for construction of multitype disaster scene. In addition, the prototype system was an easy-to-use tool, the users just need to click the button that corresponding to their identity and construct the requirement virtual disaster environments according to the recommendation dataset.
Despite the achievements described above, some aspects still need improvement in future works. First, the domain knowledge should be further studied; such domain knowledge is used to construct the knowledge graphs. Second, the construction of diverse disaster scenes should be studied and should not be limited to landslide disasters in future works. Finally, as knowledge reasoning technology develops, newer techniques can be applied to construct virtual disaster environments in the future to provide more accurate personalized recommendations.
Acknowledgements
We appreciate the detailed suggestions and constructive comments from the editor and the anonymous reviewers.
Disclosure statement
No potential conflict of interest was reported by the authors.
Additional information
Funding
References
- Ahmad, A., R. Othman, M. Fauzan, and Q. M. Ilyas. 2019. “A Semantic Ontology for Disaster Trail Management System.” International Journal of Advanced Computer Science and Applications 10 (10): 77–90.
- Bainbridge, W. S. 2007. “The Scientific Research Potential of Virtual Worlds.” Science 317 (5837): 472–476.
- Bian, M. S., and M. Han. 2015. “The Research on 3D Visualization System of Dam-Break Flood Routing Based on Google Earth.” 36th IAHR World Congress: Deltas of the Future and What Happens Upstream, 4869–4876. Delft, Netherlands.
- Chang, A. X., M. Savva, and C. D. Manning. 2014. “Learning Spatial Knowledge for Text to 3D Scene Generation.” 2014 Conference on Empirical Methods in Natural Language Processing, 2028–2038. Doha, Qatar.
- Chang, L., W. T. Zhang, T. L. Gu, W. P. Sun, and C. Z. Bin. 2019. “Review of Recommendation Systems Based on Knowledge Graph.” CAAI Transactions on Intelligent Systems 14 (2): 207–216.
- Chen, W. J., B. He, L. Zhang, and D. Nover. 2016. “Developing an Integrated 2D and 3D WebGIS-Based Platform for Effective Landslide Hazard Management.” International Journal of Disaster Risk Reduction 20: 26–38.
- Chen, M., and H. Lin. 2018. “Virtual Geographic Environments (VGEs): Originating from or Beyond Virtual Reality (VR)?” International Journal of Digital Earth 11 (4): 329–333.
- Chen, M., H. Lin, M. Y. Hu, L. He, and C. X. Zhang. 2013. “Real Geograhic Scenario Based Virtual Social Environment: Integrate Geograpy with Social Research.” Environment and Planning B-Planning & Design 40 (6): 1103–1131.
- Chen, M., H. Lin, O. Kolditz, and C. Chen. 2015. “Developing Dynamic Virtual Geographic Environments (VGEs) for Geographic Research.” Environmental Earth Sciences 74: 6975–6980.
- Chen, X. S., C. C. Liu, and I. C. Wu. 2018. “A BIM-Based Visualization and Warning System for Fire Rescue.” Advanced Engineering Informatics 37: 42–53.
- Covington, P., J. Adams, and E. Sargin. 2016. “Deep Neural Networks for YouTube Recommendations.” 10th ACM Conference on Recommender Systems, 191–198. Boston, USA.
- Coyne, B., A. Klapheke, M. Rouhizadeh, R. Sproat, and D. Bauer. 2012. “Annotation Tools and Knowledge Representation for a Text-to-Scene System.” 24th International Conference on Computational Linguistics, 679–694. Mumbai, India.
- Cui, P. 2014. “Progress and Prospects in Research on Mountain Hazards in China.” Progress in Geography 33: 145–152.
- Denolle, M. A., E. M. Dunham, G. A. Prieto, and G. C. Beroz. 2014. “Strong Ground Motion Prediction Using Virtual Earthquakes.” Science 343 (6169): 399–403.
- Ding, Y. L., Q. Zhu, and H. Lin. 2014. “An Integrated Virtual Geographic Environmental Simulation Framework: A Case Study of Flood Disaster Simulation.” Geo-spatial Information Science 17 (4): 190–200.
- Dransch, D., H. Rotzoll, and K. Poser. 2010. “The Contribution of Maps to the Challenges of Risk Communication to the Public.” International Journal of Digital Earth 3 (3): 292–311.
- Evans, S. Y., M. Todd, I. Baines, T. Hunt, and G. Morrison. 2014. “Communicating Flood Risk Through Three-Dimensional Visualization.” Proceedings of the Institution of Civil Engineers 167 (5): 48–55.
- Fan, X. T., X. P. Du, J. Tan, and J. J. Zhu. 2009. “Three-dimensional Visualization Simulation Assessment System Based on Multi-Source Data Fusion for the Wenchuan Earthquake.” Journal of Applied Remote Sensing 3 (1): 031640.
- Fan, W. C., W. G. Weng, G. Wu, Q. F. Meng, and L. X. Yang. 2015. “Basic Scientific Problems of National Security Management.” Bulletin of National Natural Science Foundation of China 29 (6): 436–443.
- Fan, Y. D., W. Wu, W. Wang, M. Liu, and Q. Wen. 2016. “Research Progress of Disaster Remote Sensing in China.” Journal of Remote Sensing 20 (5): 1170–1184.
- Gariano, S. L., and F. Guzzetti. 2016. “Landslides in a Changing Climate.” Earth Science Reviews 162: 227–252.
- Grolinger, K., M. A. M. Capretz, E. Mezghani, and E. Exposito. 2013. “Knowledge as a Service Framework for Disaster Data Management.” 22nd IEEE International WETICE Conference, 313–318. Hammamet, Tunisia.
- Hu, Y., J. Zhu, W. L. Li, Y. H. Zhang, Q. Zhu, H. Qi, H. X. Zhang, Z. Y. Cao, W. J. Yang, and P. C. Zhang. 2018. “Construction and Optimization of Three-Dimensional Disaster Scenes Within Mobile Virtual Reality.” ISPRS International Journal of Geo-Information 7 (6): 215.
- Imran, M., C. Castillo, J. Lucas, P. Meier, and S. Vieweg. 2014. “AIDR: Artificial Intelligence for Disaster Response.” 23rd International Conference on World Wide Web, 159–162. Seoul, South Korea.
- Jia, Z. H., T. L. Gu, C. Z. Bin, L. Chang, W. T. Zhang, and G. M. Zhu. 2019. “Tourism Knowledge-Graph Feature Learning for Attraction Recommendations.” CAAI Transactions on Intelligent Systems 14 (3): 430–437.
- Jiang, B. C., G. Wan, J. Jian, F. Li, and H. Q. Wen. 2018. “Geographic Knowledge Graph Building Extracted from Multi-Sourced Heterogeneous Data.” Acta Geodetica et Cartographica Sinica 47 (8): 1051–1061.
- Li, Y., J. H. Gong, J. Zhu, Y. Q. Song, Y. Hu, and L. Ye. 2013. “Spatiotemporal Simulation and Risk Analysis of Dam-Break Flooding Based on Cellular Automata.” International Journal of Geographical Information Science 27 (10): 2043–2059.
- Li, J. W., X. W. Li, C. C. Chen, H. R. Zheng, and N. Y. Liu. 2018. “Three-Dimensional Dynamic Simulation System for Forest Surface Fire Spreading Prediction.” International Journal of Pattern Recognition and Artificial Intelligence 32 (8): 1850026.1–1850026.23.
- Li, B. R., J. P. Wu, M. Pan, and J. Huang. 2015. “Application of 3D WebGIS and Real-Time Technique in Earthquake Information Publishing and Visualization.” Earthquake Science 28 (3): 223–231.
- Li, W. L., J. Zhu, Y. H. Zhang, Y. G. Cao, Y. Hu, L. Fu, P. C. Huang, Y. K. Xie, L. Z. Yin, and B. L. Xu. 2019. “A Fusion Visualization Method for Disaster Information Based on Self-Explanatory Symbols and Photorealistic Scene Cooperation.” International Journal of Geo-Information 8 (3): 104.
- Liang, Y., F. Xu, S. H. Zhang, Y. K. Lai, and T. J. Mu. 2018. “Knowledge Graph Construction with Structure and Parameter Learning for Indoor Scene Design.” Computational Visual Media 4 (2): 123–137.
- Lin, H., M. Batty, S. E. Jorgensen, B. J. Fu, M. Konecny, A. Voinow, P. Torrens, et al. 2015a. “Virtual Environments Begin to Embrace Process-Based Geographic Analysis.” Transactions in GIS 19 (4): 493–498.
- Lin, H., M. Chen, and G. N. Lu. 2013. “Virtual Geographic Environment: A Workspace for Computer-Aided Geographic Experiments.” Annals of the Association of American Geographers 103 (3): 465–482.
- Lin, H., M. Chen, G. N. Lu, Q. Zhu, J. H. Gong, X. You, Y. N. Wen, B. L. Xu, and M. Y. Hu. 2013. “Virtual Geographic Environments (VGEs): A New Generation of Geographic Analysis Tool.” Earth-Science Reviews 126: 74–84.
- Lin, Y. K., Z. Y. Liu, M. S. Sun, Y. Liu, and X. Zhu. 2015b. “Learning Entity and Relation Embeddings for Knowledge Graph Completion.” 29th Association-for-the-Advancement-of-Artificial-Intelligence (AAAI) Conference on Artificial Intelligence, 2181–2187. Austin, USA.
- Lin, H., C. X. Zhang, M. Chen, and X. Q. Zheng. 2016. “On Virtual Geographic Environments for Geographic Knowledge Representation and Sharing.” Journal of Remote Sensing 20 (5): 1290–1298.
- Liu, Q., Y. Li, H. Duan, Y. Liu, and Z. G. Qin. 2016. “Knowledge Graph Construction Techniques.” Journal of Computer Research and Development 53 (3): 582–600.
- Liu, M. W., J. Zhu, Q. Zhu, H. Qi, L. Z. Yin, X. Zhang, B. Feng, H. G. He, W. J. Yang, and L. Y. Chen. 2017. “Optimization of Simulation and Visualization Analysis of Dam-Failure Flood Disaster for Diverse Computing Systems.” International Journal of Geographical Information Science 31 (9): 1891–1906.
- Lü, G. N., M. Chen, L. W. Yuan, L. C. Zhou, Y. N. Wen, M. G. Wu, B. Hu, Z. Y. Yu, S. S. Yue, and Y. H. Sheng. 2018. “Geographic Scenario: A Possible Foundation for Further Development of Virtual Geographic Environments.” International Journal of Digital Earth 11 (4): 356–368.
- Lu, F., L. Yu, and P. Y. Qiu. 2017. “On Geographic Knowledge Graph.” Journal of Geo-Information Science 19 (6): 723–734.
- Ma, L. L., H. W. Li, S. W. Lian, R. P. Liang, and J. Gong. 2016. “A Method of Modeling Natural Disaster Event Domain Ontology.” Geography and Geo-Information Science 32 (1): 12–17.
- Peng, G. Q., Y. N. Wen, Y. T. Li, S. S. Yue, and Z. Y. Song. 2018. “Construction of Collaborative Mapping Engine for Dynamic Disaster and Emergency Response.” Natural Hazards 90 (1): 217–236.
- Purohit, H., R. Kanagasabai, and N. Deshpande. 2019. “Towards Next Generation Knowledge Graphs for Disaster Management.” 13th IEEE International Conference on Semantic Computing, 474–477. Newport Beach, USA.
- Segoni, S., L. Piciullo, and S. L. Gariano. 2018. “A Review of the Recent Literature on Rainfall Thresholds for Landslide Occurrence.” Landslides 15 (8): 1483–1501.
- Sheridan, M. F., C. L. Bloebaum, T. Kesavadas, A. K. Patra, and E. Winer. 2002. “Visualization and Communication in Risk Management of Landslides.” 3rd International Conference on Computer Simulation in Risk Analysis and Hazard Mitigation, 691–701. Sintra, Portugal.
- Steichen, B., M. M. A. Wu, D. Tolker, C. Conati, and G. Carenini. 2014. “Eye Gaze Sequence Analysis for Informing User-Adaptive Information Visualizations.” 22nd International Conference on User Modeling, Adaptation, and Personalization, 183–194. Aalborg, Denmark.
- Wang, B. K., L. Wu, X. F. Hu, and X. Y. He. 2019. “Knowledge Representation Method of Joint Operation Situation Based on Knowledge Graph.” Journal of System Simulation 31 (11): 2228–2237.
- Wang, Z., J. W. Zhang, J. L. Feng, and Z. Chen. 2014. “Knowledge Graph Embedding by Translating on Hyperplanes.” 28th Association-for-the-Advancement-of-Artificial-Intelligence (AAAI) Conference on Artificial Intelligence 1112-1119. Quebec City, Canada.
- Wang, H. W., F. Z. Zhang, J. L. Wang, M. Zhao, W. J. Li, X. Xie, and M. Y. Guo. 2018a. “RippleNet: Propagating User Preferences on the Knowledge Graph for Recommender Systems.” 27th ACM International Conference on Information and Knowledge Management, 417–426. Torino, Italy.
- Wang, H. W., F. Z. Zhang, X. Xie, and M. Y. Guo. 2018b. “DKN: Deep Knowledge-Aware Network for News Recommendation.” 27th World Wide Web (WWW) Conference, 1835–1844. Lyon, France.
- Xu, J., T. Pei, and Y. H. Yao. 2010. “Conceptual Framework and Representation of Geographic Knowledge Map.” Journal of Geo-Information Science 12 (4): 496–502, 509.
- Yin, L. Z., J. Zhu, X. Zhang, Y. Li, J. H. Wang, H. Zhang, and X. F. Yang. 2015. “Visual Analysis and Simulation of Dam-Break Flood Spatiotemporal Process in a Network Environment.” Environmental Earth Sciences 74 (10): 7133–7146.
- Zhang, Y. H., J. Zhu, W. L. Li, Q. Zhu, Y. Hu, L. Fu, J. X. Zhang, P. C. Huang, Y. K. Xie, and L. Z. Yin. 2019. “Adaptive Construction of the Virtual Debris Flow Disaster Environments Driven by Multilevel Visualization Task.” ISPRS International Journal of Geo-Information 8 (5): 209.
- Zhu, J., L. Z. Yin, J. H. Wang, H. Zhang, Y. Hu, and Z. J. Liu. 2015. “Dam-Break Flood Routing Simulation and Scale Effect Analysis Based on Virtual Geographic Environment.” IEEE Journal of Selected Topics in Applied Earth Observations and Remote Sensing 8 (1): 105–113.