
 ?Mathematical formulae have been encoded as MathML and are displayed in this HTML version using MathJax in order to improve their display. Uncheck the box to turn MathJax off. This feature requires Javascript. Click on a formula to zoom.
ABSTRACT
Remote sensing satellites are playing very important roles in diverse earth observation fields. However, long revisit period, high cost and dense cloud cover have been the main limitations of satellite remote sensing for a long time. This paper introduces the novel volunteered passenger aircraft remote sensing (VPARS) concept, which can partly overcome these problems. By obtaining aerial imaging data from passengers using a portable smartphone on a passenger aircraft, it has various advantages including low cost, high revisit, dense coverage, and partial anti-cloud, which can well complement conventional remote sensing data. This paper examines the concept of VPARS and give general data processing framework of VPARS. Several cases were given to validate this processing approach. Two preliminary applications on land cover classification and economic activity monitoring validate the applicability of the VPARS data. Furthermore, we examine the issues about data maintenance, potential applications, limitations and challenges. We conclude the VPARS can benefit both scientific and industrial communities who rely on remote sensing data.
1. Introduction
Modern remote sensing technology originated in the 1960s, most of which utilize satellite and airborne platforms, acquiring optical and radar data (Schowengerdt Citation2007). However, the conventional airborne and satellite remote sensing platforms are normally expensive, lack operational flexibility, have limited versatility, and have insufficient temporal resolution, posing challenges for many applications (Whitehead and Hugenholtz Citation2014). One obvious limitation is that the temporal resolutions of the current operational satellite platforms are not sufficient for many applications, e.g. to delineate the rapid growth of some plant species (Silva et al. Citation2014) or meet the requirement for disaster response (Voigt et al. Citation2016; Boccardo and Tonolo Citation2015). In the twenty-first century, new features of remote sensing technology have developed, including high spatial resolution, high spectral resolution and high temporal resolution features, which has created opportunities for new applications (Toth and Jóźków Citation2016; Oddo and Bolten Citation2019). Some commercial projects have attempted to fill this gap in recent years. For example, many inexpensive miniature satellites were designed and manufactured by Planet Labs to provide a complete image of Earth with a short revisit period (Strauss Citation2017).
Several major signs of progress in the remote sensing can be identified: (1) a wide variety of sensors and platforms became available (Toth and Jóźków Citation2016). Several lightweight imaging and ranging instruments emerged (van Blyenburgh Citation2013; Colomina and Molina Citation2014). Some more flexible and low-cost platforms were developed for remote sensing, e.g. unmanned aerial vehicles (UAVs) and tethered balloon (Silva et al. Citation2014); (2) image processing algorithms were developed very quickly in photogrammetry and computer vision, specifically the structure from motion (SfM) approach (Snavely, Seitz, and Szeliski Citation2008; Westoby et al. Citation2012), which does not require precise camera position information as required by traditional photogrammetric methods; (3) simple and portable analytical equipment (e.g. smartphones and vehicle cameras) with different sensors are now available everywhere for entertainment, personal health care, medical analysis, food safety and environmental monitoring.
Due to the low-cost and highly accessible tools for remote sensing data collection and processing, it became possible for anyone to create remote sensing products. In recent years, there is a rapid growth of interests in the volunteered geographic information (VGI) (Goodchild and Glennon Citation2010; Heipke Citation2010; Sui, Elwood, and Goodchild Citation2012). VGI is generated voluntarily by individuals and can enhance the traditional geospatial databases maintained by professional agencies. Volunteered/crowdsourcing images is a subset of VGI, which refers to the images generated by custom-level equipment and shared by the internet (Xie, Zhang, and Shan Citation2015). A famous application of crowdsourcing images is the ‘Building Rome in a Day’ project implemented by GRAIL Lab at the University of Washington (Agarwal et al. Citation2011). More and more applications can be found in urban 3D reconstruction (Menzel et al. Citation2016), disaster response (McDougall and Temple-Watts Citation2012), and digital protection of cultural relics (Wahbeh, Nebiker, and Fangi Citation2016).
In the era of big data, crowdsourcing images would significantly enhance the existing remote sensing database. However, current progress has mostly been limited in small regions and objects. Large-scale data acquisition still relies on professional satellite and airborne platforms, where some challenges still exist, e.g. low-frequency observations and expensive high-resolution images. The space-borne satellite missions have a relatively long return period, normally from several days to one month. Currently, with the rapid increase in remote sensing applications, the traditional satellite and airborne systems and data acquisition methods have been unable to meet the multiple demands for remote sensing data. For example, the disaster response requires rapid or near real-time earth observation data to improve the response time and reduce potential encounters with hazards (Oddo and Bolten Citation2019). The urban observation requires low-cost and frequent data for regular map updating and change detection (Qi et al. Citation2019). In the future, remote sensing data will be required to be high-resolution, fast, low-cost, and easily-accessible.
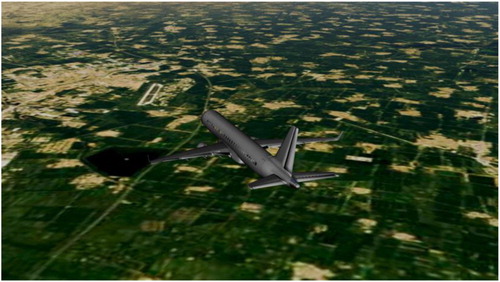
In this study, we envisioned a new volunteered remote sensing way to obtain aerial crowdsourcing images using a portable camera on a passenger aircraft (), which is termed as volunteered passenger aircraft remote sensing (VPARS). There is already a successful project (CARIBIC) which takes civil aircraft as platform to monitor the atmosphere based on an instrument container (Brenninkmeijer et al. Citation1999, Citation2007). The CARIBIC project save 10% cost than using special scientific research aircrafts and has advantage of regular observations. Similarly, it is also applicable and beneficial to obtain aerial photography data on the passenger aircraft. First, because mobile devices are advanced and common in people's daily lives, the use of handheld cameras to capture aerial data will be inexpensive and simple. These images from passengers could be very convenient to access, inexpensive and usable as professional aerial data. Second, due to the large number of airline routes, the captured land coverage data will be extremely dense and widespread, especially in the urban areas of developed countries or regions. Assuming that more than 1 passenger will upload an aerial image in one hour, the large number of flights at each moment of the day means that the data will have a very high temporal resolution. The large number of routes and passengers also increase the chances of obtaining more high-quality data, and a large amount of data will also increase the accuracy of the data. Third, air traffic control is implemented in many urban areas, especially in the region around the airport, mostly with the purpose of guaranteeing the safety of passenger aircrafts. However, the VPARS could be an ideal remote sensing mode in these areas because passenger aircrafts are not restricted and have very frequent visits. This paper will then examine the concept of VPARS and some associated issues, like processing framework, data maintenance, quality control, potential applications, limitations and challenges.
Figure 1. Simulated 3D view of a real passenger aircraft (GS7581) flying over Tianjin, China from Flightradar24 (Flightradar24 Citation2020).
2. VPARS concepts
The VPARS is a way to obtain remote sensing data based on the crowdsourcing images acquired by passengers using a handheld camera in passenger aircrafts. There are four basic elements involving in this concept: platform, camera, acquisition and processing. We will discuss the first three in this section. The data processing will be described in an individual section.
2.1. Platform
Before the emergence of commercial remote sensing system, aircraft used to be the main platform for remote sensing data collection. As the high-resolution satellite remote sensing data is open to the market, the spaceborne remote sensing has been widely adopted for geospatial data generation (Toth and Jóźków Citation2016). The spaceborne remote sensing has much wider spatial coverage and more regular observation, which make themselves suitable for analysis of large-scale phenomena. Nowadays, the airborne remote sensing is mostly used in scenarios where more details are required, or short-range sensors are equipped.
However, the prosperity of global civil aviation might bring more opportunities to the airborne remote sensing. The traditional airborne remote sensing requires to arrange a surveying aircraft and make a specified flight plan. It is often carried out as one-time operations and therefore not economic to routinely map a large area. However, the passenger aircraft is an existing platform and has dense and regular flight plans. There can be as many as 8,000 aircrafts at each moment and at least 150,000 flights every day (). Civil aviation routes connect nearly 200 countries and regions and 1,700 airports (Flightradar24 Citation2020). It provides opportunities for frequent, regular and low-cost data collection, which can complement the satellite remote sensing data in terms of time resolution and acquisition cost.
Figure 2. (a) Global flying aircrafts distribution at 20:00 on 2019-12-06. Blue pins denote the airport locations. (b) Number of flights tracked per day from December 1 to December 14, 2019. Data are from (Flightradar24 Citation2020).
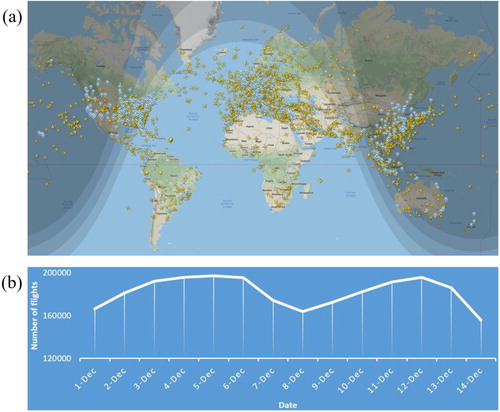
Assuming an average 900 km/h speed, 34 km strip width (the value will be explained in next section), and 8000 aircrafts over our head every moment, the coverage area each day would be 5.8750 × 10⁹ km2, close to the earth surface size. For comparison, the Landsat 8 satellite regularly acquires 550 scenes per day, and scene size is 185 km (cross-track) × 185 km (along-track) (NASA Citation2020b). The observing area is 1.8823 × 10⁷ km2 per day. It means the land observation coverage by global passenger aircraft are equal to 250 Landsat 8 satellites. Notably, the passenger aircraft is an almost no-cost platform while it is a huge cost to launch and maintain the large number of land observation satellites. It is also should be noted that the passenger aircraft routes will be more concentrated in the human-active area, while the satellite platforms have regular and uniformly distributed orbit. Therefore, the VPARS cannot get wall to wall coverage as satellite. Another feature of passenger aircraft platform is that the observing altitude is varying in the takeoff and landing phases. For the cities having airport, there are many planes taking off or landing in their airports. The low flying altitude in these two phases provides good opportunities to take high-resolution images for 3D city reconstruction.
2.2. Camera
Generally, high-accuracy data will be achieved with more expensive cameras, which include lenses with high optical quality. Larger sensor sizes and fields of view are preferred for generating high-quality remote sensing products. Many types of portable customer-level camera devices can be used, including digital single-lens reflex (DSLR), point-and-shoot, bridge cameras, and camera phones. A DSLR is a camera with the reflex design scheme that can present a direct optical view through the lens and capture very high-quality photos. Point-and-shoot cameras are compact and were designed to be affordable, convenient, and easy to use. Bridge cameras are cameras that fill the gap between point-and-shoot cameras and DSLRs. Camera phones are mobile phones which is able to capture photographs, mostly referring to smartphones. Theare is no doubt that DSLR perform the best in key camera characteristics involved in remote sensing and photogrammetry, including focal length, imaging size, sampling, principal point, and lens distortion. However, according to DxOMark's summary of the current state of the camera industry, the performance gap between smartphones and DSLRs is narrowing (DXOMARK Citation2020a). Smartphone is now widely applied for photogrammetry (Dabove, Grasso, and Piras Citation2019). A study using Iphone 5 and Canon G9 shows that no significant differences were found between the models in a comparative analysis (Wróżyński et al. Citation2017). The volumes of the models differed from the actual volume just by 0.7 and 2 h. According to Statista (Citation2020), there is 3.2 billion smartphone users in the world today (a). This data means that 40 percentage of the world's 7.6 billion inhabitants now have a smartphone today.
Figure 3. (a) Number of smartphone users from 2016 to 2019 (Data from Statista [Citation2020]). (b) Smartphone camera rank from 2013 to 2019 (Data from DXOMARK [Citation2020b]).
![Figure 3. (a) Number of smartphone users from 2016 to 2019 (Data from Statista [Citation2020]). (b) Smartphone camera rank from 2013 to 2019 (Data from DXOMARK [Citation2020b]).](/cms/asset/3a628644-05de-4993-a59d-fa681d08c4f8/tjde_a_1808721_f0003_oc.jpg)
The smartphone cameras have improved notably over the past few years. A number of different software and hardware strategies have been introduced for improvements in areas such as exposure (scene analysis), stabilization (optical stabilization and software buffering), autofocus (more AF sensors), zoom (dual cameras), bokeh (‘fake’ bokeh modes), and more. We can see that every generation from Apple, Samsung, Huawei, and Google smartphones have image quality reaching higher levels than ever (b). The popularity of the smartphone and improvement of smartphone cameras in recent years enable the possibility of VPARS. It is reasonable to believe that each adult passenger on an aircraft has a smartphone with a high-quality camera, enabling the basic requirements on camera availability and image quality from VPARS. With the phone cameras, different remote sensing products can be collected according to the sun illumination conditions. The images captured in the daytime can be used to generate conventional optical images, while a nighttime remote sensing image can be obtained at night.
2.3. Acquisition
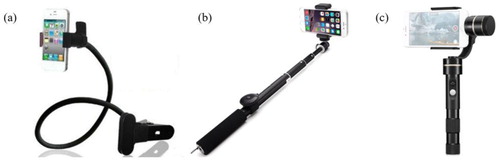
Many window seats are available in aircrafts where passengers can capture high-quality images of the ground using handheld cameras. Taking a Boeing 787–9 plane for example (Air New Zealand Citation2020), there are approximately 85 window seats. Considering 30 window seats might be blocked by plane wings and engines, there are still about 52 windows seats which can directly observe the ground. To facilitate the photogrammetry processing, the image capturing is better to follow two important rules. Firstly, the images need to have an amount of overlap (>50%) to make sure they can be aligned successfully. Second, a low incident angle is required so that more ground details could be included into one picture, and the dense point matching would be much easier. For an easy and stable photographing, the camera can be mounted on the tray table of a window seat using mounting accessories, like the flexible 360 clip mobile phone holder (). The imaging can be automatically done through an app with timer function on the smartphone. Another semi-automatic capturing method is to use the sefie stick, where the incidence angle can be easily adjusted and the shutter can be remotely controlled. Additionally, when camera shakes during the takeoff and land, gimbal stabilizer can be adopted to make the images stable and clear.
Figure 4. Three typical accessories that can be used to facilitate image capturing (a) Flexible 360 clip mobile phone holder. (b) Sefie stick. (c) Gimbal Stabilizer.
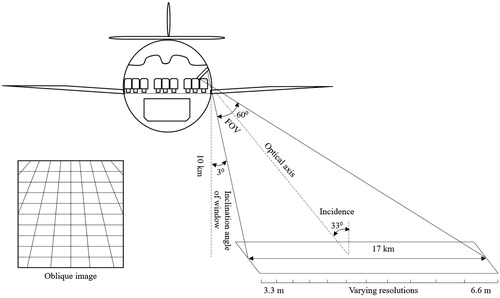
As the passengers sit on two sides of the plane, the VPARS has a side-look imaging geometry (). A defect in these oblique images is the varying scales (Verykokou and Ioannidis Citation2018). To reduce its influence on image quality, the incidence angle should be as small as possible. The average FOV of a smartphone camera is about 60°. During a smooth flight, the minimum incidence angle can be adjusted to about half FOV plus the inclination of seat window (about 3° measured from the Schematic of the Boeing 787–8). Commercial aircrafts typically fly between 9 and 11 km. According to the slant imaging geometry, the strip width would be approximately 17 km. Assuming 3000 image pixels along the width, the ground resolution would range from about 3.3–6.6 m.
Figure 5. VPARS imaging geometry.
3. VPARS data processing
3.1. Remote sensing production generation
Compared to classical aerial remote sensing and photogrammetry, the VPARS method has many advantages, such as low cost, dense coverage, fewer airspace restrictions and a short revisit period. However, the VPARS processing would also be more challenging for the following reasons:
Consumer-grade cameras have smaller sensor sizes than professional digital aerial cameras and therefore correspond to relatively low-quality images.
The orientation and positioning parameters are often not available in the images taken from a passenger craft.
Due to the observation direction from the seat, only oblique images can be obtained, which have some defects, such as varying scales, the existence of invisible areas, and overexposure of the horizon (Hoehle Citation2008; Verykokou and Ioannidis Citation2018).
The images are blocked by the seat windows, making the photos less clear than directly imaging.
To overcome these challenges, we cannot rely on a traditional photogrammetric approach to tie and restitute the images. An applicable processing procedure for VPARS production generation is proposed as follows:
3.1.1. Camera positions initialization
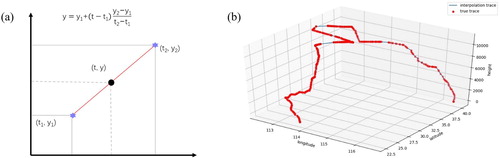
Approximate camera positions are necessary for rapid conjugate point detection and georeferencing of the sparse point cloud. Unlike professional surveying systems, most handheld cameras do not contain positioning and orientation information. Nowadays some cameras have a GPS module (e.g. smartphone camera), the GPS signal is normally required to be shut down for flight security. Fortunately, the modern radiocommunication systems of aircrafts such as the Aircraft Communication Addressing and Reporting System (ACARS) and Automatic Dependent Surveillance Broadcast (ADS-B) allow GPS positioning information to be sent publicly from most passenger aircrafts. This information has been collected by commercial companies to offer flight tracking services, and we can normally obtain the GPS positions of a flight with a certain sampling frequency (e.g. ∼1/30 Hz in FlightAware) from this information. The time information from image files can, therefore, be used to synchronize the position information. As passenger aircrafts are relatively stable, we can apply piecewise linear interpolation to calculate the initial camera positions (). Please note that the interpolation values are set as initial values for camera positions, and the positioning error will be reduced in the further step with the ground control points (GCPs).
Figure 6. (a) Diagram of 1-D piecewise linear interpolation along time. (b) Piecewise linear interpolation of the discrete aircraft positions downloaded from FlightAware. Red points are the original flight tracking points with position information, and blue line is the flight trace interpolated from original flight tracking points.
3.1.2. Interior orientation parameters initialized from the exchangeable image file (EXIF) header
In addition to the camera positioning information, approximate interior orientation parameters, including the focal length and the sensor size, are also needed to facilitate conjugate point searching. Currently, most of new digital camera automatically saves EXIF data with the photo. The focal length, camera manufacturer and model number are typically included in the EXIF data. With the camera model number, the sensor size can be found from the product specification file (normally available in the website of manufacturer). Also, the interior camera orientation parameters will be further refined in the next step.
3.1.3. Structure from motion (SfM)
With the initialized GPS position and interior orientation parameters, many airborne photogrammetry software programs are available for the SfM processing, e.g. Pix4d, Menci APS, Agisoft Metashape and MicMac. The processing efficiency is of great importance as VPARS will generate a large amount of images. Our tests find Agisoft Metashape has satisfactory computational performance with GPU acceleration (Agisoft Citation2019), and its accuracy is acceptable for VPARS images as shown below. We therefore propose to use it in the VPARS data processing framework. The workflow algorithms used in the software are not fully provided, but most of them are based on standard and published SfM algorithms. The conventional SfM workflow is as follows:
Determine the matching points in multiple photographs taken from different angles using the scale-invariant feature transform (SIFT) algorithm (Lowe Citation2004).
Use the sparse bundle adjustment (Triggs et al. Citation1999) to estimate the camera position and extract a low-density point cloud.
Optimize the internal and external camera orientation parameters through the manual identification of GCPs in the images, followed by a bundle adjustment using the GCPs.
3.1.4. Orthoimage mosaic generation
Once the SfM workflow is completed, a dense point cloud can be obtained by a dense image stereo. Then, the digital surface model (DSM) in the form of raster images can be generated from the regular interpolation of the point cloud. The multiple input photos are then orthorectified to orthophotos based on the DSM and individual camera positions. To mosaic these orthophotos, several strategies are normally available, such as averaging the values of all pixels from individual photos, taking pixels from the photo observations closest to the normal direction, or using a frequency domain approach (Agisoft Citation2019).
3.2. Product enhancement
Haze and cloud are two common artifacts in optical remote sensing images. The haze reduces the contrast of images and influences their interpretation. The clouds make the data in those area unusable. However, the haze transparency leaves an opportunity for imagery restoration and removal of haze is possible. And, small clouds are possible to be removed by stacking neighboring multiview images in VPARS (the cloud removal principle will be described below by a real case). Therefore, two optional enhancement steps in VPARS are haze removal and cloud detection.
3.2.1. Haze removal
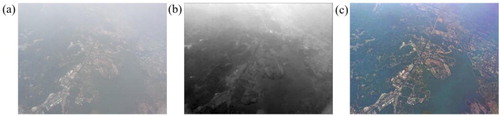
The dark channel prior (DCP) based algorithm was used for haze removal in VPARS (). This algorithm is based on the observation that most local patches in outdoor haze-free images contain some pixels whose intensity is very low in at least one color channel (He, Sun, and Tang Citation2011). With this prior, the ill-posed haze-free image reconstruction problem can be well solved. Five major steps are required to dehaze the image: the dark channel calculation, atmospheric light estimation, transmission map estimation, transmission refinement, and the haze-free image reconstruction.
Figure 7. (a) Original hazy VPARS image, (b) dark channel of this image, and (c) restored haze-free VPARS image.
3.2.2. Cloud detection
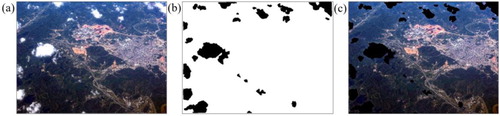
We select the XGBoost algorithm which can prevent overfitting for cloud detection in VPARS (Chen and Guestrin Citation2016). Firstly, some cloud samples were manually selected in the VPARS image to train the XGBoost model. Then, the hyperparameters were adjusted during the model training to obtain the best prediction performance. Finally, the trained model is used to predict the cloudy pixels for input VPARS images. These pixels will be masked in further processing, enabling automatic cloud removal in the orthoimage mosaic step (). Several studies show that deep learning algorithm performs well in automatic cloud detection (Shao et al. Citation2017, Citation2019), which will be further investigated for VPARS in future study.
Figure 8. (a) VPARS image with cloud, (b) binary map of cloud masks, and (c) VPARS image with cloud masks.
3.3. Examples of VPARS products
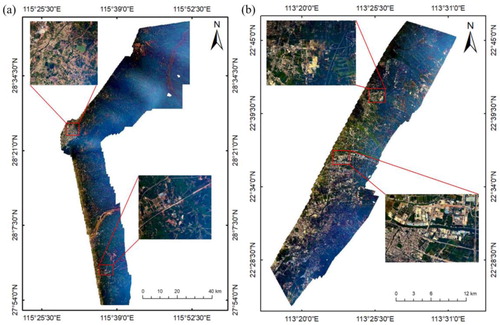
Three datasets are collected using a handheld iPhone X camera to test this innovative remote sensing mode. Two datasets contain videos captured during the day on 16 June 2018, during flight DZ6230 from Nanchang airport to Shenzhen airport with image sizes of 1920 × 1080 and 3820 × 2160. The other dataset contains image data captured at night on 29 June 2018, during flight HU7701 from Beijing airport to Shenzhen airport. The first daytime images cover a very flat area mostly represented by cropland and low buildings in the countryside. The second set of daytime data include some tall buildings in a moderately sized city named Zhongshan. For the nighttime data, we selected eight images that covered Changsha city located in central China for analysis. The three areas are shown in , and the image details are shown in .
Figure 9. The flight information for the experiment. (a) Flight map. (b) Altitude and speed information of the flights.
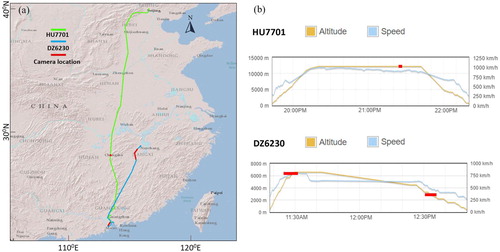
Table 1. The data collection details for the experiment.
3.3.1. Daytime map
The frame per second of the original videos is 30. To save heavy workload for processing all frames in the video, we sampled one image every 5 s. For case 1, the cover area of single image is about 288 km2 and the flight speed is about 750 km/h. For case 2, the cover area of single image is about 47 km2 and the flight speed is about 500 km/h. The overlap between neighboring sampled images for two cases are both larger than 50%, therefore the frequency (1/5 HZ) of our sampling is enough for the subsequent photogrammetry block adjustment.
We downloaded the flight track log from the FlightAware website to obtain coarse GPS trajectory positions of flight DZ6230 every 30 s. The capture time of each image was computed based on the time information recorded in the video file. We then ran a piecewise linear interpolation on the discrete flight position data to obtain the camera position for each image. Considering a certain degree of uncertainty from the reported flight position and interpolation, the measurement accuracy for the camera position was roughly set to about 10 times larger than the accuracy of GCPs. We define an average ground altitude of 0 m to avoid computation errors due to the very oblique shooting angle. A focal length of 4 mm and a sensor size of 2.65 × 1.99 mm were preset according to the EXIF information read from the image file captured by the iPhone X back dual camera. The pixel size used in Metashape can be computed by dividing the sensor size by the image size. With this basic information, we ran a sparse bundle adjustment to estimate the camera position and extract sparse point clouds.
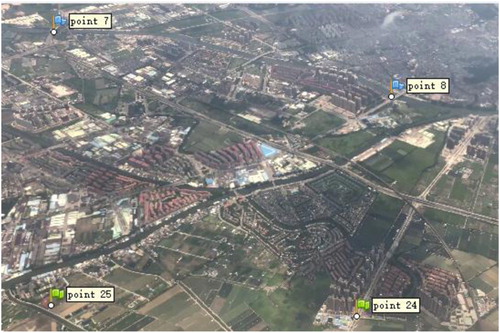
Based on the sparse cloud points, a preliminary orthomosaic image was derived, and GCPs were easily and quickly selected from these images. We then compared this image with a Google Earth image to located common feature points as GCPs. The heights of these GCPs were acquired from the Advanced Spaceborne Thermal Emission and Reflection Radiometer (ASTER) global digital elevation model (GDEM) (Abrams et al. Citation2010). Approximately 45 and 35 GCPs that were uniformly distributed throughout the image were used for cases 1 and 2; most of which are corners of roads or land parcels (). The corners are all selected on the ground, as we rely on the DEM to obtain the GCP elevation measurements, where the values are all on the ground, and surface object height is not included.
Figure 10. Example of selecting GCPs in the image. These GCPS should better be: (1) located at corners of roads or land parcels; (2) distributed uniformly on the image; (3) on the ground.
With the GCPs and preliminary camera positions, we then follow the conventional SfM and orthomosaic steps mentioned above to generate a dense point cloud and a corresponding orthomosaic image. Considering the ground sampling resolution (
), case 1 has a resolution of 5.92 m for the mosaic image, and case 2 has a resolution of 1.56 m. The capturing distance is not the flying height here because the handheld images are oblique images rather than nadir images. Capturing distance varies for the pixels in oblique images and is approximately calculated as the distance from the camera to the center of the ground scene. Such resolution (GSD) cannot compete with high-resolution professional remote sensing products, but it is still enough for recognizing basic meter-level objects, such as roads, buildings, croplands and rivers, as seen in . A notable feature is that the VPARS approach can cover a very large observation area in a short time, as an area of 1700 km2 is captured in 7.5 min in case 1, and an area of 277 km2 is captured in 5 min in case 2. However, low-altitude remote sensing would take a long time to survey the same size area. Spaceborne remote sensing has better efficiency, but due to platform limitations, the cost is high and the observation interval is long. The VPARS method has almost no cost, and the observation interval can be very short. There are normally dozens of or even hundreds of flights along each flight line every day, and such a high observation frequency is extremely useful for the monitoring of disasters such as floods and earthquakes.
Figure 11. Results of daytime image processing. (a) Orthomosaic image of case 1. (b) Orthomosaic image of case 2.
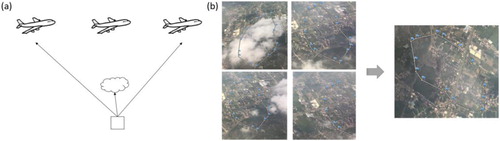
Optical remote sensing images always encounter the problem of cloud cover, especially in humid tropical regions. In satellite remote sensing, the commonly used method to generate cloud-free images is by mosaicking a set of images taken at different times in the same area. The cloudy areas in the image are masked out and then filled with cloud-free areas from other images acquired at different times (Du et al. Citation2019). A major problem of such mosaic image is that the temporal resolution is lost, which is not preferred given that satellite remote sensing has already insufficient revisit frequency. However, in the cases of a partly cloudy region, a passenger aircraft can still see the ground under the clouds through different viewing angles during flight. We can produce a cloud-free mosaic from several multiview images similar to the previous cloud-free image generation using time-series satellite images (e.g. ). The major difference is that the VPARS images are taken around approximately the same timeframe; thus, ground changes can be ignored. Therefore, using the VPARS method, it is possible to generate cloud-free orthomosaic images in certain cloud-coverage conditions where satellite remote sensing images cannot avoid clouds.
Figure 12. Clouds removed by taking advantage of images from multiple viewing angles. (a) Cartoon diagram showing how multiple-images are generated. (b) A case of removing cloud using images from multiple viewing angles. The rectangle indicates the cloudy area.
Although several obvious advantages are analyzed above, the quality of the results is still relatively worse than conventional remote sensing methods, which is mostly due to the small sensor size and oblique images. Many far-field pixels have the problem of overexposure and poor resolution, and the pixels behind tall buildings are distorted. These problems are difficult to avoid because the ground is observed from a side view, resulting in that only oblique images can be obtained. Such images have the problems of varying scale and overexposure of the horizon. Image fusion before or after product generation would be helpful to mitigate these errors or distortions. In future work, the corresponding image fusing algorithms which can fulfill the missing features or correct the pixel errors by combining multiple images need to be developed.
We also analyze the geometric accuracy of orthomosaic images using self-calibration results based on GCPs picked from high-resolution satellite images in the Google earth. contains the results for the three flights. In addition to the GCPs used for adjusting the images (noted as control points), we also take approximately 6 GCPs to serve as validation points (noted as validation points) to evaluate the geometric accuracies of the orthomosaic images. A final root mean square error (RMSE) value for both the control points and validation points is obtained. The mean geometric errors of the validation points were 50.9 and 32.9 m for cases 1 and 2, respectively. Larger misalignments of the GCPs were mostly found in the far-field areas.
Table 2. Geometric accuracy of orthorectified images.
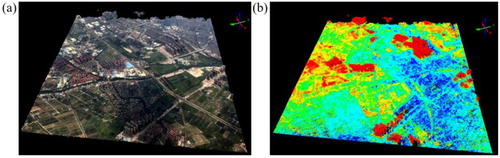
In addition to the orthomosaic images, other notable products are the dense cloud points and DSM. We obtain cloud points under the ‘ultrahigh’ resolution mode and obtain densities of 0.3 pt/m2 for case 1 and 0.023 pt/m2 for case 2. The original point cloud is slightly noisy, but the heights of the ground objects are in general agreement with reality ().
Figure 13. Samples of point clouds. (a) Rendered by true color. (b) Rendered by height.
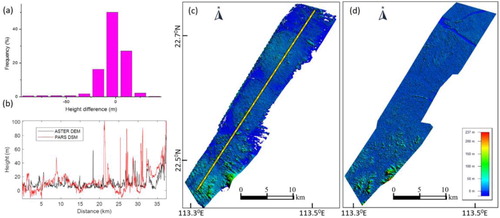
To validate the height accuracy, we compare the derived DSM with the ASTER DEM dataset. Several height profiles were generated from the point cloud, and the statistics of their difference were calculated. RMSEs of 19 m () and 15.1 m () were obtained for cases 1 and 2, respectively. Some of these differences originate from the object heights (e.g. buildings and trees) included in the derived DSM. It can be seen in the height profile comparison, where the VPARS DSM is much larger than ASTER DEM in some points. In addition, large height errors can be found along the boundaries, which are mostly due to a lack of GCPs. Additionally, there are certain height uncertainties (7–15 m) in the ASTER DEM (Hirano, Welch, and Lang Citation2003). Although the point density and DSM accuracy are not comparable to conventional airborne photogrammetry, the cloud point results are still acceptable and can be used in certain applications that have fewer resolution requirements. If very fine accuracy is required, more efforts can be made, such as performing more GCP field surveys or using a better camera. The development of automatic GCP identification through image matching between VPARS images and georeferenced high-resolution images would be of great help to improve the processing accuracy and efficiency in future work.
Figure 14. DEM results of case 1. (a) Histograms of elevation errors. (b) Height profile comparison. (c) Derived DEM from VPARS. (d) ASTER DEM for comparison.
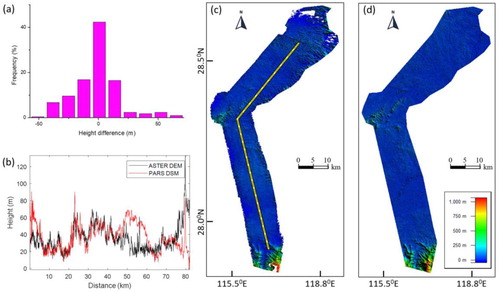
Figure 15. DEM results of case 2. (a) Histograms of elevation errors. (b) Height profile comparison. (c) Derived DEM from VPARS. (d) ASTER DEM for comparison.
3.3.2. Nighttime map
The procedure used to generate the nighttime map is similar to that used for the daytime map. A major difference is that there are fewer images, as the light conditions are poor; thus, photos need to be manually taken instead of videos to ensure better image quality. Fortunately, the areas evaluated in the nighttime map are cities that are not very large. Several images are normally sufficient to ensure full coverage at the altitude of an aircraft. In this test, we used eight images captured by an iPhone X over Changsha city. Eleven GCPs were used to optimize the initial camera alignment. The dense points that were generated are very noisy. Therefore, we manually deleted some noisy points and derived a relatively smooth DSM for orthomosaic processing. The final orthomosaic image had a resolution of 7.5 m and size of 2590 km2, where the road structure was very clear, and most of this city was covered (a). Compared with the 500–1000 m resolution of the widely used night light images from NPP/VIIRS and DMSP/OLS (b), the resolution is approximately 100 times higher, which is very encouraging. This high resolution allows for very fine scale research and applications using nighttime remote sensing products, such as social economy parameter estimation, regional development analysis, urbanization monitoring, and light pollution estimation. The geometric errors are relatively larger than those of the daytime map, which are 187 m for control points and 188 m for checkpoints, but more accurate results can be obtained by improving the camera quality and number of GCPs.
Figure 16. (a) Nighttime Imagery from VPARS. (b) The VIIRS Nighttime Imagery (Day/Night Band, Enhanced Near Constant Contrast) on July 1, 2018 downloaded from Worldview (NASA Citation2020a).
3.4. Applications of VPARS products
To explore the potential of using the products derived from VPARS, we examine two preliminary applications. The first application tests the potential of classifying land cover from daytime images, while the second application analyzes urban areas using nighttime images.
3.4.1. Land cover classification using daytime map
The classification procedure follows an object-oriented remote sensing classification approach (Hu et al. Citation2016). We cut a ∼1500 × 1500 m region from the derived orthomosaic image of case 2 to validate its land cover classification potential. Another dataset of Google Earth images sampled at the same resolution over the same area was used for comparison. For each image, we manually selected ∼70 training samples. According to the number of object classes that could be recognized by the human eye, we defined three categories in the map, i.e. water, vegetation/trees, and artificial ground. The classification results of the two data sources are shown in .
Figure 17. (a) Google Earth image. (b) VPARS orthomosaic image. (c) Classification based on a Google Earth image. (d) Classification based on VPARS orthomosaic image.
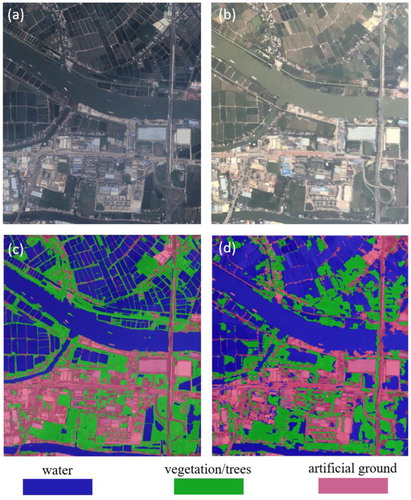
From visual interpretation, we find that our derived optical image has satisfactory performance in classifying the three predefined categories. Most buildings, roads, and rivers are identified correctly. As the Google images were captured several years ago, the classification map cannot be the same due to land cover changes. By comparing the two classification results, we are able to identify several typical land cover changes reflecting local economic activity, such as the conversion of vegetation land to fish ponds, and natural ground to buildings. This result implies that the VPARS data has the capability to capture urbanization and agriculture activities. However, we should also admit that the quality is still not as good as that of high-resolution satellite images. The boundaries between objects are not clear, and some objects are distorted, which may result in contaminated classification results. One reason for this poor quality is that the imaging geometry is oblique and therefore brings challenges to the orthorectifying process. In addition, the image quality from the video frame is not comparable to that of direct imaging because video files are often compressed in ways that change the details of the picture, resulting in noise or vague pixels. However, in the future, automatic imaging applications will be developed; the results are expected to be improved significantly.
3.4.2. Economic activity monitoring using nighttime map
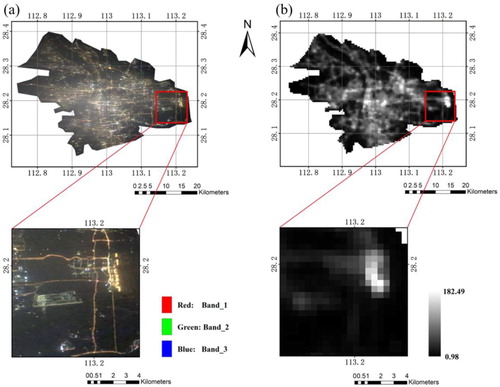
Compared with traditional nighttime images, our nighttime results have an extremely high resolution, allowing for more detailed urban studies that were previously limited by insufficient resolution. Point of interest (POI) data are another type of high-resolution socioeconomic spatial data. The high resolution of the VPARS nighttime image, therefore, allows for the co-analysis of these two different data types. On the one hand, a spatial coupling analysis can reveal the relationship between these two data types and can, therefore, help to understand dynamic urban mechanisms. In this case, we ran a spatial coupling analysis of the commercial POI point distribution and the derived nighttime image of Changsha city (). POI data were collected from Amap (also called Gaode Ditu in Chinese) on May 2018, which is around the date that the nighttime image was collected. We first calculated the POI density from the commercial POI points (shops) in each pixel grid of the geocoded nighttime map. The pixels with POI numbers larger than 10 are plotted in c for coupling analysis. The nighttime RGB image was transformed to a brightness map using the equation: brightness = 0.3 × R + 0.59 × G + 0.11 × B. A regression analysis of the gridded POI density and night light DN was implemented, as shown in d. The grids are grouped into several intervals according to their POI number, and the average of DN values for the grids in each interval is used for linear regression.
Figure 18. (a) POI density map in Changsha. (b) VPARS nightlight brightness map in Changsha. (c) POI grids with >10 POIs. (d) The regression analysis between nightlight brightness and POI number.
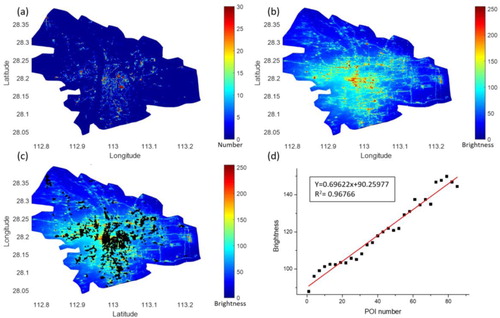
The night light data exhibit a very good linear relationship with the commercial POI density. The spatial overlay of the POI and night light map also suggests a very close spatial coupling. These results are expected because both types of data are indicators of commercial activities. Many previous studies have validated that night light data are closed linearly related to GDP values. The strong correlation supports that our generated night light map has performance that is comparable to traditional datasets. Moreover, the high resolution of passenger airline nighttime remote sensing allows for a more detailed analysis of urban development. As shown in c, we can clearly identify uneven development at a relatively high resolution, and some of these areas have more POIs and some have fewer POIs than expected from the nighttime light data. The area with fewer POIs may imply an overinvestment to infrastructure, such as the redundant construction of commercial centers or manufacturing districts, while the areas with more POI are possibly the places that are crowded by the lowest class of citizens who are not adequately cared for by the government. This detailed information is especially useful for the government to balance urban development.
4. Issues
4.1. Data maintenance and quality control
Data maintenance is the first issue need to be concerned for the development of the VPARS. The application of VPARS strongly depend on continuous and increasing images acquiring from volunteers. Like most citizen science activities (Haklay Citation2013), we can expect that the participants in the VPARS will be predominately a member of middle-class with well education, high income, and technical skills to participate. Due to the higher price of airline than other transportation tools (e.g. train and bus), most airline passengers are within the scope of citizen science participants.
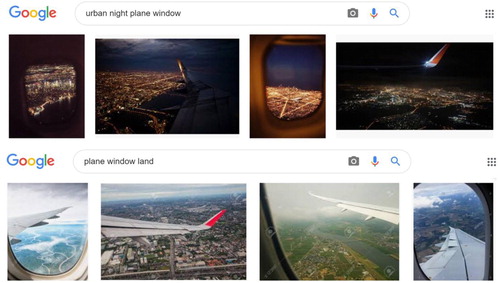
There are several factors to driver passenger to collect data for VPARS, including the reducing costs of sophisticated mobile devices, the improving quality of hand-held camera, the development of Web applications and the trends of virtual social network. The reduced cost and improving imaging technique make it possible for participants to generate high-quality images without many efforts. The Web applications and virtual social network trend enable the participants to share these images. When searching keyword ‘urban night plane window’ or ‘plane window land’ in google, we can already find a large amount of land observation images available (). An interesting phenomenon is that some airline company (e.g. Emirate) begin to include external cameras to the inflight entertainment system, allowing passengers to see the earth from plane. If airline companies can be volunteers to make the external camera accessible, there would be a great advance in VPARS.
Figure 19. Several Google searching results using the keywords of ‘urban night plane window’ and ‘plane window land.’
A main problem for VGI datasets is that the quality and reliability are uncertain, and must be handled prior to usage (Senaratne et al. Citation2017). In VPARS, the data quality issue is mainly that the images are not well organized. Time and location information are missed, and images are rarely overlap with each other, making it difficult or impossible for further orthorectifying process. How to control the data quality are important issue for VGI applications (Goodchild and Li Citation2012). Wikimapia and OpenStreetMap are two well-known formats of VGI platform to collect the geographic data. Comparing to these two mature projects requiring collaborative interpretation, the VPARS project would be relatively simpler as the engagement of volunteer is limited in providing original images and airline information (Karimipour and Azari Citation2015). A simple way to obtain formatted VPARS data is to build image upload group based on existing image sharing web service (e.g. flickr and facebook). Taking advantage of the existing large number of users and sophisticated social network, there is more opportunities to attract participants to upload these images. For quality control, an effective way is to make some sharing rules to guide participants to upload high-quality data. Three applicable rules include: (1) adjacent images should overlap larger than 50%; (2) pictures should cover as much near-field ground as possible; (3) flight number and exif information should be attached to the image. Furthermore, if the participant is familiar with the camera setting, it is better to use the professional camera mode which allows users to maximize the quality of images. In VPARS, the camera keeps moving with the plane, and there is a seat window blocking ground from camera. Both factors bring negative impact on the image quality. To obtain clear images, it is better to use fixed focal length, fast shutter speed and low ISO. However, as light conditions changes in different situations, the camera settings should also be manually adjusted.
4.2. Potential applications
Several obvious advantages of VPARS are significant, including low cost, short repetition period, the lack of impact by small clouds, and high nighttime image resolution. Considering the unique features of land observations from passenger aircrafts revealed by our tests, we believe that this method has great potential to contribute to many fields that rely on remote sensing data, some of which are discussed as follows:
4.2.1. Emergency management
The challenge for monitoring most natural or man-made disasters is that the data are not sufficiently frequent, resulting in delayed disaster response and very large losses (Oddo and Bolten Citation2019). For example, in earthquake emergency response, traditional satellite remote sensing is limited by the insufficient temporal resolution. The damage map from remote sensing will not be of much use if the sensor does not acquired data during the interested period (Dell’Acqua and Gamba Citation2012). In flood assessment, significant gaps in temporal information typically occur during the disaster. Limited by the insufficient temporal resolution, the scientific community cannot adequately predict, observe, and produce useful flood reports (Hultquist and Cervone Citation2020). The long revisit time of most spaceborne platform make satellite-based remote sensing only useful for long-term regional floods. Monitoring short-lived floods is often difficult due to lack of high temporal resolution data (Rahman and Di Citation2017). However, under the framework of VPARS, the already crowded air routes allow for very dense observations. Up-to-date dataset can be gathered as quickly as possible. For typical disasters including floods, wildfires, earthquakes, landslides, storms, and chemical explosions, the VPARS data can greatly contribute to accelerating disaster response, mitigating risk, obtaining situational awareness, and improving recovery.
4.2.2. Human activity
Statistical studies show strong correlations between nighttime light brightness and demographic-economic variables. Nighttime remote sensing data, mainly NPP/VIIRS and DMSP/OLS data, have been widely applied to monitor human activities. However, due to the low resolution (500–100 m) of these data, most studies are conducted on global or national scales. The high resolution of nighttime images generated by VPARS makes it possible to identify details, e.g. major roads and large business districts, from the urban fabric, benefiting many urban-scale socioeconomic applications. Moreover, the sun-synchronous satellite observes the earth at a fixed time, making it difficult to observe the night light change during one night. The VPARS can generate image with high time resolution, enabling the more detailed analysis of human or city activities. The flexible observing time can also avoid the temporal inconsistency for comparing nightlight radiance between different regions in traditional spaceborne nightlight remote sensing (Xie and Weng Citation2017).
4.2.3. Resource management
Information regarding land cover and its change over time is essential for a variety of societal needs. Current land cover mapping work is mostly based on satellite images, where the Landsat dataset is most often used, as it is free and open to the public. A drawback of Landsat data is the relatively low spatial (∼30 m) and temporal (16-day repetition period) resolution. Some high-resolution satellite images are costly to the user. For example, the prices for ordering new Pleiades and WorldView-3 images range from 21.25/km2 to 29/km2. Normally minimum order area is 100 km2 with a 5 km minimum order width, and additional cost is required to guarantee 5% or less cloud cover (LANDINFO Citation2020). The high cost sometimes limits some potential applications of remote sensing technologies. The proposed passenger airline remote sensing mode is inexpensive because it is based on existing platforms with complete aviation regulations, where no additional cost is required for the platform. Additionally, this method has a short repetition period as there are many flights every day. One additional benefit is that some small clouds can be removed by fusing multiple images from different views. This method therefore allows economic, frequent and partly cloud-free land mapping, supporting the management of natural resources or personal assets by the government, organizations or even individuals.
4.2.4. Urban 3D reconstruction
Reconstruction of buildings and landscapes in 3D is the basic step for many smart city applications (Wang et al. Citation2019). Such work has long been implemented by professional aerial surveying. Due to the high cost and air traffic control over large city, this kind of aerial surveying campaign is rare, making the 3D information always be outdated. However, the VPARS method could be an ideal remote sensing method to do this work because passenger aircrafts are not restricted and have very frequent visits. The frequent and low cost for 3D construction may enable some new applications. For example, the illegal building constructions can be easy to detect with the frequent urban 3D data.
4.3. Limitations and challenges
Although the VPARS has the many significant advantages, there are still many limitations and challenges to this method at current stage. Firstly, due to the custom-level camera, the quality of final remote sensing products will be not comparable to professional ones, in terms of low geometric accuracy and radiation distortion. Secondly, the observing geometry of passengers means that only oblique images can be obtained. The oblique images will bring varying resolution and inconsistent quality in the same product. Thirdly, in volunteered geographic information collection, the data are captured by various devices under different parameter settings. It results in heterogeneous imaging quality and irregular time and spatial coverage, which brings challenges for further applications. Fourthly, the data processing for large amount of VPARS unstructured data is complex. Current image processing algorithms mostly designed for structured data collected by professional device. For best use of this data, more flexible, automatic and sophisticated algorithms are required.
5. Conclusion
After half a century development, the remote sensing technology shows an apparent tendency to move from researchers to the public. Our study validates a novel volunteered remote sensing and photogrammetry mode using a customer-level handheld camera in passenger aircrafts. This mode is simply to operate, which makes it very convenient for the public to collect remote sensing data in a crowdsourcing manner. The results from both daytime and nighttime images are encouraging. Using the videos or images taken by a hand-held camera from a normal passenger sitting in a window seat, our experiment shows that it is possible to generate geocoded orthoimage, point cloud, DEM and nighttime image products similar to those generated by conventional remote sensing. The geometric and height accuracies are not comparable to professional remote sensing products, but several obvious advantages are still encouraging, including low cost, short repetition period, the lack of impact by small clouds, and high nighttime image resolution, enabling great potential in many traditional remote sensing application fields.
Like most crowdsourcing or volunteered data collection (Elwood, Goodchild, and Sui Citation2012; Goodchild and Li Citation2012), the remaining challenges for the VPARS method are image collection, quality control and big data management, which separately relate to how to encourage passengers to share images, how to process oblique images and how to analyze large images. If these problems are properly solved, it is easy to foresee that this novel remote sensing mode will generate a great mount of free remote sensing data and contribute to many Earth observation fields.
Supplementary_Material
Download Zip (2.7 MB)Disclosure statement
No potential conflict of interest was reported by the author(s).
Additional information
Funding
References
- Abrams, Michael, Bryan Bailey, Hiroji Tsu, and Masami Hato. 2010. “The ASTER Global DEM.” Photogrammetric Engineering and Remote Sensing 76 (4): 344–348.
- Agarwal, Sameer, Yasutaka Furukawa, Noah Snavely, Ian Simon, Brian Curless, Steven M. Seitz, and Richard Szeliski. 2011. “Building Rome in a Day.” Communications of the ACM 54 (10): 105–112. doi: 10.1145/2001269.2001293
- Agisoft. 2019. “Agisoft Metashape User Manual Professional Edition.”
- Air New Zealand. 2020. “Boeing 787–9.” Accessed January 4. https://www.airnewzealand.com/seat-map-boeing-787-9.
- Boccardo, Piero, and Fabio Giulio Tonolo. 2015. “Remote Sensing Role in Emergency Mapping for Disaster Response.” In Engineering Geology for Society and Territory. Vol. 5, edited by Giorgio Lollino, Andrea Manconi, Fausto Guzzetti, Martin Culshaw, Peter Bobrowsky, and Fabio Luino, 17–24. Cham: Springer.
- Brenninkmeijer, C. A. M., P. Crutzen, F. Boumard, T. Dauer, B. Dix, R. Ebinghaus, D. Filippi, et al. 2007. “Civil Aircraft for the Regular Investigation of the Atmosphere Based on an Instrumented Container: The new CARIBIC System.” Atmospheric Chemistry and Physics 7 (18): 4953–4976. doi: 10.5194/acp-7-4953-2007
- Brenninkmeijer, C. A. M., P. J. Crutzen, H. Fischer, H. Güsten, W. Hans, G. Heinrich, J. Heintzenberg, et al. 1999. “CARIBIC—Civil Aircraft for Global Measurement of Trace Gases and Aerosols in the Tropopause Region.” Journal of Atmospheric and Oceanic Technology 16 (10): 1373–1383. doi: 10.1175/1520-0426(1999)016<1373:CCAFGM>2.0.CO;2
- Chen, Tianqi, and Carlos Guestrin. 2016. “XGBoost: A Scalable Tree Boosting System.” Paper presented at the Proceedings of the 22nd ACM SIGKDD International Conference on Knowledge Discovery and Data Mining, 2016.
- Colomina, I., and P. Molina. 2014. “Unmanned Aerial Systems for Photogrammetry and Remote Sensing: A Review.” ISPRS Journal of Photogrammetry and Remote Sensing 92: 79–97. doi:10.1016/j.isprsjprs.2014.02.013.
- Dabove, Paolo, Nives Grasso, and Marco Piras. 2019. “Smartphone-Based Photogrammetry for the 3D Modeling of a Geomorphological Structure.” Applied Sciences 9 (18): 3884. doi: 10.3390/app9183884
- Dell’Acqua, F., and P. Gamba. 2012. “Remote Sensing and Earthquake Damage Assessment: Experiences, Limits, and Perspectives.” Proceedings of the IEEE 100 (10): 2876–2890. doi:10.1109/JPROC.2012.2196404.
- Du, Wenhui, Zhihao Qin, Jinlong Fan, Maofang Gao, Fei Wang, and Bilawal Abbasi. 2019. “An Efficient Approach to Remove Thick Cloud in VNIR Bands of Multi-Temporal Remote Sensing Images.” Remote Sensing 11 (11): 1284. doi: 10.3390/rs11111284
- DXOMARK. 2020a. “Disruptive Technologies in Mobile Imaging: Taking Smartphone Cameras to the Next Level.” Accessed January 4. https://www.dxomark.com/disruptive-technologies-mobile-imaging-taking-smartphone-cameras-next-level /.
- DXOMARK. 2020b. “Smartphone Reviews.” Accessed January 4. https://www.dxomark.com/category/smartphone-reviews/.
- Elwood, Sarah, Michael F. Goodchild, and Daniel Z. Sui. 2012. “Researching Volunteered Geographic Information: Spatial Data, Geographic Research, and New Social Practice.” Annals of the Association of American Geographers 102 (3): 571–590. doi: 10.1080/00045608.2011.595657
- Flightradar24. 2020. “Flightradar24: Live Flight Tracker - Real-Time Flight Tracker Map.” Accessed January 4. https://www.flightradar24.com/.
- Goodchild, Michael F., and J. Alan Glennon. 2010. “Crowdsourcing Geographic Information for Disaster Response: A Research Frontier.” International Journal of Digital Earth 3 (3): 231–241. doi: 10.1080/17538941003759255
- Goodchild, Michael F., and Linna Li. 2012. “Assuring the Quality of Volunteered Geographic Information.” Spatial Statistics 1: 110–120. doi: 10.1016/j.spasta.2012.03.002
- Haklay, Muki. 2013. “Citizen Science and Volunteered Geographic Information: Overview and Typology of Participation.” In Crowdsourcing Geographic Knowledge, edited by Daniel Sui, Sarah Elwood, and Michael Goodchild, 105–122. Dordrecht: Springer.
- He, Kaiming, Jian Sun, and Xiaoou Tang. 2011. “Single Image Haze Removal Using Dark Channel Prior.” IEEE Transactions on Pattern Analysis and Machine Intelligence 33 (12): 2341–2353. doi: 10.1109/TPAMI.2010.168
- Heipke, Christian. 2010. “Crowdsourcing Geospatial Data.” ISPRS Journal of Photogrammetry and Remote Sensing 65 (6): 550–557. doi: 10.1016/j.isprsjprs.2010.06.005
- Hirano, Akira, Roy Welch, and Harold Lang. 2003. “Mapping from ASTER Stereo Image Data: DEM Validation and Accuracy Assessment.” ISPRS Journal of Photogrammetry and Remote Sensing 57 (5–6): 356–370. doi: 10.1016/S0924-2716(02)00164-8
- Hoehle, Joachim. 2008. “Photogrammetric Measurements in Oblique Aerial Images.” Photogrammetrie Fernerkundung Geoinformation 1: 7–14.
- Hu, Zhongwen, Qingquan Li, Qin Zou, Qian Zhang, and Guofeng Wu. 2016. “A Bilevel Scale-Sets Model for Hierarchical Representation of Large Remote Sensing Images.” IEEE Transactions on Geoscience and Remote Sensing 54 (12): 7366–7377. doi: 10.1109/TGRS.2016.2600636
- Hultquist, Carolynne, and Guido Cervone. 2020. “Integration of Crowdsourced Images, USGS Networks, Remote Sensing, and a Model to Assess Flood Depth During Hurricane Florence.” Remote Sensing 12 (5): 834. doi: 10.3390/rs12050834
- Karimipour, Farid, and Omid Azari. 2015. “Citizens as Expert Sensors: One Step Up on the VGI Ladder.” In Progress in Location-Based Services 2014, edited by Georg Gartner and Haosheng Huang, 213–222. Cham: Springer.
- LANDINFO. 2020. “Buying Satellite Imagery: Pricing Information for High Resolution Satellite Imagery.” Accessed January 4. http://www.landinfo.com/satellite-imagery-pricing.html.
- Lowe, David G. 2004. “Distinctive Image Features from Scale-Invariant Keypoints.” International Journal of Computer Vision 60 (2): 91–110. doi: 10.1023/B:VISI.0000029664.99615.94
- McDougall, K., and P. Temple-Watts. 2012. “The Use of Lidar and Volunteered Geographic Information to Map Flood Extents and Inundation.” ISPRS Annals of Photogrammetry, Remote Sensing and Spatial Information Sciences I-4: 251–256. doi: 10.5194/isprsannals-I-4-251-2012
- Menzel, J. Robert, Sven Middelberg, Philip Trettner, Bastian Jonas, Leif Kobbelt, V. Tourre, and F. Biljecki. 2016. “City Reconstruction and Visualization from Public Data Sources.”
- NASA. 2020a. “EOSDIS Worldview.” Accessed January 4. https://worldview.earthdata.nasa.gov /.
- NASA. 2020b. “Landsat 8.” Accessed January 4. https://landsat.gsfc.nasa.gov/landsat-data-continuity-mission /.
- Oddo, Perry C., and John D. Bolten. 2019. “The Value of Near Real-Time Earth Observations for Improved Flood Disaster Response.” Frontiers in Environmental Science 7: 127. doi: 10.3389/fenvs.2019.00127
- Qi, Lin, Jie Li, Ying Wang, and Xinbo Gao. 2019. “Urban Observation: Integration of Remote Sensing and Social Media Data.” IEEE Journal of Selected Topics in Applied Earth Observations Remote Sensing 12 (11): 4252–4264. doi:10.1109/JSTARS.2019.2908515.
- Rahman, Md Shahinoor, and Liping Di. 2017. “The State of the Art of Spaceborne Remote Sensing in Flood Management.” Natural Hazards 85 (2): 1223–1248. doi: 10.1007/s11069-016-2601-9
- Schowengerdt, Robert A. 2007. Remote Sensing, Models, and Methods for Image Processing. Burlington: Academic Press.
- Senaratne, Hansi, Amin Mobasheri, Ahmed Loai Ali, Cristina Capineri, and M. Haklay. 2017. “A Review of Volunteered Geographic Information Quality Assessment Methods.” International Journal of Geographical Information Science 31 (1): 139–167. doi: 10.1080/13658816.2016.1189556
- Shao, Zhenfeng, Juan Deng, Lei Wang, Yewen Fan, Neema S. Sumari, and Qimin Cheng. 2017. “Fuzzy Autoencode Based Cloud Detection for Remote Sensing Imagery.” Remote Sensing 9 (4): 311. doi: 10.3390/rs9040311
- Shao, Zhenfeng, Yin Pan, Chunyuan Diao, and Jiajun Cai. 2019. “Cloud Detection in Remote Sensing Images Based on Multiscale Features-Convolutional Neural Network.” IEEE Transactions on Geoscience and Remote Sensing 57 (6): 4062–4076. doi: 10.1109/TGRS.2018.2889677
- Silva, Brenner, Lukas Lehnert, Kristin Roos, Andreas Fries, Rutger Rollenbeck, Erwin Beck, and Jorg Bendix. 2014. “Mapping Two Competing Grassland Species from a Low-Altitude Helium Balloon.” IEEE Journal of Selected Topics in Applied Earth Observations and Remote Sensing 7 (7): 3038–3049. doi: 10.1109/JSTARS.2014.2321896
- Snavely, Noah, Steven M. Seitz, and Richard Szeliski. 2008. “Modeling the World from Internet Photo Collections.” International Journal of Computer Vision 80 (2): 189–210. doi: 10.1007/s11263-007-0107-3
- Statista. 2020. “Number of Smartphone Users Worldwide from 2016 to 2021.” Accessed January 4. https://www.statista.com/statistics/330695/number-of-smartphone-users-worldwide/.
- Strauss, Mark. 2017. “Planet Earth to Get a Daily Selfie.” Science 355 (6327): 782–783. doi: 10.1126/science.355.6327.782
- Sui, Daniel, Sarah Elwood, and Michael Goodchild. 2012. Crowdsourcing Geographic Knowledge: Volunteered Geographic Information (VGI) in Theory and Practice. Dordrecht: Springer Science & Business Media.
- Toth, Charles, and Grzegorz Jóźków. 2016. “Remote Sensing Platforms and Sensors: A Survey.” ISPRS Journal of Photogrammetry and Remote Sensing 115: 22–36. doi: 10.1016/j.isprsjprs.2015.10.004
- Triggs, Bill, Philip F. McLauchlan, Richard I. Hartley, and Andrew W. Fitzgibbon. 1999. “Bundle Adjustment—A Modern Synthesis.” Paper presented at the International workshop on Vision Algorithms.
- van Blyenburgh, P. 2013. “RPAS Yearbook: Remotely Piloted Aircraft Systems – The Global Perspective – Yearbook 2013/2014.” In Technical Report, 133–134. Paris, France: UVS International.
- Verykokou, Styliani, and Charalabos Ioannidis. 2018. “Oblique Aerial Images: A Review Focusing on Georeferencing Procedures.” International Journal of Remote Sensing 39 (11): 3452–3496. doi:10.1080/01431161.2018.1444294.
- Voigt, Stefan, Fabio Giulio-Tonolo, Josh Lyons, Jan Kučera, Brenda Jones, Tobias Schneiderhan, Gabriel Platzeck, et al. 2016. “Global Trends in Satellite-Based Emergency Mapping.” Science 353 (6296): 247–252. doi: 10.1126/science.aad8728
- Wahbeh, W., S. Nebiker, and G. Fangi. 2016. “Combining Public Domain and Professional Panoramic Imagery for the Accurate and Dense 3D Reconstruction of the Destroyed Bel Temple in Palmyra.” ISPRS Annals of Photogrammetry, Remote Sensing & Spatial Information Sciences 3 (5): 81–88. doi: 10.5194/isprsannals-III-5-81-2016
- Wang, Chisheng, Qiqi Shu, Xinyu Wang, Bo Guo, Peng Liu, and Qingquan Li. 2019. “A Random Forest Classifier Based on Pixel Comparison Features for Urban LiDAR Data.” ISPRS Journal of Photogrammetry and Remote Sensing 148: 75–86. doi: 10.1016/j.isprsjprs.2018.12.009
- Westoby, M. J., J. Brasington, N. F. Glasser, M. J. Hambrey, and J. M. Reynolds. 2012. “‘Structure-from-Motion’ Photogrammetry: A Low-Cost, Effective Tool for Geoscience Applications.” Geomorphology 179: 300–314. doi:10.1016/j.geomorph.2012.08.021.
- Whitehead, Ken, and Chris H. Hugenholtz. 2014. “Remote Sensing of the Environment with Small Unmanned Aircraft Systems (UASs), Part 1: A Review of Progress and Challenges.” Journal of Unmanned Vehicle Systems 2 (3): 69–85. doi: 10.1139/juvs-2014-0006
- Wróżyński, Rafał, Krzysztof Pyszny, Mariusz Sojka, Czesław Przybyła, and Sadżide Murat-Błażejewska. 2017. “Ground Volume Assessment Using’Structure from Motion’ Photogrammetry with a Smartphone and a Compact Camera.” Open Geosciences 9 (1): 281–294. doi: 10.1515/geo-2017-0023
- Xie, Yanhua, and Qihao Weng. 2017. “Spatiotemporally Enhancing Time-Series DMSP/OLS Nighttime Light Imagery for Assessing Large-Scale Urban Dynamics.” ISPRS Journal of Photogrammetry and Remote Sensing 128: 1–15. doi: 10.1016/j.isprsjprs.2017.03.003
- Xie, Caodong, Zhiehao Zhang, and Jie Shan. 2015. “Technical Evaluation for Mashing Up Crowdsourcing Images.” Paper presented at the 2015 23rd International Conference on Geoinformatics, June 19–21.