
 ?Mathematical formulae have been encoded as MathML and are displayed in this HTML version using MathJax in order to improve their display. Uncheck the box to turn MathJax off. This feature requires Javascript. Click on a formula to zoom.
ABSTRACT
Soil moisture (SM) plays a crucial role in the dynamics of coupled atmosphere, water, energy, and carbon cycles. In this study, the spatiotemporal distribution and variations of SM in the Mongolian Plateau were investigated for the period of 1982–2018 based on four gridded SM datasets. Taking the observed SM from 33 monitoring stations as a reference, the reliability of these four gridded products was validated, and the three-cornered hat (TCH) method was also applied to evaluate their uncertainties. Major results indicated that all these four products underestimated the SM in this region at different levels. The ERA-Interim SM performed much better than other three products, with a higher R of 0.53 and lower ubRMSE of 0.0378 m3·m−3. Except for ECV, the surface SM exhibited a decreasing trend at −0.0004 to −0.0008 m3·m−3/decade in the warm season (from April to October) over the past 37 years. The greatest decreases in SM occurred in the summer season. Precipitation change plays a more important role in explaining the variations of SM than temperature reported by partial correlation analysis. The results of this study will benefit our understanding of the climate change effects and the protection of the ecological systems in this region.
1. Introduction
Global warming is expected to accelerate regional water cycles and to alter the spatiotemporal distribution of water resources (Chen et al. Citation2016; Luo et al. Citation2019). As a key factor in the hydrological cycle, soil moisture (SM) is recognized as the bridge for hydrothermal exchanges between the land-surface and the atmosphere (Colliander et al. Citation2017; Ma et al. Citation2017; Orsolini et al. Citation2019; Peng et al. Citation2017). SM governs not only the partition of precipitation between runoff, infiltration, and percolation but also the partition of net radiation between latent heat for evaporation and sensible heat to heat air (Dorigo et al. Citation2017; Rahmani, Golian, and Brocca Citation2016; Wang et al. Citation2018). Moreover, SM also has effects on plants such as on the distribution of vegetation and growth status (Ahmad, Kalra, and Stephen Citation2010; Rahmani, Golian, and Brocca Citation2016). Therefore, accurate information on the spatiotemporal distribution and variations of SM is extremely important for understanding the land-atmosphere interactions and the effects of climatic change (An et al. Citation2016; Qiu et al. Citation2016).
Long term observed datasets are necessary to investigate the distribution and dynamics of SM in a region. Nonetheless, the density of ground-based stations is still sparse, especially in arid and semi-arid regions (Alyaari et al. Citation2014; Wang et al. Citation2018), which limits SM measurements at appropriate spatial and temporal scales (Chen et al. Citation2017; Rahmani, Golian, and Brocca Citation2016). Fortunately, the full coverage gridded SM datasets provide a new opportunity to remedy this limitation. The reanalysis and model assimilation data include Global Land Data Assimilation System (GLDAS) data, Modern Era Retrospective-analysis for Research and Applications-Land (MERRA-Land) (Yi et al. Citation2011), and ECMWF ERA-Interim data, among others. The common satellite-based SM products include those derived from the Advanced Microwave Scanning Radiometer-Earth Observing System (AMSR-E) and the European Space Agency’s Climate Change Initiative (ESA CCI) SM. However, compared with reanalysis and assimilation data, the remotely sensed data only include the top SM information (often less than 5 cm) (Collow et al. Citation2012; Peng et al. Citation2017; Wagner et al. Citation2007). Moreover, the reliability and accuracy of these products must be evaluated before use (Zeng et al. Citation2015).
Some scholars have increasingly tried to assess the accuracy of the gridded SM products and to apply them in related research at regional or global scales (Loew et al. Citation2013; Qiu et al. Citation2016; Rahmani, Golian, and Brocca Citation2016). Dorigo et al. (Citation2015) evaluated the remotely sensed ESA CCI SM data by using 596 in situ SM observations globally, and the average correlation between them was 0.36. Based on in situ observations, the performance of seven remotely sensed and reanalysis ERA-Interim products in the Tibetan Plateau (China) was evaluated by Zeng et al. (Citation2015). The results of that study indicated that all these products generated the dynamics of SM well except for the NASA product derived from AMSR-E, which underestimated SM in the Tibetan Plateau during the study period (2002–2012). Qiu et al. (Citation2016) analysed the dynamics of SM from 1996 to 2010 in China using the combination of remotely sensed data, reanalysis products, and in situ observations. In recent years, the SM products from different sources were also widely applied in drought monitoring under ongoing climate change (Mishra, Shah, and Thrasher Citation2014; Sridhar et al. Citation2008; Wang et al. Citation2016).
Located in the highland of the Eurasian continent, the Mongolian Plateau is a typical inland arid and semi-arid region (Zhang et al. Citation2009) and is the second largest plateau in Asia. Previous studies have documented that the Mongolian Plateau has experienced several climate changes, with precipitation decreasing and temperatures obviously rising in the past decades, which has resulted in the shrinking of lakes and ecological environment deterioration (Tao et al. Citation2015a). Climate change is projected to reduce SM by increasing evaporation in some locations of the world (Samaniego et al. Citation2018; Zhang et al. Citation2009). However, very few studies have documented the distribution of SM and how it changes in the Mongolian Plateau. Since the Mongolian Plateau has one of the largest grasslands of the world (Miao et al. Citation2017), the variations in SM play an important role in plant growth and phenology, which can further affect agriculture and animal husbandry. Consequently, it is very valuable to investigate the distribution and variations of SM in this region to better understand the climate change effects and to ensure the sustainable development of ecosystems.
With this background in mind, this study aims to explore the distribution and dynamics of SM in the Mongolian Plateau. Four gridded SM products, including the European Center for Medium-Range Weather Forecasts Interim Re-Analysis (ERA-Interim), Essential Climate Variable (ECV) product derived from European Space Agency’s Climate Change Initiative (ESA CCI), the Famine Early Warning Systems Network (FEWS NET) Land Data Assimilation System (FLDAS), and Global Land Data Assimilation System (GLDAS), were selected in this study, and the accuracy and reliability of them were evaluated by using the TCH method and the comparison with in situ measurements. After evaluation, these four gridded products were implemented to examine the distribution and variations of SM in the Mongolian Plateau from 1982 to 2018.
2. Study area and data
2.1. Study area
The Mongolian Plateau, located in the hinterland of the Eurasian continent, is mainly composed of Mongolia and the Chinese Inner Mongolia Autonomous Region (hereafter Inner Mongolia). The Mongolian Plateau is confined within longitudes 8743
–126
04
E and latitudes 37
22
–53
23
N and has a total area of approximately 2.75 million km2 (Li et al. Citation2018; Tao et al. Citation2015b). The elevation of the Mongolian Plateau ranges from 92 m to 3971 m above sea level (a.s.l.), and the topography is high in the west but low in the east (a).
Figure 1. Topographical and land cover maps of the Mongolian Plateau.
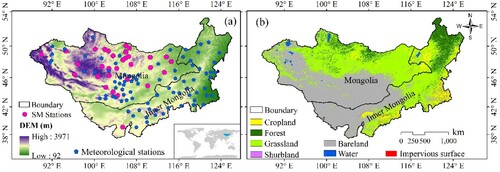
A typical continental climate prevails on the Mongolian Plateau, with cold winters and hot summers (Zhao et al. Citation2015). The annual average temperature ranges from −26 °C to 17 °C across the entire region. The perennial average precipitation in most of the Mongolian Plateau is less than 200 mm but may be higher than 400 mm in the mountainous regions due to the influences of elevation gradients (John et al. Citation2016). The hydrothermal conditions determine the distributions of vegetation, and the Mongolian Plateau has three major biomes: grassland, forest, and desert (John et al. Citation2016). The forests and deserts are chiefly located in the eastern and north-western mountains and the western Gobi regions, respectively (Zhang et al. Citation2009). The rich steppe vegetation, which mainly consist of typical, meadow, and desert steppe vegetation, accounts for almost half of the entire region, which creates a unique nomadic livelihood for the Mongolian people (Tao et al. Citation2015b).
2.2. Data
The in-situ SM data from 33 monitoring stations is used in the present study to verify the accuracy of the remotely sensed and reanalysis assimilation SM datasets. Among them, 32 stations are located in Mongolia and only one station is in Chinese Inner Mongolia. The spatial distribution of the monitoring stations is presented in a. The in situ SM data were downloaded from the International Soil Moisture Network (ISMN, https://ismn.geo.tuwien.ac.at/en/data-access/); the ISMN data have been widely used to improve the accuracy of satellite products as well as validate/calibrate land surface models (An et al. Citation2016; Dorigo et al. Citation2011; Dorigo et al. Citation2015). The SM data were measured every ten days (three observations in a month) and span from 1950 to the present (Albergel et al. Citation2012). The data have an observation every 10 cm from 0 to 1 m, and only the top layer (0–10 cm) was used in this study. Detailed information about the observations is given in SI Appendix Table S1.
Three gridded SM products, including ERA-Interim, GLDAS, FLDAS, and the remotely sensed ECV SM, were collected in this study to explore the spatiotemporal distribution and variations of SM in the Mongolian Plateau. The ERA-Interim data have a 0.25°–6 h resolution and have been available since 1979 (http://apps.ecmwf.int/datasets/). The data have four layers, and the SM in the surface layer (0–7 cm) was evaluated in the current study (Zhang et al. Citation2018). Noah SM data from GLDAS (hereafter GLDAS), with a 0.25° spatial and 6 h temporal resolution (Zhang et al. Citation2018), are available from the website of the Goddard Earth Sciences Data and Information Services Center (http://disc.sci.gsfc.nasa.gov/hydrology/data-holdings). The volumetric soil moisture was generated by using the original Noah GLDAS data divided by the soil depth (mm) to keep it consistent with other data sources in the unit. The first layer (0–10 cm) of Noah GLDAS SM data was extracted in this study. The FLDAS SM product, with a 0.1°–1 month resolution, contains estimates from 1982 to the present (https://disc.gsfc.nasa.gov/datasets/). It has four layers of SM data (0–10 cm, 10–40 cm, 40–100 cm, 100–200 cm), and the data from the top layer were evaluated. The ECV SM product was developed by the European Space Agency's (ESA) Climate Change Initiative (CCI) project (http://www.esa-soilmoisture-cci.org/). The latest version (v04.5) of the ESA CCI combined active and passive microwave product was obtained, with a spatial resolution of 0.25° and a temporal resolution of one day. The surface SM (0–2 cm) was provided by the ESA CCI remotely sensed product (Rahmani, Golian, and Brocca Citation2016). Both sub-daily and sub-monthly SM data were averaged to generate the monthly SM data. To avoid the influences of snow cover and frozen soil, only the warm periods (from April to October) of each year during the study period (1982–2018) were of concern (Wang et al. Citation2018).
Other auxiliary data mainly included the land cover data and climatic data. The main land cover types in the Mongolian Plateau, including bare land (BL), cropland (CP), forest (FR), grassland (GL), and shrubland (SB), were derived from the ESA GlobCover dataset (http://due.esrin.esa.int/page_globcover.php). The spatial distribution of different land cover types is presented in b. The gridded records of precipitation and temperature from the latest version (4.03) of the Climate Research Unit (CRU) dataset in this study were collected from 1982 to 2018. The CRU product is a single spatially interpolated dataset and has a 0.5°/1-month resolution. It has been proved to have a satisfactory performance in arid region (Hu et al. Citation2014). They were used to calculate correlation with surface SM. The climatic data during the period of 1982–2018 at 81 meteorological stations were also obtained to assess the performances of CRU product in the Mongolian Plateau (a).
3. Methodology
3.1. Data pre-processing and precision checking
There are 33 SM monitoring stations on the Mongolian Plateau. However, the datasets in most of these stations either had too many missing values or incomplete coverage during the study period. Therefore, for each station the time series in the study period without missing values was selected in the current study to check the accuracy of the four gridded products. The nearest neighbour method was introduced to extract the gridded values of these four datasets. Each of the grids in the study region was treated as a station and the SM data for the grid were compared with the observed SM from the homologous monitoring station. The precisions of the gridded products were partly investigated via these processes. Four metrics, the correlation coefficient (R), the mean bias (Bias), the root mean square error (RMSE), and the unbiased RMSE (ubRMSE) were applied to evaluate the accuracies of these four SM products. The descriptions of the four indices are as follows:
(1)
(1)
(2)
(2)
(3)
(3)
(4)
(4)
where and
are the values of gridded and measured SM data, respectively.
and
are the corresponding average values for gridded and observed data, respectively, and n is the length of the time series. R is a measure of the correlation between
and
. Generally, the closer R is to 1, the better the accuracy of the
.
measures how much the gridded SM products on average overestimate (Bias > 0) or underestimate (Bias < 0) in situ measurements. RMSE often used to assess the random error, which is inherently dependent on bias (Zheng et al. Citation2018). Therefore, ubRMSE, given by EquationEquation (4
(4)
(4) ), is also selected to report the accuracy of each SM product.
3.2. Three-cornered hat (TCH) method
Although the accuracies of the gridded datasets were evaluated by contrast with observations, great data gaps still exist due to the lack of data sharing over some regions. The uncertainty is one of the important elements for assessing data quality. The TCH method can quantify the uncertainty by the absolute values of standard deviation. Therefore, the TCH method, often used to evaluate the relative uncertainties of datasets from different sources, was applied as a supplement to further assess the qualities of the products used in this study. Based on the assumption that the errors from different datasets are normally distributed and independent from each other (Long, Longuevergne, and Scanlon Citation2014), the process of the TCH method is described as follows:
For each time series of available products, values are expected to be expressed as:
(5)
(5)
where s is the true value and is a white noise with zero-mean (Awange et al. Citation2016). Since the true value of s is not available, one of the time series is chosen as the reference and denoted as xR. The calculated results are irrelevant to the choice of the reference and the differences between xi and xR can be written as:
(6)
(6)
Therefore, the variance of the differences is as follows:
(7)
(7) Since the differences of each two products are independent,
(
) is equal to zero. For N products, N-1 differences calculated by Equationequation (8
(8)
(8) ) can be obtained and stored in an
matrix as:
(8)
(8)
where M is the time step of each product. The covariance matrix of the differences is given by:
(9)
(9)
S is an
covariance matrix, and S(i, j) is the variance of
when i equals j, Otherwise, S(i, j) is the covariance between
and
. The
unknown covariance matrix of the individual noises R0 is related to S by:
(10)
(10) where
(11)
(11)
R0 is also called the Allan covariance matrix. However, R0 is not uniquely determined because there are unknown elements in R0, whereas only
equations of solution are given. The remaining N ‘free elements’ should be estimated to reasonably determine the unique solution of R0. A restriction condition on the solution of the N ‘free elements’ is that the matrix R0 is always positive definite (Galindo and Palacio Citation2003). However, the matrix R0 is still not uniquely defined based on this condition (Koot, De Viron, and Dehant Citation2006). Galindo and Palacio (Citation1999)_ENREF_9 have recommended a function that minimizes the sum of the estimated correlations between all the products based on the Kuhn-Tucker theory. The objective equation is given by:
(12)
(12) After the N ‘free elements’ are estimated by Equationequation (8
(8)
(8) ), the remaining unknown elements of R0 can be expressed as:
(13)
(13)
3.3. Linear regression analysis
In present study, the linear regression analysis method was used to calculate the spatiotemporal variations of SM in the Mongolian Plateau. The spatial fluctuations of SM were analysed by calculating the linear regression coefficients of the time series of each pixel. Generally, the significance of the changes was defined as extremely significant and significant at the 99% confidence level (p<0.01) and the 95% confidence level (p<0.05), respectively. The linear regression coefficient is computed using Equationequation (14(14)
(14) ):
(14)
(14)
where n denotes the length of the study period, and and
represent the values of SM and the corresponding time in the ith month/year of the time series, respectively. Generally, the values of the time series are expected to increase when the value of Slope is greater than 0.
3.4. Partial correlation analysis
Partial correlation analysis is commonly used to analyse the relationship between two variables after eliminating the impacts from other factors (Wang Citation2016). The degree of correlation between variables X and Y without the influences from variable Z can be defined as follows:
(15)
(15) where
is the partial correlation coefficient between X and Y after removing the effects from Z. RXY, RXZ, and RYZ are the correlation coefficients between X and Y, X and Z, and Y and Z, respectively. In our study, the partial correlation analysis approach was applied to calculate the relationship between SM and precipitation as well as temperature.
4. Results
4.1. Evaluation of the gridded SM datasets
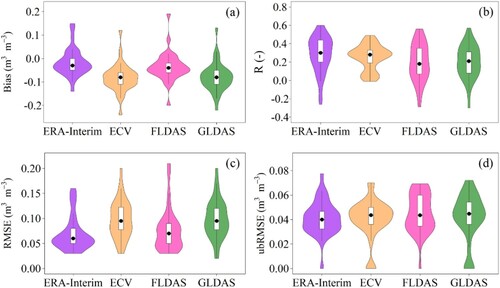
The in situ measurements were used to evaluate the four gridded SM products based on the Bias, R, RMSE, and ubRMSE in the Mongolian Plateau. The higher value of R and the lower absolute values of , RMSE, and ubRMSE, the more reliable the dataset is in comparison to in situ measurements. We collected the observed data from 33 ground-based monitoring stations, and the coverage periods of the observed records are shown in SI Appendix Table S1. For each monitoring station, the values of the four gridded datasets in the same coverage period were extracted. As shown in , all of these four gridded products underestimate the observed SM on a monthly scale with an average Bias of less than zero. In particular, the underestimation can be partly attribute to the shallower depths of ECV and ERA-Interim products as compared with the in situ measurements. The ERA-Interim SM outperformed other three products, along with the smallest Bias (−0.008 m3·m−3), followed by FLDAS, GLDAS, and ECV. The average Bias values are −0.076 m3·m−3, −0.030 m3·m−3, and −0.072 m3·m−3 for ECV, FLDAS, and GLDAS, respectively. The ERA-Interim SM also have better performance in capturing long-term temporal trend, with higher R of 0.53 on average (b), which is also clearly presented in Figure S2. The distribution of RMSE values are similar to those of Bias distribution, with the average values of 0.072, 0.102, 0.0763, and 0.102 m3·m−3 for ERA-Interim, ECV, FLDAS, and GLDAS. In terms of ubRMSE, all these four products have comparable performances, with mean values ranging between 0.0378 and 0.0458 m3·m−3. The results reveals that these four products have similar performances in producing the absolute values of SM (Ma et al. Citation2019).
Figure 2. Frequency distributions of Bias (a), R (b), RMSE (c), and ubRMSE (d) between the four gridded datasets and in-situ soil moisture from 33 meteorological stations.
The comparisons between time series of in situ measurements and these four gridded products during 1982–1993 were also presented in Figure S1. Fortunately, no significant differences in the intra-annual and inter-annual variations in surface soil moisture between in situ measurements and each of these four products. When focus on the detected trends from different stations, the spatial patterns derived from these four gridded products are similar with those from in situ measurements at most of these stations, although there are some differences in the changing rates and associated significant level (Figure S2). The results indicated that these products are able to capture the changing trend in surface soil moisture in the Mongolian Plateau.
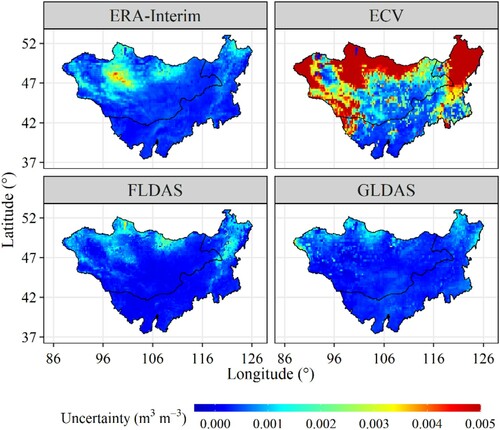
The uncertainties of these four gridded products during 1982–2018 quantified by the TCH method are shown in . In general, uncertainties in SM are largest in the ECV product (0.0035 m3·m−3/month), moderate in ERA-Interim (0.0006 m3·m−3/month) and GLDAS (0.0004 m3·m−3/month), and lowest in the FLDAS product (0.0003 m3·m−3/month). SM in FLDAS also has the highest spatial resolution among all four products. Regarding the spatial distribution of the uncertainty in SM, the northeastern and northwestern Mongolian Plateau has higher uncertainties than other parts for all four gridded products. The results indicate that the gridded SM products show higher uncertainty in the mountainous region (with high SM) than in the plain area (with low SM).
Figure 3. Relative uncertainty of the four gridded products during the period of 1982 − 2018 quantified by the TCH method.
4.2. Spatiotemporal distribution of SM in the Mongolian Plateau
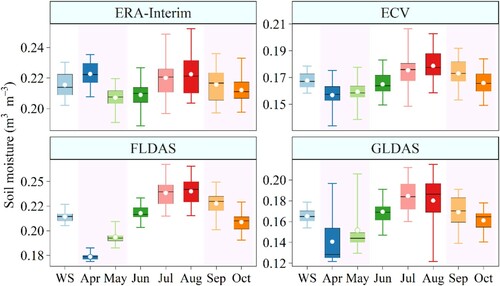
The SM values in the Mongolian Plateau during the period of 1982–2018 quantified by these four gridded products are presented in . The values of SM in warm season (WS) are 0.216, 0.168, 0.214, and 0.165 m3·m−3 for ERA-Interim, ECV, FLDAS, and GLDAS, respectively. The SM values quantified by ERA-Interim and FLDAS are obviously higher than those quantified by ECV and GLDAS products, which is consistent with the evaluated results based on Bias. also exhibits that the SM values of ECV, FLDAS, and GLDAS increase from April to August (July for GLDAS) and decrease from August (July for GLDAS) to October. However, for the distribution of monthly SM in ERA-Interim, a ‘downward-upward-downward’ mode is exhibited. The lowest and highest SM values for ERA-Interim occur in May and August, respectively. Generally, all these four products show that the SM is highest in summer followed by autumn and that it is lowest in spring.
Figure 4. Temporal distribution of soil moisture during the period of 1982 − 2018 based on the four gridded products. (The boxplots display the median, inter-quantile range, upper, and lower quantiles of soil moisture. The white points present the mean values of soil moisture).
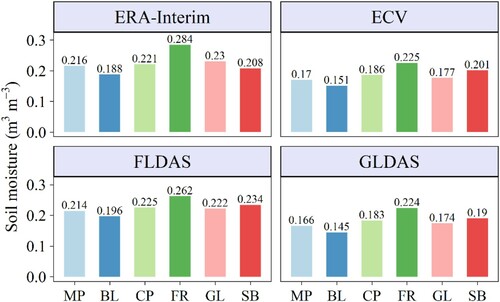
The surface SM varies for different vegetation types over the Mongolian Plateau based on these four gridded products (). As expected, the SM derived from these four gridded products are all highest in forest and lowest in bare land. The SM of forest has a range of 0.224–0.284 m3·m−3 based on the four gridded products, whereas the average SM of bare land is approximately 0.145–0.196 m3·m−3 in the warm season of 1982–2018 over the Mongolian Plateau. For the other three land cover types, the results from ECV, FLDAS, and GLDAS show that the surface SM values from high to low are shrubland, cropland, and grassland. However, SM quantified by ERA-Interim from high to low are grassland, cropland, and shrubland.
Figure 5. Average soil moisture in different land cover regions during the period of 1982 − 2018 based on the four gridded products.
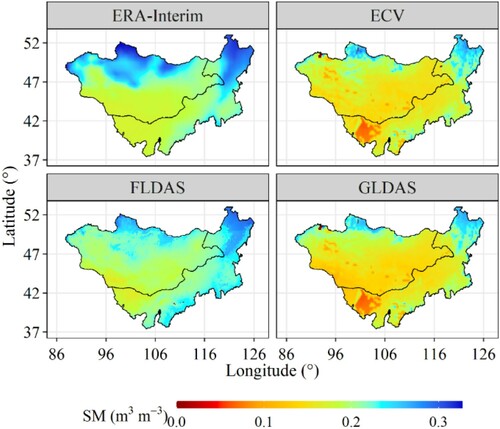
The SM derived from the four gridded datasets in the Mongolian Plateau during 1982−2018 shows different spatial patterns (). In general, relatively high SM contents in the northeastern and northwestern mountainous region of the Mongolian Plateau are observed in the four products. The SM contents are lower in the southwestern Mongolian Plateau, where the main land cover type is bare land, than in the other regions for these four products. ECV and GLDAS exhibit largely similar SM contents over the Mongolian Plateau; however, they are different from the results derived from ERA-Interim and FLDAS. The SM values from ERA-Interim and FLDAS are obviously higher than those from ECV and GLDAS. Since all four gridded datasets underestimate SM contents in this study region at different levels, the results quantified by ERA-Interim and FLDAS may be more reliable than the others. The major differences for ERA-Interim and FLDAS are in southeastern Inner Mongolia, where the FLDAS SM shows higher values than in northwestern Inner Mongolia. also shows slightly higher SM from ERA-Interim than that from FLDAS, especially in the northern parts.
Figure 6. Spatial distribution of the average soil moisture in the Mongolian Plateau during the warm season of 1982 − 2018 based on the four gridded products.
4.3. Dynamic variations of SM in the Mongolian Plateau
The results from the linear trend analysis () in the warm season show a decreasing trend of SM for ERA-Interim, FLDAS, and GLDAS products (significant only for ERA-Interim) in the Mongolian Plateau other the past 37 years. The decreasing rates of SM are −0.006 m3·m−3/decade, −0.0008 m3·m−3/decade, and −0.0004 m3·m−3/decade for ERA-Interim, FLDAS, and GLDAS, respectively. The SM in the Mongolian Plateau at shallower depth presents a change in different trend. A nonsignificant and increasing trend is observed in ECV SM, with an average rate of 0.0011 m3·m−3/decade () It indicates that the sampling depths may lead to the changes in different trends.
Figure 7. Variations of annual soil moisture during the period of 1982 − 2018 based on the four gridded products.
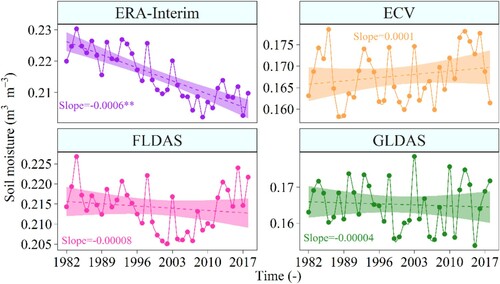
Table 1. Annual and seasonal change rates (m3·m−3/decade) of soil moisture during the period of 1982 − 2018 based on the four gridded products (* indicates p<0.05 and ** indicates p<0.01; the same below).
All these four gridded products show that the Mongolian Plateau has experienced various changes in SM in different seasons in general (). Results from ERA-Interim show that SM in spring has suffered a significant and decreasing trend at a rate of −0.00461 m3·m−3/decade. However, for the other three products, SM in spring has an increasing trend, which is significant for the results derived from FLDAS and GLDAS. Except for SM from ECV, SM always decreased in summer and autumn during 1982−2018 based on the other three products (significantly for ERA-Interim and GLDAS). The results also suggest that the decreased SM mainly occurs in the summer season with relatively strong decreasing rates for other three datasets. The ECV results exhibit an increasing but nonsignificant trend in summer and autumn. The increasing rates of the ECV results are 0.00165 and 0.00004 m3·m−3/decade in summer and autumn, respectively.
To determine the proportions of different change trends accounting for the Mongolian Plateau, the statistical results of the overall trend analysis and their spatial pattern are shown in and , respectively. An overwhelming decreasing trend for the period 1982−2018 is observed in the northern and eastern Mongolian Plateau based on ERA-Interim, with significant decreasing and nonsignificant decreasing trends accounting for 62.58% and 24.61% of the total area, respectively. This pattern is different from the changes derived from GLDAS. The major differences are in the north-eastern part, where the SM derived from GLDAS presented an increasing trend in this area and the GLDAS SM exhibited significant increasing and nonsignificant increasing trends accounting for 23.78% and 42.18% of the entire region, respectively (). Results from analysis of ECV and FLDAS SM are similar, with 49.36%−63.07% of the Mongolian Plateau has experienced drier soil conditions during 1982−2018.
Figure 8. Percentage of study area showing different changing trends in soil moisture during the period of 1982 − 2018.
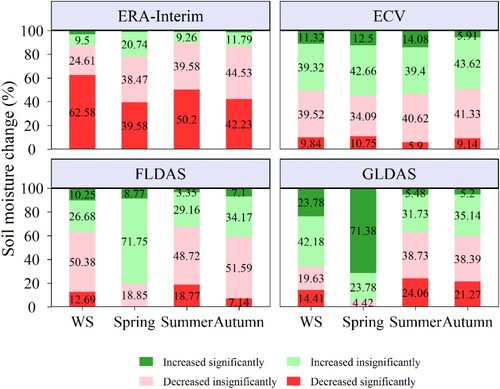
Figure 9. Spatiotemporal variations of soil moisture during the period of 1982 − 2018 based on the four gridded products.
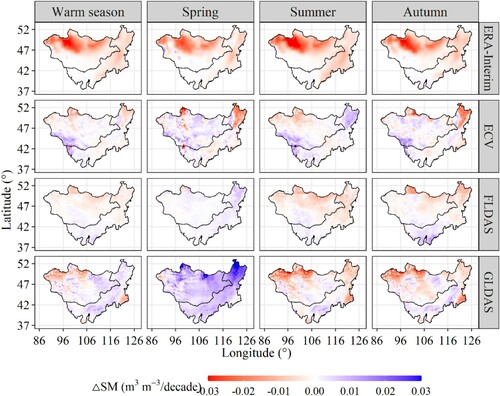
The changes in seasonal SM from different products show different spatial patterns, with relatively larger areas exhibiting increasing trends in spring more than in summer and autumn. Except for ERA-Interim, SM values from ECV, FLDAS, and GLDAS in spring mainly exhibit an increasing trend, and the areas with a decreasing trend are mainly observed in ECV SM in the northeastern Mongolian Plateau from 1982 to 2018. The ERA-Interim SM exhibits an overwhelming decreasing trend in all three seasons, and the areas showing decreasing trends have a range of 78.05 − 89.78% of the Mongolian Plateau. SM values from ECV, FLDAS, and GLDAS mainly follow a decreasing trend in summer and autumn as well, especially SM from FLDAS and GLDAS, with the areas showing a decreasing trend accounting for 58.78 − 67.49% of the entire region. The areas exhibiting decreasing trends mainly spread over the northern and eastern parts, with the exception of summer SM from ECV in the north-eastern Mongolian Plateau.
4.4. Dynamic variations of SM for different land types in the Mongolian Plateau
From 1982 to 2018, the changes in SM varied for different land cover types in the Mongolian Plateau, and the SM contents for forest, grassland, and cropland mainly had a decreasing trend (with the exception of grassland from ECV) based on ERA-Interim, ECV, and FLDAS (, ). The regions with a decreasing trend account for 77.77 − 99.85%, 51.59 − 97.31%, and 69.58 − 94.41% of the forest, grassland, and cropland, respectively, based on ERA-Interim, ECV, and FLDAS. For shrubland and bare land, the SM contents derived from ERA-Interim also show an overwhelming decreasing trend, with decreasing rates of −0.0041 m3·m−3/decade and −0.0024 m3·m−3/decade, respectively. However, the SM contents of shrubland and bare land show an increasing trend based on ECV and FLDAS, whereas a significantly increasing trend only exists in SM of bare land from ECV (0.0014 m3·m−3/decade). Decreased SM is identified only in a few regions (15.38 − 36.47%) for these land cover types, whereas most of the regions exhibit an increasing trend, with the portion of 63.53 − 84.82% for all these land cover types based on GLDAS. A slight decreasing (but nonsignificant) trend was only found for GLDAS SM in forest as shown in , with a rate of −0.0002 m3·m−3/decade.
Figure 10. Percentage of different land covers showing different changing trends in soil moisture during the period of 1982 − 2018.
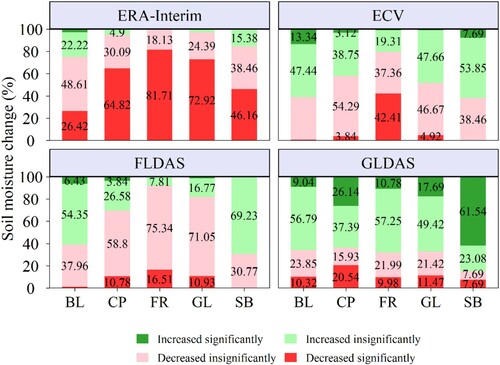
Table 2. Changing rates (m3·m−3/decade) of soil moisture in different land covers during the period of 1982 − 2018.
5. Discussion
The results of our study show that all four gridded products underestimated the surface SM in the Mongolian Plateau, especially the remotely sensed ECV product. The same situation has also been suggested by previous studies for other regions (Bi et al. Citation2016; Chen et al. Citation2013). For example, the results from Zhang et al. (Citation2018) showed that both remotely sensed and reanalysis datasets, namely, ECV, ERA-Interim, and MERRA, tended to underestimate surface SM in the Tibetan Plateau during the warm period. Bi et al. (Citation2016) also proved that the GLDAS data underestimated SM during the unfrozen period. Zhang et al. (Citation2018) pointed out that the underestimation of surface SM may be attributed to the unmatched spatial scales, which results in the extreme values of SM being averaged in grids. Additionally, the mismatch in the sampling depths of the surface soil layer may be another cause since the depths of the SM from these four sources and in situ measurements are different. Chen et al. (Citation2013) also indicated that the soil organic carbon varied at different depths, which leads to potential soil stratification. The visible larger uncertainty in remotely sensed ECV may also be mainly ascribed to the limited sensing depth (within 0 − 2 cm) when compared with these three reanalysis assimilation datasets. Moreover, it may also be the reason for the different changing trend during 1982 − 2018 from ECV when compared with the other three reanalysis assimilation datasets. Therefore, to update the in situ monitoring at shallower soil depth is a useful way to better assess the SM derived from remotely sensed products (Zheng et al. Citation2019).
In general, the distribution of SM exhibits strong spatiotemporal heterogeneity in the Mongolian Plateau. The high level of SM is mainly distributed in the northern and north-eastern parts of this region, which is affected by the melting water and high precipitation from the mountainous regions (Bao et al. Citation2014; Tao et al. Citation2015b). The southwestern Mongolian Plateau, which is mainly covered by bare land, has a relatively low SM as a result of low precipitation (Qin et al. Citation2018). When the SM of different land cover types is compared, the SM in vegetated cover areas is obviously higher than that in bare land, as presented in , and the same result was also found in the arid and semi-arid Xinjiang (China) (Wang et al. Citation2018). Archer et al. (Citation2016) pointed out that the vegetation can preserve SM more efficiently. Additionally, the rate of the water infiltration in forest is obviously higher compared with other vegetated areas, such as grassland and shrubland (Neris et al. Citation2012; Wang et al. Citation2018), which explains why the highest level of SM occurs in forest.
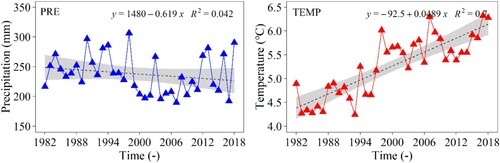
For 1982 − 2018, a weak decreasing trend (−0.0004 − −0.0008 m3·m−3/decade) was observed for SM in the warm season over the Mongolian Plateau based on these gridded products (except for ECV). A recent study suggested that the changing climatic factors, especially the precipitation change, is the main reason for the variations in SM (Wang et al. Citation2019). We further investigated the changes of precipitation and temperature based on the CRU product in the Mongolian Plateau as shown in . We chose the CRU product in this study because it was proved to have satisfactory performances in our study region as shown in Table S2 and Figure S3. In general, SM has the same trend of variations in homochronous precipitation (−6.19 mm/decade), whereas it has the opposite trend in temperature (0.498 °C/decade). The partial correlation coefficient between precipitation and SM ranges from 0.70–0.81 (p<0.01). Negative correlation is observed between temperature and SM (−0.12 − −0.83), whereas it is only significant when calculated by ERA-Interim SM. The results indicate that precipitation contributes more to SM variation compared with temperature in the Mongolian Plateau. The spatial heterogeneity of the correlations and their differences caused by land cover types can also be investigated in possible future studies.
Figure 11. Variations of precipitation (PRE) and temperature (TEMP) in warm seasons during the period of 1982 − 2018 based on the CRU gridded product.
6. Conclusions
In this study, the reliabilities of four gridded products in describing SM were assessed in the period of 1982 − 2018 over the Mongolian Plateau. The spatiotemporal distributions and variations of SM were investigated based on these four gridded products after their validation. Overall, all four products underestimated SM in the Mongolian Plateau, especially the ECV and GLDAS products. The ERA-Interim SM was superior to other three product, with R value of 0.53 and ubRMSE value of 0.0378 m3·m−3. The uncertainty of SM in mountainous regions was higher than in areas of plains, and the uncertainty in ECV SM was obviously greater when compared with the other three products, which may be caused by the mismatch of sampling depths. The average uncertainties according to the TCH method were 0.0006, 0.0035, 0.0003, and 0.0004 m3·m−3/month for ERA-Interim, ECV, FLDAS, and GLDAS, respectively. These four products generally well captured the spatiotemporal distribution of surface SM. In the study region, obvious higher SM was observed in the northern and north-eastern parts of this region, and the highest SM was observed in summer, with moderate values in autumn and the lowest in spring.
In this region, except for the ECV product, SM values in warm seasons had a linear trend decrease of −0.0004 to −0.0008 m3·m−3/decade during 1982 − 2018. Decreases were most prominent in summer at rates ranging −0.00199 − −0.00702 m3·m−3/decade among the three products. The magnitude of SM decrease was found to shrink in spring and autumn, and SM in spring even significantly increased at rates of 0.00113 and 0.01290 m3·m−3/decade for the FLDAS and GLDAS products, respectively. The ECV product only captured the SM at 0 − 2 cm and evidently exhibited a weak increasing trend in all three seasons. There were large spatial differences in the variations in SM. The SM mainly decreased in the northern and north-eastern Mongolian Plateau, whereas it increased in the southwestern parts.
Overall, as the ecological protective screen of Asia, the Mongolian Plateau is very sensitive to climate change. Understanding the spatiotemporal distribution and variations of SM under the changing environment is very important for the protection of ecological systems and the sustainable development of this region. However, the reliabilities of gridded products from different sources still need validation based on in situ measurements before their application. Additionally, there existed gaps in SM depth between remotely sensed products (within 0 − 5 cm), the reanalysis assimilation product (within 0 − 7/10 cm), and in situ measurements (within 0 − 10 cm). Consequently, these differences needed to be considered in the comparison. Reasonable techniques, such as cumulative density function matching and regression correction, should be introduced in future studies to uniquely define the SM depth from different sources. To increase the in situ monitoring at shallower soil depth (eg. 2 cm) is another alternative way to better assess the SM derived from remotely sensed products.
Supplementary_Material
Download MS Word (628.9 KB)Acknowledgements
The current study was supported by the Natural Science Foundation of Inner Mongolia (Grant No. 2020BS04009 and 2020BS03042), Research Start-up Fund Project for Introducing Talents (Grant No. 112/1004031904 and 112/5909001803), the National Natural Science Foundation of China (Grant No. 41861014), and the Open Project of Remote Sensing and Geographic Information System Application Laboratory, State Key Laboratory of Xinjiang Uygur Autonomous Region (Grant No. 112/21K20190016).
Disclosure statement
No potential conflict of interest was reported by the author(s).
Additional information
Funding
References
- Ahmad, S., A. Kalra, and H. Stephen. 2010. “Estimating Soil Moisture Using Remote Sensing Data: A Machine Learning Approach.” Advances in Water Resources 33: 69–80. doi: https://doi.org/10.1016/j.advwatres.2009.10.008
- Albergel, C., P. De Rosnay, C. Gruhier, J. Muñoz-Sabater, S. Hasenauer, L. Isaksen, Y. Kerr, and W. Wagner. 2012. “Evaluation of Remotely Sensed and Modelled Soil Moisture Products Using Global Ground-Based in Situ Observations.” Remote Sensing of Environment 118: 215–226. doi: https://doi.org/10.1016/j.rse.2011.11.017
- Alyaari, A., J. P. Wigneron, A. Ducharne, Y. Kerr, P. D. Rosnay, R. D. Jeu, A. Govind, A. B. Ahmad, C. Albergel, and J. Munozsabater. 2014. “Global-scale Evaluation of two Satellite-Based Passive Microwave Soil Moisture Datasets (SMOS and AMSR-E) with Respect to Land Data Assimilation System Estimates.” Remote Sensing of Environment 149: 181–195. doi: https://doi.org/10.1016/j.rse.2014.04.006
- An, R., L. Zhang, Z. Wang, J. A. Quaye-Ballard, J. You, X. Shen, W. Gao, L. Huang, Y. Zhao, and Z. Ke. 2016. “Validation of the ESA CCI Soil Moisture Product in China.” International Journal of Applied Earth Observation and Geoinformation 48: 28–36. doi: https://doi.org/10.1016/j.jag.2015.09.009
- Archer, N. A., W. Otten, S. Schmidt, A. G. Bengough, N. Shah, and M. Bonell. 2016. “Rainfall Infiltration and Soil Hydrological Characteristics Below Ancient Forest, Planted Forest and Grassland in a Temperate Northern Climate.” Ecohydrology 9: 585–600. doi: https://doi.org/10.1002/eco.1658
- Awange, J., V. Ferreira, E. Forootan, S. Andam-Akorful, N. Agutu, and X. He. 2016. “Uncertainties in Remotely Sensed Precipitation Data Over Africa.” International Journal of Climatology 36: 303–323. doi: https://doi.org/10.1002/joc.4346
- Bao, G., Z. Qin, Y. Bao, Y. Zhou, W. Li, and A. Sanjjav. 2014. “NDVI-based Long-Term Vegetation Dynamics and its Response to Climatic Change in the Mongolian Plateau.” Remote Sensing 6: 8337–8358. doi: https://doi.org/10.3390/rs6098337
- Bi, H., J. Ma, W. Zheng, and J. Zeng. 2016. “Comparison of Soil Moisture in GLDAS Model Simulations and in Situ Observations Over the Tibetan Plateau.” Journal of Geophysical Research: Atmospheres 121: 2658–2678.
- Chen, Y., W. Li, H. Deng, G. Fang, and Z. Li. 2016. “Changes in Central Asia’s Water Tower: Past, Present and Future.” Scientific Reports 6: 35458. doi: https://doi.org/10.1038/srep35458
- Chen, Y., K. Yang, J. Qin, Q. Cui, H. Lu, Z. La, M. Han, W. Tang, and Y. Chen. 2017. “Evaluation of SMAP, SMOS, and AMSR2 Soil Moisture Retrievals Against Observations From two Networks on the Tibetan Plateau.” Journal of Geophysical Research Atmospheres 122: 5780–5792. doi: https://doi.org/10.1002/2016JD026388
- Chen, Y., K. Yang, J. Qin, L. Zhao, W. Tang, and M. Han. 2013. “Evaluation of AMSR-E Retrievals and GLDAS Simulations Against Observations of a Soil Moisture Network on the Central Tibetan Plateau.” Journal of Geophysical Research: Atmospheres 118: 4466–4475.
- Colliander, A., T. J. Jackson, R. Bindlish, S. Chan, N. N. Das, S. Kim, M. H. Cosh, R. S. Dunbar, L. Dang, and L. Pashaian. 2017. “Validation of SMAP Surface Soil Moisture Products with Core Validation Sites.” Remote Sensing of Environment 191: 215–231. doi: https://doi.org/10.1016/j.rse.2017.01.021
- Collow, T. W., R. Alan, J. B. Basara, and B. G. Illston. 2012. “Evaluation of SMOS Retrievals of Soil Moisture Over the Central United States with Currently Available in Situ Observations.” Journal of Geophysical Research Atmospheres 117: 1–15. doi: https://doi.org/10.1029/2011JD017095
- Dorigo, W., A. Gruber, R. De Jeu, W. Wagner, T. Stacke, A. Loew, C. Albergel, L. Brocca, D. Chung, and R. Parinussa. 2015. “Evaluation of the ESA CCI Soil Moisture Product Using Ground-Based Observations.” Remote Sensing of Environment 162: 380–395. doi: https://doi.org/10.1016/j.rse.2014.07.023
- Dorigo, W., W. Wagner, C. Albergel, F. Albrecht, G. Balsamo, L. Brocca, D. Chung, et al. 2017. “ESA CCI Soil Moisture for Improved Earth System Understanding: State-of-the art and Future Directions.” Remote Sensing of Environment 203: 185–215. doi: https://doi.org/10.1016/j.rse.2017.07.001
- Dorigo, W., W. Wagner, R. Hohensinn, S. Hahn, C. Paulik, A. Xaver, A. Gruber, M. Drusch, S. Mecklenburg, and P. V. Oevelen. 2011. “The International Soil Moisture Network: a Data Hosting Facility for Global in Situ Soil Moisture Measurements.” Hydrology and Earth System Sciences 15: 1675–1698. doi: https://doi.org/10.5194/hess-15-1675-2011
- Galindo, F. J., and J. Palacio. 1999. Estimating the Instabilities of N Correlated Clocks. In Proceedings of the 31st Annual Precise Time and Time Interval (PTTI) Meeting, 285–296. Dana Point, CA.
- Galindo, F. J., and J. Palacio. 2003. “Post-processing ROA Data Clocks for Optimal Stability in the Ensemble Timescale.” Metrologia 40: S237. doi: https://doi.org/10.1088/0026-1394/40/3/301
- Hu, Z., C. Zhang, Q. Hu, and H. Tian. 2014. “Temperature Changes in Central Asia From 1979 to 2011 Based on Multiple Datasets.” Journal of Climate 27: 1143–1167. doi: https://doi.org/10.1175/JCLI-D-13-00064.1
- John, R., J. Chen, Y. Kim, Z.-T. Ou-yang, J. Xiao, H. Park, C. Shao, Y. Zhang, A. Amarjargal, and O. Batkhshig. 2016. “Differentiating Anthropogenic Modification and Precipitation-Driven Change on Vegetation Productivity on the Mongolian Plateau.” Landscape Ecology 31: 547–566. doi: https://doi.org/10.1007/s10980-015-0261-x
- Koot, L., O. De Viron, and V. Dehant. 2006. “Atmospheric Angular Momentum Time-Series: Characterization of Their Internal Noise and Creation of a Combined Series.” Journal of Geodesy 79: 663. doi: https://doi.org/10.1007/s00190-005-0019-3
- Li, C., W. Leal Filho, J. Wang, J. Yin, M. Fedoruk, G. Bao, Y. Bao, S. Yin, S. Yu, and R. Hu. 2018. “An Assessment of the Impacts of Climate Extremes on the Vegetation in Mongolian Plateau: Using a Scenarios-Based Analysis to Support Regional Adaptation and Mitigation Options.” Ecological Indicators 95: 805–814. doi: https://doi.org/10.1016/j.ecolind.2018.08.031
- Loew, A., T. Stacke, W. Dorigo, R. de Jeu, and S. Hagemann. 2013. “Solid Earth Open Access The Cryosphere Open Access The Potential and Limitations of Multidecadal Satellite Soil Moisture Observations Climate Model Evaluation Studies.” Hydrology and Earth System Sciences Discussions 17: 3523–3542. doi: https://doi.org/10.5194/hess-17-3523-2013
- Long, D., L. Longuevergne, and B. R. Scanlon. 2014. “Uncertainty in Evapotranspiration From Land Surface Modeling, Remote Sensing, and GRACE Satellites.” Water Resources Research 50: 1131–1151. doi: https://doi.org/10.1002/2013WR014581
- Luo, M., T. Liu, F. Meng, Y. Duan, A. Bao, W. Xing, X. Feng, A. Frankl, and P. De Maeyer. 2019. “Identifying Climate Change Impacts on Water Resources in Typical River Basins in Xinjiang, China.” Science of the Total Environment 676: 613–626. doi: https://doi.org/10.1016/j.scitotenv.2019.04.297
- Ma, C., X. Li, L. Wei, and W. Wang. 2017. “Multi-Scale Validation of SMAP Soil Moisture Products Over Cold and Arid Regions in Northwestern China Using Distributed Ground Observation Data.” Remote Sensing 9: 327. doi: https://doi.org/10.3390/rs9040327
- Ma, H., J. Zeng, N. Chen, X. Zhang, and W. Wang. 2019. “Satellite Surface Soil Moisture From SMAP, SMOS, AMSR2 and ESA CCI: A Comprehensive Assessment Using Global Ground-Based Observations.” Remote Sensing of Environment 231: 111215. doi: https://doi.org/10.1016/j.rse.2019.111215
- Miao, L., M. Daniel, C. Xuefeng, M. Meihong, and D. Sylvain. 2017. “Changes in Vegetation Phenology on the Mongolian Plateau and Their Climatic Determinants.” Plos One 12: e0190313. -. doi: https://doi.org/10.1371/journal.pone.0190313
- Mishra, V., R. Shah, and B. Thrasher. 2014. “Soil Moisture Droughts Under the Retrospective and Projected Climate in India*.” Journal of Hydrometeorology 15: 2267–2292. doi: https://doi.org/10.1175/JHM-D-13-0177.1
- Neris, J., C. Jiménez, J. Fuentes, G. Morillas, and M. Tejedor. 2012. “Vegetation and Land-use Effects on Soil Properties and Water Infiltration of Andisols in Tenerife (Canary Islands, Spain).” Catena 98: 55–62. doi: https://doi.org/10.1016/j.catena.2012.06.006
- Orsolini, Y., M. Wegmann, E. Dutra, B. Liu, G. Balsamo, K. Yang, P. de Rosnay, et al. 2019. “Evaluation of Snow Depth and Snow Cover Over the Tibetan Plateau in Global Reanalyses Using in Situ and Satellite Remote Sensing Observations.” The Cryosphere 13: 2221–2239. doi: https://doi.org/10.5194/tc-13-2221-2019
- Peng, J., A. Loew, O. Merlin, and N. E. C. Verhoest. 2017. “A Review of Spatial Downscaling of Satellite Remotely Sensed Soil Moisture.” Reviews of Geophysics 55: 341–366. doi: https://doi.org/10.1002/2016RG000543
- Qin, F.-Y., G.-S. Jia, J. Yang, Y.-T. Na, and M.-T. Hou. 2018. “Spatiotemporal Variability of Precipitation During 1961–2014 Across the Mongolian Plateau.” Journal of Mountain Science 15: 992–1005. doi: https://doi.org/10.1007/s11629-018-4837-1
- Qiu, J., Q. Gao, S. Wang, and Z. Su. 2016. “Comparison of Temporal Trends From Multiple Soil Moisture Data Sets and Precipitation: The Implication of Irrigation on Regional Soil Moisture Trend.” International Journal of Applied Earth Observation and Geoinformation 48: 17–27. doi: https://doi.org/10.1016/j.jag.2015.11.012
- Rahmani, A., S. Golian, and L. Brocca. 2016. “Multiyear Monitoring of Soil Moisture Over Iran Through Satellite and Reanalysis Soil Moisture Products.” International Journal of Applied Earth Observation and Geoinformation 48: 85–95. doi: https://doi.org/10.1016/j.jag.2015.06.009
- Samaniego, L., S. Thober, R. Kumar, N. Wanders, O. Rakovec, M. Pan, M. Zink, J. Sheffield, E. F. Wood, and A. Marx. 2018. “Anthropogenic Warming Exacerbates European Soil Moisture Droughts.” Nature Climate Change 8: 421–426. doi: https://doi.org/10.1038/s41558-018-0138-5
- Sridhar, V., K. G. Hubbard, J. You, and E. D. Hunt. 2008. “Development of the Soil Moisture Index to Quantify Agricultural Drought and Its “User Friendliness” in Severity-Area-Duration Assessment.” Journal of Hydrometeorology 9: 660–676. doi: https://doi.org/10.1175/2007JHM892.1
- Tao, S., J. Fang, X. Zhao, S. Zhao, and Q. Guo. 2015a. “Rapid Loss of Lakes on the Mongolian Plateau.” Proceedings of the National Academy of Sciences of the United States of America 112: 2281–2286. doi: https://doi.org/10.1073/pnas.1411748112
- Tao, S., J. Fang, X. Zhao, S. Zhao, H. Shen, H. Hu, Z. Tang, Z. Wang, and Q. Guo. 2015b. “Rapid Loss of Lakes on the Mongolian Plateau.” Proceedings of the National Academy of Sciences 112: 2281–2286. doi: https://doi.org/10.1073/pnas.1411748112
- Wagner, W., G. Blöschl, P. Pampaloni, J.-C. Calvet, B. Bizzarri, J.-P. Wigneron, and Y. Kerr. 2007. “Operational Readiness of Microwave Remote Sensing of Soil Moisture for Hydrologic Applications.” Nordic Hydrology 38: 1–20. doi: https://doi.org/10.2166/nh.2007.029
- Wang, T. 2016. “Vegetation NDVI Change and its Relationship with Climate Change and Human Activities in Yulin, Shaanxi Province of China.” Journal of Geoscience and Environment Protection 4: 28.
- Wang, H., S. M. Vicente-serrano, F. Tao, X. Zhang, P. Wang, C. Zhang, Y. Chen, D. Zhu, and A. E. Kenawy. 2016. “Monitoring Winter Wheat Drought Threat in Northern China Using Multiple Climate-Based Drought Indices and Soil Moisture During 2000–2013.” Agricultural and Forest Meteorology, 228-229: 1–12. doi: https://doi.org/10.1016/j.agrformet.2016.06.004
- Wang, Y., J. Yang, Y. Chen, G. Fang, W. Duan, Y. Li, and P. De Maeyer. 2019. “Quantifying the Effects of Climate and Vegetation on Soil Moisture in an Arid Area, China.” Water 11: 767. doi: https://doi.org/10.3390/w11040767
- Wang, Y., J. Yang, Y. Chen, A. Wang, and P. De Maeyer. 2018. “The Spatiotemporal Response of Soil Moisture to Precipitation and Temperature Changes in an Arid Region, China.” Remote Sensing 10: 468. doi: https://doi.org/10.3390/rs10030468
- Yi, Y., J. S. Kimball, L. A. Jones, R. H. Reichle, and K. C. McDonald. 2011. “Evaluation of MERRA Land Surface Estimates in Preparation for the Soil Moisture Active Passive Mission.” Journal of Climate 24: 3797–3816. doi: https://doi.org/10.1175/2011JCLI4034.1
- Zeng, J., Z. Li, Q. Chen, H. Bi, J. Qiu, and P. Zou. 2015. “Evaluation of Remotely Sensed and Reanalysis Soil Moisture Products Over the Tibetan Plateau Using in-Situ Observations.” Remote Sensing of Environment 163: 91–110. doi: https://doi.org/10.1016/j.rse.2015.03.008
- Zhang, Q., K. Fan, V. P. Singh, P. Sun, and P. Shi. 2018. “Evaluation of Remotely Sensed and Reanalysis Soil Moisture Against In Situ Observations on the Himalayan-Tibetan Plateau.” Journal of Geophysical Research: Atmospheres 123: 7132–7148.
- Zhang, X., Y. Hu, D. Zhuang, Y. Qi, and X. Ma. 2009. “NDVI Spatial Pattern and its Differentiation on the Mongolian Plateau.” Journal of Geographical Sciences 19: 403–415. doi: https://doi.org/10.1007/s11442-009-0403-7
- Zhao, X., H. Hu, H. Shen, D. Zhou, L. Zhou, R. B. Myneni, and J. Fang. 2015. “Satellite-indicated Long-Term Vegetation Changes and Their Drivers on the Mongolian Plateau.” Landscape Ecology 30: 1599–1611. doi: https://doi.org/10.1007/s10980-014-0095-y
- Zheng, D., X. Li, X. Wang, Z. Wang, J. Wen, R. van der Velde, M. Schwank, and Z. Su. 2019. “Sampling Depth of L-Band Radiometer Measurements of Soil Moisture and Freeze-Thaw Dynamics on the Tibetan Plateau.” Remote Sensing of Environment 226: 16–25. doi: https://doi.org/10.1016/j.rse.2019.03.029
- Zheng, D., V. D. V. Rogier, J. Wen, X. Wang, P. Ferrazzoli, M. Schwank, A. Colliander, R. Bindlish, and Z. Su. 2018. “Assessment of the SMAP Soil Emission Model and Soil Moisture Retrieval Algorithms for a Tibetan Desert Ecosystem.” IEEE Transactions on Geoscience & Remote Sensing 56: 1–14. doi: https://doi.org/10.1109/TGRS.2018.2830100