
ABSTRACT
The Russian Far East is a region between China and the Russian Arctic with a diverse climatological, geophysical, oceanic, and economical characteristic. The southern region is located in the Far East monsoon sector, while the northern parts are affected by the Arctic Ocean and cold air masses penetrating far to the south. Growing economic activities and traffic connected to the China Belt and Road Initiative together with climate change are placing an increased pressure upon the Russian Far East environment. There is an urgent need to improve the capacity to measure the atmospheric and environmental pollution and analyze their sources and to quantify the relative roles of local and transported pollution emissions in the region. In the paper, we characterize the current environmental and socio-economical landscape of the Russian Far East and summarize the future climate scenarios and identify the key regional research questions. We discuss the research infrastructure concept, which is needed to answer the identified research questions. The integrated observations, filling in the critical observational gap at the Northern Eurasian context, are required to provide state-of-the-art observations and enable follow-up procedures that support local, regional, and global decision making in the environmental context.
1. Background
The Russian Far East, area of 6216 thousand km2, is located between latitudes 42°N and 77°N. The northernmost point is the Henriet Island, the southern part is bordering with China, along rivers Amur and Ussuri, Lake Khanka, the East Manchurian mountains, and with North Korea along the Tumen River. The western part is lined with the East Siberian Plain (). In the Russian Far East, the northern remote environments are characterized by Arctic deserts, tundra, and forest-tundra. In the south the dominating vegetation types are the coniferous, coniferous-deciduous, or coniferous-broadleaved forests, the last one providing a habitat for the subtropical species like ferns (Polypodiopsida), lianas (Lianae), ginseng (Panax), Siberian tiger (Panthera tigris tigris), and Far Eastern leopard (Panthera pardus orientalis). These different natural environments and ecosystems combined with the monsoon climate, volcanic activity, and permafrost make the Russian Far East especially vulnerable to environmental change. In future, the Russian Far East is expected to be strongly affected by climate change. The model simulations, used in the Intergovernmental Panel on Climate Change (IPCC) fifth assessment report (IPCC Citation2013), indicate that the annual mean warming in the Russian Far East will exceed the global mean warming by 50–100% or even more in the northernmost parts. Precipitation is also projected to increase with typically 5–10% increased annual rainfall for each 1°C of global warming.
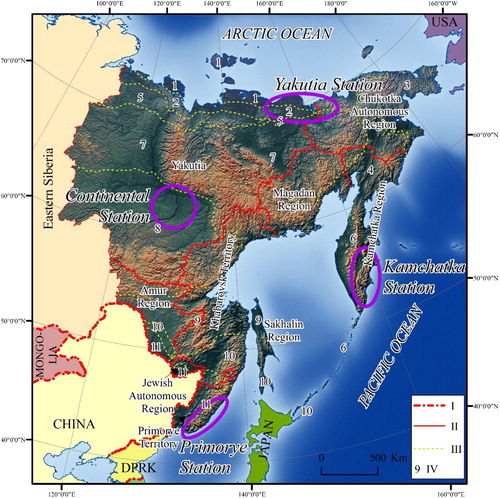
Figure 1. Geographical situation and zonal landscapes of the Russian Far East (adapted from Isachenko Citation1985). Legend: I – state boundaries; II – regional boundaries; III – zonal landscape boundaries; IV – zonal landscape numbers. Zonal landscapes: Subarctic continental: 1 – Arctic tundra; 2 – typical tundra. Subarctic Pacific: 3 – typical tundra; 4 – southern tundra. Boreal-subarctic forest tundra: 5 – continental and sharply continental. Boreal, transitory to subarctic: 6 – Pacific. Boreal typically continental: 7 – northern taiga; 8 – middle taiga; 9 – southern taiga. Boreal typical Pacific: 10 – middle and southern taiga. Boreal, transitory to sub-boreal: 11 – pacific. Sub-boreal humid broadleaf: 12 – Pacific.
The Far East is also heavily affected by long-range atmospheric pollution. The atmospheric air pollution coming from China not only threatens the health of hundreds of millions of people (e.g. Apte et al. Citation2015; Kulmala Citation2015; Lelieveld et al. Citation2015; Maji et al. Citation2018) but also causes major problems to the agricultural and industrial productivity and to the ecosystems in the region (e.g. Lappalainen et al. Citation2018b). The Silk Road Economic Belt and the 21st Century Maritime Silk Road (B&R) is estimated to be one of the largest economic transport corridors in the world of the Twenty-first century. The new Silk Road economic regions and transport corridors link the Russian Far East with globalization megatrends and lead to the increasing use of natural resources. Thus, land and water areas may undergo substantial changes during the upcoming decades associated with increasing pollution load to the atmosphere and to the ecosystems (Lappalainen et al. Citation2016; Lappalainen et al. Citation2018a).
The regional air pollution processes have interconnections to large-scale air quality–climate interactions, to atmospheric circulation dynamics, and to extreme weather events, to permafrost processes under the changing climate, and to sea ice-free periods of the Arctic Ocean (AMAP, SWIPA; Summary for Policy-makers, Report for Policymakers oaarchive.arctic-council.org). The complex feedbacks related to the climate change and air quality may influence and generate impacts on the Earth System level (e.g. Arneth et al. Citation2010). Thus, on the regional scale, solutions to minimize the environmental pollution in the Russian Far East are urgently needed. The volcanic activity, permafrost thawing, and under water emissions from the lithosphere are regional features that make this task even more challenging. Only a multidisciplinary scientific approach, together with a novel research infrastructure, can tackle these types of multi-scale questions and provide information needed for the solutions and for the mitigation and adaptation plans (Kulmala et al. Citation2015, Citation2016a; Lappalainen et al. Citation2016, Citation2018a, Citation2018b).
The aim of this paper is to introduce the specific climatological and geophysical aspects for the Russian Far East region. Then we summarize key processes impacting the regional environment, such as forest fires, volcanism, and emissions from the sea floor. Based on these features, we identify key research questions that need to be tackled in the next decade. We provide an overview of the future research infrastructure needs and underline the required observation capacity of the in-situ stations to solve the research questions that have socio-economic relevance in the Russian Far East.
2. Specific aspects of the Russian Far East environment
Major parts of the Russian Far East are located in the monsoon region with seasonally changing winds and influence of the Pacific Ocean. The extremely continental East Siberian sector, together with the Far Eastern monsoon sector, and the Pacific Ocean sector modify the structure of the high-altitude vegetation and landscape zoning (, and ). The meteorological conditions are affected by the Arctic Ocean and by the cold air masses penetrating far to the south. The air masses from the Pacific Ocean bridge the southern region to the monsoon climate. The continental climate is dominating in the mainland and in the central Yakutia the climate is sharply continental.
Table 1. Average air temperature of the basic climatic zones of the Far East (°С).
Table 2. Zonal landscapes in the Far Eastern Russia
The Pacific coast of the Far East, including the Kuril Islands and the Kamchatka Peninsula, is a part of the Pacific Ring of Fire characterized by active geodynamic processes (Kolomyts Citation2016). Since late twentieth century, the Russian Far East has been identified as a separate physical-geographical subcontinent (Sochava Citation1962) or subcontinent of East Asia connected with the Pacific geosyncline coinciding with the Pacific monsoon sector (Isachenko Citation1985).
Approximately 75% of the Far East is formed on a mountain relief. The western part is occupied by an extensive Siberian platform with a slightly dissected surface, extensive denudation plateaus, and separate ridges. A belt of Mesozoic folded systems with Verkhoyansk and Chersky ridges, Dzhugdzhur mountains, Badzhalo-Bureinsky upland, and Sikhote-Alin, extend along the eastern margin of the Siberian platform. Koryak highland, Kamchatka, Kurile Islands, and Sakhalin belong to the area of new (Cenozoic) folding, which was formed under Quaternary and, except Sakhalin, under modern volcanism. The limited flat terrain is mainly confined to long bending territories on the Siberian platform and extensive depressions of tectonic origin.
The CO2 degassing from the volcanoes exemplifies the importance of the seismotectonic and volcanic activity forecasting. The biggest eruptions at the Far East are monitored using satellite data supplied by the Monitoring of Active Volcanoes in Kamchatka and on the Kuril Islands information system (VolSatView) (Girina et al. Citation2018) or 16 years of Multi-angle Imaging SpectroRadiometer (MISR) measurements (Flower and Kahn Citation2017). Compared with the existing ground and airborne observations, and alternative satellite-based reports compiled by the Global Volcanism Program (GVP), MISR plume height retrievals show general consistency; the comparison reports appear to be skewed toward the region of the highest concentration observed in MISR-constrained plume vertical extent. A comprehensive study of methane and carbon dioxide fluxes at the level of lineaments, or extended geotectonic zones, of the regional (300–2000 km) and planetary (3000–20 000 km) scales, is of primary importance. The seismotectonic processes are activating the underwater gas torches initiated by high methane content in bottom sediments such as the giant torch in the southwestern part of the Sea of Okhotsk. Consequently, the East Asian seas may have the most intense underwater natural gas fluxes (with methane reaching 99% of the volume) controlled by the same lineaments (Shakirov et al. Citation2017). Such lithospheric structures favor the formation of methane hydrates in sedimentary deposits. Transversal geotectonic structures control the formation and activity of the most powerful centers of methane emission and act as indicators of gas activity in the tectonosphere and of oil and gas deposits, and gas hydrate accumulation. In future, it is very important to monitor and assess the gas activity of such areas together with the amount of methane entering the atmosphere.
The permafrost covers up to 80% of the land area in the Russian Far East. Non-permafrost areas are only found in the Primorskye Territories, the Sakhalin Region, plains of the Southern Amur Region, and the southern part of the Western Kamchatka Plain (). The depth of frozen soil may reach 400–600 meters. The temperature of the ground varies from −1.5 to −5°C. Intermittent permafrost areas are located in the South of the region, including a narrow strip of island permafrost with a soil temperature varying from −1.5–0°C.
3. Socioeconomics of the Russian Far East
Several resources and economic assessments have addressed the Russian Far East region as zone of a ‘Pacific megaecotone of Northern Eurasia’ (Kolomyts Citation2016) or ‘Pacific Russia’ (Baklanov Citation2012). The region is divided into three macroeconomic regions (Baklanov, Karakin, and Sheingauz Citation2005): North-West (Yakutia), North-East (Kamchatka, Magadan, Chukotka), and South (Primorskye and Khabarovsk territories, Amur, Sakhalin and Jewish Autonomous Region). This area as a whole determines the trends and intensity of economic development in the Far East. It has already affected the transformation of the geosystems during the last 150 years leading to pollution of regional water and atmospheric systems. Today, the borderline region with China is the largest industrial and economic region globally underling the increasing trend of environmental pollution (Liu and Diamond Citation2005).
The huge geographical territory is populated only by 6.2 million people, which is 4.2% of the population of Russia. The region is the least populated region in Russia. The population density is 8 times lower than on average in Russia (8.6 people/km2) and is extremely unevenly distributed across the region. The highest density (11.7 people/km2) is recorded in Primorskye territory and the lowest in the Magadan region in Yakutia (less than 0.3 people/km2) and in Chukotka autonomous region (only 0.1 people/km2). In 1991–2015, the population of the region decreased by 1.9 million people (23.1%). The main part of the population lives along the rivers Amur and Ussuri and on the coast of the Sea of Japan (Sidorkina Citation1997; The Far East of Russia Citation2015).
The land use in the Russian Far East directly relates to the population density. Thus, the southern lands of the region are actively used (Amur, Jewish autonomous region, Sakhalin regions, Khabarovsky, and Primorsky territories, , and 2015 global land cover, 2015). At the moment, especially alarming land use change is related to the reducing forest area. The forest fires and wood cutting are the main factors behind this negative development. The decrease of the forest area, by 6% after year 2000, is well demonstrated by remote sensing data (Hansen et al. Citation2013 and ).
Table 3. Land cover types of the Russian Far East.
Table 4. Dynamics of forest land in the Russian Far East (Hansen et al. Citation2013).
4. Future climate in the Far East region
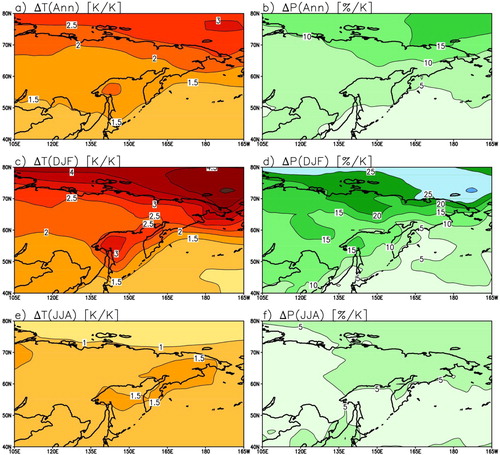
The ongoing global warming is expected to continue during this century although its magnitude depends strongly on the future pathway of anthropogenic greenhouse gas emissions as well as the climate model used for the projection. IPCC (Citation2013) reports a likely global mean temperature increase of 0.3–1.7°C for the lowest (RCP2.6) and 2.6–4.8°C for the highest (RCP8.5) scenario between the 20-year periods of 1986–2005 and 2081–2100. Likewise, the warming in the Russian Far East is scenario-dependent. On average, however, the models in the 5th Coupled Model Intercomparison Project (CMIP5) suggest that the annual mean warming in the area will exceed the global mean warming by 50–100%, or even more in the northernmost parts ((a)). The projected warming is particularly large in winter, but it exceeds the global average even in summer as well ((ce)). Precipitation is projected to increase, with typically 5–10% larger annual precipitation for each 1°C of global warming ((b)), but again with a larger increase in winter than in summer ((d,f)).
Figure 2. Changes in annual, winter (December–January–February) and summer (June–July–August) mean temperature (left, unit K per 1 K of global mean temperature change) and precipitation (right, left, unit % per 1 K of global mean temperature change) in the Russian Far East in CMIP5 simulations. For these maps, the temperature and precipitation changes from 1986–2005 to 2081–2100 were first averaged over 143 CMIP5 simulations for the RCP2.6, RCP4.5, RCP6.0, and RCP8.5 scenarios and then divided by the 143-simulation mean global mean warming. While the absolute magnitude of the changes depends strongly on the RCP scenario, these normalized patterns are nearly the same for all the scenarios.
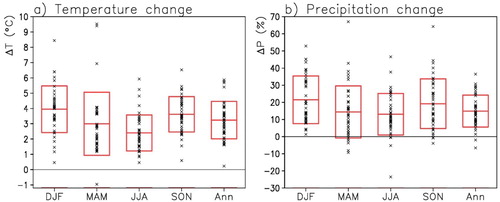
The anticipated climate changes vary substantially between different models, which imply a need for both further model development and adaptation strategies that are able to deal with the uncertainty. This variation is exemplified in , which shows twenty-first century seasonal and annual mean temperature and precipitation changes in a grid box near Yakutsk for the moderate RCP4.5 scenario, in 42 CMIP5 models separately. On one hand, the models agree well particularly on temperature changes, in the sense that the inter-model standard deviation is much smaller than the multi-model mean warming. Yet, the range of the simulated temperature changes is large especially in spring (MAM in a), possibly, in part, due to inter-model differences in the representation of the snow-albedo feedback. One of the models even simulates a slight cooling in the spring and only a very small warming in the other seasons. This is related to a drastic decrease in the North Atlantic thermohaline circulation, which strongly reduces the greenhouse gas-induced warming in this model in the extratropical Northern Hemisphere (Sgubin et al. Citation2018; see also FIO-ESM in Figure 12.9 of IPCC Citation2013). As found in other studies and for other parts of the world (Räisänen Citation2001; IPCC Citation2013), the inter-model agreement tends to be worse for precipitation than for the temperature changes, partly because the signal-to-noise ratio between the greenhouse gas-induced change and natural variability is lower for the precipitation. In northern parts of the Russian Far East, however, the agreement is still good in the sense that the precipitation increases nearly in nearly all models, although with a large range in the quantitative projections ((b) and Figure 12.22 in IPCC Citation2013).
Figure 3. Seasonal (first four columns) and annual (rightmost columns) changes in (a) mean temperature and (b) precipitation near Yakutsk (grid box at 62.5°N, 130°E) from years 1986–2005 to 2081–2100 under the RCP4.5 scenario in 42 CMIP5 climate models. The individual model projections are shown with crosses, and the bars indicate their mean ± 1 standard deviation.
5. Research questions
Global grand challenges need to be addressed on a regional scale (e.g. Lappalainen et al. Citation2018a). The research questions are motivated by the increasing role of the Arctic in megatrends induced by climate changes such as new transport routes, demography changes, and use of natural resources (e.g. Smith Citation2010). These megatrends have substantial impacts on the terrestrial, marine, and cryosphere domains which are undergoing unprecedented environmental change (Overland et al. Citation2019). In order to address these changes, provision of observational data in the Arctic region has been identified as a key requirement in the Arctic Observation Summit (AOS) by Sustaining Arctic Observation Network (SAON, e.g. Murray et al. Citation2020) including the marine (Vihma et al. Citation2019) and comprehensive atmospheric observations (Hari et al. Citation2016; Uttal et al. Citation2016) as well as integration of in-situ and satellite remote sensing (Petäjä et al. Citation2020).
Within the context of multi-platform comprehensive environmental observations, we identify a set of research questions pertinent to the Russian Far East region. The key questions in the region are connected with greenhouse gases, especially methane, and aerosol concentrations and emissions from different anthropogenic and natural sources including local and long-range transported sources. From the global perspective it is crucial to quantify the effect of global warming in the nature and in ecosystem-atmosphere climate interactions, in the permafrost processes, and in the interconnections of the sea ice-free periods of the Arctic Ocean.
5.1. Regionally relevant research questions
5.1.1. How much methane is emitted from anthropogenic sources including coal deposits?
Substantial amount of methane is emitted from East Siberian Sea and coal deposits (Gresov et al. Citation2017). The initial resources of methane from the Far East coal fields are estimated to be 11 trillion m3. This volume is comparable with the emissions from traditional, global oil, and gas field resources. Single coal mining site releases annually 2–4 million tons of methane into the atmosphere, together with other harmful components such as radon, carbon dioxide, and mercury. The most typical example of Far East coal deposits as the methane emission source is mines of the Tavrichansky deposit, south of Primorskye Territory. Their operation results in extremely high emission in to the atmosphere, estimated to be over 100 m3 methane per ton of coal produced daily. Methane content in the degassing systems reached 98%, and methane production reached 21 m3/min (Gresov et al. Citation2017). Average annual emission of methane to the atmosphere with ventilation jets reached 30 million m3, and 12 million m3 with degassing installations, in total – 42 million m3. During the operation, 98 gas emissions were recorded with an initial production rate of up to 52 m3/min. In 1998, the mines were closed and after closing, the estimated volumes of methane emissions from the mines decreased to 150–160 million m3 in a 12-year period. At the time of closing, the extractable methane resources were 4.9 billion m3. Without the anthropogenic degassing, for example in 2009, over 6.2 million m3 of methane were emitted into the atmosphere. There is a need to quantify these emissions and follow their development in future.
5.1.2. How much methane is degassing from the seas?
The preliminary studies, covering major part of one of the largest East Asian lineaments, the so-called sub-longitudinal Okhotsk-Japan Sea lineament, demonstrate various forms of degassing hydrocarbon accumulations, namely hydrocarbon deposits, surface, and underwater gas-fluid phenomena (over 1000 torches by 2017), gas hydrates, mud volcanoes, water-gas and geothermal sources, and anomalous gas-geochemical fields (Mishukova and Shakirov Citation2017; Shakirov et al. Citation2017). The highest natural oceanic upward flux of methane (torch) F1 with over 2000 m height (46°1.99N – 144°15.25′E, depth 2220 m, with a flow rate up to 5 mol/s) was recorded in 2012 at the western part of the Kuril depression (Russian–Japan–Korean Sakhalin Slope Gas Hydrates (SSGH) Program, e.g. Minami et al. Citation2012). The ascent rate of the natural gas bubbles reached 30 cm/sec or more under the general pulsating nature of the torch. The area is also characterized by high methane content in bottom sediments: 1000 cm3/m3 and higher, with an average value of 4.2 cm3/m3 for the Sea of Okhotsk. The data obtained in 1990–2016 underline the high variability of methane fluxes at the water–air boundary in the Sea of Okhotsk from absorption to emission of this gas, reaching over 300 mol/km2 per day, both in the whole sea area and in time, accumulating into more than 200 thousand tons of methane per year. In the north of the Sea of Japan (Tatar Strait), these values, affected by the underwater ascending methane flows, reached even 400 mol/km2 per day (Shakirov et al. Citation2017).
Activation of most of the underwater gas torches, including the giant torch in the southwestern part of the Sea of Okhotsk, originates from strengthening of seismotectonic processes. For example, the most catastrophic event in the period preceding the torch detection was the Tohoku earthquake in 2011. This, and the subsequent earthquakes in 2012–2013, increased the gas emissions in the western part of the Kurile basin. The gas emissions triggered seismotectonic and volcanomagmatic activation, which was observed in the marginal seas of the northwestern Pacific Ocean and their framing then and to the present day. The studied lineament extends from the Sea of Japan and the Sea of Okhotsk to the Laptev Sea and joins with the seismically (Magnitude≤6) and volcanically active Gakkel Ridge at the south, where extensive field (about 6000 km2) of underwater methane torches that were discovered in 2011. As a summary, the spatiotemporal variability of these emissions needs to be better quantified, characterized, and monitored in order to address their contribution to the methane emissions into the atmosphere.
5.1.3. How much gases and aerosols are emitted from volcanoes to the atmosphere?
Up to 12% of all active volcanoes in the World are located in the Far Eastern Russia (Gushchenko Citation1983). The most active volcanoes are located in Kamchatka, where three to five volcanic eruptions taking place every year (Senyukov Citation2013). The active volcanoes include Klyuchevskaya Sopka, Bezymyanny, Shiveluch, Karymskaya Sopka, and Avachinskaya Sopka. Volcanoes of the Kurile Islands are Mendeleyev, Alaid, Severgin, Sarychev Peak, and Snow. The previous eruption data in Kamchatka and Kurile Islands indicate a significant contribution of volcanic activity to the atmospheric gas emissions (e.g. Carn et al. Citation2017; Taran et al. Citation2018). The effect has been registered over a major part of the northern hemisphere.
Volcanic ash is one of the major aerosol sources globally, consisting of both primary volcanic ash and secondary sulfate aerosol particles (e.g. Markhinin Citation1985; Mills et al. Citation2016). Formation of sulfate aerosols from the SO2 emitted by the volcanoes can distribute to regional (e.g. Petäjä et al. Citation2012) or even global scale, depending on the height of the plume. Remote sensing data on the activity of gas emissions for integral estimates of volcanic gas flows are still challenging (Carn et al. Citation2017). It is difficult to quantify the amount of volcanic gases emitted into the atmosphere. The amount of emitted gases is expected to be many times higher than the amount of volcanic ash as the volcanic explosions occur under the influence of mantle gases. For example, in December 2006 and March 2007, after eruptions of Bezymyanny and Shiveluch volcanoes in Kamchatka, the volume of erupted ash was estimated to be 7 million tons of ash containing 30 000 tons of water-soluble substances (Malik Citation2011). To put this into perspective, the amount of SO2 emitted to the atmosphere corresponded to the emissions equal to 1–3 months emissions on an industrial city with a million inhabitants. During the eruption of the Bezymyanny volcano on 24 December 2006, the amount of SO2 corresponded to the annual industrial emissions of the Kamchatka Region and was discharged onto the snowcover of the adjacent territories within one hour. The hydrochloric acid (HCl) amount was equal to the annual emissions of a city with a population of a million (Malik Citation2010).
On 11–16 June 2009 an eruption of the Peak Sarychev volcano occurred on the Matua Island (Central Kurile Islands) and nine giant explosions were recorded. The ash clouds reached 16 km in altitude. The impact of the volcanic activity was traced from Komsomolsk-on-Amur to the Alaska Peninsula, where they detected as an increase in the atmospheric concentration of SO2 with values exceeding 5.0 Dobson Units (Sarychev Eruption Citation2018), and the fallout of volcanic ash was registered from the neighboring islands to the eastern part of Sakhalin (Rybin, Razzhigaeva, and Ganzei Citation2010, Citation2011). Lidar observations demonstrated the aerosol disturbance in the stratosphere over the city of Tomsk, Western Siberia and evidenced the formation of considerable aerosol layers at the altitude of 13–17 km in June–December 2009 as a result of a volcanic eruption on the Matua Island (Bazhenov et al. Citation2012). For the future, particularly important is the atmospheric air monitoring in settlements located near the active volcanoes. For example, in the city of Severo-Kurilsk, Kuril Islands, due to the vicinity of the Ebeko volcano (Kalacheva et al. Citation2016), in January–May 2005, concentration of hydrogen sulfide (H2S) in the air was almost constant as a result of increased fumarolic activity of Ebeko volcano. The excess concentrations reached 14–20 times the maximum permissible concentration. With the accompanying winds from the fumarolic fields and during calm air the maximum permissible concentration of H2S exceeded 100 times (Kotenko Citation2008).
Generally, carbon dioxide is a dominant gas emitted by the volcanoes of the Kurile Islands, followed by sulfur dioxide and nitrogen. The concentration of the volcanic gases from the Kurile Islands’ volcanoes was distributed, on average, as follows: CO2 68%, oxygen 6.7%, nitrogen 28%, hydrocarbon gases (in total) 4%, carbon monoxide 0.04%, hydrogen sulfide 3.9%, sulfur dioxide 0,8%, hydrogen chloride 0.4%, hydrogen 1.1%, noble gases (argon, krypton, xenon in total) 0.6%, and helium and neon around 0.01%. Nearly evenly distributed are carbon dioxide and sulfur gases. The relative hydrogen content in some cases reaches very high values, up to 39% in Cherny volcano in Chirpoi Island. Currently, there are no reliable estimates of the greenhouse gas emissions from the volcanoes of the Kuril Islands and Kamchatka (Taran et al. Citation2018). It is necessary to carry out comprehensive studies using a suite of gas analyzers to monitor the ambient concentrations and quantify the greenhouse gas emissions from the volcanoes in the region.
The volume of volcanic ash delivered to atmosphere has a pronounced impact on landscapes and river systems being the main stressor of the environmental processes in the region. These have various impacts on pollution rates and ecosystem production. Mercury and spheroidal carbonaceous particles (an unambiguous indicator of fossil fuel combustion) concentrations are typically low but clearly detectable indicating that both regional and global pollution sources are observed in the lakes (Jones et al. Citation2015). More recently, the geochemical signals in river system to volcano eruption (Kuksina and Alekseevskii Citation2018) emphasize the importance of comprehensive environmental observation. Overall, there are no established processes to support any kind of regular monitoring observations in the region (Jones and Solomina Citation2015).
5.1.4. How much gases and aerosols are emitted from the forest fires?
Forest fire is the single most significant factor affecting the regional air quality throughout the Russian Far East, although there is a high annual variation in number and area of forest fires (Natural Resources Use Citation2005; Forest Sector of the Russian Far East: an Analytical Survey Citation2008; Shlotgauer and Kryukova Citation2008; Sokolova, Kogan, and Glagolev Citation2009). The main areas of forest fires are located in Yakutia and in the southern Russian Far East have been characterized with an increasing number of forest fires since 1960s (Forest Sector of the Russian Far East: an Analytical Survey Citation2008 and ). Catastrophic forest fires occur, on average, once every 10 years. The burned area in the catastrophic forest fires is typically 3–10 times larger than the annual average area of the forest fires (Natural Resources Use Citation2005). In the southern part of the Far East, the catastrophic fires occurred in 1976, in 1988, and in 1998 (Forest Sector of the Russian Far East: an Analytical Survey Citation2008). Statistics of the forest fires of the southern part of the Far Eastern region in 2000–2015 shows that the increasing trend of forest fires continues (). In 2001–2010, compared to the previous decade, the average annual area of fires decreased only in Khabarovsk Territory and in Kamchatka Region, and increased significantly in the other areas.
Table 5. Average annual area of forest fires, thousand ha (Natural Resources Use Citation2005; Regions of Russia Citation2008; Environmental protection Citation2010, Citation2016).
The catastrophic forest fires in the southern Far East in the period of 2000–2015 took place in 2008 with an area of 900,000 ha and in 2009 in 859,000 ha. In January to November in 2017, the area of forest fires in Primorskye, Khabarovsky Territories, Amur and Jewish Autonomous Regions amounted to 521,800 hectares, which was higher than the average annual values for 2010–2015 ( and ) (Forest Fire Situation Citation2008). Referring to the 10-year periodicity in the catastrophic forest fires, we can predict that the next peak of forest fires in the southern region would take place in near future.
Table 6. Forest area affected by fires, thousand ha (China Statistical Yearbook Citation2004–2016; Regions of Russia Citation2008; Environmental protection Citation2010, Citation2016).
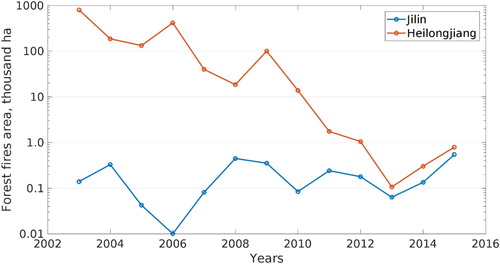
In the Heilongjiang and Jilin provinces in China bordering with the Far Eastern Russia, the forest fires were frequent in the late twentieth century. In 1950–1995, the average area of annual forest fires in Heilongjiang reached 328,000 ha (or 37.5% of all forest fires in China), and 122,000 ha (14%) in Jilin (Shu et al. Citation2006). However, according to the statistical data for 2003–2015 the situation has significantly improved (). In 2011–2015, the average annual area of fires in Heilongjiang and Jilin provinces was only 80,000 and 20,000 hectares, respectively, decreasing by several orders of magnitude from the previous decades.
Figure 4. Area of forest fires in China, thousand ha (China Statistical Yearbook Citation2004–2016).
The decadal cycle of intense forest fires dynamics in the North-Eastern provinces in China and in the Russian Far East seems to be associated with the climatic conditions. The peak intensity in the forest fires in the area was registered in 1952, 1962, 1972, and 1982. Other periodicities in the forest fire extent are also present (Shu et al. Citation2006). For example, in 2003, when the total area of forest fires in Northeast China exceeded 1 million hectares, and in 2006 the burned area was 487,600 hectares. In contrast, in 2011–2014 only a very small area of forest burned. Such a small area of forest fires could be connected not only to the atmospheric conditions, but also to the improved forest fire prevention and prediction system. There were anomalous wind conditions over the south of Siberia, Far Eastern Russia, and Northeastern China in the summer of 2013, which resulted in long periods of rain and catastrophic flooding of the Amur River. The initiation and spread of forest fire and emissions depend on weather parameters and accumulation of fuel pertinent for fire risk management (Ying et al. Citation2018).
Generally, the forest fires emit a suite of trace gases and aerosol particles (e.g. Janhäll, Andreae, and Pöschl Citation2010; Virkkula et al. Citation2014) into the atmosphere. In general, the amount of emissions depends on the amount and type of the burnt organic matter, its chemical composition, ignition and fire propagation conditions, and type and intensity of the fire (Kogan Citation2013; Hu et al. Citation2019; Hu et al. Citation2019). The vast area of the Far East and the great variety of its natural conditions complicate the assessment of pollutants emitted by the forest fires across the region. Calculations for the selected areas show the volume of air pollutant emission during fires, for example, in the Jewish Autonomous Region in 2009 reached 51,397 tons, out of these 71.6% was accounted as CO2, 12.16% for hydrocarbons, 10.74% for aldehydes, 4.8% for CO (Kogan Citation2013). Monitoring the spatial and temporal variation of the forest fire emissions in the Far East as well as interannual variation is needed to address the impacts of forest fires to the health of the population and the environment.
5.1.5. What is the role of long-range air pollution for the Russian Far East environments?
The industrial emission including, the transported emissions in the Russian Far East in 2015, was estimated 1597 thousand tons with a variation in the emission volumes between different administrative areas (Baklanov, Karakin, and Sheingauz Citation2005). The highest emissions were observed in the most economically active areas in Primorskye, Khabarovsky territories, and in the Amur Region (). Significant emissions were registered over southern Yakutia. The anthropogenic emissions were consistent with the division of three macroeconomic districts (Baklanov, Karakin, and Sheingauz Citation2005).
Table 7. Industrial and motor transport emissions of air pollutants, thousand tons (Main indicators Citation2011; Environmental protection Citation2016).
The long range, anthropogenic pollutants from China are of particular relevance for the Russian Far East environments. The industrial production of northeastern Chinese provinces is considerably higher than that of the Russian Far East (Ganzei Citation2005). The total amount of atmospheric pollutants from Heilongjiang and Jilin provinces cannot be currently estimated due to the heterogeneity of the available data. However, statistical analysis on SO2 and NO emissions clearly indicates that the volume of these air pollutants in the adjacent territories of China is several times higher than that of the Russian Far East (). It should also be noted that the area of the two Chinese border provinces is 9.69 times smaller, but the population is 10.58 times higher than in the Russian Far East.
Table 8. Sulfur dioxide and nitrogen oxide air emissions from industrial sources, thousand tons (Environmental protection Citation2001, Citation2006, Citation2016; Main indicators Citation2011; Far Eastern Federal District Citation2011; China Statistical Yearbook Citation2004–2016).
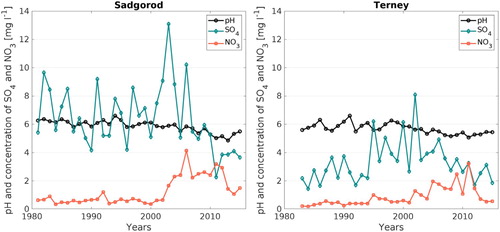
The southern part of Russian Far East is exposed to transboundary transport of pollutants from the industrial centers in East Asia. Analysis of monitoring data on the chemical composition of precipitation revealed an increase in the acidity of precipitation in the south of the Russian Far East (Kondrat’ev et al. Citation2013; Kondrat’ev Citation2014). The abnormally low pH of snow cover with acidity of below 4 pH. was recorded first time in Primorskye territory in a clean environment in 2005. Synoptic weather pattern analysis revealed that the stable snow cover in Primorskye Territory was formed as a result of five cyclones. Four cyclones were formed in East China and over the Yellow Sea (Kondrat’ev Citation2014). The cyclones formed over the urbanized areas of China in the polluted air with acid-forming substances. In general, the acidity of precipitation has increased since early 1980s in the south of the Russian Far East. For example, increasing pH variability of precipitation and increasing trends of concentration of sulfates and nitrates were observed at monitoring stations of Sadgorod (south of the Primorskye territory) and Terney (north of the Primorskye territory, ). The concentrations of sulfates and nitrates in Terney were lower than in Sadgorod, which could be explained by the contribution of cities of Vladivostok and Artem in Terney observation site.
Figure 5. Dynamics of рН and concentrations of sulfates and nitrates in precipitation from Sadgorod and Terney stations in 1981–2015 and 1983–2015, respectively.
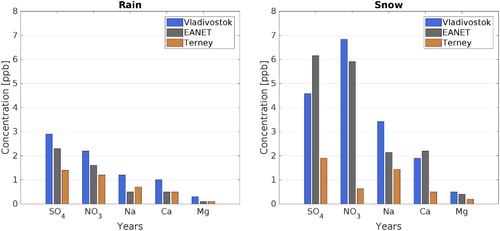
Furthermore, the seasonal variability of the chemical composition of precipitation indicated that snow, compared to rainfall, was more mineralized and the snow contained higher concentrations of SO4, NO3, Na, Ca, Mg, Cl (). Winter precipitation in Primorskye territory is typically formed in south-western cyclones. In Vladivostok, at the EANET-Primorskaya monitoring station, half of ionic composition of precipitation (rain and snow) was determined by the total content of SO4 + NO3 and their relative contributions were almost equal. In the snow cover, their ratio was similar. In precipitation at the Ternei station, the contribution of SO4 and NO3 to the total ion content was 33% with concentrations of 1.4 and 1.2 mg/l, respectively. In 2012–2013, the pH values for the average precipitation were 4.33 at the Vladivostok station, 4.99 at the Primorskaya station, and 4.89 at the Terney station. The increased SO4 and NO3 concentrations of precipitation and snow cover in the southern part of Primorskye Territory were related to the specific composition of local emissions, mainly from cars and ships, and to the transboundary transport of pollutants (Kondrat’ev et al. Citation2017).
Figure 6. Concentrations of basic ions in rain and snow from Vladivostok, Terney, and EANET stations in 2012–2013.
Both the atmospheric transport of pollutants and the lateral transport via transboundary rivers in the region have a significant impact on the concentration of anthropogenic chemicals in the Russian Far East environment. The largest hydrological pathways are tributaries of Amur River, which flow from China to Russia, and Selenga River, which brings water from Mongolia to Russia and from Lake Baikal in particular (Karthe et al. Citation2017). The transboundary pathways and mass flows of heavy metals and metalloids in both dissolved and suspended forms in the region were studied during field campaigns in 2011 and 2013, (Lychagin et al. Citation2017). Urban (Ulaanbaatar and Ulan-Ude) and industrial centers (Zaamar gold mining and Zakamensk tungsten–molybdenum mining) had a strong effect on water quality degradation over short distances underlined with a factor of 3–6 increase in heavy metal and metalloid concentrations downstream. The study also found out that the Selenga River had enriched levels of both dissolved and suspended levels of metals as compared to world average in surface waters (Lychagin et al. Citation2017). The important aspect of these insights is that no regular monitoring network exists at the moment in the region to predict the transport of pollutants or their impacts to the environment. To fill this gap starting in 2018, a novel monitoring program, under Pan Eurasian Experiment (PEEX, www.atm.helsinki.fi/peex, Kulmala et al. Citation2015; Lappalainen et al. Citation2018a) in connection with Baikal Selenga River network (BaSeNet www.atm.helsinki.fi/peex/index.php/baikal-selenga-network-basenet), aims to quantify the waterborne transport of matter under changing hydro-climatic conditions on large drainage basin scales (see https://www.atm.helsinki.fi/peex/index.php/baikal-selenga-network-basenet).
5.2. Globally relevant research questions
Globally relevant research questions related to the specific characteristics of the Russian Far East region connect to the effect of global warming on the nature and ecosystem-atmosphere climate interactions, to the permafrost processes under changing climate, and to the role of Arctic Ocean and ice-free periods. The climate-related feedback mechanisms either speed up or slow down the changes of the climate-related parameters in the presence of external forcings (Arneth et al. Citation2010; IPCC Citation2013; Scott et al. Citation2018). For example, the continental biosphere-aerosol-cloud-climate (COBACC) feedback loop is relevant to the regions covered by taiga forests and is related to the ambient air temperature, gross primary production, secondary aerosol formation, cloud formation, and linked to the radiation balance (Kulmala et al. Citation2014). Quantification of the strength of these feedback mechanisms in the Russian Far East can contribute to the understanding of climate change.
Furthermore, a major part of the Northern Eurasian region is covered by continuous permafrost and changes in the turnover of the soil carbon stocks due to permafrost melting will likely switch the terrestrial ecosystems from being carbon sinks to being carbon sources (Koven et al. Citation2011; Schaefer et al. Citation2011). The permafrost soils and their greenhouse gas emissions in the tundra environment are important for the global climate. The current climate change scenarios underline the urgent need for a systematic permafrost monitoring, together with greenhouse gas measurements in various ecosystems. The processes of the Arctic Ocean, the interaction between the ocean and the other components of the Earth system including the air–sea exchange of momentum, heat, and matter, and the dynamics and thermodynamics of sea ice are major issues need to be better understood. For example, we need to quantify the effects on the ocean, surrounding continents, and aerosol budgets (Vihma et al. Citation2019) caused by sea ice decline.
The Pan Eurasian Experiment (PEEX) Science Plan (Lappalainen, Kulmala, and Zilitinkevich Citation2015) introduced the large- scale research questions relevant to Northern Eurasian region. The quantified environmental information and data from Russian Far East play a critical role in this context and the research questions are:
What are the net effects of various feedback mechanisms in (i) land cover changes (ii) photosynthetic activity, (iii) GHG exchange and BVOC emissions (iv) aerosol and cloud formation and radiative forcing? How do these vary with climate change on regional and global scale?
How fast will permafrost thaw proceed, and how will it affect ecosystem processes and ecosystem-atmosphere feedbacks, including hydrology and greenhouse gas fluxes?
How will the extent and thickness of the Arctic sea ice and terrestrial snow cover change and what are the interconnections of the sea ice-free periods of the Arctic Ocean?
6. Monitoring infrastructure and future needs
The specific characteristics of the diverse Far East natural environment in terms of vegetation, permafrost, volcanic activity, and the marginal seas at the continent-ocean transition zone, set specific requirements for the atmospheric and environmental monitoring. The region possesses huge unconventional natural gas resources comparable to the global conventional natural gas reserve and is under pressure of increasing local industry. The Far East region is heavily affected by long-range atmospheric and riverine pollution, and the quantification of the contributions of regional and transported pollution is a complex task. Currently available scientific data provide only a general idea of the scale of the present atmospheric composition in the Russian Far East region. To be able to solve the most urgent research questions raised in the sections before we need a comprehensive monitoring system. New data are needed from an advanced in-situ station network in combination with ground-based remote sensing (lidars, radars, radiometers) and with satellite-based Earth Observation (EO) data. The ‘Stations for Measuring the Earth surface and Atmospheric Relations’ (SMEAR) concept provides such a comprehensive environmental observation system for the in-situ component and it enables detection of atmospheric composition, analysis of physical properties, composition, and chemical transformation of aerosol particles, source appointment analysis, and, in a wider scale, also the land-atmosphere interactions and feedbacks (Hari et al. Citation2016; Kulmala Citation2018).
Furthermore, the comprehensive experimental approach of the SMEAR-concept (Hari et al. Citation2016) allows us to identify new scientific questions and tackle rising environmental challenges not only in the atmospheric domain but also those that are pertinent e.g. to terrestrial ecosystems (Hari et al. Citation2016) and marine environments (e.g. Vihma et al. Citation2019) but also integration between the in-situ and satellite observational data (e.g. Petäjä et al. Citation2020).
6.1. In-situ stations
Upgrading the in-situ stations or establishing new comprehensive stations as an in-situ observation network would fill the data gap required to tackle the research questions. The network would provide information on the concentrations of the greenhouse gases and aerosols from various sources and enable us to tackle atmospheric chemistry-related environmental problems. They would also provide benchmark observations to assess air quality in the region and allow quantifying the land–atmosphere feedbacks and interactions that are pertinent to climate change (e.g. Kulmala et al. Citation2004; Arneth et al. Citation2010; Kulmala et al. Citation2014; Kulmala et al. Citation2016b). The upgrading would also increase the availability of harmonized meteorological data needed for the regional climate modeling and improving the prediction accuracy of the climate scenarios for the Russian Far East.
Advances in our theoretical understanding have already revealed how elevated air pollution affects weather conditions (e.g. Ding et al. Citation2013, Citation2016), and how the aerosol particles decrease atmospheric turbulence and mixing reducing the boundary layer height and thus further elevating the surface pollution concentrations (Ding et al. Citation2016 Petäjä et al. Citation2016;; Wang et al. Citation2020). The secondary aerosol formation contributes to this process (Kulmala et al. Citation2017). To tackle air quality–climate interactions, Kulmala (Citation2015) and Kulmala (Citation2018) introduced a roadmap for a holistic multi-pollutant approach, which provides a pioneering, long-lasting, and cost-effective strategy for solutions to air-pollution problems in large urban regions and in megacities. However, it is also applicable in remote regions like Russian Far East. The advanced air quality monitoring is based on the SMEAR measurement concept and integrative data analysis (e.g. Petäjä et al. Citation2016). The key parameters to be observed are aerosol particle physical, chemical and optical characterization, greenhouse gas, and other trace gas concentrations and fluxes between the atmosphere and land-surface together with ecosystem and meteorological observations (Hari et al. Citation2016).
The comprehensive observations enable quantification of large-scale feedback mechanisms. For example, Continental Biosphere-Aerosol-Cloud-Climate (COBACC) feedback was identified and verified against observations from SMEAR II (Hari and Kulmala Citation2005) station in Hyytiälä, Finland. The results indicate that a 10 ppm increase in atmospheric CO2 concentration leads to a significant increase in both carbon sink and secondary aerosol source (Kulmala et al. Citation2014). These effects operate through changes in gross primary production, volatile organic compound (VOC) emissions, atmospheric oxidation (Ehn et al. Citation2014) followed by clustering and growth (Kulmala et al. Citation2013; Tröstl et al. Citation2016; Kerminen et al. Citation2018). There is also a link between secondary organic aerosol formation and cloud properties (Paasonen et al. Citation2013). The feedback loop demonstrates the importance of biospheric processes not only for the carbon and aerosol budgets, but also for the whole climate system (Shrivastava et al. Citation2017). The COBACC feedback suppresses global warming, proving a window of opportunity to reduce global carbon emissions. This needs to be quantified in a Northern Eurasian and in a global perspective. The strength of the COBACC feedback is tightly connected with biospheric functions, including the observed, yet poorly-understood Arctic greening, and other vegetation changes currently taking place in boreal and Arctic environments. More observations and knowledge are needed to understand how the COBACC feedback loop will develop in future. The key observations needed to quantify the link are fluxes of CO2, H2O, CH4, concentration of VOCs, and aerosol number size distribution together with meteorological observations and diffuse radiation.
The use of existing station infrastructure and upgrading the stations in a coordinated manner with new instrumentation techniques and data system would be the first step toward new environmental monitoring in the Russian Far East. The Primorskaya, Kamchatka, and Yakutsk/Yakutia North stations could be piloting this activity and build toward a baseline for the future in-situ station network and monitoring concept of the region (). These stations would form a well-located network covering the regional characteristics. The Primorskaya station location is optimal for monitoring the local and long-range anthropogenic emissions, emissions of the forest fires and coal deposits. The station is also located near to gas emission zones in the Sea of Japan. The Kamchatka site location would enable observations on greenhouse gas emissions from rift zones, volcanic activity, gas emission from the Sea of Okhotsk, and from the Bering Sea. The location of the Yakutsk/Yakutia North station(s) is ideal for estimating the greenhouse gases from the Arctic Ocean and the permafrost region.
Figure 7. Meteorological representativeness of four potential observation sites in the Russian Far East.
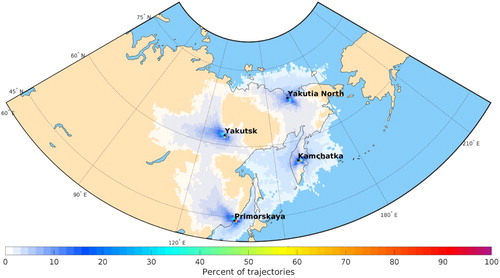
Analysis of two years (2014–2015) of HYSPLIT backward trajectories (Stein et al. Citation2015), arriving hourly at 100 m above ground level to each of the proposed four stations, demonstrates the meteorological representativeness of the stations. Here the Far East region was divided into 1 × 1 degree grid cells, and the percent of trajectories passing through each of the cells was calculated. The grid cells were color-coded based on this frequency of the passing air mass and plotted on the map (). The Yakutia North is affected by the proximity of the Arctic Sea. The site in Kamchatka is affected by western and eastern air masses with a rather equal weight.
6.2. Ground-based remote sensing
The specific aspects of the Russian Far East environment (volcanic activity, fluxes from the terrestrial and ocean areas, forest fires) strongly emphasize the role of ground-based remote sensing. Ground-based remote sensing (RS) provides information on vertical profiles and column-integrated values of concentrations of aerosols, greenhouse, and trace gases, as well as thermodynamic state of the atmosphere, cloud systems, and precipitation. The ground-based RS compliments surface in-situ measurements and expands the domain of measurements to the lower atmosphere.
Various techniques, such as lidars, radars, and radiometers are utilized in ground-based RS (e.g. Hirsikko et al. Citation2014; Petäjä et al. Citation2016). Lidar (LIght Detection And Ranging) instruments are commonly used in aerosol studies. They transmit light pulse and measure radiation backscattered or Raman scattered by atmospheric constituents (aerosols, gases, and cloud particles) enabling monitoring of vertical distribution of aerosols. Doppler lidars can additionally detect air velocity, facilitating 3D mapping of turbulence in the atmospheric boundary layer. Differential absorption lidar (DIAL) has two laser sources and transmits light pulses at two very close wavelengths – in the absorption peak of a target gas and near it with weak absorption. The DIAL lidars are used for tropospheric O3, CH4, NOx, and CO2 profiling. Differential optical absorption spectroscopy (DOAS) technique measures scattered sunlight spectrum in several viewing directions. The DOAS measurements are very sensitive to aerosols and trace gases in the lower troposphere and, therefore, provide highly valuable information on their vertical distribution. Sunphotometers are multichannel sun-and-sky scanning radiometers that measure the direct solar irradiance and sky radiance at the surface. Measurements are used to retrieve full transmission spectrum of the atmosphere and aerosol input to it by determining aerosol optical depth (AOD) – total extinction of light by aerosols in atmospheric column. Due to the wavelength dependency of AOD, Angstrom Exponent (AE) can be calculated to provide information on aerosol type. Cloud radars operate in millimeter-wavelength (typically 3 and 8 mm) and provide information on micro- and macrophysical properties of clouds. Ground-based RS and in-situ observations combined provide comprehensive insight into the atmospheric processes.
6.3. Satellite remote sensing
Satellite remote sensing (SRS) is used to monitor state and changes in Earth system components and provides information on the properties of the atmosphere, land surface, vegetation, oceans and water bodies, snow and ice at a variety of temporal and spatial scales (e.g. Petäjä et al. Citation2014; Abad et al. Citation2019). Passive and active remote sensing instruments installed on-board satellite platforms measure reflected and emitted radiation from the atmosphere and surface in different parts of the electromagnetic spectrum. Type of information that can be obtained from these measurements depends on the design of the instruments (spectral channels and resolution, viewing angles, polarization), and retrieval algorithms. Most of the Earth observation (EO) satellites follow polar sun-synchronous orbit, i.e. satellite overpasses the same geographic location at the same local solartime, and global coverage is most often achieved within 1–3 days. Satellite remote sensing has proved to be crucial for many climate studies in general and particularly due to its ability to collect information on a multitude of environmental parameters even at the most remote locations where no other scientific infrastructure exists (Yang et al. Citation2013). The SRS needs to be verified against ground-based observations to ensure data quality (e.g. Sporre et al. Citation2016). Russian Far East is an example of a domain that benefits from such EO satellites’ capabilities.
6.3.1. Aerosol particles
SRS has provided data on aerosol properties for decades already (e.g. Sogacheva et al. Citation2018). One of the most commonly retrieved parameters is AOD. AOD data usually serve as proxy to aerosol concentration and have been widely used in studies on air pollution, aerosol-cloud interaction, radiative forcing, and climate change. Several satellite platforms are routinely providing data on AOD. The Moderate Resolution Imaging Spectroradiometer (MODIS) instruments have been operational since year 2000 (Levy et al. Citation2013). Other notable long-time AOD timeseries are provided by Along-Track Scanning Radiometers (ATSR 1995–2012, e.g. de Leeuw et al. Citation2018) and Multi-angle Imaging SpectroRadiometer (MISR, 2000-present, Martonchik et al. Citation1998; Martonchik, Kahn, and Diner Citation2009). The longest time series on AOD retrieved from a family of AVHRR instruments will be available in near future and will cover almost 40 years (Hsu et al. Citation2017).
The Aerosol Index (AI) provides information on the presence of UV-absorbing aerosols, such as volcanic ash, dust, and smoke. Because AI is retrieved using UV-measurements, it can be obtained in partially cloudy conditions (unlike AOD that demands extensive cloud screening), and, therefore, is ideal for monitoring of aerosol plumes originating from volcanic eruptions, dust outbreaks, and biomass burning episodes such as forest fires or generally aerosol effects on clouds (e.g. Liu et al. Citation2017). Several satellite missions provide AI data, including the Global Ozone Monitoring Experiments (GOME and GOME-2, 1995-present, de Graaf and Stammes Citation2005), the Scanning Imaging Absorption Spectrometer for Atmospheric Chartography (SCIAMACHY 2002–2012, e.g. de Graaf et al. Citation2005), and the Ozone Monitoring Instrument (OMI, 2004-present, Torres et al. Citation2007). The recently launched TROPOspheric Monitoring Instrument (TROPOMI) gives high-quality fine resolution AI data in August 2018 (Stein Zweers Citation2016). As a summary, the satellite remote sensing of aerosol concentrations will provide information on the spatial distribution in the Far East region.
6.3.2. Methane and other trace gases
Satellite missions enable estimation of methane emissions on regional and global scales due to the high quality of data (Jacob et al. Citation2016). Atmospheric methane is detectable from space due to its absorption bands in near-infrared (NIR) and thermal infrared (TIR) regions of the spectrum. NIR instruments include SCIAMACHY (Bovensmann et al. Citation1999; Frankenberg et al. Citation2006), the Thermal And Near infrared Sensor for carbon Observation (TANSO-FTS) onboard the Greenhouse gases Observation SATellite (GOSAT and GOSAT-2, 2009–present, Parker et al. Citation2011), and TROPOMI (2018–present, Butz et al. Citation2012). TIR employing instruments include Atmospheric InfraRed Sounder (AIRS, 2002–present, Xiong et al. Citation2008) and Infrared Atmospheric Sounding Interferometer (IASI 2006–present, Xiong et al. Citation2013). The recently launched TROPOMI has already demonstrated to be suitable for characterization of the point sources, such as wetlands, coal mines, landfills, and other localized sources of methane (Hu et al. Citation2018). Several new generation sensors capable of methane detection are planned to be launched in near future by European space agencies. Methane Remote Lidar Mission (MERLIN, Kiemle et al. Citation2011) is an active remote sensing instrument that will operate at 1.65 μm wavelength and observe total column methane concentration even in difficult conditions of night, partial cloud cover, and high latitudes. Carbon Monitoring Satellite (CarbonSat) will have unique capabilities of high spatial resolution (2 × 2 km) as well as good global coverage, providing data on localized strong emissions from both natural and anthropogenic sources (Buchwitz et al. Citation2013).
Spatio-temporal variation of trace gases can be measured from space, allowing for monitoring of emissions from anthropogenic and natural sources, including industrial activity, traffic, volcanic eruptions, and biomass burning (Abad et al. Citation2019). Satellite sensors designed for trace gases measurements detect backscattered solar radiation in UV, visible, NIR, or TIR spectral bands. Exact design and characteristics of retrieved data are defined by scientific mission. Routinely measured trace gases include O3, NO2, OClO, HCHO, SO2, BrO, IO, H2O, CO. SCIAMACHY, GOME and GOME-2 (Munro et al. Citation2006), OMI (Levelt et al. Citation2006), and TROPOMI (Veefkind et al. Citation2012) provide extensively validated datasets on multiple trace gases species.
6.3.3. Forest fires
SRS is an effective tool for monitoring of biomass burning on a global scale on a daily basis as well as for facilitating fires forecasting and burned area estimates. Active forest fires can be detected from space due to the large amount of energy they emit in thermal spectrum. NASA’s MODIS and Visible Infrared Imaging Radiometer Suite (VIIRS) onboard polar orbiters provide data on fires daily. MODIS thermal wavebands are used to detect actively burning areas by comparing measured temperatures with the background values (Giglio, Schroeder, and Justice Citation2016). MODIS routinely detects flaming and smoldering fires of 1000 m2 in size and smaller fires in flaming conditions (e.g. Hally et al. Citation2019). MODIS AOD data and RGB images provide information on smoke plume presence and aerosols transport. VIIRS compliments MODIS active fire data product and enables detection of sub-pixel fires at fine spatial resolution of 375 m (Schroeder et al. Citation2014). Together MODIS and VIIRS feed data to the Fire Information for Resource Management System (FIRMS) that disseminates near real-time information on fire locations (https://earthdata.nasa.gov/earth-observation-data/near-real-time/firms/about-firms).
MODIS Burned Area product (Giglio et al. Citation2018) is a global monthly gridded dataset with 500 m spatial resolution that contains per-pixel burned-area and date of burn information. These observations are available also in the Far East region.
7. Conclusions
The Russian Far East environment is under pressure. The increasing economic activities in Asia, the Road and Belt Initiative, together with the climate change set the requirement and urgency of the comprehensive environmental monitoring. Air quality is highly relevant for the wellbeing of the local societies, for the natural environments and agriculture lands. In a global scale the Russian Far region plays a role in greenhouse and aerosol emissions. Over 10% of all active volcanoes in the World are located in the Far Eastern Russia of which the most active volcanoes are located in Kamchatka. Also, the climate change-driven methane emissions from the thawing permafrost play a significant role in the global climate (de Leeuw et al. Citation2018; Koven et al. Citation2011). The comprehensive in-situ station network and continuous monitoring are needed for the policy making, to make mitigation and adaptation plans and follow up the regional policy actions now. The comprehensive observations based on Stations Measuring Earth surface and Atmospheric Relations (SMEAR) -concept are capable of improving the knowledge on concentrations, fluxes, feedbacks, and interactions between the earth surface and the atmosphere.
The SMEAR concept provides an instrument to set up a suite of state-of-the-art in-situ stations and to carry out comprehensive, continuous, and coordinated measurements to resolve the current status of the environment. Furthermore, the SMEAR concept connects the stations to the global SMEAR network, linked to other international networks like Global Earth Observation System of Systems (GEOSS), Digital Belt and Road Earth (DBAR) Program, and to standardized measurement protocols of greenhouse gases (Integrated Carbon Observation System, ICOS standards, www.icos-ri.eu/), aerosols (European Research Infrastructure for the observation of Aerosol, Clouds and Trace Gases, ACTRIS), (www.actris.eu/) and ecosystem measurements (Long-Term Ecosystem Research, LTER), (www.lter-europe.net/). The advanced stations together with the existing SMEAR station network would enable the analysis of the land- atmosphere feedbacks and interaction over the Northern Eurasian continent. Locating new advanced stations in Russian Far East would fill an observation gap in the Eastern part of the Russia.
A fundamental part of the station infrastructure is education and training of the research and technical staff to make the data analysis and maintenance of the instruments and to connect the analysis to wider context and society impact. The Pan-Eurasian Experiment (PEEX) program provides a network for expertise, research and education for all stations built on the SMEAR concept and a dialog forum interested in the society impact regionally and globally (Kulmala et al. Citation2015; Lappalainen et al. Citation2016). Participation in these activities would be beneficial for the wellbeing of the population in the Russian Far East and for the economic growth of the region.
Acknowledgements
We acknowledge the Pan Eurasian Experiment (PEEX) program which has enabled and facilitated the new collaboration between Pacific Geographical Institute of the Far Eastern Branch of Russian Academy of Sciences, Vladivostok, University of Helsinki, Finnish Meteorological Institute, Tyumen State University, and Lomonosov Moscow State University (LMSU). LMSU was supported by RFBR project 18-05-60219. We also thank Mrs. Alla Borisova, INAR, University of Helsinki for her help in the technical editing. Funding through Academy of Finland (Center of Excellence in Atmospheric Sciences, and through ‘Natural Secreted Nano Vesicles as a Source of Novel Biomass Products for Circular Economy’, NANOBIOMASS, 307537, SA MOSAiC, 333397) is gratefully acknowledged. Additional support was provided by Belmont Forum through the project Arctic Community Resilience to Boreal Environmental change: Assessing Risks from fire and disease (ACRoBEAR) via Academy of Finland, decision number 334792.
Disclosure statement
No potential conflict of interest was reported by the author(s).
Data availability statement
Data used in this paper are available from the authors upon request.
Additional information
Funding
References
- Abad, G. G., A. H. Souri, J. Bak, K. Chance, L. E. Flynn, N. A. Krotkov, L. Lamsal, et al. 2019. “Five Decades Observing Earth’s Atmospheric Trace Gases Using Ultraviolet and Visible Backscatter Solar Radiation from Space.” Journal of Quantitative Spectroscopy & Radiative Transfer 238. doi:10.1016/j.jqsrt.2019.04.030.
- Apte, J. S., J. D. Marshall, A. J. Cohen, and M. Brauer. 2015. “Addressing Global Mortality from Ambient PM2.5.” Environmental Science & Technology 49 (13): 8057–8066. doi:10.1021/acs.est.5b01236.
- Arneth, A., S. P. Harrison, S. Zaehle, K. Tsigaridis, S. Menon, P. J. Bartlein, J. Feichter, et al. 2010. “Terrestrial Biogeochemical Feedbacks in the Climate System.” Nature Geoscience 3 (8): 525–532. doi:10.1038/ngeo905.
- Baklanov, P. YA., ed. 2012. The Pacific Russia: The Pages of Past, Present, and Future. Vladivostok: Dal’nauka.
- Baklanov, P. Ya., V. P. Karakin, and A. S. Sheingauz. 2005. “Nature Use of the Russian Far East and Adjacent Territories.” Spatial Economics=Prostranstvennaya Ekonomika 1: 27–45. doi:10.14530/se.2005.1.027-04.
- Bazhenov, O. E., V. D. Burlakov, S. I. Dolgii, and A. V. Nevzorov. 2012. “Lidar Observations of Aerosol Disturbances of the Stratosphere Over Tomsk (56.5° N;85.0° E) in Volcanic Activity Period 2006–2011.” International Journal of Optics 2012: 1–10. doi:10.1155/2012/786295.
- Bovensmann, H., J. P. Burrows, M. Buchwitz, J. Frerick, S. Nöel, V. V. Rozanov, K. V. Chance, and A. P. H. Goede. 1999. “SCIAMACHY: Mission Objectives and Measurement Modes.” Journal of the Atmospheric Sciences 56 (2): 127–150. doi:10.1175/1520-0469(1999)056<0127:Smoamm>2.0.Co;2.
- Buchwitz, M., M. Reuter, H. Bovensmann, D. Pillai, J. Heymann, O. Schneising, V. Rozanov, et al. 2013. “Carbon Monitoring Satellite (CarbonSat): Assessment of Atmospheric CO2 and CH4 Retrieval Errors by Error Parameterization.” Atmospheric Measurement Techniques 6 (12): 3477–3500. doi:10.5194/amt-6-3477-2013.
- Butz, A., A. Galli, O. Hasekamp, J. Landgraf, P. Tol, and I. Aben. 2012. “TROPOMI Aboard Sentinel-5 Precursor: Prospective Performance of CH4 Retrievals for Aerosol and Cirrus Loaded Atmospheres.” Remote Sensing of Environment 120: 267–276. doi:10.1016/j.rse.2011.05.030.
- Carn, S. A., V. E. Fioletov, C. A. McLinden, C. Li, and N. A. Krotkov. 2017. “A Decade of Global Volcanic SO2 Emissions Measured from Space.” Scientific Reports 7. doi:10.1038/srep44095.
- China Statistical Yearbook. 2004–2016, editions. Beijing: China Statistics Press. https://aviales.ru/popup.aspx?news=4266.
- de Graaf, M., and P. Stammes. 2005. “SCIAMACHY Absorbing Aerosol Index – Calibration Issues and Global Results from 2002–2004.” Atmospheric Chemistry and Physics 5: 2385–2394. doi:10.5194/acp-5-2385-2005.
- de Graaf, M., P. Stammes, O. Torres, and R. B. A. Koelemeijer. 2005. “Absorbing Aerosol Index: Sensitivity Analysis, Application to GOME and Comparison with TOMS.” Journal of Geophysical Research-Atmospheres 110 (D1). doi:10.1029/2004jd005178.
- de Leeuw, G., L. Sogacheva, E. Rodriguez, K. Kourtidis, A. K. Georgoulias, G. Alexandri, V. Amiridis, et al. 2018. “Two Decades of Satellite Observations of AOD Over Mainland China Using ATSR-2, AATSR and MODIS/Terra: Data Set Evaluation and Large-Scale Patterns.” Atmospheric Chemistry and Physics 18 (3): 1573–1592. doi:10.5194/acp-18-1573-2018.
- Ding, A. J., C. B. Fu, X. Q. Yang, J. N. Sun, T. Petäjä, V. M. Kerminen, T. Wang, et al. 2013. “Intense Atmospheric Pollution Modifies Weather: A Case of Mixed Biomass Burning with Fossil Fuel Combustion Pollution in Eastern China.” Atmospheric Chemistry and Physics 13 (20): 10545–10554. doi:10.5194/acp-13-10545-2013.
- Ding, A. J., W. Nie, X. Huang, X. G. Chi, J. N. Sun, V. M. Kerminen, Z. Xu, et al. 2016. “Long-Term Observation of Air Pollution-Weather/Climate Interactions at the SORPES Station: A Review and Outlook.” Frontiers of Environmental Science & Engineering 10 (5). doi:10.1007/s11783-016-0877-3.
- Ehn, M., J. A. Thornton, E. Kleist, M. Sipilä, H. Junninen, I. Pullinen, M. Springer, et al. 2014. “A Large Source of Low-Volatility Secondary Organic Aerosol.” Nature 506 (7489): 476–479. doi:10.1038/nature13032.
- Environmental protection in Russia. Russian Statistical Yearbook. 2001. Moscow: Rosstat.
- Environmental protection in Russia. Russian Statistical Yearbook. 2006. Moscow: Rosstat.
- Environmental protection in Russia. Russian Statistical Yearbook. 2010. Moscow: Rosstat.
- Environmental protection in Russia. Russian Statistical Yearbook. 2016. Moscow: Rosstat.
- Far Eastern Federal District in 2010, Statistical survey. 2011. Khabarovsk: Khabarovskstat.
- The Far East of Russia (the position of Primorsky Krai in comparison with other subjects of the Far Eastern Federal District). 2015. Stat. book, Primorskstat.
- Flower, V. J. B., and R. A. Kahn. 2017. “Assessing the Altitude and Dispersion of Volcanic Plumes Using MISR Multi-Angle Imaging from Space: Sixteen Years of Volcanic Activity in the Kamchatka Peninsula, Russia.” Journal of Volcanology and Geothermal Research 337: 1–15. doi:10.1016/j.jvolgeores.2017.03.010.
- “Forest fire situation in Russia as of 00:00 Moscow time 07.11.2017. Federal Forestry Agency”. 2008. https://aviales.ru/popup.aspx?news=4266.
- Forest Sector of the Russian Far East: An Analytical Survey. 2008. 2nd Edition, Revised and Supplemented ed. Khabarovsk: RIOTIP.
- Frankenberg, C., J. F. Meirink, P. Bergamaschi, A. P. H. Goede, M. Heimann, S. Körner, U. Platt, M. van Weele, and T. Wagner. 2006. “Satellite Chartography of Atmospheric Methane from SCIAMACHY on Board ENVISAT: Analysis of the Years 2003 and 2004.” Journal of Geophysical Research-Atmospheres 111: D7. doi:10.1029/2005jd006235.
- Ganzei, S. S. 2005. Transboundary Geo-Systems in the South of the Russian Far East and in Northeast China. Vladivostok: Dal’nauka.
- Giglio, L., L. Boschetti, D. P. Roy, M. L. Humber, and C. O. Justice. 2018. “The Collection 6 MODIS Burned Area Mapping Algorithm and Product.” Remote Sensing of Environment 217: 72–85. doi:10.1016/j.rse.2018.08.005.
- Giglio, L., W. Schroeder, and C. O. Justice. 2016. “The Collection 6 MODIS Active Fire Detection Algorithm and Fire Products.” Remote Sensing of Environment 178: 31–41. doi:10.1016/j.rse.2016.02.054.
- Girina, O. A., E. A. Loupian, A. A. Sorokin, D. V. Mel’nikov, A. G. Manevich, and T. M. Manevich. 2018. “Satellite and Ground-Based Observations of Explosive Eruptions on Zhupanovsky Volcano, Kamchatka, Russia in 2013 and in 2014–2016.” Journal of Volcanology and Seismology 12 (1): 1–15. doi:10.1134/S0742046318010049.
- Gresov, A., A. Obzhirov, A. Yatsuk, A. Mazurov, and A. Ruban. 2017. “Gas Content of Bottom Sediments and Geochemical Indicators of Oil and Gas on the Shelf of the East Siberian Sea.” Russian Journal of Pacific Geology 11 (4): 308–314. doi:10.1134/S1819714017040030.
- Gushchenko, I. I. 1983. “Patterns of Distribution of Volcanic Activity Centers Around the Globe.” Volcanology and Seismology 6: 10–29.
- Hally, B., L. Wallace, K. Reinke, S. Jones, and A. Skidmore. 2019. “Advances in Active Fire Detection Using a Multi-Temporal Method for Next-Generation Geostationary Satellite Data.” International Journal of Digital Earth 12 (9): 1030–1045. doi:10.1080/17538947.2018.1497099.
- Hansen, M. C., P. V. Potapov, R. Moore, M. Hancher, S. A. Turubanova, A. Tyukavina, D. Thau, et al. 2013. “High-Resolution Global Maps of 21st-Century Forest Cover Change.” Science 342 (6160): 850–853. doi:10.1126/science.1244693.
- Hari, P., and M. Kulmala. 2005. “Station for Measuring Ecosystem-Atmosphere Relations (SMEAR II).” Boreal Environment Research 10: 315–322.
- Hari, P., T. Petaja, J. Back, V. M. Kerminen, H. K. Lappalainen, T. Vihma, T. Laurila, Y. Viisanen, T. Vesala, and M. Kulmala. 2016. “Conceptual Design of a Measurement Network of the Global Change.” Atmospheric Chemistry and Physics 16 (2): 1017–1028. doi:10.5194/acp-16-1017-2016.
- Hirsikko, A., E. J. O’Connor, M. Komppula, K. Korhonen, A. Pfüller, E. Giannakaki, C. R. Wood, et al. 2014. “Observing Wind, Aerosol Particles, Cloud and Precipitation: Finland’s New Ground-Based Remote-Sensing Network.” Atmospheric Measurement Techniques 7 (5): 1351–1375. doi:10.5194/amt-7-1351-2014.
- Hsu, N. C., J. Lee, A. M. Sayer, N. Carletta, S. H. Chen, C. J. Tucker, B. N. Holben, and S. C. Tsay. 2017. “Retrieving Near-Global Aerosol Loading Over Land and Ocean from AVHRR.” Journal of Geophysical Research-Atmospheres 122 (18): 9968–9989. doi:10.1002/2017jd026932.
- Hu, Y. Q., E. G. Christensen, H. M. F. Amin, T. E. L. Smith, and G. Rein. 2019. “Experimental Study of Moisture Content Effects on the Transient Gas and Particle Emissions from Peat Fires.” Combustion and Flame 209: 408–417. doi:10.1016/j.combustflame.2019.07.046.
- Hu, Y. Q., E. Christensen, F. Restuccia, and G. Rein. 2019. “Transient Gas and Particle Emissions from Smouldering Combustion of Peat.” Proceedings of the Combustion Institute 37 (3): 4035–4042. doi:10.1016/j.proci.2018.06.008.
- Hu, H., J. Landgraf, R. Detmers, T. Borsdorff, J. A. de Brugh, I. Aben, A. Butz, and O. Hasekamp. 2018. “Toward Global Mapping of Methane With TROPOMI: First Results and Intersatellite Comparison to GOSAT.” Geophysical Research Letters 45 (8): 3682–3689. doi:10.1002/2018gl077259.
- IPCC. 2013. “Summary for Policymakers. Climate Change: The Physical Science Basis of Working Group I Contribution to the Fifth Assessment Report of the Intergovernmental Panel on Climate Change.” Edited by T. F. Stocker, D. Qin, G.-K. Plattner, M. Tignor, S. K. Allen, J. Boschung, A. Nauels, Y. Xia, V. Bex, and P. M. Midgley. Cambridge: Cambridge University Press.
- Isachenko, A. G. 1985. Landscapes of the USSR. Leningrad: Leningrad State University.
- Jacob, D. J., A. J. Turner, J. D. Maasakkers, J. X. Sheng, K. Sun, X. Liu, K. Chance, I. Aben, J. McKeever, and C. Frankenberg. 2016. “Satellite Observations of Atmospheric Methane and Their Value for Quantifying Methane Emissions.” Atmospheric Chemistry and Physics 16 (22): 14371–14396. doi:10.5194/acp-16-14371-2016.
- Janhäll, S., M. O. Andreae, and U. Pöschl. 2010. “Biomass Burning Aerosol Emissions from Vegetation Fires: Particle Number and Mass Emission Factors and Size Distributions.” Atmospheric Chemistry and Physics 10 (3): 1427–1439. doi:10.5194/acp-10-1427-2010.
- Jones, V. J., N. L. Rose, A. E. Self, N. Solovieva, and H. Yang. 2015. “Evidence of Global Pollution and Recent Environmental Change in Kamchatka, Russia.” Global and Planetary Change 134: 82–90. doi:10.1016/j.gloplacha.2015.02.005.
- Jones, V. J., and O. Solomina. 2015. “The Geography of Kamchatka.” Global and Planetary Change 134: 3–9. doi:10.1016/j.gloplacha.2015.06.003.
- Kalacheva, E., Y. Taran, T. Kotenko, K. Hattori, L. Kotenko, and G. Solis-Pichardo. 2016. “Volcano-Hydrothermal System of Ebeko Volcano, Paramushir, Kuril Islands: Geochemistry and Solute Fluxes of Magmatic Chlorine and Sulfur.” Journal of Volcanology and Geothermal Research 310: 118–131. doi:10.1016/j.jvolgeores.2015.11.006.
- Karthe, D., I. Abdullaev, B. Boldgiv, D. Borchardt, S. Chalov, J. Jarsjö, L. H. Li, and J. A. Nittrouer. 2017. “Water in Central Asia: An Integrated Assessment for Science-Based Management.” Environmental Earth Sciences 76: 20. doi:10.1007/s12665-017-6994-x.
- Kerminen, V. M., X. M. Chen, V. Vakkari, T. Petäjä, M. Kulmala, and F. Bianchi. 2018. “Atmospheric new Particle Formation and Growth: Review of Field Observations.” Environmental Research Letters 13: 10. doi:10.1088/1748-9326/aadf3c.
- Kiemle, C., M. Quatrevalet, G. Ehret, A. Amediek, A. Fix, and M. Wirth. 2011. “Sensitivity Studies for a Space-Based Methane Lidar Mission.” Atmospheric Measurement Techniques 4 (10): 2195–2211. doi:10.5194/amt-4-2195-2011.
- Kogan, R. M. 2013. “Fire Emission of Pollutants in the South of the Russian Far East.” Regional Problems 16 (1): 72–78.
- Kolomyts, E. G. 2016. Pacific Ocean Mega Ecotone of Northern Eurasia. Part II: Ecology of Insular Volcanic Landscape. Raleigh, North Carolina, USA: Lulu Press.
- Kondrat’ev, I. I. 2014. Transboundary Atmospheric Transport of Aerosol and Acid Precipitation to the Far East of Russia. Vladivostok: Dal’nauka.
- Kondrat’ev, I. I., B. V. Kubai, G. I. Semykina, and A. N. Kachur. 2013. “Impact of Transboundary and Natural Factors on Chemical Composition of Precipitation in the Far East of Russia.” Russian Meteorology and Hydrology 38 (10): 681–687. doi:10.3103/S1068373913100051.
- Kondrat’ev, I. I., D. E. Mukha, A. G. Boldeskul, S. G. Yurchenko, and T. N. Lutsenko. 2017. “Chemical Composition of Precipitation and Snow Cover in the Primorsky Krai.” Russian Meteorology and Hydrology 42 (1): 64–70. doi:10.3103/S1068373917010083.
- Kotenko, T. A. 2008. “Some Features of Ecology City Severo-Kurilsk During Amplification of Fumaroles Activity (Paramushir Isl., Kuril Islands) from January 2005.” Bulletin of Kamchatka Regional Association “Educational-Scientific Center”. Earth Sciences 1: 82–88.
- Koven, C. D., B. Ringeval, P. Friedlingstein, P. Ciais, P. Cadule, D. Khvorostyanov, G. Krinner, and C. Tarnocai. 2011. “Permafrost Carbon-Climate Feedbacks Accelerate Global Warming.” Proceedings of the National Academy of Sciences of the United States of America 108 (36): 14769–14774. doi:10.1073/pnas.1103910108.
- Kuksina, L. V., and N. I. Alekseevskii. 2018. “Sediment Yield of Kamchatka Krai Rivers Into the Pacific Ocean and the Seas of Bering and Okhotsk.” Water Resources 45 (4): 479–489. doi:10.1134/S0097807818040140.
- Kulmala, M. 2015. “Atmospheric Chemistry: China’s Choking Cocktail.” Nature 526: 497–499. doi:10.1038/526497a.
- Kulmala, M. 2018. “Build a Global Earth Observatory.” Nature 553 (7686): 21–23. doi:10.1038/d41586-017-08967-y.
- Kulmala, M., V. M. Kerminen, T. Petäjä, A. J. Ding, and L. Wang. 2017. “Atmospheric Gas-to-Particle Conversion: Why NPF Events are Observed in Megacities?” Faraday Discussions 200: 271–288. doi:10.1039/c6fd00257a.
- Kulmala, M., J. Kontkanen, H. Junninen, K. Lehtipalo, H. E. Manninen, T. Nieminen, T. Petäjä, et al. 2013. “Direct Observations of Atmospheric Aerosol Nucleation.” Science 339 (6122): 943–946. doi:10.1126/science.1227385.
- Kulmala, M., H. K. Lappalainen, T. Petäjä, T. Kurten, V. M. Kerminen, Y. Viisanen, P. Hari, et al. 2015. “Introduction: The Pan-Eurasian Experiment (PEEX) – Multidisciplinary, Multiscale and Multicomponent Research and Capacity-Building Initiative.” Atmospheric Chemistry and Physics 15 (22): 13085–13096. doi:10.5194/acp-15-13085-2015.
- Kulmala, M., K. Luoma, A. Virkkula, T. Petäjä, P. Paasonen, V. M. Kerminen, W. Nie, et al. 2016a. “On the Mode-Segregated Aerosol Particle Number Concentration Load: Contributions of Primary and Secondary Particles in Hyytiala and Nanjing.” Boreal Environment Research 21 (3-4): 319–331.
- Kulmala, M., T. Nieminen, A. Nikandrova, K. Lehtipalo, H. E. Manninen, M. K. Kajos, P. Kolari, et al. 2014. “CO2-Induced Terrestrial Climate Feedback Mechanism: From Carbon Sink to Aerosol Source and Back.” Boreal Environment Research 19: 122–131.
- Kulmala, M., T. Petäjä, V. M. Kerminen, J. Kujansuu, T. Ruuskanen, A. J. Ding, W. Nie, et al. 2016b. “On Secondary New Particle Formation in China (vol 10, 08, 2016).” Frontiers of Environmental Science & Engineering 10: 5. doi:10.1007/s11783-016-0857-7.
- Kulmala, M., T. Suni, K. E. J. Lehtinen, M. Dal Maso, M. Boy, A. Reissell, U. Rannik, et al. 2004. “A New Feedback Mechanism Linking Forests, Aerosols, and Climate.” Atmospheric Chemistry and Physics 4: 557–562. doi:10.5194/acp-4-557-2004.
- Lappalainen, H. K., N. Altimir, V. Kerminen, T. Petäjä, R. Makkonen, P. Alekseychik, N. Zaitseva, et al. 2018a. “Pan-Eurasian Experiment (Peex) Program: An Overview of the First 5 Years in Operation and Future Prospects.” Geography, Environment and Sustainability 11 (1): 6–19. doi:10.24057/2071-9388-2018-11-1-6-19.
- Lappalainen, H. K., V. M. Kerminen, T. Petäjä, T. Kurten, A. Baklanov, A. Shvidenko, J. Bäck, et al. 2016. “Pan-Eurasian Experiment (PEEX): Towards a Holistic Understanding of the Feedbacks and Interactions in the Land-Atmosphere-Ocean-Society Continuum in the Northern Eurasian Region.” Atmospheric Chemistry and Physics 16 (22): 14421–14461. doi:10.5194/acp-16-14421-2016.
- Lappalainen, H. K., M. Kulmala, J. Kujansuu, T. Petäjä, A. Mahura, G. de Leeuw, S. Zilitinkevich, et al. 2018b. “The Silk Road Agenda of the Pan-Eurasian Experiment (PEEX) Program.” Big Earth Data 2 (1): 8–35. doi:10.1080/20964471.2018.1437704.
- Lappalainen, H. K., M. Kulmala, and S. S. Zilitinkevich. 2015. Pan Eurasian Experiment (PEEX) Science Plan. Helsinki.
- Lelieveld, J., J. S. Evans, M. Fnais, D. Giannadaki, and A. Pozzer. 2015. “The Contribution of Outdoor air Pollution Sources to Premature Mortality on a Global Scale.” Nature 525 (7569): 367. doi:10.1038/nature15371.
- Levelt, P. F., G. H. J. van den Oord, M. R. Dobber, A. Mälkki, Huib Visser, Johan de Vries, P. Stammes, J. O. V. Lundell, and H. Saari. 2006. “The Ozone Monitoring Instrument.” IEEE Transactions on Geoscience and Remote Sensing 44 (5): 1093–1101. doi:10.1109/TGRS.2006.872333.
- Levy, R. C., S. Mattoo, L. A. Munchak, L. A. Remer, A. M. Sayer, F. Patadia, and N. C. Hsu. 2013. “The Collection 6 MODIS Aerosol Products Over Land and Ocean.” Atmospheric Measurement Techniques 6 (11): 2989–3034. doi:10.5194/amt-6-2989-2013.
- Liu, Y. Q., G. de Leeuw, V. M. Kerminen, J. H. Zhang, P. T. Zhou, W. Nie, X. M. Qi, et al. 2017. “Analysis of Aerosol Effects on Warm Clouds Over the Yangtze River Delta from Multi-Sensor Satellite Observations.” Atmospheric Chemistry and Physics 17 (9): 5623–5641. doi:10.5194/acp-17-5623-2017.
- Liu, J. G., and J. Diamond. 2005. “China’s Environment in a Globalizing World.” Nature 435 (7046): 1179–1186. doi:10.1038/4351179a.
- Lychagin, M., S. Chalov, N. Kasimov, G. Shinkareva, J. Jarsjo, and J. Thorslund. 2017. “Surface Water Pathways and Fluxes of Metals Under Changing Environmental Conditions and Human Interventions in the Selenga River System.” Environmental Earth Sciences 76 (1). doi:10.1007/s12665-016-6304-z.
- Main indicators of environmental protection. Russian Statistical Yearbook. 2011. Moscow: Federal State Statistics Service.
- Maji, K. J., W. F. Ye, M. Arora, and S. M. S. Nagendra. 2018. “PM2.5-Related Health and Economic Loss Assessment for 338 Chinese Cities.” Environment International 121: 392–403. doi:10.1016/j.envint.2018.09.024.
- Malik, N. A. 2010. “Impact Contribution of Volcanic Eruption to the Formation of Chemical Composition of Seasonal Snow Cover (Kamchatka).” Ice and Snow 4: 45–52.
- Malik, N. A. 2011. “The December 24, 2006 Eruption of Bezymyannyi Volcano, Kamchatka.” Journal of Volcanology and Seismology 5 (4): 268–277. doi:10.1134/S0742046311040051.
- Markhinin, E. K. 1985. Volcanism. Moscow: Nedra.
- Martonchik, J. V., D. J. Diner, R. A. Kahn, T. P. Ackerman, M. M. Verstraete, B. Pinty, and H. R. Gordon. 1998. “Techniques for the Retrieval of Aerosol Properties Over Land and Ocean Using Multiangle Imaging.” IEEE Transactions on Geoscience and Remote Sensing 36 (4): 1212–1227. doi:10.1109/36.701027.
- Martonchik, J. V., R. A. Kahn, and D. J. Diner. 2009. “Retrieval of Aerosol Properties Over Land Using MISR Observations.” In Satellite Aerosol Remote Sensing Over Land, edited by Alexander A. Kokhanovsky and Gerrit de Leeuw, 267–293. Berlin, Heidelberg: Springer Berlin Heidelberg.
- Mills, M. J., A. Schmidt, R. Easter, S. Solomon, D. E. Kinnison, S. J. Ghan, R. R. Neely, et al. 2016. “Global Volcanic Aerosol Properties Derived from Emissions, 1990-2014, Using CESM1(WACCM).” Journal of Geophysical Research-Atmospheres 121 (5): 2332–2348. doi:10.1002/2015jd024290.
- Minami, H., K. Tatsumi, A. Hachikubo, S. Yamashita, H. Sakagami, N. Takahashi, H. Shoji, et al. 2012. “Possible Variation in Methane Flux Caused by gas Hydrate Formation on the Northeastern Continental Slope off Sakhalin Island, Russia.” Geo-Marine Letters 32 (5–6): 525–534. doi:10.1007/s00367-012-0287-x.
- Mishukova, G. I., and R. B. Shakirov. 2017. “Spatial Variations of Methane Distribution in Marine Environment and its Fluxes at the Water-Atmosphere Interface in the Western Sea of Okhotsk.” Water Resources 44 (4): 662–672. doi:10.1134/S0097807817040133.
- Munro, Rosemary, M. Eisinger, C. Anderson, J. Callies, E. Corpaccioli, R. Lang, A. Lefebvre, Jakob Livschitz, and A. P. Albinana. 2006. “GOME-2 on MetOp.” Proc. of the 2006 EUMETSAT meteorological satellite Conference.
- Murray, M., and Arctic Observing Summit Committee Members. 2020. “Arctic Observing Summit 2020: Conference Statement and Call to Action.” ARCTIC 73 (2): 273–275. 10.14430/arctic70689.
- Natural Resources Use of the Russian Far East and Northeast Asia: Potential of Integration and Sustainable Development. 2005. Edited by A. S. Sheingauz. Vladivostok, Khabarovsk: FEB RAS.
- Overland, J., E. Dunlea, J. E. Box, R. Corell, M. Forsius, V. Kattsov, M. Skovgård Olsen, J. Pawlak, L.-O. Reiersen, and M. Wanga. 2019. “The Urgency of Arctic Change.” Polar Science 21: 6–13.
- Paasonen, P., A. Asmi, T. Petäjä, M. K. Kajos, M. Äijälä, H. Junninen, T. Holst, et al. 2013. “Warming-induced Increase in Aerosol Number Concentration Likely to Moderate Climate Change.” Nature Geoscience 6 (6): 438–442. doi:10.1038/Ngeo1800.
- Parker, R., H. Boesch, A. Cogan, A. Fraser, L. Feng, P. I. Palmer, J. Messerschmidt, et al. 2011. “Methane Observations from the Greenhouse Gases Observing SATellite: Comparison to Ground-Based TCCON Data and Model Calculations.” Geophysical Research Letters 38 (15). doi:10.1029/2011gl047871.
- Petäjä, T., G. de Leeuw, H. K. Lappalainen, D. Moisseev, E. O’Connor, V. Bondur, N. Kasimov, et al. 2014. “Connecting Ground Based in-Situ Observations, Ground-Based Remote Sensing and Satellite Data Within the Pan Eurasian Experiment (PEEX) Program.” Paper presented at the Remote Sensing of Clouds and the Atmosphere XIX; and Optics in Atmospheric Propagation and Adaptive Systems XVII, 10 October.
- Petäjä, T., E.-M. Duplissy, K. Tabakova, J. Schmale, B. Altstädter, G. Ancellet, M. Arshinov, et al. 2020. “Integrative and Comprehensive Understanding on Polar Environments (iCUPE): The Concept and Initial Results.” Atmospheric Chemistry and Physics Discussions. doi: 10.5194/acp-2019-1217
- Petäjä, T., L. Järvi, V. M. Kerminen, A. J. Ding, J. N. Sun, W. Nie, J. Kujansuu, et al. 2016. “Enhanced Air Pollution via Aerosol-Boundary Layer Feedback in China.” Scientific Reports 6. doi: 10.1038/srep18998.
- Petäjä, T., L. Laakso, T. Grönholm, S. Launiainen, I. Evele-Peltoniemi, A. Virkkula, A. Leskinen, et al. 2012. “In-Situ Observations of Eyjafjallajokull Ash Particles by Hot-Air Balloon.” Atmospheric Environment 48: 104–112. doi:10.1016/j.atmosenv.2011.08.046.
- Petäjä, T., E. J. O’Connor, D. Moisseev, V. A. Sinclair, A. J. Manninen, R. Väänänen, A. von Lerber, et al. 2016. “BAECC: A Field Campaign to Elucidate the Impact of Biogenic Aerosols on Clouds and Climate.” Bulletin of the American Meteorological Society 97 (10): 1909–1928. doi:10.1175/Bams-D-14-00199.1.
- Räisänen, J. 2001. “CO2-induced Climate Change in CMIP2 Experiments: Quantification of Agreement and Role of Internal Variability.” Journal of Climate 14 (9): 2088–2104. doi:10.1175/1520-0442(2001)014<2088:Ciccic>2.0.Co;2.
- Regions of Russia. Socio-economic indicators. 2008. Russian Statistical Yearbook. Moscow: Rosstat.
- Rybin, A., M. Chibisova, P. Webley, T. Steensen, P. Izbekov, C. Neal, and V. Realmuto. 2011. “Satellite and Ground Observations of the June 2009 Eruption of Sarychev Peak Volcano, Matua Island, Central Kuriles.” Bulletin of Volcanology 73 (9): 1377–1392. doi:10.1007/s00445-011-0481-0.
- Rybin, A. V., N. G. Razzhigaeva, K. S. Ganzei, et al. 2010. Eruption of Sarychev Peak Volcano in 2009. Moscow: Yanus-K.
- “Sarychev Eruption Generates Large Cloud of Sulfur Dioxide”. 2018. “ NASA Earth Observatory.” https://earthobservatory.nasa.gov/IOTD/view.php?id=38975.
- Schaefer, K., T. J. Zhang, L. Bruhwiler, and A. P. Barrett. 2011. “Amount and Timing of Permafrost Carbon Release in Response to Climate Warming.” Tellus Series B-Chemical and Physical Meteorology 63 (2): 165–180. doi:10.1111/j.1600-0889.2011.00527.x.
- Schroeder, W., P. Oliva, L. Giglio, and I. A. Csiszar. 2014. “The New VIIRS 375 m Active Fire Detection Data Product: Algorithm Description and Initial Assessment.” Remote Sensing of Environment 143: 85–96. doi:10.1016/j.rse.2013.12.008.
- Scott, C. E., S. R. Arnold, S. A. Monks, A. Asmi, P. Paasonen, and D. V. Spracklen. 2018. “Substantial Large-Scale Feedbacks Between Natural Aerosols and Climate.” Nature Geoscience 11 (1): 44. doi:10.1038/s41561-017-0020-5.
- Senyukov, S. L. 2013. “Monitoring and Prediction of Volcanic Activity in Kamchatka from Seismological Data: 2000-2010.” Journal of Volcanology and Seismology 7 (1): 86–97. doi:10.1134/S0742046313010077.
- Sgubin, G., D. Swingedouw, S. Drijfhout, Y. Mary, and A. Bennabi. 2018. “Abrupt Cooling Over the North Atlantic in Modern Climate Models (vol 8, 14375, 2017).” Nature Communications 9. doi:10.1038/ncomms16222.
- Shakirov, R. B., A. I. Obzhirov, A. S. Salomatin, and M. M. Makarov. 2017. “New Data on Lineament Control of Modern Centers of Methane Degassing in East Asian Seas.” Doklady Earth Sciences 477 (1): 1287–1290. doi:10.1134/S1028334x17110241.
- Shlotgauer, S. D., and M. V. Kryukova. 2008. “The Effect of the Pyrogenic Factor on the State of the Vegetation Cover in the Amur River Basin.” Vestnik FEB RAS 1: 59–68.
- Shrivastava, M., C. D. Cappa, J. W. Fan, A. H. Goldstein, A. B. Guenther, J. L. Jimenez, C. Kuang, et al. 2017. “Recent Advances in Understanding Secondary Organic Aerosol: Implications for Global Climate Forcing.” Reviews of Geophysics 55 (2): 509–559. doi:10.1002/2016rg000540.
- Shu, L., M. Wang, X. Tian, and F. Zhao. 2006. “Forest Fire Situation and Management in Northeast China.” International Forest Fire News 34: 78–84.
- Sidorkina, Z. I. 1997. Demographic Processes and Demographic Policy in the Russian Far East. Vladivostok: Dal’nauka.
- Smith, L. C. 2010. The new North, Our World in 2050. New York: Dutton.
- Sochava, V. B. 1962. “The Experience of Dividing the Far East Into Physico-Geographical Regions and Provinces.” Doklady of Institute of Geography of Siberia and Far East 1: 23–33.
- Sogacheva, L., G. de Leeuw, E. Rodriguez, P. Kolmonen, A. K. Georgoulias, G. Alexandri, K. Kourtidis, et al. 2018. “Spatial and Seasonal Variations of Aerosols Over China from Two Decades of Multi-Satellite Observations – Part 1: ATSR (1995-2011) and MODIS C6.1 (2000-2017).” Atmospheric Chemistry and Physics 18 (15): 11389–11407. doi:10.5194/acp-18-11389-2018.
- Sokolova, G. V., R. M. Kogan, and V. A. Glagolev. 2009. Fire Danger of the Middle Amur River Area: Assessment, Forecast, Monitoring Parameters. Khabarovsk: FEB RAS.
- Sporre, M. K., E. J. O’Connor, N. Håkansson, A. Thoss, E. Swietlicki, and T. Petäjä. 2016. “Comparison of MODIS and VIIRS Cloud Properties with ARM Ground-Based Observations Over Finland.” Atmospheric Measurement Techniques 9 (7): 3193–3203. doi:10.5194/amt-9-3193-2016.
- Stein, A. F., R. R. Draxler, G. D. Rolph, B. J. B. Stunder, M. D. Cohen, and F. Ngan. 2015. “Noaa’s Hysplit Atmospheric Transport and Dispersion Modeling System.” Bulletin of the American Meteorological Society 96 (12): 2059–2077. doi:10.1175/Bams-D-14-00110.1.
- Stein Zweers, D. 2016. “TROPOMI ATBD of the UV Aerosol Index, Issue 1.1.” www.tropomi.eu/data-products/level-2-products.
- Taran, Y., M. Zelenski, I. Chaplygin, N. Malik, R. Campion, S. Inguaggiat, B. Pokrovsky, et al. 2018. “Gas Emissions From Volcanoes of the Kuril Island Arc (NW Pacific): Geochemistry and Fluxes.” Geochemistry Geophysics Geosystems 19 (6): 1859–1880. doi:10.1029/2018gc007477.
- Torres, O., A. Tanskanen, B. Veihelmann, C. Ahn, R. Braak, P. K. Bhartia, P. Veefkind, and P. Levelt. 2007. “Aerosols and Surface UV Products from Ozone Monitoring Instrument Observations: An Overview.” Journal of Geophysical Research-Atmospheres 112 (D24). doi:10.1029/2007jd008809.
- Tröstl, J., W. K. Chuang, H. Gordon, M. Heinritzi, C. Yan, U. Molteni, L. Ahlm, et al. 2016. “The Role of Low-Volatility Organic Compounds in Initial Particle Growth in the Atmosphere.” Nature 533 (7604): 527–531. doi:10.1038/nature18271.
- Uttal, T., S. Starkweather, J. R. Drummond, T. Vihma, A. P. Makshtas, L. S. Darby, J. F. Burkhart, et al. 2016. “International Arctic Systems for Observing the Atmosphere: An International Polar Year Legacy Consortium.” Bulletin of American Meteorological Society 97: 1033–1056. doi:10.1175/Bams-D-14-00145.1.
- Veefkind, J. P., I. Aben, K. McMullan, H. Förster, J. de Vries, G. Otter, J. Claas, et al. 2012. “TROPOMI on the ESA Sentinel-5 Precursor: A GMES Mission for Global Observations of the Atmospheric Composition for Climate, Air Quality and Ozone Layer Applications.” Remote Sensing of Environment 120: 70–83. doi:10.1016/j.rse.2011.09.027.
- Vihma, T., P. Uotila, S. Sandven, D. Pozdnyakov, A. Makshtas, A. Pelyasov, R. Pirazzini, et al. 2019. “Towards an Advanced Observation System for the Marine Arctic in the Framework of the Pan-Eurasian Experiment (PEEX).” Atmospheric Chemistry and Physics 19 (3): 1941–1970. doi:10.5194/acp-19-1941-2019.
- Virkkula, A., J. Levula, T. Pohja, P. P. Aalto, P. Keronen, S. Schobesberger, C. B. Clements, et al. 2014. “Prescribed Burning of Logging Slash in the Boreal Forest of Finland: Emissions and Effects on Meteorological Quantities and Soil Properties.” Atmospheric Chemistry and Physics 14 (9): 4473–4502. doi:10.5194/acp-14-4473-2014.
- Wang, Y. H., M. Yu, Y. S. Wang, G. Q. Tang, T. Song, P. T. Zhou, Z. R. Liu, et al. 2020. “Rapid Formation of Intense Haze Episodes via Aerosol-Boundary Layer Feedback in Beijing.” Atmospheric Chemistry and Physics 20 (1): 45–53. doi:10.5194/acp-20-45-2020.
- Xiong, X., C. Barnet, E. S. Maddy, A. Gambacorta, T. S. King, and S. C. Wofsy. 2013. “Mid-upper Tropospheric Methane Retrieval from IASI and Its Validation.” Atmospheric Measurement Techniques 6 (9): 2255–2265. doi:10.5194/amt-6-2255-2013.
- Xiong, X. Z., C. Barnet, E. Maddy, C. Sweeney, X. P. Liu, L. H. Zhou, and M. Goldberg. 2008. “Characterization and Validation of Methane Products from the Atmospheric Infrared Sounder (AIRS).” Journal of Geophysical Research-Biogeosciences 113. doi:10.1029/2007jg000500.
- Yang, J., P. Gong, R. Fu, M. H. Zhang, J. M. Chen, S. L. Liang, B. Xu, J. C. Shi, and R. Dickinson. 2013. “The Role of Satellite Remote Sensing in Climate Change Studies (vol 3, pg 875, 2013).” Nature Climate Change 3 (11): 1002. doi:10.1038/Nclimate2033.
- Ying, L. X., J. Han, Y. S. Du, and Z. H. Shen. 2018. “Forest Fire Characteristics in China: Spatial Patterns and Determinants with Thresholds.” Forest Ecology and Management 424: 345–354. doi:10.1016/j.foreco.2018.05.020.