
ABSTRACT
Global change refers to changes in the relationship between humans and nature. It is desirable to actively integrate human social activities into the unified framework of global change so that their mutual relations and functional mechanisms can be understood. This complicated issue necessitates an appropriate method allowing domain experts to collaboratively contribute their knowledge to geoscientific research. Also, an efficient approach to optimize experimentation is of great importance. The reproducibility of research methods and results needs to be improved to boost the sharing of geographic knowledge and resources. This paper proposes a versioned geoscientific workflow and characterizes its full lifecycle using Virtual Geographic Environments, intending to facilitate and improve research related to the interactions between global change and human activities. The geoscientific workflow management is realized using the concept of version management, making geographic simulation methods and computational results easily reproducible and extendable. The sharing and reuse of geographic knowledge in various forms are archived through version management of geoscientific workflows. A versatile prototype system is implemented which enables the visual modeling of geoscientific workflows, the interactive optimization and collaborative evaluation of geoscientific workflows at runtime, the multi-dimensional dynamic visualization of geo-workflow outputs, and role-based access control for data security.
1. Introduction
Research on global change and sustainable development is a frontier of international geoscience in the twenty-first century. Global change is now better defined as changes in the relationship between humans and nature. To respond to global changes and maintain sustainable development, it is required to actively integrate human social activities into a unified framework of global change from which their mutual relations and functional mechanisms can be determined. The long-term impact of human activities on the natural environment involves multiple scenarios, multiple processes, and multiple scales. People from different fields have diverse understandings and assumptions about the changes in human-nature relationships. Geographic simulation allows scenario-based exploration by capturing spatial and temporal relationships between various geographic processes (Shashidharan Citation2017). In this context, the scientific problems that this article addresses are: how to facilitate the verification of assumptions about the human-nature relationship through efficient geographic simulations, and how to enhance cross-disciplinary knowledge sharing through computer-aided collaboration, to promote different stakeholders to reach a consensus on sustainable development. This drive has yielded a range of technical challenges in the corresponding research fields.
First, interactions between global change and human activities are a complex issue that concerns interdisciplinary approaches, and thus experts from different study regimes are increasingly called upon to contribute their knowledge and skills to collaborative research and comprehensive analysis. This means that appropriate methods to efficiently support distributed collaborations are critical. In addition, the process of the geographic simulation (hereafter called ‘geo-simulation’) reflects expert knowledge in solving many different geoscience problems whereas this kind of knowledge is difficult to describe and transform. Lack of expertise and limitation of geographic resources can mean that research methods of global change and human activities cannot be easily reproduced by other researchers, which may bring challenges in verifying and modifying geo-simulations. Therefore, a method to effectively share and reuse the knowledge and resources for solving geoscience problems is urgently needed (Chen et al. Citation2020).
Second, multiple processes may take place during the interaction between global change and human activities for which multiple models of different domains need to be coupled and interact with each other numerous times during the geo-simulation. The frequent interactions between models like data exchange are expected to be automated to improve the efficiency of geo-simulation. Moreover, significant uncertainty exists in different aspects of geography (Fusco et al. Citation2017) and it may cause inaccuracies in geo-simulations and even lead to incorrect conclusions. Besides the complexity of geographic models and the uncertainty of parameters, the heterogeneity of models presents challenges for optimizing geo-simulation as well. Thus, an efficient method to facilitate the iterative optimization of geo-simulation for achieving the scenario targets is of great importance.
Third, geo-simulation can be computationally-intensive, time-consuming, and high cost, though it can often be of low efficiency (Li et al. Citation2015). Geo-simulation under various climate scenarios may lead to a waste of computing and storage resources if the simulation results cannot be reused properly. Several existing methods save computational results separately for reuse, ignoring the relationship among the geoscience problems, the climate scenarios, the simulation processes, and the simulation results (Palomino, Muellerklein, and Kelly Citation2017). The discrete nature of these data makes it difficult to trace the historical simulation process and compare the simulation methods according to computational results. Thus, the comprehensive organization and management of computational results is a critical concern.
Finally, the analysis and evaluation of geo-simulation results play a vital role in decision support (Lü et al. Citation2019). A few open-source and commercial tools allow users to check the intermediate results of each atomic operation and the geo-simulation results are usually visualized in static 2D form. However, the interaction between global change and human activities covers multiple scales and changes over time. This feature puts forward a challenging demand for dynamically visualizing geo-simulation results in multiple dimensions. Moreover, geo-simulation results contain a vast volume of heterogeneous data output from different models, and how to integrate that data and customize the expression of massive geographic information for collaborative analysis remains a significant challenge in geographic visualization.
Geoscientific workflow is an increasingly utilized approach to carry out geographic experiments for scientific research (Pourabbas Citation2014; Konkol, Kray, and Pfeiffer Citation2019). A geoscientific workflow (hereafter called ‘geo-workflow’) is the process of combining geospatial data, geoprocessing functions, geospatial analysis algorithms, and geographic process models into a configurable and structured set of steps that implement automated or semi-automated computational solutions to a geoscience problem. This paper aims to address the above challenges by proposing a versioned geo-workflow based on Virtual Geographic Environments (VGEs) (Lin, Chen, and Lu Citation2013) for the collaborative geo-simulation of global change and human activities. It facilitates the efficient collaborative geo-simulation of complicated geoscience problems on three levels: role collaboration, resource collaboration, and human–computer collaboration. It realizes geo-workflow management with the concept of version management, making geo-simulations easily reproducible and extendable. The process-oriented sharing and reuse of geographic knowledge and computational results are archived through version management of geo-workflows. A prototype system is implemented which enables visual modeling of geo-workflow, interactive optimization of geo-workflow at runtime, and multi-dimensional dynamic visualization of geo-workflow outputs.
The remainder of this article is structured as follows. Section 2 presents a background of related work; Section 3 details the lifecycle of versioned geo-workflow, including the modeling, execution and optimization, visualization, and management of the geo-workflow; Section 4 describes the architecture of the prototype system and the geographic experiment conducted; Finally, concluding remarks are given in Section 5.
2. Background
The interaction between human activities and global change is a sophisticated issue calling for more interdisciplinary research (Palmer and Smith Citation2014), ‘diversity of approaches’ (Verburg et al. Citation2016), and ‘cross-comparison of models’ (Zvoleff and An Citation2014), which requires a batch of experiments to foster validation and innovation. Scientific workflows have recently emerged to assist in tackling these kinds of problems involving excessive complexity and diversity in scientific experimentation and application (Nativi et al. Citation2020). The geoscientific workflow defined in the section of introduction shares the concept and fundamental framework of e-Geoscience (Zhu et al. Citation2016). It has also been called a geoscience workflow (Huffman et al. Citation2011; Duffy et al. Citation2012), geoprocessing workflow (Schaeffer and Foerster Citation2008; Yue, Zhang, and Tan Citation2015; Hofer et al. Citation2017) or geospatial workflow (Hobona, Fairbairn, and James Citation2007; Zhang Citation2012).
The scientific workflow concept has seen enhanced application in more professional sectors, and an increasing number of scientific workflow management systems (WfMS) are being implemented by commercial and academic organizations. However, general commercial scientific WfMS such as Kepler, Apache Taverna, KNIME, etc. (Altintas et al. Citation2004; Oinn et al. Citation2004; Berthold et al. Citation2009) provide basic geospatial analysis functions that are not powerful enough to conduct complex geographic experiments. Geoscientific WfMS like ArcGIS Model Builder and QGIS Processing Builder offers more professional functions for analyzing complicated geoscience problems. However, these algorithms and models are limited to the libraries provided by these platforms, and the geo-workflow cannot be typically extended outside the system. In addition, geo-workflows used in these desktop-based systems may not be directly shared because of the finite compatibility between systems, which further complicates collaborative efforts.
The development of standardized geoprocessing services such as Web Processing Service (WPS) (Michaelis and Ames Citation2009) of Open Geospatial Consortium (OGC) has brought the advent of a collection of web-based tools for geo-workflow management and their platforms can be integrated from desktop to browser (Sun and Yue Citation2010; Sun, Yue, and Di Citation2012). Open Grid Services and cloud infrastructure have been integrated with geospatial web services, allowing geo-workflows to be capable of grid computing and cloud computing (Hobona et al. Citation2009; Wu et al. Citation2015). These geo-workflows based on service chain or service composition have benefited the distributed geographic information processing and the discovery of complex geospatial features (Lutz et al. Citation2007; Friis-Christensen et al. Citation2009; Yue et al. Citation2013). Furthermore, to empower the geo-workflow for multi-process geo-simulation, improved standards for integrated environmental modeling (IEM) (Laniak et al. Citation2013) like Open Modeling Interface (OpenMI) (Gregersen, Gijsbers, and Westen Citation2007) have been adopted to several geo-workflows, such as GeoJModelBuilder (Zhang, Bu, and Yue Citation2017) and OpenGMS (Wang et al. Citation2018; Yue et al. Citation2019; Zhang et al. Citation2019).
The growing complexity of geoscience problems requires more comprehensive expertise at multiple geographic scales and across disciplinary sectors (Rockström et al. Citation2009; Steffen et al. Citation2015). To accommodate this need, geo-workflow tools have been evolving from individual-oriented toward teamwork-oriented for multidisciplinary collaboration and distributed participation (Chen et al. Citation2019; Yue et al. Citation2020). Meanwhile, solutions to geoscience problems related to global change and human activities are moving from a data-centric approach to a more knowledge-driven approach (Nativi et al. Citation2020). Geographic knowledge applied to geo-workflow can be divided into two categories. One category is structured explicit knowledge, which includes geographic objects, rules, relations, and physical-mathematical models (Laurini Citation2014), etc. The other is unstructured implicit knowledge, which involves the extraction of data from geoinformation and specialist experience to answer geoscience questions and explain geographic phenomena (You and Lin Citation2016). The management of such geographic knowledge is of great significance to the sustainability of both geoscientific research and the harmony of humanity and nature (Golledge Citation2002; Mauser et al. Citation2013).
Integration of hybrid resources to support collaborative geo-simulation, reproduction of geoscientific experiments, and reuse of geographic knowledge through the management of geo-workflows have not been simultaneously achieved via a sole application in previous studies. Virtual geographic environments (VGEs) were created as a digital environment in which complex geographic systems can be perceived and analyzed by way of multi-channel human–computer interaction, distributed geographic modeling and simulation, multi-dimensional dynamic visualization, and cyberspace-based geographic collaboration (Chen and Lin Citation2018). With these advanced features, VGEs can provide an integrated environment for repeatable virtual geographic experiments through geo-workflow methods (Lin et al. Citation2020), which can promote a deep collaborative exploration of human-nature problems, as well as enhance rapid knowledge fusing and open knowledge sharing (Lin and Chen Citation2015). A fully capable environment for exhaustive information tracking of the web-based geo-workflow at the object level is not yet available (Palomino, Muellerklein, and Kelly Citation2017). Therefore, this paper utilizes an enriched VGE with iterative versioning capabilities throughout the whole lifecycle of collaborative geo-workflows to accomplish flexible and extensible management.
3. Lifecycle of versioned geoscientific workflows
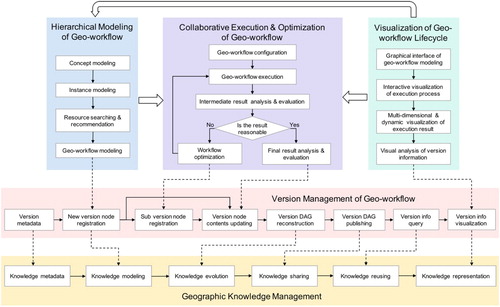
The lifecycle of versioned geo-workflows includes four phases, shown in : modeling, execution and optimization, visualization, and version management. The geo-workflow modeling phase intends to define and decompose geoscience problems from the concept level to the instance level under the guidance of interdisciplinary knowledge. The collaborative geo-workflow execution and optimization phase is mainly concerned with implementing, controlling, and optimizing the workflow for geo-simulation. The version management phase takes charge of managing the information of geo-workflow components at each research stage, including geoscience problems, data, and models involved in the research, as well as the execution logs and the results of the geo-workflow. Geographic knowledge management is also accomplished during the version management phase. The visualization phase covers the multi-dimensional dynamic visualization of the whole lifecycle of the geo-workflow. Each of these phases will be discussed in detail in the following subsections.
Figure 1. The lifecycle of versioned geoscientific workflows.
3.1. Hierarchical modeling of geoscientific workflow
The hierarchical modeling of geo-workflow is to explore the solutions for complex geoscience problems through the process of concept modeling, instance modeling, and workflow modeling guided by domain knowledge. This method is suitable for geoscience problems with clear research fields and spatial–temporal scales. For example, environmental issues like global warming and regional air pollution; urban planning issues like traffic congestion and flood resilience; and human activity issues like national food security and community disease spread.
3.1.1. Concept modeling
The first level is concept modeling. For a specific geoscience problem, experts with domain knowledge first think about how to map the real-world geographic issue into a theoretical geoscience problem through intervention rules. Complicated geoscience problems can then be decomposed into subproblems of different domains and different levels according to the geographic context and conceptual principles. The granularity of the problem decomposition depends on the depth of the research on the problem. Meanwhile, the relationship among subproblems should be transformed into geographic correlations. A concept model is formed based on the organization of the subproblems and their relationships, and each is presented as an individual node in an automatically generated XML (Extensible Markup Language) file as the conceptual document.
The understanding of problems concerning the interactions between global change and human activities can be mapped to a geoscience problem of response mechanisms and influence processes of activities in human society to global change, and feedback from the global natural environment changes to human society. To fully consider the role of human socio-economic activities in global climate change, it is important to perform multi-process simulation and deduction of human and natural systems under different policy scenarios considering a variety of factors. In this paper, the impact of human activities on the natural environment is mainly reflected through the changes in greenhouse gas concentrations and land use. The combined influence of agricultural supply, market demand, and policies can cause changes in carbon emissions and land use. Crop yield plays a crucial role in agricultural land use, and changes in this factor which can be ascribed to climate change are used to reflect the impact of the natural environment on human society. Accordingly, the original geoscience problem can be decomposed into three subproblems: changes in human activities, changes in global climate, and changes in crop yield.
3.1.2. Instance modeling
The second level is instance modeling where each subproblem in the concept model needs to be respectively mapped to an instance model which usually refers to a certain type of geographic models with common features. Geographic models here primarily include geographic process models, spatial analysis models, and statistical analysis models. The use of ontologies to semantically annotate the component models allows for checking the match between sources in terms of constructing a workflow (Van Ittersum et al. Citation2008). During this stage, the metadata of a few features of the decomposed geoscience problem and geographic models are stored in the same semantic system using ontologies, such as their domains and spatial–temporal scales, and the virtual geographic environment model service can provide instance model recommendation to experts by matching the keywords of those features. Based on the model recommendation results, the experts can collaboratively select one or more appropriate computational models to implement each instance model while the computational efficiency and accuracy are also taken into consideration. The geographic correlations between subproblems can then be integrated into the interactions and collaboration between instance models. Similar to concept modeling, an XML file is organized as an instance document to describe the instance models and their interactions.
3.1.3. Workflow modeling
The third level is workflow modeling that aims to implement the research method of geoscience problems with the integration of instance models, geospatial data, and computing resources. The instance model serves as the major computational component of a geo-workflow. Geospatial data plays an important role in dataflow which not only initiates the input and defines the output of geo-workflow but also enables the transmission of variables or parameters between instance models. In addition to models and data, the logical relationships and the coupling mechanisms of instance models should be clarified following the instantiated geographic correlations in the instance model. If a geo-workflow is verified as executable, parallel computing can be used to check intermediate results and efficiently reuse computation results, allowing the geo-workflow to be divided into a series of subtasks based on the computational characteristics of models, such as time steps.
Before the geo-workflow execution, a validation of the geo-workflow is deployed to verify the correctness and feasibility of the built geo-workflow at both the syntax and semantic level, to reduce the cost of run-time errors. The validation of the geo-workflow with the consideration of both the data and control perspective will not only follow the rules and strategies of scientific workflow but also follow the principles and laws of geoscience. A set of data validation rules are established using underlying geo-workflow semantics and model specifications, supporting data validity checks on the types, thresholds, and precision of parameters before execution to avoid anomalies caused by the input of illegal parameters. It is also possible to specify dependencies between parameters using a fixed list of allowed values, or by mathematical or logical formulae.
3.2. Collaborative geoscientific workflow execution and optimization
The complexity and uncertainty of geoscience problems and geographic models tend to make it difficult to achieve ideal simulation results at one time. For example, when solving certain geoscience problems, the executive conditions, input, and parameters of the geo-workflow might vary from scenario to scenario (Zhu and Yang Citation2019). The sensitivity and constraints of the parameters may also change. They may have different influences on the final result, so the logical and iterative calibration and optimization schemes are necessary for geo-simulation.
3.2.1. Iterative and interactive geo-workflow optimization
In most cases, the geo-simulation remains a black box to the user, thereby preventing the user from understanding the simulation process and results in real time (Deng, Desjardins, and Delmelle Citation2019). Besides, geographic models are developed with diverse programming languages while model structures and operating mechanisms also vary, making it difficult for general users to optimize the geo-workflow in a short time. This paper proposes a method of supporting real-time monitoring of execution progress and collaborative optimization of geo-workflow using a versatile graphical user interface (GUI) in the virtual geographic environment to alleviate some of the issues described above. During the execution of a geo-workflow, the status of each subtask is monitored and updated in real time to keep users informed of the execution progress of the geo-workflow. The intermediate output can be examined at multiple spatial and temporal scales as soon as the subtasks of the geo-workflow finish. If the intermediate output indicates that the current geo-workflow execution would not lead to acceptable results, users can pause or cancel the executing geo-workflow to avoid a waste of computing resources. After a comprehensive analysis of the possible reasons for unreasonable results, users can collaboratively optimize different components of the geo-workflow relevant to their domains of expertise and seamlessly switch between the optimization mode and execution mode.
The optimization of geo-workflow involves four primary approaches: (1) modifying the parameters or the data of models; (2) replacing or updating the model or data processing methods in the geo-workflow; (3) resetting the coupling conditions between the models; (4) refining the logic or the topology of the geo-workflow. The optimization of geo-workflows can be performed on two basic levels, global and local. Generally, global optimization is applied to the entire geo-workflow while local optimization only occurs in a particular subtask of individual components of the geo-workflow. Global optimization affects the total space and time involved in the geoscience problem whereas local optimization impacts only a small part of the space or time. After all of the optimizations are carried out, users can execute the geo-workflow from the paused point or restart the geo-workflow from the beginning. This process is iterated until the geo-workflow outputs match users’ expectations.
3.2.2. Enhanced method of parameter modification
Each component of the workflow typically has many parameters, and the quality of the result closely depends on their initial choices (Holl et al. Citation2013). Thus, the modification of parameters is one of the most common methods of geo-workflow optimization. Our approach provides an enhanced parameter optimization as compared to traditional coding methods in three important aspects. First, the parameters are classified and interpreted according to their fields and meanings, which makes it easy to query and understand the parameters. Second, apart from the data validation rules established in Section 3.1.3, a parameter filter is constructed to identify the used parameter or parameter set that has led to unreasonable results, and hence the parameter space can be narrowed via constraints, dependencies, and expert knowledge. Third, by automating the quick search steps of parameter paths, real-time updates of parameter files, and initialization of model operations, the errors and omissions of model parameter modifications are reduced, saving users’ time and energy in understanding the model structure and programming language. The convenience of our GUI enabled parameter modification platform allows users to pay more attention to parameter attributes and the relationships between parameters and scenario goals, which can improve the efficiency and accuracy of geo-workflow optimization.
3.2.3. Visualized evaluation of geo-simulation results
The evaluation of the accuracy and rationality of geo-simulation results is an important method to measure the performance of geo-workflows, which is also a crucial basis for supporting decision-making. Key attributes of model evaluation in geo-simulation are transparency, refutability, and uncertainty quantification (Laniak et al. Citation2013). Geo-simulation models provide particular challenges for evaluating the simulation results by using a unified quantitative method (Hagen-Zanker and Martens Citation2008). One challenge is that the resolution at which the model is defined is not equal to the scale at which the results are interpreted. Another challenge is posed by the dynamical nature of the simulation models and the diversity of the simulated targets of different scenarios. In this context, we propose a method (detailed in Section 3.4) to visually analyze the outputs of the geo-workflow at multiple dimensions, facilitating the collaborative evaluation of geo-simulations at a range of spatial scales. The dynamic visualization of geo-workflow outputs based on time series enhances the real-time observational ability of the temporal changes of current simulation results. The basis of the collaborative evaluation in this article is derived from prior knowledge of domain experts, geographic laws, historical statistics, observational data like remote sensing images, and simulation results of other studies.
3.3. Version management of geoscientific workflows
From the researcher’s perspective, each geo-workflow plays a role in the geographic experiment for problem-solving. To enhance the reproducibility of the geographic experiment, every change of the experiment needs to be tracked and stored as it can favor the reuse of knowledge and resources and provide convenience to the sensitivity test. For the sake of keeping context changes of geographic experiments traceable and searchable, this paper designs and constructs a geography featured version graph for the version management of geo-workflows.
3.3.1. Metadata of geoscientific workflow versions
Describing geo-workflow versions through standardized metadata is a primary method to enable efficient and effective geo-workflow management and reproduction. It can also provide clues about model development histories and usage relationships (Chen et al. Citation2018). The metadata of geo-workflow versions consists of five principal components as shown in . The fundamental component is the geoscience problem (geo-problem) with its attributes, including problem ID, the definition and description of the geo-problem, the ID and name of the subproblems of the decomposed geo-problem, the fields covered by the subproblems, and the scenarios that describe the future global climate change under certain policies with specified goals, such as radiative forcing, average global temperature rise, and concentration of global carbon dioxide.
Figure 2. Metadata of geoscientific workflow versions.
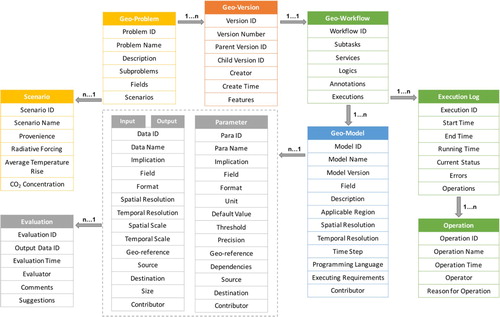
Each geo-problem has one or more geoscientific workflow versions (geo-version). A geo-version includes version ID, version number, parent version ID, child version ID, creator, creation time, and the features of the current version. The version ID is a universally unique identifier (UUID) to identify a certain version no matter what geo-problem it belongs to, while the version number is a sequential numeric label to classify the version related to a specific geo-problem. If the current version is not a root version, then it should have a value of the parent version ID, otherwise, this value can be null. The features of a version are customized by users which usually describe the differences in either method or results between the current version and its parent version, also the special properties of the version for the current geo-problem.
Each version focuses on the information of one geoscientific workflow (geo-workflow) whose attributes include the workflow ID, the subtasks and their attributes, the services required by geo-workflow execution (data service, model service, computation service, visualization service, etc.), the logical rules that describe the execution sequence of subtasks and the loop conditions, the annotations used to explain or highlight the geo-workflow information, and the execution logs of a geo-workflow. A geo-workflow can be executed multiple times, for each time of the execution, the log is stored synchronously and the user’s evaluation of either intermediate or final output is recorded in the corresponding version information.
Each geo-workflow may include one or more geographic models (geo-model), such as geospatial analysis models or geographic process models. A geo-model has attributes of model ID, model name, model version defined by model developers (which is different from the geo-workflow version), the field that the model belongs to, the description of the model application, the spatial and temporal resolution, the geographic reference, the programming language used to implement the model, and the execution conditions of the model such as operation platform and computer performance.
Geo-simulation parameters as well as the input and output (I/O) data are also important components of geo-models. Each geo-model usually has multiple parameters and more than one item of I/O data. Both parameters and I/O data possess the attributes of ID, name, description of their implication, field, format, and geographic reference. For parameters, the unit, the default value, and the threshold of value should be clarified. The value range of parameters may be continuous or discrete and may be constrained by the corresponding model or the target scenario. For I/O data, spatial and temporal resolutions, and spatial and temporal scales are required. Furthermore, the attributes of data source and destination play a vital role in constructing the dataflow of each geo-workflow. The input data of the model comes from multiple sources, such as raw data provided by sensors, surveys, satellites, or the output data from another model, therefore, the source of the input data should be recorded. In addition, the output data of a model may serve as the input data of other models, or it can be directly stored in the database. Thus, the destination of the output needs to be declared.
3.3.2. Construction and updating of version graphs
The version information of geo-workflow is organized in the form of a version graph. A version graph is modeled by a directed acyclic graph (DAG), a finite directed graph with no directed cycles which is adopted by typical version control methods. In a version graph, the nodes correspond to a version of a geo-workflow, and the directed edges capture the relationships between versions. The version graph is implemented by a popular Python library NetworkX with standard graph algorithms for graph generation and analyses (NetworkX Citation2020). The information of each version is described in a JSON document as a node of the version graph. The mapping from source version node to new version node as an edge can be collected into a dictionary which is a type of data structure in Python. The algorithms for comparing and merging the version of scientific workflows (Ogasawara et al. Citation2009) are of reference to the implementation of the reconstructed version graph in this paper.
The construction and the updating of a geo-workflow version graph are closely related to the modeling and execution of the geo-workflow. During the hierarchical modeling phase of the geo-workflow, if it is built from scratch instead of depending on existing geo-workflows, a brand new node will be registered synchronously as the root version in the version graph. Whenever the modification of an existing geo-workflow is committed during the collaborative geo-workflow execution and optimization phase, an additional node will be registered as the child version or the subversion of the previous geo-workflow which then acts as the parent version in the version graph. After the geo-workflow execution finishes, the version contents update correspondingly with the geo-workflow output and other related information listed in the metadata. If a version node that has child versions is deleted, its first child version will replace the location of its parent version in the version graph.
To improve the utilization of storage and the query efficiency of geo-workflow versions, the child version does not store all the information of the geo-workflow. Only the data and the description of the difference between the successive child version and parent version are retained. This is also a good way to retain the full history of changes made to the version graph. The child version inherits all the attributes of its parent version. When a geo-workflow version is requested for either visualization or execution, all the attributes inherited from the parent version and the attributes specific to the current version are merged into a complete geo-workflow version as a response to the request. Moreover, to handle the high demands of computationally intensive geo-workflow execution, the version that shares the same attributes with its parent version will also inherit the intermediate results from its parent version, thereby improving the computational efficiency.
3.3.3. Sharing and reusing of knowledge and computational results
The management of workflow modeling, execution, and optimization make the geographic experiment repeatable so that other researchers can learn from the experts’ experience implied by well-organized versions of each geo-workflow. In other words, the unstructured implicit knowledge to study and resolve geoscience problems becomes easier to share and reuse through the structured data of the geo-workflow version. The geo-workflow version can be queried by a set of well-defined fields, such as creation time and creator name, or the keywords of each version’s features and related geoscience problems.
The process of version management is closely related to the process of knowledge management (). The version metadata is mapped to knowledge metadata so that the geographic knowledge graph can share a similar framework with the version graph. The new version node registration involving the modeling of a new geo-workflow is connected with knowledge modeling (Motta Citation1999) because it can be taken as the process of creating a computer interpretable model of geographic knowledge. The version graph reconstruction triggered by the optimization of geo-workflow signifies the update or the evolution of the knowledge (Allee Citation1997) for solving the geoscience problem. The version graph publishing is concerned with knowledge sharing (Serban and Luan Citation2002) as it stimulates the activity of knowledge exchange or knowledge transfer through the channel of published geo-workflows. The version information query simplifies access to knowledge acquisition by searching the geo-workflow for different purposes which can encourage the reuse of knowledge (Chhim, Somers, and Chinnam Citation2017). The version information visualization is regarded as a form of knowledge representation for its capability of expressing procedural knowledge (Pirnay-Dummer, Ifenthaler, and Seel Citation2012) of designing and performing geo-simulations.
The management of geo-workflow results brings a shortcut to researchers comparing and analyzing the results of respective versions and figuring out the source of differences between the results according to the comprehensive information associated with geo-workflows. Instead of only storing the computation results, the geographic scenarios, simulation processes, and simulation results are organized by the geo-workflow version. These originally discrete data are related to each other and form a flexible and traceable network of computational results, facilitating the reproduction of historical simulation processes and the rapid acquisition of simulation results. By introducing the concept of a computational cache, both intermediate and ultimate computational results of different versions can be reused, which can avoid duplicate computations and significantly save computing resources and time costs. The cache of the intermediate results involves two procedures: the first step is cache provisioning with an adaptive algorithm (Heidsieck et al. Citation2019) that decides which intermediate result should be cached at runtime by balancing the storage cost of the output data and the execution time of subtasks of the geo-workflow; the second step is cache management that handles the cache storage using Redis (Remote Dictionary Server) (RedisLabs Citation2020) and cache index related to the version information for the fast retrieval of intermediate results placed in the cache.
The management of users’ operations and evaluations of geo-workflows provides a reference for other researchers to find the right person for further consultation and discussion. The influence of users’ operations on workflow performance like execution time and result accuracy in different versions can be used to measure the user’s contribution to the geographic experiments. Future standards to quantify this measurement will allow each user contribution level to be a vital attribute for expert recommendation to the collaborative research group for geoscience problem study. Based on users’ collaborative evaluation, data and model providers will have a better understanding of how their resources are applied and how they perform in various scenarios.
3.4. Visualization of the geo-workflow lifecycle
In the process of geo-workflow modeling, execution, and version management, the visualization of massive multi-source heterogeneous spatiotemporal data plays an extremely important role. To help users quickly explore and understand massive amounts of information and make timely decisions, this paper proposes a multi-dimensional dynamic visualization method for the expression and analysis of diverse geo-workflow output data and thematic data.
3.4.1. Integration and standardization of multi-source heterogeneous data
Given the visualization requirements of geo-workflows based on network sharing, it is necessary to integrate multi-source heterogeneous data into an easy-to-call, easy-to-process visual geographic information service. The service should have the capacity to present data in an open form, allowing users to access the services they need through the network anytime and anywhere. There are four major mainstream methods for multi-source heterogeneous data integration: spatial data format conversion tools, spatial data sharing platforms, geographic information system interoperation, and geographic information services built on the OGC standards (OGC Citation2020). Due to the complexity of geographic models and the diversity of data associated with collaborative research on geoscience issues, a single data integration method cannot typically satisfy visualization requirements. Therefore, to facilitate shared expression and collaborative analysis of geo-workflow outputs, our approach draws upon the advantages of the methods mentioned above and proposes a series of adaptation strategies for organization, conversion, and transformation of basic data types required by the rendering of multi-source heterogeneous data (), thereby achieving efficient and accurate visualization of geographic information.
Table 1. Adaptation strategies for multi-source heterogeneous data integration.
3.4.2. Multidimensional dynamic visualization
Visualization of multidimensional (2D, 2.5D, 3D, and 4D) data is needed to help users intuitively understand simulation processes, conduct explorative analyses, and detect anomalies. Apart from 2D and 3D methods, a variable time resolution is another important dimension for representing geospatial information, i.e. 4D methods. With the inclusion of a temporal dimension, scientists can analyze the past, display the present, and predict the future via geo-simulation. Therefore, multi-dimensional dynamic visualization can be a powerful tool.
Some of the early applications did not focus on the temporal aspects (Lin et al. Citation2017; Wang, Li, and Wang Citation2017). Most of them only provide basic functionalities, ignoring the customized multiple dimensional analytical functionalities. Our study improves upon these limitations by developing multi-dimensional dynamic visualization methods to diversify the visualization of both basic geographic scenes and geo-workflow outputs. It consists of spatial data visualization and temporal data visualization. Cesium is an end-to-end platform for creating world-class 3D applications that are fast, flexible, and robust to visualize massive geospatial data (Cesium Citation2020). shows the use cases of different data formats for visualizing spatial and temporal data in Cesium and their respective implementation schemes.
Figure 3. Adaptive visualization methods of heterogeneous spatial and temporal data in Cesium. (a) Visualization of night light imagery layers; (b) Visualization of 3D quantized mesh terrain; (c) 3D volume rendering visualization of China’s food production data in 2010; (d) Visualization of wind field data in time series view; (e) Visualization of China's land-use type distribution; (f) Spatiotemporal evolution of sea ice in the Arctic over the past 100 years; (g) Areas of different land-use types in 32 regions around the world; (h) Change in vegetation functional area in 32 regions of the world in 100 years.
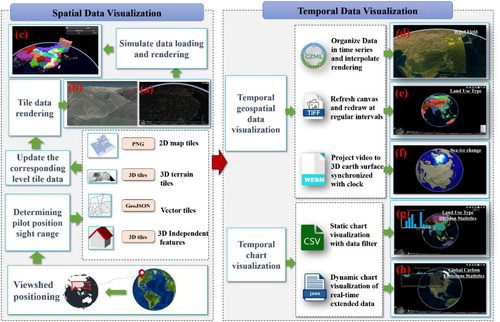
Spatial data visualization consists of the construction of a virtual geographic scene and the interaction with geospatial entities. For the construction of a basic geographic scene using data integration strategies, a set of basic scene data can be loaded through the network, such as 2D images and textures, 3D models of terrain and objects, 3D independent features, etc. These integrated data will then be quickly rendered by Cesium with the help of geographic web services, building up the virtual geographic scene. The dynamic loading and rendering of geo-workflow outputs are implemented similarly. For the interaction with a geospatial entity, it allows users to arbitrarily switch the perspective and the layer of the geographic scene. Users can observe the distribution of geospatial data in any allowed scale from a macro to a micro perspective. This kind of interaction shows its advantages with three additional features: spatial attribute retrieval via clicking on the spatial entities; spatial view positioning via entering the location of the point of interest; spatial measurements for describing geospatial distributions or phenomena. These functions are the basis for high-level analysis of geographic information systems, and the basis for the development of subsequent professional application analyses. Examples are illustrated in (a)-(c).
Temporal data visualization involves temporal geospatial data visualization and temporal chart visualization. Temporal geospatial data visualization allows users to dynamically observe geo-simulation results in space, enabling them to intuitively understand the simulation process and to detect abnormal situations. Three data formats have been standardized for efficient rendering in the front-end visualization: Cesium Markup Language (CZML), TIFF, and WebM. CZML is the only format for visualizing dynamic data in discrete time series without additionally setting redrawing time or refreshing rendering. The CZML client can visualize the dynamic geospatial data continuously through the automatic interpolation of geospatial data, as shown in (d). Batch generated raster and texture images based on geospatial web services in TIFF format are usually loaded through an index. Their dynamic visualization can be implemented by refreshing the canvas drawing and redrawing at regular intervals, as displayed in (e). By extracting high-dimensional precision grid data and generating a snapshot stitching video in WebM, large-scale computing data can be displayed dynamically and smoothly even when the computer performance is not that high. After resampling and coordinate conversion, video can be projected on the surface of the earth with a synchronized timeline, as shown in (f) (video source (NASA Citation2018)).
Temporal chart visualization is another function of visual analytics. Supported by the JavaScript graphic library D3.js (Bostock Citation2019), temporal statistical data in text format is presented with convenient interaction methods for users to review data charts through data filters and data dashboards. Data filters are used to select the data of interest to be viewed. Data dashboards enable users to view relevant data according to different settings of time and area, as displayed in (g). The timeliness and vividness of real-time data can be accomplished using a splicing extension with a dynamically refreshing front-end chart display, implemented using a scalable JSON format, as shown in (h).
3.4.3. Visual analysis of version information
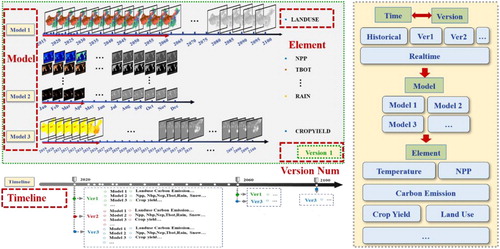
The collaborative analysis of version information is important as it records all the information of geo-workflows. Our proposed method supports both real-time visualization and historical visualization of geo-workflow outputs across multiple versions. The real-time view displays the latest execution results of a geo-workflow in the current version, while the historical view demonstrates the geo-workflow execution results in previous versions. Users can switch between these two views according to their analysis needs. illustrates the timeline structure of real-time and historical visualization for version information analysis. The blue timeline controls the total timespan under the overall geo-workflow execution process. The red arrows below the timeline represent the execution progress of individual models in the geo-workflow. In the real-time view synchronized with the geo-workflow execution progress, the model outputs will be automatically and dynamically visualized. In the historical view, the user may ‘drag’ the timeline to any time node and select the version number or can trace back all version information existing in each historical time node. Both views allow the user to select the elements of interest from the data list of model outputs to give an improved observational capability of geospatial elements. Using both real-time and historical visualization of version information, users can collaboratively compare and analyze differences between versions and to draw conclusions more efficiently.
Figure 4. Timeline structure of real-time and historical visualizations for version information analysis.
The version information is stored in the JSON format managed by MongoDB (MongoDB Citation2020). The implementation of real-time and historical views of the version information is based on the query of version data with different keywords. The query order of the keywords is time node, version number, version creator name, model name, and element name. The values of the time node and the version number are automatically decided and generated by the execution progress of the current geo-workflow in the real-time view while they are selected by users in the historical view. The data obtained by querying the database will be processed and visualized by the methods described in the previous two subsections.
Collaborative problem discovery and resolution is a key step of version analysis. To improve the efficiency of discovering and solving problems or revealing abnormalities during geographic collaboration, the visual analysis of version information provides the ability to mark and annotate the geo-workflow execution results. As shown in , users can highlight the problems or abnormalities of workflow execution results and add descriptions to the annotations. The mark and annotation of the current version will be broadcasted to related users in the collaboration group for further discussion and analysis.
Figure 5. Visual analysis of version information of geoscientific workflows.
3.5. Data security with role-based access control
Geospatial data is vulnerable to data leakage since vast amounts of personal characteristics and sensitive information of various stakeholders may be inferred from location records. From the perspective of data security, it is the concern of data privacy and confidentiality that leads to the limited openness of geospatial data. Therefore, to augment geospatial data openness while enhancing data security in the collaborative research of global change and human activities, we exploit the use of role-based access control (RBAC) in geo-workflows. RBAC emerged for the management of organizational authorization while providing an opportunity for great flexibility in specifying and enforcing security protection policies (Ferraiolo, Cugini, and Richard Kuhn Citation1995). Collaborative geo-workflow exists to facilitate research and education in geoscience, to support the decision-making of policies in response to global change, and to boost public engagement in sustainable development. In this context, the possible user roles in our system fall under six categories: the domain expert, the general researcher, the student, the decision-maker, the public (visitor), and the administrator of the system.
In light of the role-based concept model for geographic collaboration in VGE (Xu et al. Citation2018) and the user permission settings of Microsoft platforms (Holtzman Citation2020), our study modifies the role-user-privilege structure by including the features and requirements of geoscientific research. The user’s default privilege is defined by the assigned role at a range of access levels according to the user’s affiliation hierarchy, professional level, research field, and the spatial–temporal scope of their study. The access levels determine how high or deep the user can perform the specific privilege, as shown in . The description of the role’s privileges and the definition of the access levels are illustrated respectively in and . For example, a hydrology expert might have the highest access to water resource-related geo-workflows but would only have basic access to geology-related geo-workflows.
Table 2. Access levels of privileges for users with different roles.
Table 3. Name and description of the role’s privileges.
Table 4. Definition of access levels of the role's privileges.
The user’s additional privilege is defined by the task assigned in the collaborative research work, usually inherited from the privileges of the collaborative group. The difference between default privilege and additional privilege is that the default one is permanent if the user-role relationship exists while the additional one is temporary which can be later revoked if the needs of the task change. The access level of the geo-workflow version is consistent with that of the geo-workflow, which adopts role-based and group-based access control. A new version created upon the original version by a user can be accessed by the group members. It may be visible to other users if the group members would like to share it with the public.
4. Prototype system
4.1. System architecture
The system architecture is displayed in , which is designed based on a cross-platform Browser/Server (B/S) structure with three tiers: application platform, high-performance web server, and multi-source heterogeneous database. All three tiers exploit a web-service-based loose coupling approach to interact and communicate with each other, ensuring high stability and good extension capacity of the integrated VGE framework. The system is implemented using Python 3.4, the high-level Python Web framework Django 1.8, and the Bootstrap 3.4.4 front-end component library.
Figure 6. System architecture of the collaborative research platform based on VGE.
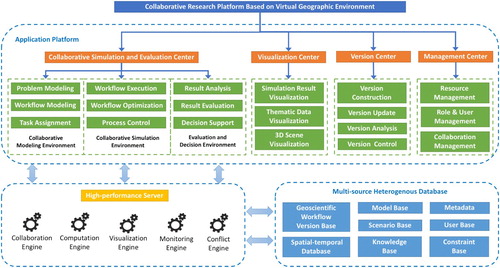
4.1.1. Application platform
The application platform is responsible for the interaction between the user and the virtual geographic environment for research on global change and human activities, consisting of the collaborative simulation and evaluation center, visualization center, version center, and management center.
The collaborative simulation and evaluation center implements multi-role collaborative geo-workflow modeling, execution and optimization, geo-workflow result analysis and evaluation, and decision support. The visualization center can integrate massive quantities of heterogeneous spatial–temporal data, providing users with a multi-dimensional dynamic visualization method to describe the evolution of geospatial elements and to explain the internal laws of geographic phenomena. The version center realizes the construction and update of geo-workflow versions and the analysis and management of version information. The management center provides comprehensive utilization of the resources needed by geographic research, the management of the relationships between role-user-privilege, and the organization of collaborative groups and constraints.
4.1.2. High-performance web server
The web server guarantees the effective operation of the application platform by integrating a range of high-performance engines including the collaboration engine, computation engine, visualization engine, monitoring engine, and conflict engine. These engines analyze requests from the application platform and query the heterogeneous multi-source database for corresponding data. The web server can then respond to the application platform by processing the data returned by the database and converting them to a format adapted to the browser, which is also a process to transform the spatial–temporal raw data into human-readable problem-oriented geographic information.
The collaboration engine takes charge of the processing and response of all collaborative operations. It is built on Node.js, an asynchronous event-driven JavaScript runtime designed to build scalable network applications (OpenJS Foundation Citation2020). Geographic collaboration among users is primarily supported by the collaboration among the resources of geo-data, geo-models, and geo-services as well as common web services. These services can be accessed according to REST (Representational state transfer) architectural style with RESTful web services providing interoperability between computer systems on the internet (Wikipedia contributors Citation2020b). When the server receives the collaborative request, the collaboration engine initially determines what resources are desired by the request and checks the collaboration constraints in the database. Other corresponding engines are then invoked to query and process the requested resources under collaboration constraints. Meanwhile, the collaboration engine provides the communication mechanism to those engines using HTTP (Hypertext Transfer Protocol) and Network Socket (Wikipedia contributors Citation2020a) defined by API (Application Programming Interface) to identify and forward messages.
The computation engine assembles data resources, model resources, and computing resources for computation tasks related to geo-workflow executions. On one hand, the assemblage maps the format and semantics of the raw input data of the geo-model and rebuilds the data structure or recombines the data resources to meet the computation requirements. This may include such procedures as statistical processing, geo-processing, or file processing. More specifically, a set of data processing tools or methods are published as data processing services, such as the data mapping and refactoring service based on the Universal Data Exchange model (UDX) (Wang et al. Citation2018), which can be invoked by the computation engine to realize the input data processing online and drive the geo-models in geo-workflows. These data processing services are also reusable for geospatial data sharing in open web environments (Wang et al. Citation2020). On the other hand, the assemblage matches the computation environment’s hardware and software to the demands of the geo-model operation, and computation resource allocation is performed to accomplish serial computation within one geo-workflow and parallel computation between geo-workflows.
The monitoring engine continuously captures the runtime information of the geo-workflow and stores it in the database. This information is fed back to the browser in real time to keep users informed of the status of the geo-workflow. If a special status is detected (such as ‘interrupted’), the monitoring engine will send an additional message as an alert to the browser, notifying users of the error and diagnostic information. To reduce the communication load, the message exchange during monitoring can be adjusted according to the estimated execution time of the geo-workflow and its subtasks.
The visualization engine participates in the visualizing process in every phase of the geo-workflow lifecycle. It deals with the visualization request of two major data types, collaboration data, and geospatial data. The scattered collaboration data is produced by collaborative activities whose visualization has high requirements for real-time performance. The geospatial data mostly comes from the output of geo-workflows whose visualization pays more attention to the dimensional transformation and dynamic expression. Since the two types of data have different visualization demands, the collaboration data is visualized with a series of lightweight web-based toolkits while the geospatial data visualization is mainly implemented with Cesium and GeoServer, a free Java-based software server for efficiently publishing geospatial data from the database to web applications like 3D WebGIS systems (GeoServer Citation2020).
The conflict engine detects and resolves conflicts caused by collaborative operations to maintain data consistency and collaboration efficiency. Every time the conflict engine receives processed collaboration requests from the collaboration engine, a conflict detection mechanism is triggered which can send the conflict information back to users through the application platform. For conflicts in geo-workflow modeling, execution, and evaluation, the conflict resolution methods used in collaborative virtual geographic environments (Xu et al. Citation2011) are applicable, including negotiation, vote, automatic solutions, etc. For conflicts in version management of geo-workflow, our approach improves previous methods by adding more options for users to choose, namely: merging and reconciling the conflict versions of the geo-workflow, appending the conflict versions as different child versions to the original version, revoking the commission of the version causing conflicts, and rolling back to the original version.
4.1.3. Multi-source heterogeneous database
The multi-source heterogeneous database is extensible and consists of seven sub-bases: geo-workflow version base, spatial–temporal database, model base, scenario base, user base, knowledge base, and constraint base. It can be seen from the metadata of the geo-workflow version that the version data involves a variety of geographic information. To prevent the version base from becoming too bloated to be managed, we establish references of the version base to the other six sub-bases instead of storing all geo-workflow related data in the version base. The spatial–temporal database organizes different types of geospatial data including the input and the output data of geo-workflows. The input data source contains the default data of model packages, the public data provided by open platforms or organizations, and the private data contributed by users. The model base stores geodata processing models, geographic process (physical-mathematical) models, and geospatial analysis models. The model source is organized by encapsulating the open-source models and self-developed models and invoking open model services from OpenGMS that offers services for more than 5000 geographic models (Zhang et al. Citation2019). The user base contains user profiles, role information, and corresponding privileges. The constraint base includes a range of regulations for geographic collaboration. The knowledge base consists of a set of geographic objects with attributes, the relationships between them, and the geographic rules.
The multi-source database is implemented by the integration of different database programs. The version base and knowledge base contains both structured and unstructured data, and a document-oriented database MongoDB (MongoDB Citation2020) that supports geo-based searches is adopted. For those sub-bases with structured data, two powerful relational databases have been employed, MySQL, and PostgreSQL along with the spatial database extender PostGIS (MySQL Citation2020; PostGIS Citation2020; PostgreSQL Citation2020). The integrated multi-source heterogeneous database provides spatialized data access interfaces for various types of data to support the modeling, execution, and visualization of geo-workflows.
4.2. Geographic experiment
4.2.1. Experimental procedure
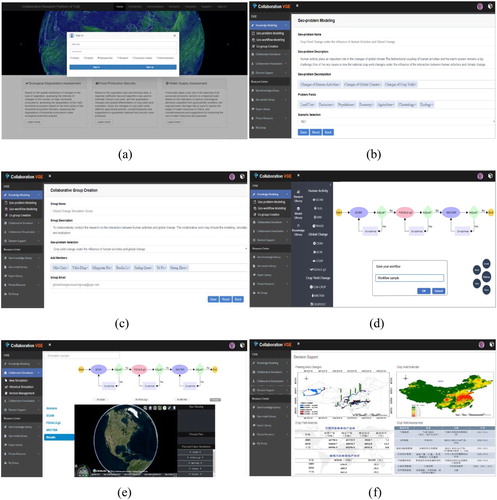
As depicted in , a geographic experiment on the research of the interaction between human activities and global change is conducted in six steps in a collaborative research platform based on a VGE: (1) A user logins the platform with the role of researcher. (2) The user creates a template defining and describing the geoscience problem, its subproblems, and scenarios. (3) The user invites certain experts from different research fields related to the geoscience problem to create a collaborative workgroup for problem-solving. (4) The group members collaboratively select and configure geographic models and data based on the recommendations from the VGE platform, and then construct a geo-workflow. (5) The group members collaboratively execute, analyze, and optimize the geo-workflow iteratively until they obtain an ideal simulation result. (6) The collaborative group generates a suggestion report according to the experiment results for decision support.
Figure 7. Experimental procedure of a geo-workflow about the interaction of human activities and global change: (a) Login with a specific role; (b) Geoscience problem modeling; (c) Collaborative group creation; (d) Geo-workflow modeling; (e) Geo-workflow execution and optimization; (f) Report for decision making.
4.2.2. Scenario settings
The experiment is designed under three scenarios defined according to the Intergovernmental Panel on Climate Change Fifth Assessment Report (IPCC AR5) (IPCC Citation2014) and the goals of the Paris Agreement reached at the Paris Conference in 2015 (Rogelj et al. Citation2016). The first scenario is a low-carbon scenario INDC considering the relevant factors of the National Independent Contribution (INDC) and the low-carbon transformation of domestic energy. Under this scenario, the global mean temperature rise target by 2100 cannot be controlled to 2 °C or even 1.5 °C. Therefore, based on the INDC scenario, two other low-carbon climate policy scenarios are further designed. One is the intermediate scenario (INDC_TWO) that aims to keep global warming below 2°C and limit the radiative forcing to 4.5 W/m2, and the other is an optimized scenario (INDC_OPT) that intends to keep global warming below 1.5°C and limit the radiative forcing to 2.6 W/m2. The targets of global radiative forcing, global average temperature rise, and concentration of global carbon dioxide (CO2) by the year 2100 of each scenario are described in .
Table 5. Description of three climate scenarios.
4.2.3. Modeling process
Given the availability of the model, data foundation and transparency, international comparability, etc., three geographic process models from different fields are introduced. To study the changes of human activities under different scenario policies, the Global Change Assessment Model (GCAM), one of the mainstream models in IPCC AR5, is applied and extended to a GCAM-China model by including the characteristics of China’s development (Zhou et al. Citation2018). To explore the changes in the global climate, the Grid-point version 3 of the Flexible Global Ocean-Atmosphere-Land System Model (FGOALS-g3) is employed for its significant improvements to memory and performance scaling that support high-resolution configurations (Li et al. Citation2020). To figure out how crop yields may change in these scenarios, a Crop Yield Estimation Model based on net primary production and crop yield regionalization (NRCYEM) is developed (Lin et al. Citation2019).
To simulate the interaction of human activities and global change, a bidirectional coupling geo-workflow is constructed using the above models. The dataflow between models is defined by the coupling variables between them. The concentration of greenhouse gas (GHGC) and the type of land use output from GCAM serve as the input variables of FGOALS-g3, impacting the carbon emissions and plant functional types (PFTs) in it. The net primary production (NPP) output from FGOALS-g3 is a principal input of NRCYEM to produce crop yield. Finally, the annual change rate of the crop yield (CYCR) calculated from the output of NRCYEM acts as the input of GCAM to communicate with the agriculture module in it.
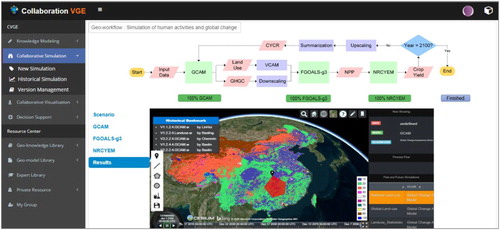
Due to the difference in the spatial and temporal scales of the three models, methods to convert the coupling variables are required. A vector-based cellular automata model (VCAM) (Cao et al. Citation2019) is applied to implement the spatial scale conversion of land use data from GCAM to FGOALS-g3. The conversion of the spatial–temporal scale of greenhouse gas concentrations is realized by interpolation and downscaling. Scale conversion of crop yield from NRCYEM to GCAM is then implemented by regional summarization and upscaling. Following the time step of GCAM and the general rules of policymaking, the models are set to exchange the data every five years during the simulation. Supported by the graphical workflow modeling interface, the geo-workflow described above is constructed as displayed in .
Figure 8. Geoscientific workflow for the simulation of human activities and global change.
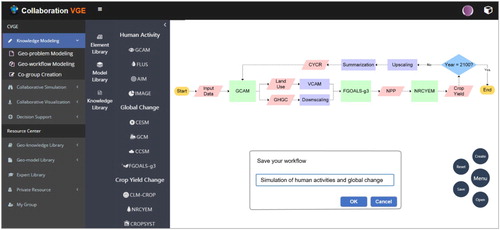
4.2.4. Simulation process
The simulation of crop yield changes under the influence of human activities and global climate change is conducted from the year 2000 to 2100 in three scenarios. As shown in , if the user places the mouse cursor on the start node, a set of icons will appear below it for starting, pausing, canceling, and restarting the geo-workflow. Once the simulation starts, the real-time simulation progress of each model is displayed on the monitoring panel below the workflow panel. The current status of the geo-workflow is demonstrated as running on the right of the monitoring panel. Rather than redirecting to another webpage, the user can benefit from visualizing the intermediate simulation results of each model on the same page as the geo-workflow configuration which allows them to simultaneously compare the results with parameters by simply switching the tags. Since a geo-workflow may have multiple variables in its output, this platform extracts the pivotal variables that reflect the interaction between human activities and global change () and then provides a function for users to view the simulation results of each model by selecting the variable name on the right list of visualization panel.
Figure 9. Interactive graphical interfaces of geoscientific workflow monitoring, optimization, and visualization: (a)-(c): interfaces of parameter optimization of GCAM, FGOALS-g3, NRCYEM; (d)-(f): interfaces of intermediate result visualization of GCAM, FGOALS-g3, NRCYEM.
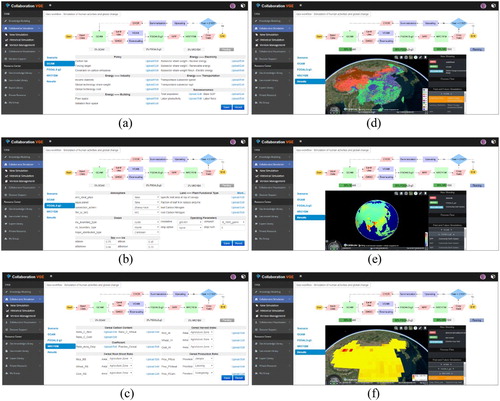
Table 6. Classification of sensitive parameters in the three geographic process models used in this experiment.
For geo-workflow optimizations, the interactive interface enables users to modify sensitive parameters in three efficient ways: by directly altering the value of a single parameter, by editing the existing parameter file to modify a large number of parameters, and by uploading a new parameter file to replace the old one. The parameters sensitive to the scenarios are classified into several categories respectively in line with model structures and parametric meanings (). In addition, users can refine the geo-workflow by committing more modifications in the geo-workflow modeling interface and reloading the updated geo-workflow to the execution interface for a new simulation.
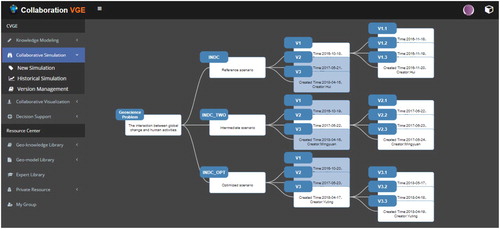
An example of the version graph generated from this simulation process is demonstrated in . According to the comparison of the simulation process, it can be found that to achieve the targets of the simulated scenarios, the number of iterative optimizations required for a non-versioned geo-workflow is several times that of a versioned geo-workflow with the advantage of the version information analysis within and between scenario(s). In the same computational environment, the running time of non-versioned geo-workflow after modification is longer than that of versioned geo-workflow which benefits from caching the computational results of the parent version.
Figure 10. An example of a constructed version graph of the geoscientific workflow in this experiment.
4.2.5. Simulation results
A series of representative simulation results of crop yield change under the influence of human activities and global climate change for 100 years under three scenarios are displayed in , including four parts: the spatial–temporal change of land use and net primary productivity (NPP); the variation tendency of the global carbon dioxide emissions, the concentration of carbon dioxide, and the average rise of global temperature; the changing trend of national crop yield of China.
Figure 11. Simulation results of global land use distribution under three scenarios from 2015 to 2100 (classification schemes of land use according to (Cao et al. Citation2019)).
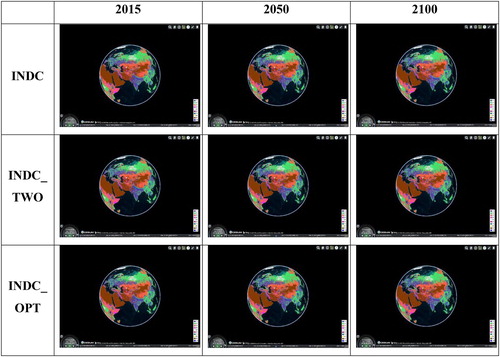
Figure 12. Simulation results of global net primary productivity distribution and differences between three scenarios from 2015 to 2100.
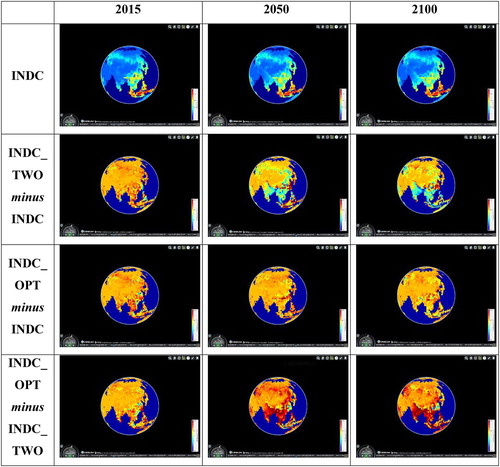
Figure 13. Variation tendency of global carbon emissions, the concentration of carbon dioxide, and the average rise of global temperature under three scenarios from 2015 to 2100.
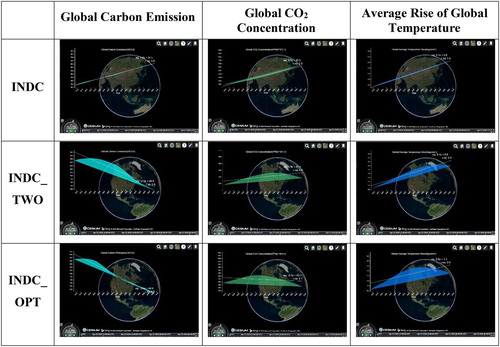
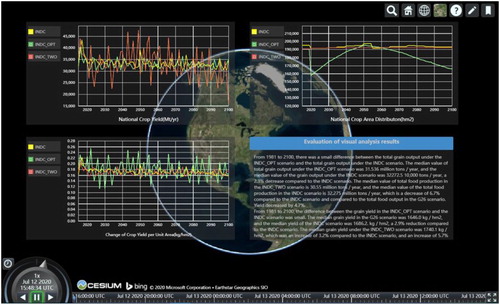
Figure 14. The changes in China’s national crop yield, crop area distribution, and crop yield per unit area under three scenarios from 2015 to 2100.
(1) Global land-use change
The spatial and temporal changes of simulated global land use under three scenarios from 2015 to 2100 are shown in .
(2) Global net primary productivity change
The spatial distribution and spatial differences of global total NPP under three scenarios from 2015 to 2100 are exhibited in . The first row displays the simulated global NPP distribution under the INDC scenario. The second to the fourth rows in respectively display the difference of the NPP between three scenarios, in which the blue and deep green colors represent negative differences while the others represent positive differences.
(3) Global carbon dioxide emission and concentration change
The simulation results of global CO2 emission and concentration, and the average rise of global temperature are demonstrated in where the color curve depicts the original simulated value. Basic linear regression analysis is performed according to the simulated value and the white line in each diagram represents the regression curve with the fitting equation and the r2 value beside it.
(4) National crop yield change in China
The changes in China’s national crop yield, crop yield area distribution, and crop yield per unit area under the three scenarios from 2015 to 2100 are displayed in .
5. Conclusion
This paper has introduced a versioned geoscientific workflow for collaborative geographic simulation considering its full lifecycle and implemented a prototype system to demonstrate its applicability and advancement via an experiment of the interactions between human activities and global change. The geo-workflow lifecycle in this paper enhances a general geo-workflow with the features of hierarchical modeling, collaborative execution and optimization, version management, and multi-dimensional dynamic visualization with the support of integrated VGEs, which bring novel improvements to geoscientific research in three important aspects.
First, the inclusion of a VGE platform provides a scenario-oriented assembly of geospatial data, geographic models, geospatial services, and computing resources to conduct unlimited virtual geoscientific experiments via geo-workflow methods under different scenarios. The proposed geo-workflow and developed platform can facilitate the integration and sharing of model-data-computation results. The hierarchical modeling of geo-workflows puts forward a guideline for defining and decomposing the geoscience problem from concept to instance. The collaborative optimization of geo-workflows dramatically reduces the uncertainty of geo-simulation, increases the accuracy of geographic computation, and strengthens the scientific credibility of experiment results. The interactive operation of geo-workflow via dedicated GUIs emancipates users from tedious programming while it also fosters the interoperability of heterogeneous data and models. Version management of geo-workflows for the entire process of geo-simulation greatly enhances the repeatability and scalability of geo-workflows, improving the transparency and openness of published geoscientific research. Proper reuse of computation results through version management will also increase the efficiency and computational economics of geo-simulation. The use of multi-dimensional dynamic visualization vividly demonstrates geo-workflow outputs using both historical and real-time views, promoting multi-scale spatial–temporal analysis and synthetic evaluation of geoscientific experiments.
Second, VGEs create an open and versatile platform to boost knowledge transformation and innovation. This platform enables the three-level collaboration of users of different roles from various backgrounds, heterogeneous geospatial resources, human and computer environments, fostering the integration and regeneration of cross-disciplinary knowledge. Additionally, the knowledge used for decreasing the uncertainty of geo-simulation and appropriately applying geographic models and data to geoscience issues in diverse scenarios has continuously evolved with the iterative optimization of geo-workflows. This kind of knowledge further closes the gap between geospatial resource providers and users. Multi-dimensional dynamic visualization of geo-workflow outputs is utilized to express and interpret the vast volume of geographic information, augmenting each user’s cognition and perception of evolving Earth systems and dynamic geographic processes, which may accelerate knowledge discovery via geoscience experimentation. The version management of geo-workflows organizes an elastic repository of structured and unstructured knowledge using formalized metadata. It facilitates a semantic information linkage between geoscience problems and geo-workflows as corresponding solutions, which may assist in answering high-level geoscience questions in the future.
Finally, in the spirit of sustainable development, a collaborative research platform based on VGEs provides broad and secure access to geospatial resources with role-based access control of geo-workflows, encouraging people with different roles to actively participate in studying the interactions between human activities and global change in multiple ways.
Acknowledgments
We appreciate the detailed suggestions and comments from the editor and the anonymous reviewers. We express heartfelt acknowledgments to Prof. Min Chen, Prof. Bingli Xu, and Prof. Bin Chen for their insightful advice on improving the manuscript. We would like to especially thank Dr. Weihe Guan for her guidance and support to Miss Yuting Chen’s work in the Center for Geographic Analysis of Harvard University. The work described in this paper was supported by the National Natural Science Foundation of China [Grant number U1811464, 41971278, 41671378] and the National Key Basic Research Program of China [Grant number 2015CB954103].
Disclosure statement
No potential conflict of interest was reported by the author(s).
Data availability statement
The authors confirm that the data supporting the findings of this study are available within the article or its supplementary materials.
Correction Statement
This article has been republished with minor changes. These changes do not impact the academic content of the article.
Additional information
Funding
References
- Allee, Verna. 1997. The Knowledge Evolution: Expanding Organizational Intelligence. Boston, MA: Butterworth-Heinemann.
- Altintas, Ilkay, Chad Berkley, Efrat Jaeger, Matthew Jones, Bertram Ludascher, and Steve Mock. 2004. “Kepler: An extensible system for design and execution of scientific workflows.” Paper presented at the Proceedings. 16th International Conference on Scientific and Statistical Database Management, 2004.
- Berthold, Michael R, Nicolas Cebron, Fabian Dill, Thomas R Gabriel, Tobias Kötter, Thorsten Meinl, Peter Ohl, Kilian Thiel, and Bernd Wiswedel. 2009. “KNIME-the Konstanz Information Miner: Version 2.0 and Beyond.” AcM SIGKDD Explorations Newsletter 11 (1): 26–31.
- Bostock, Mike. 2019. “D3 Data-Driven Documents.” https://d3js.org/.
- Cao, Min, Yanhui Zhu, Jinling Quan, Sheng Zhou, Guonian Lü, Min Chen, and Mengxue Huang. 2019. “Spatial Sequential Modeling and Predication of Global Land use and Land Cover Changes by Integrating a Global Change Assessment Model and Cellular Automata.” Earth's Future 7 (9): 1102–1116.
- Cesium. 2020. “Changing How the World Views 3D.” https://cesium.com/.
- Chen, Min, and Hui Lin. 2018. “Virtual Geographic Environments (VGEs): Originating from or Beyond Virtual Reality (VR)?” International Journal of Digital Earth 11 (4): 329–333. doi:10.1080/17538947.2017.1419452.
- Chen, Min, Alexey Voinov, Daniel P Ames, Albert J Kettner, Jonathan L Goodall, Anthony J Jakeman, Michael Barton, Quillon Harpham, Susan M Cuddy, and Cecelia DeLuca. 2020. “Position Paper: Open web-Distributed Integrated Geographic Modelling and Simulation to Enable Broader Participation and Applications.” Earth-Science Reviews 207: 103223.
- Chen, Min, Chen Yang, Tao Hou, Guonian Lü, Yongning Wen, and Songshan Yue. 2018. “Developing a Data Model for Understanding Geographical Analysis Models with Consideration of Their Evolution and Application Processes.” Transactions in GIS 22 (6): 1498–1521.
- Chen, Min, Songshan Yue, Guonian Lü, Hui Lin, Chaowei Yang, Yongning Wen, Tao Hou, Dawei Xiao, and Hao Jiang. 2019. “Teamwork-oriented Integrated Modeling Method for geo-Problem Solving.” Environmental Modelling & Software 119: 111–123.
- Chhim, Peter P, Toni M Somers, and Ratna Babu Chinnam. 2017. “Knowledge Reuse Through Electronic Knowledge Repositories: A Multi Theoretical Study.” Journal of Knowledge Management 21 (4): 741–64.
- Deng, Jing, Michael R Desjardins, and Eric M Delmelle. 2019. “An Interactive Platform for the Analysis of Landscape Patterns: A Cloud-Based Parallel Approach.” Annals of GIS 25 (2): 99–111.
- Duffy, Christopher, Yolanda Gil, Ewa Deelman, Suresh Marru, Marlon Pierce, Ibrahim Demir, and Gerry Wiener. 2012. “Designing a Road map for Geoscience Workflows.” Eos, Transactions American Geophysical Union 93 (24): 225–226.
- Ferraiolo, David, Janet Cugini, and D. Richard Kuhn. 1995. “Role-based access control (RBAC): Features and motivations.” Paper presented at the Proceedings of 11th annual computer security application conference.
- Friis-Christensen, Anders, Roberto Lucchi, Michael Lutz, and Nicole Ostländer. 2009. “Service Chaining Architectures for Applications Implementing Distributed Geographic Information Processing.” International Journal of Geographical Information Science 23 (5): 561–580.
- Fusco, Giovanni, Matteo Caglioni, Karine Emsellem, Myriam Merad, Diego Moreno, and Christine Voiron-Canicio. 2017. “Questions of Uncertainty in Geography.” Environment and Planning A 49 (10): 2261–2280.
- GeoServer. 2020. “GeoServer is an open source server for sharing geospatial data.”. http://geoserver.org/.
- Golledge, Reginald G. 2002. “The Nature of Geographic Knowledge.” Annals of the Association of American Geographers 92 (1): 1–14.
- Gregersen, J. B., P. J. A. Gijsbers, and S. J. P. Westen. 2007. “OpenMI: Open Modelling Interface.” Journal of Hydroinformatics 9 (3): 175–191.
- Hagen-Zanker, Alex, and Pim Martens. 2008. “Map comparison methods for comprehensive assessment of geosimulation models.” Paper presented at the International Conference on Computational Science and Its Applications.
- Heidsieck, Gaetan, Daniel De Oliveira, Esther Pacitti, Christophe Pradal, Francois Tardieu, and Patrick Valduriez. 2019. “Adaptive Caching for Data-Intensive Scientific Workflows in the Cloud.” Paper presented at the International Conference on Database and Expert Systems Applications.
- Hobona, Gobe, David Fairbairn, Hugo Hiden, and Philip James. 2009. “Orchestration of Grid-Enabled Geospatial web Services in Geoscientific Workflows.” IEEE Transactions on Automation Science and Engineering 7 (2): 407–411.
- Hobona, Gobe, David Fairbairn, and Philip James. 2007. “Semantically-assisted geospatial workflow design.” Paper presented at the Proceedings of the 15th annual ACM international symposium on Advances in geographic information systems.
- Hofer, Barbara, Stephan Mäs, Johannes Brauner, and Lars Bernard. 2017. “Towards a Knowledge Base to Support Geoprocessing Workflow Development.” International Journal of Geographical Information Science 31 (4): 694–716.
- Holl, Sonja, Daniel Garijo, Khalid Belhajjame, Olav Zimmermann, Renato De Giovanni, Matthias Obst, and Carole Goble. 2013. “On Specifying and Sharing Scientific Workflow Optimization Results Using Research Objects.” Paper Presented at the Proceedings of the 8th Workshop on Workflows in Support of Large-Scale Science.
- Holtzman, Jim. 2020. “Security roles and privileges.” Microsoft, Accessed March 4th. https://docs.microsoft.com/en-us/power-platform/admin/security-roles-privileges.
- Huffman, John, Andrew Forsberg, Andrew Loomis, James Head, James Dickson, and Caleb Fassett. 2011. “Integrating Advanced Visualization Technology Into the Planetary Geoscience Workflow.” Planetary and Space Science 59 (11-12): 1273–1279.
- IPCC. 2014. “Climate Change 2014: Synthesis Report. Contribution of Working Groups I, II and III to the Fifth Assessment Report of the Intergovernmental Panel on Climate Change.” IPCC, Geneva, Switzerland. 151 pp.
- Konkol, Markus, Christian Kray, and Max Pfeiffer. 2019. “Computational Reproducibility in Geoscientific Papers: Insights from a Series of Studies with Geoscientists and a Reproduction Study.” International Journal of Geographical Information Science 33 (2): 408–429.
- Laniak, Gerard F, Gabriel Olchin, Jonathan Goodall, Alexey Voinov, Mary Hill, Pierre Glynn, Gene Whelan, Gary Geller, Nigel Quinn, and Michiel Blind. 2013. “Integrated Environmental Modeling: A Vision and Roadmap for the Future.” Environmental Modelling & Software 39: 3–23.
- Laurini, Robert. 2014. “A Conceptual Framework for Geographic Knowledge Engineering.” Journal of Visual Languages & Computing 25 (1): 2–19.
- Li, Zhenlong, Chaowei Yang, Baoxuan Jin, Manzhu Yu, Kai Liu, Min Sun, and Matthew Zhan. 2015. “Enabling big Geoscience Data Analytics with a Cloud-Based, MapReduce-Enabled and Service-Oriented Workflow Framework.” PloS one 10: 3.
- Li, Lijuan, Yongqiang Yu, Yanli Tang, Pengfei Lin, Jinbo Xie, Mirong Song, Li Dong, Tianjun Zhou, Li Liu, and Lu Wang. 2020. “The Flexible Global Ocean–Atmosphere–Land System Model Grid-Point Version 3 (FGOALS-g3): Description and Evaluation.” Journal of Advances in Modeling Earth Systems 12 (9): e2019MS002012.
- Lin, Franco, Wen-Yi Chang, Whey-Fone Tsai, and Chien-Chou Shih. 2017. “Development of 3D Earth Visualization for Taiwan Ocean Environment Demonstration.” Paper presented at the International Conference on Data Mining and Big Data.
- Lin, Hui, and Min Chen. 2015. “Managing and Sharing Geographic Knowledge in Virtual Geographic Environments (VGEs).” Annals of GIS 21 (4): 261–263.
- Lin, Hui, Min Chen, and Guonian Lu. 2013. “Virtual Geographic Environment: A Workspace for Computer-Aided Geographic Experiments.” Annals of the Association of American Geographers 103 (3): 465–482.
- Lin, Hui, Mingyuan Hu, Min Chen, Fan Zhang, Lan You, and Yuting Chen. 2020. “Cognitive Transformation from Geographic Information System to Virtual Geographic Environments.” Journal of Geo-Information Science 22 (04): 662–672. doi:10.12082/dqxxkx.2020.200048.
- Lin, Hui, Axing Zhu, Baolin Li, Jinling Quan, and Yuting Chen. 2019. “Technology Report of Simulation and Evaluation of the Interaction Between Human Activities and Global Change.” Technology Report of the National Basic Research Program of China. Shenzhen Institute of the Chinese University of Hong Kong. Report Number: “12440300662653270Y–2015CB954100/01”.
- Lü, Guonian, Michael Batty, Josef Strobl, Hui Lin, A. Xing Zhu, and Min Chen. 2019. “Reflections and Speculations on the Progress in Geographic Information Systems (GIS): A Geographic Perspective.” International Journal of Geographical Information Science 33 (2): 346–367.
- Lutz, Michael, Roberto Lucchi, Anders Friis-Christensen, and Nicole Ostländer. 2007. “A rule-based description framework for the composition of geographic information services.” Paper presented at the International Conference on GeoSpatial Sematics.
- Mauser, Wolfram, Gernot Klepper, Martin Rice, Bettina Susanne Schmalzbauer, Heide Hackmann, Rik Leemans, and Howard Moore. 2013. “Transdisciplinary Global Change Research: The co-Creation of Knowledge for Sustainability.” Current Opinion in Environmental Sustainability 5 (3-4): 420–431.
- Michaelis, Christopher D, and Daniel P Ames. 2009. “Evaluation and Implementation of the OGC web Processing Service for use in Client-Side GIS.” GeoInformatica 13 (1): 109–120.
- MongoDB. 2020. “The database for modern applications.” https://www.mongodb.com/.
- Motta, Enrico. 1999. Reusable Components for Knowledge Modelling: Case Studies in Parametric Design Problem Solving. Vol. 53. Amsterdam: IOS press.
- MySQL. 2020. “MySQL: The world's most popular open source database “. http://mysql.com/.
- NASA. 2018. “NASA EARTH OBSERVATIONS.” https://neo.sci.gsfc.nasa.gov/.
- Nativi, Stefano, Mattia Santoro, Gregory Giuliani, and Paolo Mazzetti. 2020. “Towards a Knowledge Base to Support Global Change Policy Goals.” International Journal of Digital Earth 13 (2): 188–216.
- NetworkX. 2020. “NetworkX, network analysis in python.” https://networkx.github.io/.
- Ogasawara, Eduardo, Pablo Rangel, Leonardo Murta, Claudia Werner, and Marta Mattoso. 2009. “Comparison and versioning of scientific workflows.” Paper presented at the 2009 ICSE Workshop on Comparison and Versioning of Software Models.
- OGC. 2020. “OGC Standards and Resources.” Open Geospatial Consortium. https://www.ogc.org/standards.
- Oinn, Tom, Matthew Addis, Justin Ferris, Darren Marvin, Martin Senger, Mark Greenwood, Tim Carver, Kevin Glover, Matthew R Pocock, and Anil Wipat. 2004. “Taverna: A Tool for the Composition and Enactment of Bioinformatics Workflows.” Bioinformatics (oxford, England) 20 (17): 3045–3054.
- OpenJS Foundation. 2020. “About Node.js.” https://nodejs.org/en/.
- Palmer, Paul I, and Matthew J Smith. 2014. “Earth Systems: Model Human Adaptation to Climate Change.” Nature News 512 (7515): 365.
- Palomino, Jenny, Oliver C Muellerklein, and Maggi Kelly. 2017. “A Review of the Emergent Ecosystem of Collaborative Geospatial Tools for Addressing Environmental Challenges.” Computers, Environment and Urban Systems 65: 79–92.
- Pirnay-Dummer, Pablo, Dirk Ifenthaler, and Norbert M. Seel. 2012. “Knowledge Representation.” In Encyclopedia of the Sciences of Learning, edited by Norbert M. Seel, 1689–1692. Boston, MA: Springer US.
- PostGIS. 2020. “Spatial and Geographic objects for PostgreSQL.” https://postgis.net/.
- PostgreSQL. 2020. “PostgreSQL: The World's Most Advanced Open Source Relational Database.” https://www.postgresql.org/.
- Pourabbas, Elaheh. 2014. Geographical Information Systems: Trends and Technologies. Boca Raton, FL: CRC press.
- RedisLabs. 2020. “Redis.” https://redis.io/.
- Rockström, Johan, Will Steffen, Kevin Noone, Åsa Persson, F. Stuart Chapin, Eric F Lambin, Timothy M Lenton, Marten Scheffer, Carl Folke, and Hans Joachim Schellnhuber. 2009. “A Safe Operating Space for Humanity.” nature 461 (7263): 472–475.
- Rogelj, Joeri, Michel Den Elzen, Niklas Höhne, Taryn Fransen, Hanna Fekete, Harald Winkler, Roberto Schaeffer, Fu Sha, Keywan Riahi, and Malte Meinshausen. 2016. “Paris Agreement Climate Proposals Need a Boost to Keep Warming Well Below 2 C.” nature 534 (7609): 631–639.
- Schaeffer, Bastian, and Theodor Foerster. 2008. “A Client for Distributed geo-Processing and Workflow Design.” Journal of Location Based Services 2 (3): 194–210.
- Serban, Andreea M, and Jing Luan. 2002. “Overview of Knowledge Management.” New Directions for Institutional Research 2002 (113): 5–16.
- Shashidharan, Ashwin. 2017. “Computational Steering for Geosimulations.” SIGSPATIAL Special 8 (3): 7–8.
- Steffen, Will, Katherine Richardson, Johan Rockström, Sarah E Cornell, Ingo Fetzer, Elena M Bennett, Reinette Biggs, Stephen R Carpenter, Wim De Vries, and Cynthia A De Wit. 2015. “Planetary Boundaries: Guiding Human Development on a Changing Planet.” Science 347 (6223): 1259855.
- Sun, Ziheng, and Peng Yue. 2010. “The use of Web 2.0 and geoprocessing services to support geoscientific workflows.” Paper presented at the 2010 18th International Conference on Geoinformatics.
- Sun, Ziheng, Peng Yue, and Liping Di. 2012. “GeoPWTManager: A Task-Oriented web Geoprocessing System.” Computers & Geosciences 47: 34–45.
- Van Ittersum, Martin K, Frank Ewert, Thomas Heckelei, Jacques Wery, Johanna Alkan Olsson, Erling Andersen, Irina Bezlepkina, Floor Brouwer, Marcello Donatelli, and Guillermo Flichman. 2008. “Integrated Assessment of Agricultural Systems–A Component-Based Framework for the European Union (SEAMLESS).” Agricultural Systems 96 (1-3): 150–165.
- Verburg, Peter H, John A Dearing, James G Dyke, Sander Van Der Leeuw, Sybil Seitzinger, Will Steffen, and James Syvitski. 2016. “Methods and Approaches to Modelling the Anthropocene.” Global Environmental Change 39: 328–340.
- Wang, Jin, Min Chen, Guonian Lü, Songshan Yue, Kun Chen, and Yongning Wen. 2018. “A Study on Data Processing Services for the Operation of geo-Analysis Models in the Open web Environment.” Earth and Space Science 5 (12): 844–862.
- Wang, Jin, Min Chen, Guonian Lü, Songshan Yue, Yongning Wen, Zhenxu Lan, and Shuo Zhang. 2020. “A Data Sharing Method in the Open web Environment: Data Sharing in Hydrology.” Journal of Hydrology 587: 124973.
- Wang, Sizhe, Wenwen Li, and Feng Wang. 2017. “Web-scale multidimensional visualization of big spatial data to support earth sciences—a case study with visualizing climate simulation data.” Paper presented at the Informatics.
- Wikipedia contributors. 2020a. “Representational State Transfer.” Wikipedia, The Free Encyclopedia. https://en.wikipedia.org/w/index.php?title=Representational_state_transfer&oldid=977328578.
- Wikipedia contributors. 2020b. “WebSocket.” Wikipedia, The Free Encyclopedia. https://en.wikipedia.org/w/index.php?title=WebSocket&oldid=983298595.
- Wu, Huayi, Lan You, Zhipeng Gui, Kai Hu, and Ping Shen. 2015. “GeoSquare: Collaborative Geoprocessing Models’ Building, Execution and Sharing on Azure Cloud.” Annals of GIS 21 (4): 287–300.
- Xu, Bingli, Hui Lin, Longsang Chiu, Ya Hu, Jun Zhu, Mingyuan Hu, and Weining Cui. 2011. “Collaborative Virtual Geographic Environments: A Case Study of air Pollution Simulation.” Information Sciences 181 (11): 2231–2246.
- Xu, Bingli, Yi Rao, Yuting Chen, Lan You, and Hui Lin. 2018. “Role Model-Based Geo-Collaboration of Virtual Geographic Environments.” Geomatics and Information Science of Wuhan University 43 (10): 1580–1587.
- You, Lan, and Hui Lin. 2016. “Towards a Research Agenda for Knowledge Engineering of Virtual Geographical Environments.” Annals of GIS 22 (3): 163–171.
- Yue, Songshan, Min Chen, Jie Song, Wenping Yuan, Tiexi Chen, Guonian Lü, Chaoran Shen, Zaiyang Ma, Kai Xu, and Yongning Wen. 2020. “Participatory Intercomparison Strategy for Terrestrial Carbon Cycle Models Based on a Service-Oriented Architecture.” Future Generation Computer Systems 112: 449–66.
- Yue, Songshan, Min Chen, Chaowei Yang, Chaoran Shen, Bowen Zhang, Yongning Wen, and Guonian Lü. 2019. “A Loosely Integrated Data Configuration Strategy for web-Based Participatory Modeling.” GIScience & Remote Sensing 56 (5): 670–698.
- Yue, Peng, Liping Di, Yaxing Wei, and Weiguo Han. 2013. “Intelligent Services for Discovery of Complex Geospatial Features from Remote Sensing Imagery.” ISPRS Journal of Photogrammetry and Remote Sensing 83: 151–164.
- Yue, Peng, Mingda Zhang, and Zhenyu Tan. 2015. “A Geoprocessing Workflow System for Environmental Monitoring and Integrated Modelling.” Environmental Modelling & Software 69: 128–140.
- Zhang, Jianting. 2012. “A practical approach to developing a web-based geospatial workflow composition and execution system.” Paper presented at the Proceedings of the 3rd international conference on computing for geospatial research and applications.
- Zhang, Mingda, Xiaoqian Bu, and Peng Yue. 2017. “GeoJModelBuilder: An Open Source Geoprocessing Workflow Tool.” Open Geospatial Data, Software and Standards 2 (1): 8.
- Zhang, Fengyuan, Min Chen, Daniel P Ames, Chaoran Shen, Songshan Yue, Yongning Wen, and Guonian Lü. 2019. “Design and Development of a Service-Oriented Wrapper System for Sharing and Reusing Distributed Geoanalysis Models on the web.” Environmental Modelling & Software 111: 498–509.
- Zhou, Sheng, Yu Wang, Zhiyi Yuan, and Xunmin Ou. 2018. “Peak Energy Consumption and CO2 Emissions in China's Industrial Sector.” Energy Strategy Reviews 20: 113–123.
- Zhu, Yunqiang, Peng Pan, Shifeng Fang, Li Da Xu, Jia Song, Jinqu Zhang, and Min Feng. 2016. “The Development and Application of e-Geoscience in China.” Information Systems Frontiers 18 (6): 1217–1231.
- Zhu, Yunqiang, and Jie Yang. 2019. “Automatic Data Matching for Geospatial Models: A New Paradigm for Geospatial Data and Models Sharing.” Annals of GIS 25 (4): 283–298.
- Zvoleff, Alex, and Li An. 2014. “Analyzing Human–Landscape Interactions: Tools That Integrate.” Environmental Management 53 (1): 94–111.