
ABSTRACT
With growing pressures on marine ecosystems and on marine space, an increasingly needed strategy to optimise the use of marine space is to co-locate synergic marine human uses in close spatial–temporal proximity while separating conflicting marine human uses. The ArcMap toolbox SEANERGY is a new, cross-sectoral spatial decision support tool (DST) that enables maritime spatial planners to consider synergies and conflicts between marine uses to support assessments of co-location options. Cross-sectoral approaches are important to reach more integrative maritime spatial planning (MSP) processes. As this article demonstrates through a Baltic Sea analysis, SEANERGY presents a cross-sectoral use catalogue for MSP through enabling the tool users to answer important specific questions to spatially and/or numerically weight potential synergies/conflicts between marine uses. The article discusses to what degree such a cross-sectoral perspective can support integrative MSP processes. While MSP integrative challenges still exist, SEANERGY enables MSP processes to move towards developing shared goals and initiate discussions built on best available knowledge regarding potential use-use synergies and use-use conflicts for whole sea basins at once.
1. Introduction
Marine space is increasingly occupied at sea with new and traditional marine uses expanding their space and activities, a trend promoted with the EU Blue Growth Agenda (EC Citation2012). A more densely populated sea increases the challenge of and need for ensuring coexistence and coordination between human uses at sea. Promoting sustainable coexistence between marine uses is directly stated as an objective of maritime spatial planning (MSP) in the EU (EC Citation2014), which underlines the importance of MSP in a world with increasingly densely populated seas. MSP processes thrive to include a broad range of stakeholders and scenarios to iteratively and holistically negotiate trade-offs between various objectives and costs with regards to locating new marine activities, reallocating existing ones, and developing management objectives (Pınarbaşı et al. Citation2017).
The EU MSP Directive requires an ecosystem-based approach to MSP to keep the environmental pressures from human uses within levels compatible with the achievement of good environmental status (EC Citation2014). Even though guidance on how to reach such ecosystem-based goals are lacking (Kirkfeldt Citation2019), the MSP requirements of an ecosystem-based approach and of co-location considerations highlight the need for going towards a more cooperative, integrative MSP surrounding whole sea basins. An integrative MSP approach is an ambitious, holistic approach that includes the newest knowledge and data, spans many sectors, many policies, and many stakeholders, and considers the dynamics of whole ecosystems (Piwowarczyka et al. Citation2019; Weig and Schultz-Zehden Citation2019). It aims at considering all sustainability dimensions in a long-term way in order to move away from fragmented, incoherent, individual sector goals (Soma, van Tatenhove, and van Leeuwen Citation2015).
To facilitate different aspects of integrative MSP, many spatial decision support tools (DSTs) have been developed over time. However, some types of new DSTs are still needed (Pınarbaşı et al. Citation2017). Various DSTs exist for carrying out cumulative impact assessments (CIA) to assess impacts from human uses on the environment, e.g. MYTILUS (Hansen Citation2019) and Tools4MSP (Menegon et al. Citation2018). Such tools enable options for planners to study use-environment interactions and to assess when the cumulative impacts on the environment are considered too high and require mitigation responses from society (Hansen Citation2019). However, not many existing DSTs focus on use-use interactions, despite that the amount of cross-sectoral interactions can be expected to rise with the increasingly populated oceans (Bonnevie, Hansen, and Schröder Citation2019). Use-use interactions are the interactions experienced by marine uses due to spatial–temporal proximity. As a scale by Klinger et al. (Citation2018) states, such interactions are considered conflicts, if they impose overall negative outcomes to any of the marine uses involved. This includes antagonistic situations where one marine use benefits on behalf of another marine use e.g. when sand extraction ships or fishing boats keep the other marine use away from mutually attractive seamounts (Klinger et al. Citation2018). Synergies can span from simple spatial compatibility where mobile uses share space at different times or where marine uses are located in different parts of the water column, e.g. pipelines at the bottom with sailing at the surface, to multi-use where the marine uses are more actively combined, e.g. wind farms combined with aquaculture (Schupp et al. Citation2019). If the oceans contained unlimited space, one could imagine that multi-use of marine uses would never take place to avoid too high cumulative pressures on the environment. However, in the existing world where available, accessible marine space becomes increasingly sparser, co-location of marine uses in close spatial–temporal proximity enables options for a more optimal use of space (Schupp et al. Citation2019).
Recently, a new DST that focuses on use-use conflicts and synergies has been developed; an ArcMap-based toolbox called SEANERGY (Bonnevie, Hansen, and Schröder Citation2020). With SEANERGY, it is possible to apply a cross-sectoral approach to strengthen synergies and decrease conflicts within MSP. While an overall methodology and tool presentation of SEANERGY has been presented elsewhere (Bonnevie, Hansen, and Schröder Citation2020), a full use catalogue of SEANERGY has not yet been demonstrated. Furthermore, SEANERGY’s potential to support integrative MSP has not yet been explored. In fact, DSTs could advantageously be evaluated for how well they support integrative MSP (Weig and Schultz-Zehden Citation2019).
The aim of this research is to demonstrate a detailed cross-sectoral use catalogue of SEANERGY based on the Baltic Sea area and discuss to what degree SEANERGY through its cross-sectoral knowledge facilitates a more integrative MSP approach. First, some analytical dimensions for MSP integration will be introduced. Second, SEANERGY is tested on Baltic Sea data to deduce a cross-sectoral use catalogue. Third, based on the cross-sectoral catalogue, it will be discussed to what degree the SEANERGY methodology contributes to more integrative MSP approaches.
2. Integrative dimensions of MSP
According to the EU MSP Directive (EC Citation2014), some minimum but ambitious common requirements for the maritime spatial plans exist such as; the principle of basing the plans on an ecosystem-based approach (Article 5), considering land-sea interactions (Article 6), including stakeholder involvement early in the planning process where all interested parties are informed (Article 9), and including enhanced cross-border cooperation between member states (Article 11) and third countries (Article 12). Furthermore, there is a requirement to look forward in time, planning for future activities (Article 8) and create resilience to climate change impacts (Article 5), while considering impacts on the environment (Article 4) and promoting coexistence of relevant activities (Article 5). The plans also need to be iterative, due to the demand of always using best available data (Article 10). The holistic ambition of MSP in Europe frames MSP as a comprehensive tool to move away from a fragmented, single-sector planning of marine areas towards a more integrative approach, attempting to integrate all goals of MSP (Piwowarczyka et al. Citation2019).
While integration can be viewed as a basic principle of the scope and purpose of MSP, integration is at the same time a major challenge for MSP in practice (Piwowarczyka et al. Citation2019). The goals of integrating long-term objectives across sectors, policies, institutions etc. are both goals and challenges. Even though MSP integration due to its complexity is difficult to encapsulate, four analytical integration dimensions, introduced in Piwowarczyka et al. (Citation2019), Gee et al. (Citation2019), and Weig and Schultz-Zehden (Citation2019), are useful to evaluate integration ambitions in MSP, and evaluate how a DST supports MSP integration. All four dimensions can be separated analytically but are still closely interlinked (Weig and Schultz-Zehden Citation2019).
The first analytical integration dimension is knowledge integration. It refers to the ambition to include various types of knowledge into the MSP process for planners to take more profound MSP decisions and to increase complex knowledge understandings among stakeholders of relevance to MSP (Weig and Schultz-Zehden Citation2019). Knowledge integration is both about the type and quality of the knowledge that enters the process, as well as it is about the type and quality of the data that help producing the knowledge (Gee et al. Citation2019). DSTs that are used in MSP processes can be very important tools in facilitating knowledge integration and overcome knowledge gaps (Gee et al. Citation2019; Pınarbaşı et al. Citation2017).
The second analytical integration dimension is sector and policy integration. Sector integration is necessary in MSP in order to be aware and minimise when decisions benefitting one marine use affects other marine uses negatively (Weig and Schultz-Zehden Citation2019). Policy integration throws light on how different political sector-related priorities exist and compete often across different MSP authorities, and it aims at integrating them (Gee et al. Citation2019). Both sector integration and policy integration thus refer to challenges of integrating different priorities, respectively between sectors and between policy areas. The goal is to minimise frictions between sectors and institutions and strengthen sector-/policy-synergies (Gee et al. Citation2019).
The third analytical integration dimension is stakeholder integration. It refers to the importance of including stakeholders into the MSP process and the discussion of how that can be done well, formally and informally. Stakeholder integration can bring along knowledge integration and sector integration, when it is successful (Morf et al. Citation2019a). Stakeholders cover all people considered relevant for the MSP process, being individuals, groups, or organisations (Gee et al. Citation2019). The questions of why stakeholders should be included, who to include, how, and when are all important to answer in order to reach a good foundation for stakeholder integration (Morf et al. Citation2019a). Therefore, such questions are also important when considering the relevance of DSTs for MSP.
The fourth analytical integration dimension is transboundary, multi-scale, and land-sea integration. All three aspects of this last dimension focus on integration across physical, spatial borders. Transboundary integration focuses on integrating MSP across national and/or vertical/horizontal institutional borders (Weig and Schultz-Zehden Citation2019; Piwowarczyka et al. Citation2019). Thereby, it becomes possible for MSP to consider the carrying capacity of ecosystems across whole sea basins instead of being limited to administrative, territorial borders (Papageorgiou and Kyvelou Citation2018). Multi-scale integration is the integration of all the spatial–temporal scales of the marine environment. MSP demands transboundary planning to a higher degree than terrestrial planning due to the fluid element of water which creates more movement of substances, species, resources, and mobile uses than on land (Jay et al. Citation2016). Besides the mobile dimension of marine elements, the sea is multi-dimensional with some marine uses taking place at the seabed, others in the water column, and others at the surface of the sea (Papageorgiou and Kyvelou Citation2018). In integrative MSP, it is thus very important to consider these different spatial–temporal dimensions and scales. As the last aspect of the fourth analytical dimension, land-sea integration is important for MSP to ensure a land-sea continuum in planning (Papageorgiou and Kyvelou Citation2018). Marine uses are connected to land, since the people participating or benefiting from marine uses live on land (Weig and Schultz-Zehden Citation2019). Furthermore, many coastal activities take place both on land and in the sea (Gee et al. Citation2019).
With these four analytical MSP integration dimensions, it can be evaluated how and to what degree a spatial DST such as SEANERGY facilitates a more integrative MSP approach (Weig and Schultz-Zehden Citation2019; Gee et al. Citation2019).
3. A cross-sectoral SEANERGY use catalogue
The Python-based ArcMap toolbox SEANERGY presented in Bonnevie, Hansen, and Schröder (Citation2020) can be expected to contribute to integrative MSP due to its cross-sectoral focus of better targeting use-use interactions within MSP processes. SEANERGY can with some data-gathering efforts be applied to any spatial case study area that the user wishes to focus on, but the existence of available, tool-required input knowledge for the Baltic Sea makes this sea basin a suitable demonstration area. The Baltic Sea region provides two important SEANERGY-mandatory inputs; the existence of available marine use GIS-data provided by HELCOM and a high degree of available conflict-synergy knowledge due to a strong cross-country planning agenda (Kull et al. Citation2019). Within SEANERGY, Baltic Sea knowledge regarding spatial compatibility, conflicts, synergies, and spatial-and/or-temporal overlaps have been synthesised into a pairwise marine use matrix where each pairwise use combination has been provided with a conflict-synergy score on a scale from −3 to 3 based on a rough categorisation of the available conflict-synergy knowledge (Bonnevie, Hansen, and Schröder Citation2020).
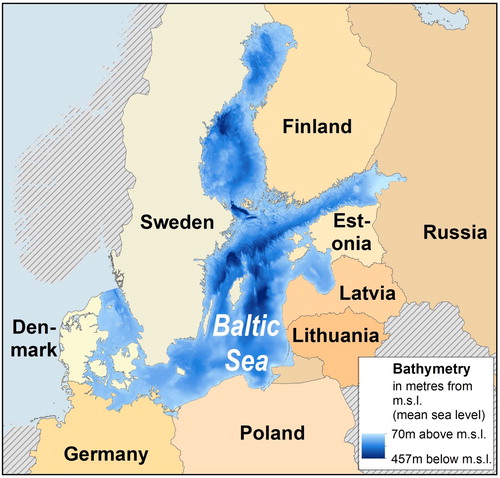
summarises inputs and outputs of the four main SEANERGY tools (T1–T4) that are relevant to demonstrate cross-sectoral aspects of SEANERGY. The four tools produce maps and statistics that explore spatial patterns of potential synergies and conflicts between marine uses. Utilising the different spatial and statistical outputs from SEANERGY, a cross-sectoral use catalogue with questions of MSP relevance can be deduced. It is presented in together with a list of the SEANERGY outputs that can be used to answer the questions (see for a presentation of the output codes). In the following, examples from the Baltic Sea illustrate how SEANERGY knowledge answers those questions. To provide a spatial reference, demonstrates how the Baltic Sea spans many Northern European countries; Finland, Sweden, Denmark, Germany, Poland, Lithuania, Latvia, Estonia, and the non-EU country Russia.
Figure 1. A SEANERGY input-output overview presenting mandatory inputs to SEANERGY, SEANERGY tools, and outputs with output codes from the four SEANERGY main tools. For further technical details of SEANERGY, see Bonnevie, Hansen, and Schröder (Citation2020).
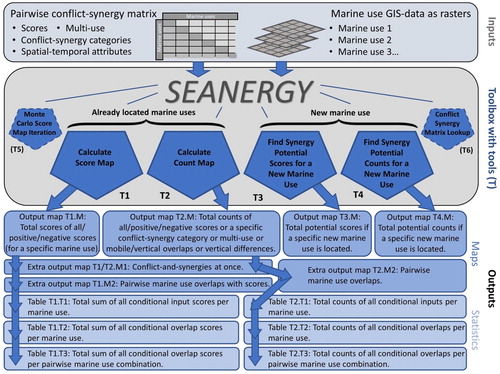
Figure 2. A cross-sectoral SEANERGY use catalogue with questions of MSP relevance presented with SEANERGY output codes for providing answers.
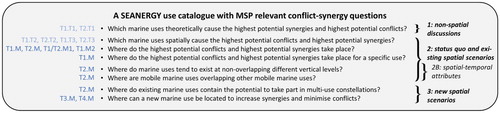
Figure 3. The Baltic Sea Region with countries and HELCOM Baltic Sea bathymetry data.
3.1. Which marine uses theoretically cause the highest potential synergies and highest potential conflicts?
summarises top 3 of Baltic Sea marine uses that input to the conflict-synergy matrix the highest potential synergies [columns 1–3] and the highest potential conflicts [columns 4–6].
Table 1. Top 3 of Baltic Sea marine uses with respectively the highest theoretical potential synergies (positive scores) and the highest theoretical potential conflicts (negative scores) calculated across all their pairwise matrix inputs.
Indicating high theoretical synergy potentials, coastal landscape protection and diving experience the highest count of positive pairwise input scores [column 1] as well as the highest sum of respectively all their positive pairwise input scores [column 2]. In the other end of the scale, indicating high theoretical conflict potentials, the marine use areas of dumped explosives experiences the highest count of negative pairwise input scores [column 4], and offshore oil and gas development experiences the lowest sum of its negative pairwise input scores [column 5].
A tendency to small conflicts on average exists for the negative score inputs to areas of dumped explosives, since this marine use has the highest conflict input count [column 4] without being in any of the other listed top 3 columns. The contradictory tendency to large conflicts on average [column 6] exists for the negative score inputs to areas for fish regeneration (artificial reefs). A similar but opposite trend to large synergies on average [column 3] exists for the positive score inputs to marine protected areas and bridges.
3.2. Which marine uses spatially cause the highest potential conflicts and highest potential synergies?
summarises top 3 of Baltic Sea marine uses that spatially experience the highest potential synergies [columns 1–3] and the highest potential conflicts [columns 4–6]. The marine uses with the highest synergy score [column 2] or with the lowest conflict score [column 5] are also the marine uses having some of the highest ranks of ocean coverage (OCR) according to the marine use data distribution. For example, commercial fishing with the highest ocean coverage rank of data (OCR: 1) tops both these columns. It exemplifies how some marine uses experience both many potential conflicts and synergies. This is not the case for shipping which has the lowest total synergy-conflict score [column 4] and thus experiences conflicts to a much higher degree than synergies. The highest total synergy-conflict score [column 1] belongs to recreational fishing, a marine use that also has a high total synergy score [column 2].
Table 2. Top 3 of Baltic Sea marine uses with respectively the highest potential synergies (positive scores) and the highest potential conflicts (negative scores) according to their spatial raster cell overlap with other marine uses. All score sums are calculated across all map raster cells. The ocean coverage rank (OCR) is stated in brackets; the lower the number, the higher the coverage percentage.
After averaging respectively total synergies [column 3] and total conflicts [column 6] per marine use area, land claim and extraction/mining of sand and gravel have respectively the highest synergy score and lowest conflict score; not commercial fishing.
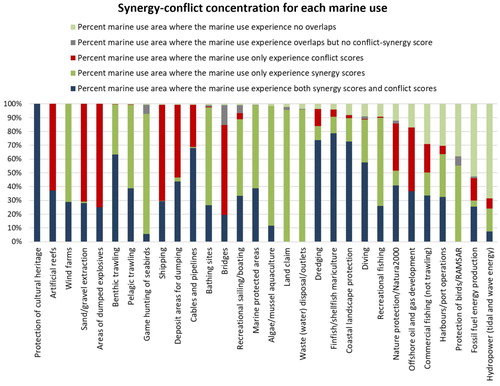
presents the spatial concentration of conflicts and synergies for each marine use. With some exceptions shown in the right end of the graph, the marine uses have few percent area without any overlaps with other marine uses. Hydropower is the marine use with the highest percent raster cells where no other marine uses take place, illustrating a tendency for hydropower to take place where other marine uses might experience less suitable locations. Land claim and waste disposal have the highest percent raster cells where they only experience synergies with other marine uses, while areas of dumped explosives and extraction/ mining of sand and gravel have the highest percent area where they only experience conflicts with other marine uses. Protection of cultural heritage is the only marine use that experience both conflicts and synergies with other marine uses in all its area. Appendix figure A-1 and A-2 illustrate more details by presenting pairwise statistics.
Figure 4. Percent synergy-conflict concentration for each Baltic Sea marine use.
3.3. Where do the highest potential conflicts and highest potential synergies take place?
Map A in spatially visualises the potential total conflict-synergy score distribution for the Baltic Sea with 33% positive, 23% negative, and 44% neutral raster cells. A green box highlights an area in Danish waters with a high concentration of positive total scores, while a red box exemplifies an area with a high concentration of negative total scores in the mid-Eastern Baltic Sea. Map B-E in zoom in on the overall synergic green area located in Danish waters.
Figure 5. Potential total conflict-synergy score maps and one pairwise count map from SEANERGY.
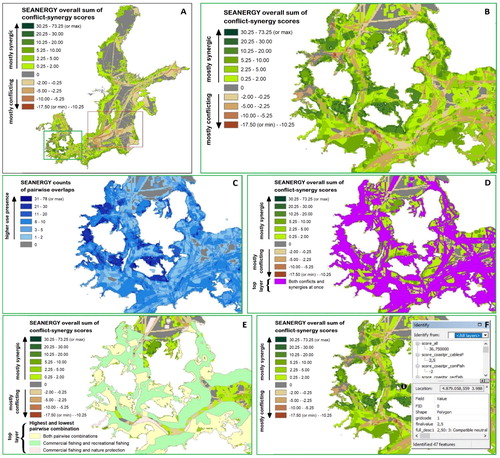
Within the green box zoom, many of the raster cells with a high, positive total conflict-synergy score (dark-green areas in map B) seem to also have a high count of pairwise overlaps (dark-blue areas in map C), indicating a high concentration of marine uses in overall synergic areas. Furthermore, the widespread purple colour in map D illustrates that most raster cells in the green box experience both conflicts and synergies at once, leaving only a few areas with small but positive total scores without any potential conflicts within this otherwise overall synergic Danish area. Map E shows the distribution of the pairwise combination with the highest positive pairwise overall conflict-synergy score sum; commercial fishing combined with recreational fishing, calculated as the pairwise input score of 1.75 multiplied with the number of raster cells where the combination is present. Map E also shows the opposite case; the pairwise combination with the lowest negative pairwise overall conflict-synergy score sum; commercial fishing combined with nature protection with an input score of −2 multiplied with the number of raster cells that the combination covers. The two pairs cover most of the area in the green box zoom, indicating that they both have a widespread spatial influence on the scores in this area. Map F exemplifies how the ArcMap-built-in-identify button that presents attributes of the clicked layers can be used to explore specific SEANERGY raster cell statistics. A Baltic Sea raster cell with a relatively high positive total score raster value of 36.75 is identified and illustrates e.g. how the combination of coastal protection and cables and pipelines contributes positively to the specific raster cell score.
3.4. Where do the highest potential conflicts and highest potential synergies take place for a specific use?
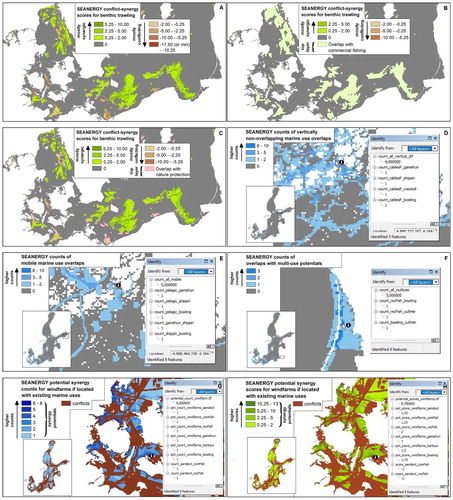
Map A-C in shows the full coverage of the total conflict-synergy score map for a specific marine use; benthic trawling. As map A illustrates, the overall conflict-synergy score for benthic trawling is often positive. This is due to many synergic overlaps with commercial fishing with an input score of 1.75 (map B). Such synergies between marine uses are not necessarily positive impacts on ecosystem services. In fact, the few spatial occasions with negative overall scores for benthic trawling reflect that benthic trawling experiences conflicts with nature protection (Natura2000) with an input score of −2 (map C).
Figure 6. Potential conflict-synergy score maps and pairwise count maps from SEANERGY illustrating options to focus on one existing or hypothetical specific marine use and options to explore spatial-temporal marine use attributes.
3.5. Where do marine uses tend to exist at non-overlapping different vertical levels?
Marine uses with different vertical scales are likely to be spatial compatible (Papageorgiou and Kyvelou Citation2018). In the Baltic Sea SEANERGY analysis, benthic-located cables and pipelines is found in the Finnish archipelago to be compatible with marine uses in the surface e.g. shipping and boating, as illustrated by map D in .
3.6. Where are mobile marine uses overlapping other mobile marine uses?
In situations where overlapping marine uses are mobile, they might share space but at different times, potentially enabling spatial compatibility if coordinated well. Examples of spatially overlapping mobile marine uses in the Baltic Sea are the combination of pelagic trawling and boating and the combination of game hunting and shipping, as illustrated by map E in for the Finnish archipelago.
3.7. Where do existing marine uses contain the potential to take part in multi-use constellations?
Map F in exemplifies where multi-use among existing Baltic Sea marine uses might be possible. Recreational fishing, boating, and cultural heritage are found together in a marine area north of Klaipeda in Lithuania, and these three marine use categories all have potentials to be part of multi-use constellations together according to SEANERGY knowledge derived from the MUSES project.
3.8. Where can a new marine use be located to increase synergies and minimise conflicts?
Map G and H in show the spatial distribution of potential total respectively counts and scores of pairwise synergies for new wind farms in a Baltic Sea area located in Danish waters with overall high wind farm synergy potentials. The two maps show the identify-result for a raster cell with a high potential total synergy count/score that reveals that recreational fishing experiences a high input score of 2 with wind farms.
3.9. Overall considerations
The answers to the questions overall illustrate that for the Baltic Sea, input conflict-synergies and observed spatial conflict-synergy patterns differ. Commercial fishing has a high percent ocean coverage, making it both the spatially most conflicting and most synergic marine use. Coastal landscape protection and diving cover less ocean area but have high synergy potentials, and areas of dumped explosives and offshore oil/gas development similarly have a low ocean coverage but high conflict potentials. Protection of cultural heritage is the only marine use that experience both conflicts and synergies at once in all its raster cells. When observing the synergy areas for existing spatial marine uses, it becomes apparent that only few synergy areas exist where no conflicts are present. Also, when exploring options to locate a new marine use such as wind farms, it appears to be possible to find new potential synergy areas for wind farms, although the results show many raster cells with conflicts.
4. Discussing the degree to which SEANERGY supports integrative MSP
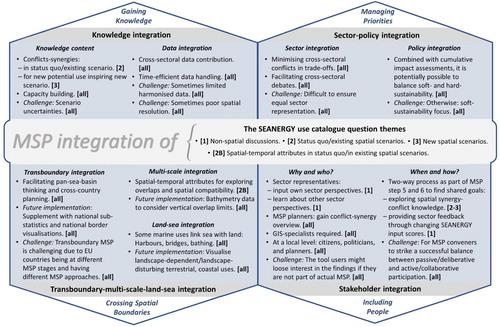
To what extent do the presented results of the SEANERGY tool assist in overcoming integration challenges in MSP? The outcome of this discussion is summed up in .
Figure 7. Results of discussing to what degree that SEANERGY facilitates integrative MSP processes based on the four analytical dimensions; knowledge integration, sector-policy integration; stakeholder integration, and transboundary-multi-scale-land-sea-integration.
4.1. Knowledge integration
Spatial data in the form of easy-to-read maps are very well suited to bring in geographical knowledge to the MSP process (Weig and Schultz-Zehden Citation2019; Kull et al. Citation2019).
4.1.1. Knowledge content
By using SEANERGY to answer the specific cross-sectoral synergy-conflict planning questions in the presented use catalogue for both existing and future conditions, the synergy-conflict knowledge can be linked to both MSP step 5: Defining and analysing existing conditions and MSP step 6: Defining and analysing future conditions through introducing co-location management stages as defined in Bonnevie, Hansen, and Schröder (Citation2019). The co-location management stage of detecting conflicts and synergies is relevant for defining/analysing existing conditions in MSP step 5, whereas the co-location management stage of preventing/minimising conflicts and increasing synergies is relevant for defining/analysing future conditions in MSP step 6.
Besides direct tool outcomes such as utilising spatial knowledge from cross-sectoral maps in MSP processes, indirect tool outcomes in the form of capacity building among stakeholders might arise from using SEANERGY enabling double-learning. Capacity building can consist of better understandings of other sector perspectives and technical and soft skills of how to work with conflict-synergies in MSP (Gee et al. Citation2019).
While SEANERGY thus supports knowledge integration, MSP knowledge integration challenges still exist especially when considering future conditions, scenarios, and climate change with a high degree of uncertainties. Scenario uncertainties create challenges for integration, since they make it more difficult to balance socioeconomic and ecological outcomes and trade-offs due to knowledge gaps (Soma, van Tatenhove, and van Leeuwen Citation2015).
4.1.2. Data integration
Some might criticise SEANERGY for not diving into details regarding how the benefits and impacts are distributed out on regions and people, such as for example the Spatial Economic Benefit Analysis (SEBA) distributes them (Weig and Schultz-Zehden Citation2019). However, this lack of details also has an advantage; it enables planners to much easier include data of extra marine uses into comparative analyses in SEANERGY than in e.g. SEBA, since tools such as SEBA need time-consuming and complicated data gathering processes (Weig and Schultz-Zehden Citation2019).
Despite the relative ease of including multiple marine uses at once in SEANERGY and thereby create cross-sectoral spatial datasets, SEANERGY still depends to a high degree on quality and availability of harmonised spatial input data for the analysis area in focus, as any spatial DST does it (Kull et al. Citation2019). It can be time-consuming to gather the right data, if no database exists for the analysis area in focus (Weig and Schultz-Zehden Citation2019), and time-consuming to make non-harmonised data compatible (Papageorgiou and Kyvelou Citation2018). The availability of HELCOM marine use GIS-data for the Baltic Sea enables SEANERGY to be used for the whole Baltic Sea basin at once. However, some marine uses experience a very coarse HELCOM data resolution e.g. fishing which bring more uncertainty into the results for these coarsely documented marine uses and thereby create an imbalance in the outputs across marine uses. Such an imbalance is not only found in the spatial–temporal distributions but also in the deduced Baltic Sea conflict-synergy inputs. Many of the Baltic Sea pairwise marine use matrix cells are currently empty representing unknown synergy-conflict interactions. For example, the marine use bridges in the Baltic Sea analysis experiences the highest missing input data percentage with 88% of all its possible pairwise inputs being empty. Any user of SEANERGY thus must be aware of data gaps and the fact that a limited amount of potential synergies or conflicts does not always reflect an actual limited amount but can be due to missing input knowledge.
4.2. Sector and policy integration
Sector integration and policy integration are very important to integrate different priorities in MSP (Gee et al. Citation2019).
4.2.1. Sector integration
It is difficult to ensure equal sector representation of all marine sectors in MSP. The regional MSP priorities within the Baltic Sea region are mostly concerned with fisheries, shipping, offshore renewable energy, and aquaculture (Li and Jay Citation2020), marine uses that were found in the SEANERGY Baltic Sea analysis to be very interacting with other marine uses. However, through using synergy-conflict tools such as SEANERGY, planners can start cross-sectoral debates and aim for a high inclusiveness of many sectors at once, providing a good foundation for negotiating trade-offs among sectors (Kull et al. Citation2019). Trade-offs are not uncommon in MSP (Klinger et al. Citation2018). A trade-off-necessary situation exists in SEANERGY, if the areas where conflicts exist for a potential new marine use take up most of the planning area, or if the marine use in focus is not possible to locate in SEANERGY areas that only contain synergies. In such situations, the new potential marine use might need to be located at a place where it will cause negative impacts to other marine uses, sometimes antagonistically pushing other marine uses out of that area such as e.g. the case of a new aquaculture site excluding artisanal fishing (Coccoli et al. Citation2018). With SEANERGY, it is possible in such trade-offs-necessary-situations to select areas for new uses where the total conflict score will be minimised.
Due to its multi-sector focus, SEANERGY does not consider site suitability for new marine uses, which will have to be dealt with outside SEANERGY through separate multi-criteria GIS analyses to narrow down SEANERGY synergy areas to only include areas satisfying marine use location requirements. Different tools exist where spatial suitability requirements can be explored for specific sectors, e.g. the SPACEA tool applied to locate musselfarms (von Thenen, Hansen, and Schiele Citation2020) and the AquaSpace tool exploring candidate areas for aquaculture (Gimpel et al. Citation2018), for which reason SEANERGY advantageously could supplement such tools. Furthermore, when sectors suggest candidate areas for new sites in national MSP processes, such candidate areas could be discussed and maybe even modified by introducing a SEANERGY-based MSP setting where cross-sectoral synergies and conflicts are considered.
Some recreational, less economic sectors e.g. bathing sites and diving sites are currently included in the SEANERGY Baltic Sea analysis and can thus be put in focus by the SEANERGY tool user to balance economic interests with recreational purposes. However, while recreational sites are sometimes mapped, recreational values are often not mapped nor ranked after priority, for which reason SEANERGY can advantageously be combined with methods such as the criteria selection for culturally significant areas (CSA) that puts less economic, recreational values on the map to ensure broader sector representativeness in MSP (Gee et al. Citation2017).
4.2.2. Policy integration
An important step in policy integration is to integrate the ecosystem approach with MSP to ensure a good environmental status of oceans while balancing blue growth ambitions (Gee et al. Citation2019). However, twenty ecosystem-related concepts have been found within the last decade of academic literature illustrating a confusing ocean of ecosystem-based concepts where definitions are either lacking or vary (Kirkfeldt Citation2019). The lack of a clear ecosystem-approach definition reflects the challenge of linking soft sustainability/blue growth/MSP with hard sustainability/environmental protection/the Marine Strategy Framework Directive (MSFD). Whereas soft sustainability tends to see environmental protection as one use among many competing uses at sea, an often-dominating view in MSP, the second approach assumes that man-made capital cannot make up for scarcity of natural resources (Piwowarczyka et al. Citation2019). SEANERGY mostly supports a soft sustainability approach, since it perceives natural/environmental protected areas as one use among others. If two marine uses with high environmental impacts experience synergies in close spatial-temporal proximity without being themselves affected by their pollution, SEANERGY will not evaluate them to be conflicting. However, if one combines SEANERGY with cumulative impact assessment (CIA) maps as done in Bonnevie, Hansen, and Schröder (Citation2020) in order to only locate new marine uses in multi-use where the cumulative environmental impacts are not too high, it becomes possible to balance soft sustainability considerations with hard sustainability needs. The use potential for SEANERGY in relation to policy integration thus increases, if SEANEGY is used holistically together with tools focusing on environmental sustainability. However, even CIA tools contain knowledge gaps related to climate change, varying expert knowledge, and unknown ecological thresholds (Blenckner et al. Citation2015). Therefore, neither SEANERGY nor CIA tools guarantee results that highlight sustainable MSP outcomes. However, SEANERGY does enable attempts/ambitions for more sustainable outcomes through its cross-sectoral focus, if all three sustainable pillars are considered in the synergy prioritisation; how to distribute economic gains and losses in a fair manner when carrying out trade-offs (economic sustainability)? How to prioritise MSP scenarios with benefits to the broader society, including non-economic, recreational and existential benefits (social sustainability), while at the same time minimising environmental impacts through e.g. CIA tools (environmental sustainability)?
4.3. Stakeholder integration
Why, who, how, and when are important aspects of stakeholder integration to put light on (Morf et al. Citation2019a).
4.3.1. Why and who?
SEANERGY can offer MSP stakeholders a cross-sectoral, systematic overview of multi-use options and potential spatial conflicts. More specifically, SEANERGY can offer sector representatives a means to input into MSP their insights regarding cross-sectoral conflicts and synergies through defining input conflict-synergy-scores. At the same time, sector representatives can gain insights into viewpoints among other sectors by discussing the score inputs with other sector representatives. Opportunities and constraints provided by actual and suggested spatial distributions of marine uses in the resulting maps can be evaluated and discussed across sectors by both sector representatives and maritime spatial planners. Even the viewpoints of local citizens, local politicians, and local planners could advantageously be included in SEANERGY-initiated discussions when SEANERGY is used for analysing local areas. A requirement for SEANERGY is, however, that GIS specialists are part of the technical facilitation of SEANERGY, since a high GIS expertise is needed in order to carry out the SEANERGY GIS analyses (Bonnevie, Hansen, and Schröder Citation2020). While the iterative dimension of SEANERGY makes the synergy-conflict knowledge transparent, a remaining challenge is whether the knowledge is entered into actual MSP, since that is a requirement for successful, inclusive stakeholder integration where the stakeholders consider the tool engagement worth the time and efforts invested (Gee et al. Citation2019).
4.3.2. When and how?
SEANERGY can advantageously be used already in the beginning of MSP processes providing explorative spatial checklists to initiate discussions of current synergies and conflicts (MSP step 5) and of different future interests, trade-offs, and scenarios (MSP step 6) with the purpose of finding what Soma, van Tatenhove, and van Leeuwen (Citation2015) refer to as shared goals. Gaining knowledge through exploring the conflict-synergy maps and giving feedback by changing scores and other inputs is a two-way process which places SEANERGY higher on the participation ladder by Morf et al. (Citation2019b) than what they call one-way information. Since SEANERGY urges for collaboration, its maps could more easily be presented and explored by stakeholders if implemented in a communication-driven spatial DST for collaborative MSP that offers options for non-GIS users to map, edit, and explore spatial data. Advanced examples of such DSTs are SeaSketch, which was developed in 2012 by McClintock Labs at the University of California Santa Barbara’s Marine Science Institute (Burnett Citation2020), and the free and open source Baltic Explorer, which was developed in the EU BONUS BASMATI project (2017–2020) for the Baltic Sea region (Rönneberg et al. Citation2019). It is up to planners how much decision power they will allow sector representatives to have in an interactive MSP workshop where SEANERGY could be included, whether the SEANERGY conflict-synergy-score inputs will be first and foremost defined by planners after consulting sector representatives through a process of what Morf et al. (Citation2019b) would classify as deliberation, or whether sector representatives will be allowed to decide the scores in what Morf et al. (Citation2019b) would refer to as a process of collaboration. A challenge exists for planners to decide when participants should be given less power as passive participants through deliberation, and when they should be given more power as active contributors through collaboration (Morf et al. Citation2019b), two different power levels directly reflected through the assignment of different user functionality types in Baltic Explorer (Rönneberg et al. Citation2019). The more power is handed over to sector representatives, the more important it is for all sectors to be well represented without marginalising any stakeholders (Gee et al. Citation2019).
4.4. Transboundary, multi-scale, and land-sea integration
Transboundary, multi-scale, and land-sea integration all focus on integration across physical, spatial boundaries.
4.4.1. Transboundary integration
Transboundary integration is challenging due to the various EU countries being at different MSP stages with different MSP approaches (Jay et al. Citation2016). However, presenting conflict-synergy maps at cross-country planning workshops strengthens cross-country planning and pan-sea-basin thinking according to the Baltic SCOPE project (Kull et al. Citation2019). SEANERGY facilitates options to study conflicts-synergies across a full transboundary sea basin such as the Baltic Sea. In future tool versions, SEANERGY could advantageously be updated to highlight synergy-conflict sub-statistics for individual countries as well as show national marine borders. Visualising national synergies and conflicts would better reflect and make transparent national MSP interests while the already implemented overall sea basin statistics and maps avoid neglecting the transnational scope of ecosystem services.
4.4.2. Multi-scale integration
SEANERGY facilitates options to explore various spatial, temporal, and statistical conflict-synergy patterns. Its spatial-temporal approach is inspired by the ADRIPLAN Marine Use Conflict tool which similarly makes use of spatial-temporal attributes (Menegon et al. Citation2018), but SEANERGY goes further by considering not only conflicts but also spatial compatibility for marine uses that horizontally overlap but at different times and/or different vertical levels. However, SEANERGY in its current version does not consider vertical overlap limits for coastal, shallow marine areas. In future SEANERGY versions, bathymetry data could be included in the SEANERGY calculations to prevent marine uses with different vertical scales from being considered spatial compatible in marine areas too shallow for multi-use.
4.4.3. Land-sea integration
Currently, SEANERGY only focuses on non-terrestrial uses with the exceptions such as harbours, bridges, and bathing that are both marine and terrestrial, linking sea and land that are connected through ecosystem services and substances (Weig and Schultz-Zehden Citation2019). Harbours are particularly important land-sea connectors, since they constitute economic and physical land-sea crossing points (Bonnevie, Hansen, and Schröder Citation2020). However, marine uses might also interact with terrestrial uses through visibility linkages. For example, offshore wind farms might visually disturb some people enjoying ocean views from land, while oil rigs on land might visually disturb recreational sailors close to land (Bonnevie, Hansen, and Schröder Citation2019). In future analyses, SEANERGY results could advantageously be compared with maps visualising landscape-dependent/landscape-disturbing terrestrial coastal uses to initiate land-sea interaction discussions. Furthermore, it is important when defining SEANERGY conflict-synergy scores to discuss: Who benefit from/are impacted by the synergies/conflicts, and where on land are the beneficiaries/impacted people located? (Weig and Schultz-Zehden Citation2019).
5. Conclusion
The oceans continue to experience expanding human activities and thereby growing pressures on the environment and on marine space. The increasingly occupied oceans both presents a need for handling use-use interactions and for going towards more integrative MSP processes. The ambition to consider marine use coexistence is directly stated as a requirement by law in the MSP Directive. Whereas DSTs already exist to support analyses for avoiding too high pressures on the environment, DSTs that also consider synergies between marine uses have been lacking. SEANERGY is a DST that enables spatial options to explore potential use-use synergies and conflicts.
By using the Baltic Sea Region as a demonstration area that has a long tradition for cross-national MSP, a SEANERGY cross-sectoral use catalogue has been deduced for answering various specific use-use conflict-synergy questions of MSP relevance. SEANERGY enables maritime spatial planners to weight different potential synergies, conflicts, multi-use potentials, and spatial compatibility potentials spatially and numerically, for cumulated marine uses and for individual marine uses, for overall maps and for local raster cells, as well as for already located marine uses and new marine uses. The flexibility of the four main SEANERGY tools urges MSP stakeholders including planners and sector representatives to use the tools iteratively to explore different non-spatial/spatial conflict-synergy patterns. For example, the Baltic Sea analysis based on many tool outcomes shows a difference between marine use input score potentials and spatial conflict-synergy patterns.
With its options to explore cross-sectoral knowledge, SEANERGY contributes to MSP integration in all four analytical integrative dimensions; knowledge integration, sector-policy integration; stakeholder integration, and transboundary-multi-scale-land-sea-integration. However, besides strengthening MSP integration, SEANERGY also depends on integrated MSP. Harmonised GIS-data as well as cross-sectoral conflict-synergy knowledge need to exist for the area in focus, and existing forums for stakeholder engagement need to exist for enabling SEANERGY to be operationalised. To enable even more integrative MSP, SEANERGY could advantageously be combined with environmental sustainability DSTs, and it could be extended in future implementations to e.g. better support a land-sea interaction perspective. However, SEANERGY already in its current form constitute a novel spatial approach to enable a focus on cross-sectoral interactions, facilitating more integrative MSP directly through synergy-conflict outcomes and indirectly through capacity building.
Software availability
Name of software: SEANERGY.
Developer: Ida Maria Bonnevie
E-mail: [email protected]
Year first available: 2020
Available here: https://github.com/IdaMBonnevie/SEANERGY.git with a readme file, and a pre-processing tool is available here: https://github.com/IdaMBonnevie/SEANERGY-preprocessing.git.
Tool presentation: SEANERGY is an ArcMap-based toolbox with tools developed in Python for spatially locating potential synergies and conflicts between marine uses based on a pairwise comparison matrix. For software and license dependencies, see metadata in the tool package and Bonnevie, Hansen, and Schröder (Citation2020).
Supplementary_Material
Download MS Word (4.9 MB)Acknowledgements
This research is carried out within the project ‘Baltic Sea Maritime Spatial Planning for Sustainable Ecosystem Services (BONUS BASMATI)’, which has received funding from BONUS (art. 185), call number: call2015-77, funded jointly by the EU, Innovation Fund Denmark, Swedish Research Council, Formas, Academy of Finland, Latvian Ministry of Education, and Science and Forschungszentrum Julich GmbH (Germany).
Disclosure statement
No potential conflict of interest was reported by the author(s).
Additional information
Funding
References
- Blenckner, T., H. Österblom, P. Larsson, A. Andersson, and R. Elmgren. 2015. “Baltic Sea Ecosystem-Based Management Under Climate Change: Synthesis and Future Challenges.” AMBIO 44 (3): 507–515. doi:10.1007/s13280-015-0661-9.
- Bonnevie, I., H. S. Hansen, and L. Schröder. 2019. “Assessing use-use Interactions at Sea: A Theoretical Framework for Spatial Decision Support Tools Facilitating Co-Location in Maritime Spatial Planning.” Marine Policy 106: 103533. doi:10.1016/j.marpol.2019.103533.
- Bonnevie, I., H. S. Hansen, and L. Schröder. 2020. “SEANERGY - a Spatial Tool to Facilitate the Increase of Synergies and to Minimise Conflicts Between Human Uses at sea.” Environmental Modelling & Software 132: 104808. doi:10.1016/j.envsoft.2020.104808.
- Burnett, C. M. 2020. “Incorporating the Participatory Process in the Design of Geospatial Support Tools: Lessons Learned From SeaSketch.” Environmental Modelling & Software 127: 104678. doi:10.1016/j.envsoft.2020.104678.
- Coccoli, C., I. Galparsoro, A. Murillas, K. Pınarbaşı, and J. A. Fernandes. 2018. “Conflict Analysis and Reallocation Opportunities in the Framework of Marine Spatial Planning: A Novel, Spatially Explicit Bayesian Belief Network Approach for Artisanal Fishing and Aquaculture.” Marine Policy 94: 119–131. doi:10.1016/j.marpol.2018.04.015.
- EC. 2012. Blue Growth Opportunities for Marine and Maritime Sustainable Growth. Communication from the Commission to the European Parliament, the Council, the European Economic and Social Committee and the Committee of the Regions COM (2012) 494 Final. Publications Office of the European Union, Luxembourg.
- EC. 2014. “Directive 2014/89/EU Establishing a Framework for Maritime Spatial Planning.” Official Journal of European Union L257: 135–145.
- Gee, K., N. Blazauskasb, K. Dahl, C. Göke, B. Hassler, A. Kannen, N. Leposa, et al. 2019. “Can Tools Contribute to Integration in MSP? A Comparative Review of Selected Tools and Approaches.” Ocean and Coastal Management 179: 104834. doi:10.1016/j.ocecoaman.2019.104834.
- Gee, K., A. Kannen, R. Adlam, C. Brooks, M. Chapman, R. Comier, C. Fischer, et al. 2017. “Identifying Culturally Significant Areas for Marine Spatial Planning.” Ocean and Coastal Management 136: 139–147. doi:10.1016/j.ocecoaman.2016.11.026.
- Gimpel, A., V. Stelzenmüller, S. Töpsch, I. Galparsoro, M. Gubbins, D. Miller, A. Murillas, A. G. Murray, ı,K Pınarbas, and R. Watret. 2018. “A GIS-Based Tool for an Integrated Assessment of Spatial Planning Trade-Offs with Aquaculture.” Science of The Total Environment 627: 1644–1655. doi:10.1016/j.scitotenv.2018.01.133.
- Hansen, H. S. 2019. “Cumulative Impact of Societal Activities on Marine Ecosystems and Their Services. In: ICCSA 2019: 19th International Conference, Saint Petersburg, Russia, July 1–4, 2019, Proceedings, Part III, Lecture Notes in Computer Science (LNCS), Vol. 11621. Springer, Switzerland. 577–490, https://doi.org/10.1007/978-3-030-24302-9_41
- Jay, S., F. L. Alves, C. O'Mahony, M. Gomez, A. Rooney, M. Almodovar, K. Gee, et al. 2016. “Transboundary Dimensions of Marine Spatial Planning: Fostering Inter-Jurisdictional Relations and Governance.” Marine Policy 65: 85–96. doi:10.1016/j.marpol.2015.12.025.
- Kirkfeldt, T. 2019. “An Ocean of Concepts: Why Choosing Between Ecosystem-Based Management, Ecosystem-Based Approach and Ecosystem Approach Makes a Difference.” Marine Policy 106: 103541. doi:10.1016/j.marpol.2019.103541.
- Klinger, D. H., A. M. Eikeset, B. Davíðsdóttir, A.-M. Winter, and J. R. Watson. 2018. “The Mechanics of Blue Growth: Management of Oceanic Natural Resource use with Multiple, Interacting Sectors.” Marine Policy 87: 356–362. doi:10.1016/j.marpol.2017.09.025.
- Kull, M., J. R. Moodie, H. L. Thomas, S. Mendez-Roldan, A. Giacometti, A. Morf, and I. Isaksson. 2019. “International Good Practices for Facilitating Transboundary Collaboration in Marine Spatial Planning.” Marine Policy in press: 103492. doi:10.1016/j.marpol.2019.03.005.
- Li, S., and S. Jay. 2020. “Transboundary Marine Spatial Planning Across Europe: Trends and Priorities in Nearly Two Decades of Project Work.” Marine Policy 118: 104012. doi:10.1016/j.marpol.2020.104012.
- Menegon, S., D. Depellegrin, G. Farella, E. Gissi, M. Ghezzo, A. Sarretta, C. Venier, and A. Barbanti. 2018. “A Modelling Framework for MSP-Oriented Cumulative Effects Assessment.” Ecological Indicators 91: 171–181. doi:10.1016/j.ecolind.2018.03.060.
- Morf, A., M. Kull, J. Piwowarczyk, and K. Gee. 2019b. “Towards a Ladder of MSP Participation.” In Maritime Spatial Planning, Past, Present, Future, edited by J. Zaucha, and K. Gee, 219–243. London: Palgrave Macmillian.
- Morf, A., J. Moodie, K. Gee, A. Giacometti, M. Kull, J. Piwowarczyk, K. Schiele, et al. 2019a. “Towards Sustainability of Marine Governance: Challenges and Enablers for Stakeholder Integration in Transboundary Marine Spatial Planning in the Baltic Sea.” Ocean and Coastal Management 177: 200–212. doi:10.1016/j.ocecoaman.2019.04.009.
- Papageorgiou, M., and S. Kyvelou. 2018. “Aspects of Marine Spatial Planning and Governance: Adapting to the Transboundary Nature and the Special Conditions of the Sea.” European Journal of Environmental Sciences 8 (1): 31–37. doi:10.14712/23361964.2018.5.
- Piwowarczyka, J., K. Gee, M. Gilekc, B. Hasslerc, A. Luttmannd, L. Maackd, M. Matczake, et al. 2019. “Insights Into Integration Challenges in the Baltic Sea Region Marine Spatial Planning: Implications for the HELCOM-VASAB Principles.” Ocean and Coastal Management 175: 98–109. doi:10.1016/j.ocecoaman.2019.03.023.
- Pınarbaşı, K., I. Galparsoro, Á Borja, V. Stelzenmüller, C. N. Ehler, and A. Gimpel. 2017. “Decision Support Tools in Marine Spatial Planning: Present Applications, Gaps and Future Perspectives.” Marine Policy 83: 83–91. doi:10.1016/j.marpol.2017.05.031.
- Rönneberg, M., S. Q. Eliasen, P. Kettunen, C. Koski, and J. Oksanen. 2019. “Designing Access Control of a Spatial Decision Support System for Collaborative Maritime Spatial Planning.” In Adjunct Proceedings of the 15th International Conference on Location-Based Services, LBS 2019, 11–13 November 2019, Vienna, Austria, edited by G. Gartner, and H. Huang, 271–276. https://doi.org/10.34726/lbs2019.28.
- Schupp, M. F., M. Bocci, D. Depellegrin, A. Kafas, Z. Kyriazi, I. Lukic, A. Schultz-Zehden, G. Krause, V. Onyango, and B. H. Buck. 2019. “Toward a Common Understanding of Ocean Multi-use.” Frontiers in Marine Science 6 (165): 1–12. doi:10.3389/fmars.2019.00165.
- Soma, K., J. van Tatenhove, and J. van Leeuwen. 2015. “Marine Governance in a European Context: Regionalization, Integration and Cooperation for Ecosystem-Based Management.” Ocean and Coastal Management 117: 4–13. doi:10.1016/j.ocecoaman.2015.03.010.
- von Thenen, M., H. S. Hansen, and K. S. Schiele. 2020. “SPACEA: A Custom-Made GIS Toolbox for Basic Marine Spatial Planning Analyses.” In ICCSA 2020: 20th International Conference, Cagliary, Italy, July 1-4 2020, Proceedings, Part IV, Lectuure Notes in Computuer Science (LNCS), Vol. 12252. Springer, Switzerland, 394–404. https://doi.org/10.1007/978-3-030-58811-3_28.
- Weig, B., and A. Schultz-Zehden. 2019. “Spatial Economic Benefit Analysis: Facing Integration Challenges in Maritime Spatial Planning.” Ocean and Coastal Management 173: 65–76. doi:10.1016/j.ocecoaman.2019.02.012.