
 ?Mathematical formulae have been encoded as MathML and are displayed in this HTML version using MathJax in order to improve their display. Uncheck the box to turn MathJax off. This feature requires Javascript. Click on a formula to zoom.
ABSTRACT
During the COVID-19 epidemic in Wuhan, China, a series of measures were implemented by the government to prevent the spread of disease, including the lockdown policy and construction of emergency hospitals. To estimate the impact of these measures on aquatic environments, turbidity of lakes in Wuhan was dynamically monitored by integrating multi-sensor satellite observations. Calibrated against field measurements, empirical turbidity models were developed with high accuracy (R2 = 0.77, RMSE = 3.13 NTU). Time series of lake turbidity during COVID-19 were then retrieved, and possible factors for the turbidity change were discussed, including meteorological conditions and human activities. Results demonstrated that (1) the mean turbidity showed a 24.9% decline from 33.4 NTU to 25.1 NTU after the lockdown in Wuhan, which dropped 16.0% compared to that in the previous year. This decline might be related to the sharp reduction in human activities after the lockdown; (2) no obvious turbidity disturbance was observed in the lakes around emergency hospitals during their construction, and the lakes remained stable after the operation of hospitals. The method of integrating multi-sensor satellite observations used in this study shows great performance in term of temporal resolution for dynamic monitoring of inland water.
1. Introduction
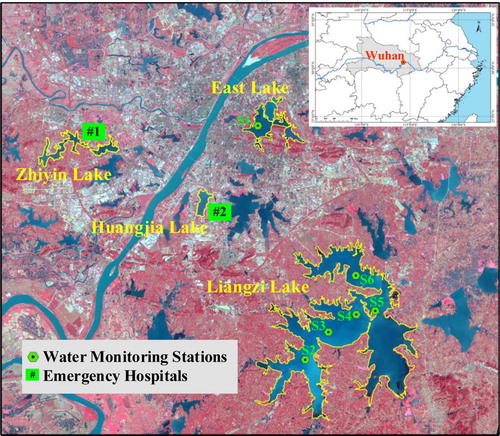
Inland lakes are important ecological systems in the Earth’s surface which closely relate to human life and production (Xu et al. Citation2018). Wuhan, in central China, has more than 100 lakes that comprise a large aquatic ecosystem network. This network can supply rich drinking water for local residents and provide critical ecological functions (Guan et al. Citation2020). Water quality of lakes within or nearby built-up areas can directly or indirectly affect citizens’ life and health. Accurate monitoring and appropriate managements of urban lakes are important for both environment and society. At the beginning of 2020, the COVID-19 epidemic spread over Wuhan and the local government rapidly took a series of measures, such as constructing emergency hospitals and implementing lockdown policy. Two emergency hospitals, Huoshenshan Hospital (HH) and Leishenshan Hospital (LH), were built within 10 days, which started on 25 January 2020 and went into operation on 5 February 2020. Under strict regulations in Wuhan, most of commercial activities, social contacts, and people’s movement reduced sharply even to a full stop. Public transportation was shut off, stores and factories were closed, and residents were requested to stay at home. Many lakeside tourist attractions were also closed and shipping activities were shut down. During this special period, whether the aquatic environment remained stable or changed and how it responded to the dramatic decrease in human activities awaited answers. In addition, as HH and LH are located near two urban lakes (Huangjia Lake and Zhiyin Lake; see ), the water quality of these lakes should be accurately monitored during the construction and operation because hospitals may be potential pollution sources. In this regard, timely dynamic monitoring of water quality of Wuhan lakes during the COVID-19 epidemic is important and necessary.
Figure 1. Location of Wuhan city and the study area. The green dots represent the fixed water quality monitoring stations and the green squares represent emergency hospitals (HH and LH). Several major lakes in this study are marked by yellow lines. The map is made by Landsat 8/OLI image, with RGB of band5, band4, and band3. (Colour online)
Turbidity is one of the most important water quality parameters, which is commonly used in coastal and inland water environment monitoring (Chen, Hu, and Muller-Karger Citation2007; Petus et al. Citation2010; Güttler, Niculescu, and Gohin Citation2013). As an optical property, turbidity is measured as the amount of light scattered by suspended particles in water column that directly affect light attenuation under water (Davies-Colley and Smith Citation2001; Kirk Citation1985). Turbidity can also be used as an indicator of water pollution and eutrophication given that suspended sediments are often pollutant carriers where heavy metals and organic matters can accumulate and attach (Point et al. Citation2007; Stoichev et al. Citation2004). Temporal and spatial distribution of lake turbidity can well describe the basic status and dynamic change of water quality. Therefore, turbidity is an ideal water quality index for environmental monitoring of inland lakes.
Satellite remote sensing has become the main technology for lake environment monitoring and management in past decades (Vignolo, Pochettino, and Cicerone Citation2006; Chen and Feng Citation2018). Compared with traditional ship-based surveys, remote sensing has larger coverage, lower cost, and greater capability of obtaining synchronous observations over large waters at a high frequency (Ritchie, Zimba, and Everitt Citation2003; Mouw et al. Citation2015). The monitoring of lake turbidity in Wuhan requires both high spatial and temporal resolution to ensure that the continuous changes of turbidity during the COVID-19 epidemic can be captured and tracked. However, meeting these requirements remains challenging (IOCCG, 2000 Citation2000; Palmer, Kutser, and Hunter Citation2015) due to the inter-constraint among sensor’s spatial, temporal, and spectral resolutions. Moderate-resolution sensors, such as Visible Infrared Imaging Radiometer Suite (VIIRS) and Ocean and Land Colour Instrument (OLCI) can be effectively applied in ocean and coastal environment monitoring with high temporal resolution and good radiometric performance. However, for inland lakes with smaller areas, VIIRS (ground resolution: 375 m) and OLCI (ground resolution: 300 m) are too coarse to describe the spatial distribution of lake turbidity in detail. As a result, some high-resolution sensors like Landsat/TM/ETM+/OLI and Sentinel/MSI are employed to retrieve turbidity and other water parameters, although they might be not designed for water colour observation. For example, Sentinel-2/MSI data was used to analyse the short-term changes of turbidity in Ganga River during the COVID-19 lockdown of India (Garg, Aggarwal, and Chauhan Citation2020). Bonansea et al. (Citation2015) used Landsat imageries including TM and ETM+ to estimate chlorophyll-a (Chl-a) concentrations and Secchi disk transparency of reservoirs. Kuhn et al. (Citation2019) showed that Landsat-8 and Sentinel-2 had good performance in turbidity and Chl-a estimation. The HY-1C/CZI (Haiyang-1C, Coastal Zone Imager), launched on 7 September 2018, is a new sensor added to China ocean satellite series for water colour observation (Cheng et al. Citation2019). With a high spatial resolution of 50 m and a large swath width of 950 km, CZI can scan the entire Earth’s surface every 3 days. The good balance between spatial and temporal resolution makes CZI a powerful tool for dynamic monitoring of inland lakes.
The strategy of integrating multi-sensor observations has been proved to improve monitoring capability in terms of spatial and temporal resolutions by previous researches (Goetz, Gardiner, and Viers Citation2008). It was found that jointly using Landsat-8 and Sentinel-2 can significantly improve the observation frequency over inland waters (Chen, Zhu, et al. Citation2020). Swain and Sahoo (Citation2017) integrated MODIS and Landsat satellite data to obtain solute concentrations at a temporal resolution of 1 d and a spatial resolution of 30 m, which was sufficient for monitoring inland rivers. Furthermore, Li and Roy (Citation2017) made a global summary statistic and demonstrated that combination of Landsat-8, Sentinel-2A, and Sentinel-2B could provide a global median average revisit interval of 2.9 days. With multi-sensor satellite data, more opportunities for cloud-free surface observations are available, thus high-dynamic changes in waters can be captured.
In this study, we integrated multi-sensor satellite observations (Landsat8/OLI, Sentinel-2/MSI, and HY-1C/CZI) and in-situ measurements to monitor lake turbidity in Wuhan from December 2019 to February 2020, which covers the entire period of the major measures against COVID-19 epidemic. In-situ turbidity measurements from fixed stations were used to establish accurate turbidity models and then produce the time series of lake turbidity maps. Spatial and temporal variation of lake turbidity in Wuhan during the COVID-19 epidemic were analysed, and possible affecting factors were discussed from aspects of meteorological conditions and human activities. Two main questions were focused and expected to be answered in this paper: (1) how did Wuhan lakes’ environment change during the COVID-19 epidemic? (2) did the construction and operation of HH and LH affect the water quality of nearby lakes? This study will contribute to the understanding of relationships between lake environment variation and human activities and provide some advice for decision makers and lake managers.
2. Study area and datasets
2.1. Study area
Wuhan city (29°58′–31°22′N, 113°41′–115°05′E), in central China, is situated in the middle reaches of the Yangtze River (see ). With more than100 lakes, 26% of Wuhan area is covered by water. Wuhan has a subtropical monsoon climate with a mean annual temperature range of 15.8–17.5°C and an annual average rainfall of 1050–2000 mm (Shen et al. Citation2016). The largest lake in Wuhan, Liangzi Lake, has an area of 362.5 km2 and a mean water depth of 3.2 m (Xu et al. Citation2018). It can store a large volume of water and is regarded as an alternative potable water source for Wuhan city. East Lake is the biggest scenery tourist attraction in Wuhan and also the largest lake within a city in China. Wuhan lakes provide many public entertainment and leisure places for local people which make these lakes directly related to human activities. With rapid urbanization and industrialization in the past 40 years, Wuhan lakes have suffered the problems of eutrophication(Li, Huang, and Wang Citation2020), non-point pollution(Pujing et al. Citation2013) and lake area shrinkage(Wu and Xie Citation2011).
According to previous studies, the main sources of suspended particle matters in Wuhan lakes include river flowing input, land surface runoff input, and human activities (industry, agriculture, and aquaculture). Water diversion facilities and lake-river connection projects, which has been implemented since 2000s in Wuhan, could increase water exchange between lakes and rivers, thereby bring about sediments transport (Ban et al. Citation2014). Particle matters and soil particles from the lake banks could also be brought into lakes through land surface runoff during rain and snow (Peng et al. Citation2012). Besides, sewage discharge from households or factories, engineering constructions, and tourism development around lakes are all potential sources of particle matters and pollutants (Pujing et al. Citation2013; Wang, Zhang, et al. Citation2018).
Since 8 December 2019, a large number of COVID-19 patient cases had been reported in Wuhan (Chen, Zhou, et al. Citation2020). To protect and treat patients, the Chinese central government decided to put a lockdown in Wuhan since 23 January 2020. On 25 January 2020, the central government started to build two emergency hospitals, namely HH (#1 in ) near Zhiyin Lake and LH (#2 in ) near Huangjia Lake. The lockdown policy requested all residents to stay at home thereby halting almost all activities in the whole city (http://www.wh.gov.cn/2019_web/whyw/202001/t20200123_304082.html, accessed on 10 March 2020). Public parks, greenways, and scenic spots were closed, and factories, schools, and stores were shut down. A lot of lakeside entertainment activities like boating over East Lake also stopped. Human activities sharply reduced during this period.
2.2. Datasets
2.2.1. Multi-sensor satellite images
Satellite images of three sensors, Landsat-8/OLI, Sentinel-2/MSI, and HY-1C/CZI, were collected to obtain the highest possible temporal resolution. The characteristic parameters of the three sensors were shown in . The time series of satellite images was shown in where the major events during the COVID-19 epidemic were also marked.
Figure 2. Number statistics of Landsat-8/OLI, Sentinel-2/MSI, and HY-1C/CZI images used in this study and the time coverage for major events during the COVID-19 epidemic. (Colour online)
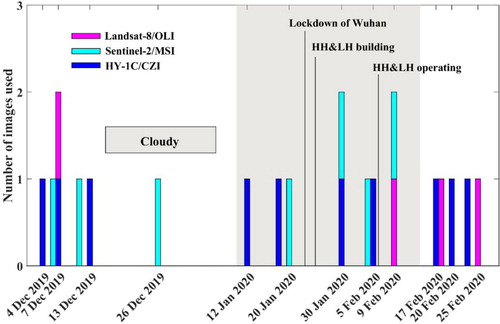
Table 1. Basic characteristic parameters of Landsat-8/OLI, Sentinel-2/MSI and HY-1C/CZI.
Landsat-8/OLI, launched on 11 February 2013, is a successor to Landsat-7. It has a spatial resolution of 30 m, a revisit period of 16 days, and a configuration of 9 bands. Sentinel-2/MSI is a constellation of two polar-orbiting satellites (Sentinel-2A and Sentinel-2B) that are placed in the same sun-synchronous orbit and phased at 180° to each other. With the combination of two satellites, Sentinel-2/MSI can provide a high temporal resolution of 5 days (2–3 days in overlapping areas) and a high spatial resolution of 10 m at VIS-NIR bands. HY-1C is China’s latest ocean-observing satellite which was launched on 7 September 2018 (Cheng et al. Citation2019). It carries a four-channel, wide-band coastal zone imager (CZI), which has a resolution of 50 m, a swath width of 950 km, and a revisit period of 3 days. The three sensors have similar band settings but different bandwidths in visual range, as shown in . Especially, the red, green, and blue bands of the three sensors have very close central wavelengths.
By visual judgment, we selected high-quality and cloud-free satellite images over Wuhan from June 2018 to February 2020. A total of 26 cloud-free Landsat-8/OLI images, 40 Sentinel-2/MSI images, and 20 HY-1C/CZI images were downloaded from USGS (U.S. Geological Survey https://earthexplorer.usgs.gov/), Copernicus Open Access Hub (https://scihub.copernicus.eu/) and NSOAS (National Satellite Ocean Application Service, https://osdds.nsoas.org.cn/), respectively. The dataset was separated into two parts. The images from June 2018 to November 2019 were matched with in-situ turbidity measurements to develop and validate the turbidity models. The images after November 2019, overlapping the timeline of the COVID-19 epidemic were used for the analysis of the spatio-temporal variations in lake turbidity.
As shown in , three major events occurred during the COVID-19 epidemic: the lockdown of Wuhan, the construction and operation of HH and LH. Combination of 11 CZI images, 7 MSI images, and 4 OLI images could completely cover the three major events, despite the partly cloudy weather. Specifically, four images were within the construction period of HH and LHs, providing a detailed observation of the building process. In terms of spatial and temporal resolution, the dataset was sufficient to track lake turbidity changes during the COVID-19 epidemic and answer the questions proposed above: how the lake environment change during the COVID-19 epidemic; and whether the construction and operation of HH and LH affected the nearby lakes’ turbidity.
2.2.2. In-situ turbidity measurement
Six water quality monitoring stations were distributed in lakes of Wuhan, and their locations are shown in . Turbidity was measured using the LFWCS-2008 water quality analyzer (LIHERO Technology limited company, http://ww.lihero.com/index.aspx) based on the right angle light scattering method at wavelength of 436 nm (Matsuzaki et al. Citation2000). The turbidity value was in the standard unit of Nephelometric Turbidity Unit (NTU) and measured once every 1 or 4 h(s). The high observation frequency provided excellent opportunities for matching in-situ measurements with synchronous satellite observations. To keep the time gap between the field measurements and satellite observations within 3 h (Zibordi et al. Citation2009; Hlaing et al. Citation2014), we screened the turbidity measurements using a time-window of 8:00 to 12:00 since the three satellites passed at about 10:00 local time. The basic statistic of the in-situ turbidity measurements from June 2018 to November 2019 were shown in . In general, the turbidity value of lakes in Wuhan ranged from 0 NTU to 110 NTU. This large dynamic range represented distinctive optical features of different waters which facilitated the establishment of robust turbidity models. The in-situ data were then matched with synchronous satellite observations to generate turbidity models, which was detailed in Section 4.1.
Table 2. Statistic parameters of the field turbidity measurement in Wuhan (unit: NTU).
2.2.3. Meteorological data
Daily accumulated precipitation (mm) dataset was acquired from the website of NASA GES DISC (Goddard Earth Sciences Data and Information Service Center, https://disc.gsfc.nasa.gov/datasets/). The products of GPM L3, by 1 d and 0.1° × 0.1°, were downloaded and then averaged over Wuhan to represent the intensity of rainfall.
Daily wind speed data of Wuhan was collected from China’s weather website (http://www.weather.com.cn/), and was scaled by a Beaufort scale classification system from level 0 to 12. The rainfall and wind force datasets were used for factor analysis of turbidity variation.
3. Methods
3.1. Processing of satellite data
The L1TP products of Landsat-8/OLI had been radiometrically calibrated and geometrically corrected. The procedure of Atmospheric Correction for OLI ‘lite’ (ACOLITE) was used for accurate atmosphere correction (Vanhellemont and Ruddick Citation2015). A SWIR model, which used a band ratio of Rayleigh-corrected reflectance to determine aerosol type for per-pixel, was selected to achieve better performance over inland lakes. Moreover, land and clouds were masked using the Rayleigh-corrected reflectance at the SWIR band with a threshold of 0.05 (Braga et al. Citation2017). The ACOLITE-derived remote sensing reflectance Rrs (sr−1) was used in the subsequent turbidity modelling and retrieving.
The L1C products of Sentinel-2/MSI, which had been processed by radiometric and geometric corrections, were collected in this study. As well, we used ACOLITE to remove atmospheric effects in images and obtained remote sensing reflectance Rrs (sr−1). Using the same atmosphere correction method as Landsat-8 could improve the consistency between two sensors’ reflectance and downstream products.
As for HY-1C/CZI, we gathered the L1C products which had been processed by system geometric correction and radiometric calibration. We re-projected the CZI images to UTM (WGS84) to keep the same coordinate reference as OLI and MSI. Considering there was no mature atmospheric correction tool for CZI who has only one NIR band, we adopted a partial atmosphere correction method (Rayleigh correction) to remove the atmospheric Rayleigh scattering and gas absorption effects (Hu et al. Citation2004). Aerosol correction for CZI over inland turbid waters was difficult to conduct because it lacked a SWIR band that is essential for the determination of aerosol types (Hu, Carder, and Muller-Karger Citation2000). Nevertheless, given that we had visually selected cloud-free images and avoided thick aerosol, the residual aerosol scattering effect after Rayleigh correction was deemed negligible (Feng et al. Citation2018). Rayleigh-corrected reflectance has been proved applicable to the retrieval of water quality parameters in the existing literatures (Cao et al. Citation2017; Feng et al. Citation2012; Zhou et al. Citation2020). Then we used a shape-file of the lakes’ boundary generated by the atmosphere-corrected Landsat-8/OLI images to clip and mask the land area in the CZI images. The Rayleigh-corrected reflectance Rrc (λ) (sr−1) was used for turbidity modelling and retrieving.
3.2. Turbidity retrieval algorithm
Previous literatures suggested two types of turbidity retrieval algorithms: semi-empirical models and empirical models. Turbidity, as an optical property, is highly correlated with aquatic reflectance through the backscattering coefficient at red and NIR band (Dogliotti et al. Citation2015). On the basis of this correlation, several semi-empirical single-band based turbidity retrieval algorithms were proposed (Nechad, Ruddick, and Neukermans Citation2009; Dogliotti et al. Citation2015). However, semi-empirical models are mostly complex with many undetermined coefficients, some of which need to be determined by inherent optical properties (IOPs) measurements. Unfortunately, in this study, IOPs were not measured at the fixed stations. Thus, empirical model was considered in this study, as it could fit better to local aquatic optical properties and involve a simple computation. The exponential relationship between in-situ turbidity measurement and satellite-derived Rrs (sr−1) in red band was established in the previous researches (Constantin, Doxaran, and Constantinescu Citation2016; Joshi et al. Citation2017), which was similar to the pattern of total suspended matters (TSM) versus band reflectance (Doxaran, Froidefond, and Castaing Citation2002). This exponential pattern could be attributed to the basic law that the water backscattering coefficient increased with the increasing concentration of suspended matters or turbidity. Besides, multi-band combination and band ratios have been also widely used to derive turbidity. The multi-band model is more stable than the single-band model because the atmospheric residual error and the effects of illumination conditions can be reduced by band ratios (Doxaran, Froidefond, and Castaing Citation2002). High correlations between band ratios of red/NIR, red/green, NIR/green and turbidity value were proved in (Abirhire et al. Citation2020) who determined the best model through non-linear least-square regression. For lakes in Wuhan, we developed an empirical turbidity retrieval model on the basis of the exponential relationship between turbidity value (NTU) and the red/green band ratio:
(1)
(1) where a, b and c were the undetermined coefficients that could be calibrated by field turbidity measurements through least-square regression method. Rrs (red) and Rrs (green) were the satellite-derived remote sensing reflectance at the red and green bands.
4. Results
4.1. Model development and validation
Three turbidity models specific to each sensor were developed individually using respective sample sets. The samples were obtained by matching up the field observations with the mean Rrs value of the closest 3× 3 pixels in the satellite images. After removing outliers, 47 samples for OLI, 33 samples for MSI and 19 samples for CZI were retained to calibrate coefficients a, b, and c in Equation (1).
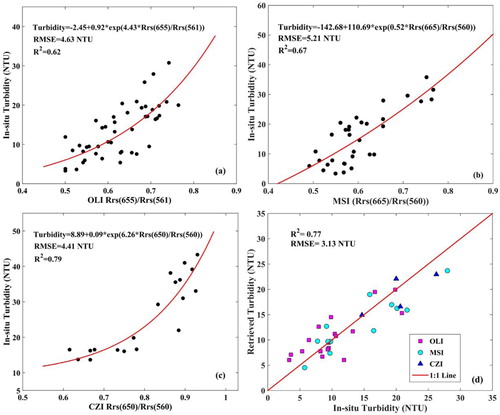
illustrates that all three turbidity models perform well: the determinant coefficients (R2) are 0.62 for OLI, 0.67 for MSI and 0.79 for CZI; and the root mean square error (RMSE) are 4.63, 5.21 and 4.41 NTU respectively. An individual set of samples was reserved to validate the models, as shown in (d). Satellite-derived turbidity values agree well with the in-situ turbidity measurements. The scatter points are evenly distributed around 1:1 line with R2 of 0.75 and RMSE of 2.65 NTU. The accuracy of the three models indicates that they are adequate for the monitoring of lake turbidity in Wuhan.
Figure 3. The development and validation of the turbidity retrieval models. (a) OLI-based turbidity retrieval model, plotted by Rrs(655 nm)/Rrs(561 nm) versus the in-situ turbidity measurement; (b)MSI-based turbidity retrieval model, plotted by Rrs(655 nm)/Rrs(561 nm) versus the in-situ turbidity measurement; (c) CZI-based turbidity retrieval model, plotted by Rrs(664 nm)/Rrs(560 nm) versus the in-situ turbidity measurement; (d) validation of turbidity retrieval models, plotted by the in-situ turbidity value and the satellite-derived turbidity value. (Colour online)
4.2. Consistency of multi-sensor derived turbidity
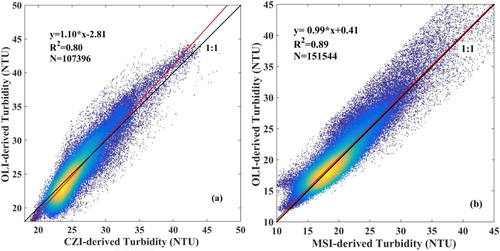
Ensuring high consistency of multi-sensor derived turbidity is a precondition to obtain an accurate temporal variation trend. We selected the largest lake (Liangzi Lake) as the object and searched four synchronous images of OLI, MSI, and CZI to validate the consistency of the three sensors’ turbidity results. Setting OLI as a benchmark, we compared its turbidity result with those from MSI and CZI. The consistency among the three sensors in spatial distribution and quantitative value are shown in and , respectively.
Figure 4. Synchronous comparison of multi-sensor derived turbidity maps in Liangzi Lake. Landsat-8/OLI was regarded as a benchmark and compared with HY-1C/CZI and Sentinel-2/MSI on 29 October 2019 and 9 February 2020, respectively. (Colour online)
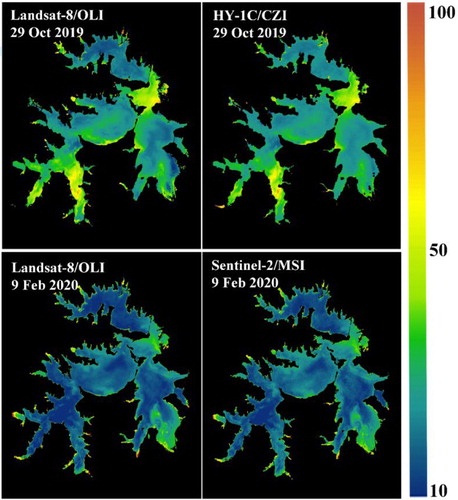
Figure 5. Consistency of multi-sensor derived turbidity. (a) scatterplot of turbidity results derived from OLI and CZI; (b) scatterplot of turbidity results derived from OLI and MSI. Note that the red solid lines are the optimal fitting curves corresponding to the regression equation. (Colour online)
Visually, the two pairs of images reveal similar spatial patterns of turbidity in Liangzi Lake (). On 29 October 2019, both OLI and CZI derived turbidity maps showed that the northern, south-eastern and central area of the lake were clearer than the southwest and middle-east area. On 9 February 2020, two patches of highly turbid water in the southeast and middle-east areas of Liangzi Lake were apparent in both OLI and MSI turbidity maps.
Furthermore, we quantitatively estimated the consistency of three sensors’ turbidity results at pixel level through resizing OLI results into a size of 10 and 50 m same as MSI and CZI respectively. As shown in , the scatter points are averagely distributed near 1:1 line, and the slopes of two optimal fitting lines are very close to 1, despite the slight bias. The high correlation coefficient (R2) among three sensors (0.80 for OLI-CZI and 0.89 for OLI-MSI) indicated that multi-sensors derived turbidity agreed well with each other. The slight difference among three sensors’ products can be attributed to residual atmosphere effects, sensor noise, or momentary change of lakes at different visiting times. The high consistency among three sensors provides assurance for subsequent time-series analysis of lake turbidity during the COVID-19 epidemic.
4.3. Variations of turbidity during the COVID-19 epidemic
4.3.1. Overall variations of Wuhan lakes’ turbidity
On the basis of the turbidity models developed in the previous section, time series of turbidity maps over Wuhan lakes from 4 December 2019 to 25 February 2020 were retrieved, as shown in . The turbidity of Wuhan lakes presents significant changes during the COVID-19 epidemic both spatially and temporally. In the spatial aspect, the large lakes generally have lower turbidity than the small lakes, and for individual lakes, the turbidity at centre area is generally lower than that at near-shore. The northern lakes, which are situated in urban areas of Wuhan city, are more turbid than the southern lakes which are situated far from the city centre. Similar spatial patterns of Wuhan lakes’ water quality were also reported in previous literatures. (Wang, Yan, et al. Citation2018) showed that lakes in urban zone of Wuhan were in a medium or high eutrophication state while lakes in suburban were in a light eutrophication state. (Zhang and Cai Citation2019) indicated that in Liangzi Lake, better water quality and lower turbidity benefited from the stricter environment protection policy and wetland reserve projects. In the temporal aspect, the turbidity of Wuhan lakes showed a slow increase from 4 December 2019 to 26 December 2019. And during the lockdown of Wuhan, from 18 January 2020 to 9 February 2020, an obvious decline of lake turbidity was observed. On the near-daily timescale, slight spatial change or disturbance of lake turbidity could be captured ().
Figure 6. Time series of satellite-derived turbidity maps over Wuhan lakes during the COVID-19 epidemic from 4 December 2019 to 25 February 2020. (Colour online)
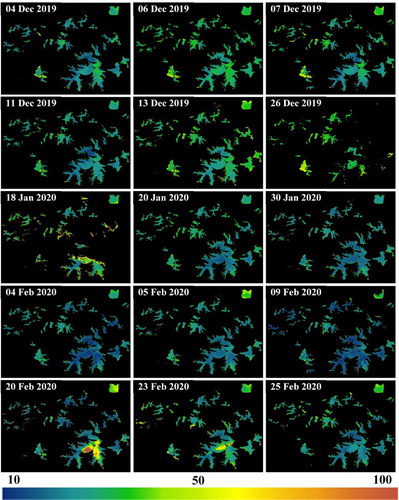
On 20 February 2020, the turbidity at the centre of Liangzi Lake presented an abnormal variation characterized by a dramatic increase. Similar phenomenon could also be found in other lakes but on a smaller scale. This occasional change continued several days from 20 February 2020 to 25 February 2020 with a gradual weakening trend. By 25 February 2020, lakes’ turbidity had fully returned to normal levels. According to local residents, there were no sudden wading events or geological disasters happening around 20 February 2020. To analyse the reasons behind this abnormal variation, we searched the meteorological records over the COVID-19 epidemic, including daily accumulated rainfall (mm) and wind force (Beaufort Scale). It was found that a fresh breeze (Beaufort Scale = 5, Direction: North) with a speed of more than 10 m/s and a slight rainfall (15 mm) happened on 15 February 2020, as highlighted by a red circle in . This dramatic increase in turbidity might be related to the fresh breeze given that many previous studies showed that strong force of wind could induce resuspension of water constituents (e.g. sediment, algae, and bottom materials) and lead to an increase in turbidity (Cho Citation2007; Penning et al. Citation2012; Xing et al. Citation2018). But this reserves further studies and verifications because wind-induced resuspension highly depended on wind speed, wind direction, local water depth, and local terrain (Vanhellemont and Ruddick Citation2014).
Figure 7. The mean turbidity of Wuhan lakes and the change trend during the COVID-19 epidemic, along with the daily accumulated precipitation records and wind force records (Beaufort Scale). The boxplots (including minimum, maximum, median, first quartile, and third quartile) of turbidity values are plotted to show spatial heterogeneity. Note that the shadow box, which represents three weeks before and after the lockdown of Wuhan, is the specific period selected for the trend analysis. The red circle highlights the fresh breeze (Beaufort Scale = 5) on 15 February 2020. (Colour online)
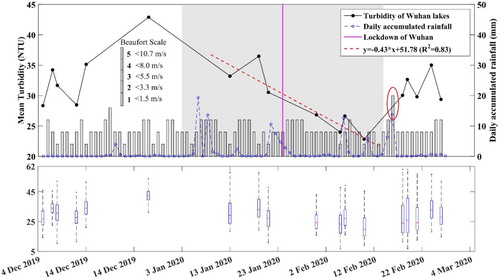
The statistics of the mean turbidity value over Wuhan lakes were plotted in . At the same time, spatial heterogeneity of turbidity was also shown in by the method of boxplot. In general, the mean turbidity of Wuhan lakes during the COVID-19 epidemic ranged from 23.5 to 43.1 NTU. It firstly increased and then decreased before increasing again. Such a change trend agreed well with the turbidity maps shown in . From December 2019 to January 2020, before the COVID-19 epidemic, lake turbidity showed a slow increasing tendency. Until the lockdown of Wuhan on 23 January 2020, the lakes’ mean turbidity remained at a high level of more than 30 NTU. After the implementation of the lockdown policy on 23 January 2020, the lake turbidity had an obvious reduction from 30.5 NTU (20 January 2020) to 22.8 NTU (9 February 2020). A trend fitting curve was plotted (red dashed line in ) over the three weeks before and after the lockdown of Wuhan (shadow area in ). The negative value of the slope (−0.43) also proved the decline trend of the lakes’ turbidity. Comparing the turbidity (three weeks’ average) before and after the lockdown, the mean turbidity of all lakes generally reduced by 24.9% from 33.4 to 25.1 NTU. In aspect of spatial heterogeneity (described as boxes), turbidity on most days presented equilibrium distributions as their median lines (red) were near to the middle of first quartile and third quartile. Before 15 February 2020, turbidity values over different lakes kept small spatial dispersions as the spaces between first quartile and third quartile were small. However, after 15 February 2020, the dispersion enlarged, which implied that higher spatial heterogeneity occurred in Wuhan lakes. This agreed with the abnormal turbidity increase in Liangzi Lake, which have been analysed in previous section.
4.3.2. Comparison with the same period of previous year
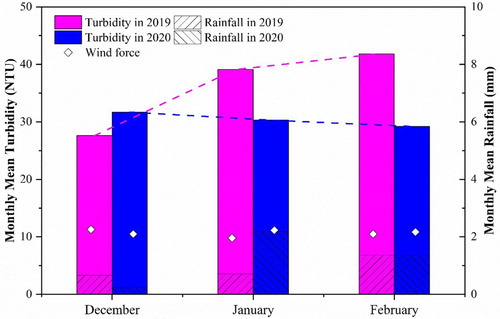
Turbidity maps of Wuhan lakes during the same period in the previous year (December 2018 to February 2019) were also retrieved based on satellite images. A comparison of the monthly mean turbidity between the COVID-19 period (December 2019 to February 2020) and the same period in the previous year was presented in . A significant difference in turbidity between the two periods was found. In December 2019 when no measures of COVID-19 were executed, the monthly mean lake turbidity was 12.6% higher than that in December 2018. After a series of measures against COVID-19 were implemented in January 2020, the lake turbidity had an obvious decrease whereas an increasing tendency was observed in the same period of 2019. Year on year, the mean turbidity for January 2020 was 22.5% lower than that in 2019; for February, the mean turbidity in 2020 became 30.1% lower than that in 2019; and the average turbidity from December to February in 2020 was 16% lower than that in 2019. Moreover, from December 2018 to February 2019, the turbidity in Wuhan lakes showed an upward trend (the magenta dashed line in ). But from December 2019 to February 2020, the turbidity showed a downward trend (the blue dashed line in ). Within the same season (winter-spring), the two periods had similar meteorological conditions (rainfall, and wind). The mean wind forces (Beaufort Scale) in the two periods were 2.1 (2019) and 2.2 (2020) respectively. And the mean rainfall in the period of COVID-19 (1.35 mm) was slightly higher than that in the previous year (1.05 mm). Generally, more rainfall will increase the river flow and land surface run-off and then induce increment in lake turbidity (Abirhire et al. Citation2020; Park et al. Citation2017). But in the period of COVID-19 with relatively heavy rainfall, Wuhan lakes presented obviously lower turbidity than the previous year. This variation might be related to the measures and controls against the COVID-19 epidemic which was discussed in section of 5.1.
Figure 8. Comparison of monthly mean turbidity over Wuhan lakes between the COVID-19 and the same period in the previous year, along with the monthly mean rainfall and wind force. Note that the wind force (Beaufort Scale) is also scaled by the right y axis. (Colour online)
4.3.3. Variation of Zhiyin Lake and Huangjia Lake during the construction and operation of HH and LH
The construction of two emergency hospitals (HH and LH) started on 25 January 2020 and were put into use on 5 February 2020. This project prompted public concern because the two hospitals were located close to Zhiyin Lake and Huangjia Lake. Generally, building constructions tends to lead turbidity increasing in nearby waters, and hospital operations may pose a potential pollution risk to nearby waters. Hence, two questions were focused on: Did the building of HH and LH disturb the water quality of Zhiyin Lake and Huangjia Lake? Would the operation of HH and LH pollute the two lakes and influence the potable water sources? To address the two questions, we analysed a series of satellite-derived lake turbidity maps spanning the whole period during and after the construction of HH and LH.
As shown in , the turbidity in Zhiyin Lake and Huangjia Lake presented homogenous spatial distribution except for some anomaly caused by land-adjacency effects around the banks. Through visual interpretation, we observed a relatively stable spatial pattern of the lakes’ turbidity during the construction of HH and LH (from 25 January 2020 to 5 February 2020). The steady distribution of turbidity during the constructions of HH and LH indicated that the construction projects hardly caused any significant disturbance to the nearby waters. After the operation of HH and LH on 5 February 2020, the turbidity showed slight changes in value but kept homogenous in spatial distribution. This indicated that the two lakes kept stable after the hospitals were put in use.
Figure 9. Turbidity variation in Zhiyin Lake and Huangjia Lake during the construction and operation of HH and LH. (Colour online)
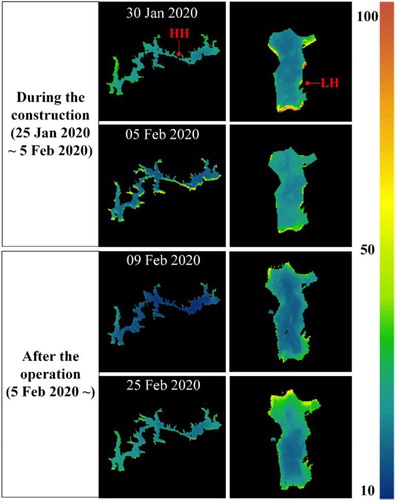
The quantitative statistics of the mean turbidity of Zhiyin Lake and Huangjia Lake and the variation trend were plotted in . The turbidity of both lakes showed an increasing trend from 4 December 2019 to 13 December 2019 (the slope of the red dashed line in is positive) and a decreasing trend from 18 January 2020 to 20 February 2020 (the slope blue dashed line in is negative). The turbidity variations of these two lakes are similar to that of all Wuhan lakes. Focusing on the phase from the lockdown of Wuhan to several days after the operation of HH and LH, Zhiyin Lake and Huangjia Lake presented an overall decreasing trend in turbidity. This might benefit from the following conditions: (1) When the HH and LH were built, strict environmental protection rules were followed and precautions were taken to avoid disturbance to nearby waters. For example, the hospitals were built with special sewage treatment stations to address wastewater issues with seven strict rules (http://www.hubei.gov.cn/zhuanti/2020/gzxxgzbd/zxtb/202002/t20200203_2018329.shtml, accessed on 10 March 2020). (2) A special structure, impervious barriers of landfill, was designed and set under the foundation of the hospitals to prevent waste water from penetrating the soil and polluting the surrounding environment.
Figure 10. Mean turbidity of Zhiyin Lake and Huangjia Lake during the COVID-19 epidemic from 4 December 2019 to 20 February 2020. Note that the red and blue dashed lines represent the changing trend of turbidity value in two phases. (Colour online)
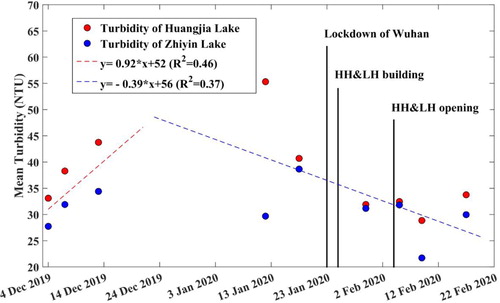
On the basis of the stable spatial patterns and decreasing trends of turbidity in Zhiyin Lake and Huangjia Lake during and after the constructions of HH and LH, it could be guaranteed that the two lakes were not significantly affected by the construction projects of HH and LH and there was no need to worry that the surrounding lakes were polluted by hospital sewage. Although the construction work and hospital operation posed potential pollution risk to nearby waters, the strict environment-protection rules by the government effectively reduced the negative influence and pollution risk on the aquatic environment.
5. Discussions
5.1. Potential factors for the variations of turbidity
Natural conditions and human activities are two key factors leading to lake turbidity changes. For Wuhan lakes, the main sources of suspended sediments include land surface run-off in the catchments (Kirk et al. Citation2000), sediments carried by flows (Park et al. Citation2017; Gelda et al. Citation2013), sewage discharge from household or industry (Peng et al. Citation2012; Li, Huang, and Wang Citation2020), and wind-induced resuspension of bottom materials (Luettich, Harleman, and SomlyÓdy Citation1990). For short-term changes of lake turbidity, occasional events (e.g. ship waving, sewage draining, and engineering construction) and meteorological conditions (e.g. rainfall and wind) may be the dominant driving factors (Miyazaki Citation2005; Bachmann, Hoyer, and Canfield Citation2000; Xing et al. Citation2018).
To analyse the reasons behind the changes of Wuhan lakes’ turbidity, the meteorological conditions including rainfall (daily accumulated precipitation, mm) and wind force (Beaufort Scale) during the COVID-19 epidemic were collected and plotted in . From December 2019 to February 2020, precipitation was little in Wuhan. The precipitations of more than 75 days out of 90 days were 0 mm. Seven rainy days were recorded but all of them had precipitations of less than 20 mm. After the lockdown of Wuhan on 23 January 2020, almost no rain was recorded for a dozen days. As for the wind, most days during the COVID-19 epidemic had a Beaufort Scale lower than 3. But on 15 February 2020, there was a fresh breeze (Beaufort Scale = 5) with a speed of more than 10 m/s, which has been analysed in previous section. Northeast wind was dominant in this period and northwest wind blew sometimes. The correlation coefficients (R2) between mean turbidity and wind force and rainfall were: 0.033 and 0.056. Both R2 were lower than 0.1, which illustrated that lakes’ turbidity variation had very little relationship with rainfall and wind conditions.
Focusing on the phase after the lockdown, the short-term decline of lake turbidity might be caused by multiple factors through a mixing way. Little rainfall and low wind in this period provided relatively stable natural conditions for Wuhan lakes, which reduced the possibility of river flowing input and bottom material resuspension therefore benefited lakes’ turbidity decreasing (Point et al. Citation2007; Penning et al. Citation2012). Another possible factor for the turbidity decline was the sharp decrease in human activities under the lockdown policy in Wuhan. According to previous researches, ship waving, household wastewater discharge, pollutants from banks, city construction, and fishing stocking could cause increments in lakes’ turbidity (Peng et al. Citation2012; Pujing et al. Citation2013; Wang, Zhang, et al. Citation2018). Many lakes in Wuhan play important roles in travel and leisure. For example, the East Lake Scenic Area is a famous scenic spot attracting lots of visitors for sailing and swimming. The Sha Lake and South Lake are two public leisure and recreation parks. These urban lakes are closely related to human life and activities. However, after the lockdown of Wuhan on 23 January 2020, almost all traffic (bus, subway, ferry), consumer activities (shopping, travelling, visiting tourist sites) and industrial production were shut down, and all citizens were strictly quarantined at home. The factories and restaurants were forced to close, whose normal operation might affect surrounding aquatic environment through the discharge of wastewater. The public leisure area and scenery spots around lakes were also closed so that tourists no longer came there for travelling, relaxing, swimming and boating. With little disturbances from human activities, the lakes returned to a natural state which allowed self-development and self-clearing in their ecosystems. This might significantly reduce lakes’ turbidity. However, factors affecting lakes’ turbidity are multiple and complex. Whether the dramatic decrease in human activities was the dominant factor for the decline of Wuhan lakes’ turbidity needs further studies and investigations.
5.2. Performance of multi-sensor combination
To monitor Wuhan lakes’ turbidity at a high frequency, the combination of Landsat-8/OLI, Sentinel-2/MSI and HY-1C/CZI satellite data was adopted in this study. The technology of multi-sensor combination showed an improved capability in temporal resolution for lake dynamic monitoring. As shown in , the three sensors are grouped together to comprise a ‘complete’ time series. We can find that the turbidity results derived from three sensors presented good consistency and compatibility. Three coincidences (the box a, b, and c in ) were noted when OLI, MSI, and CZI synchronously passed Wuhan. The relative error between each pair of sensors are all less than 10%. The errors are much smaller than the extent of overall turbidity dynamic. Therefore, these small disturbances have no significant influence on the overall trend of Wuhan lakes’ turbidity.
Figure 11. The variation trend of mean turbidity in Wuhan lakes from multi-sensor retrievals. Note that all the fitting curves were obtained by the nonlinear least-square regression. (Colour online)
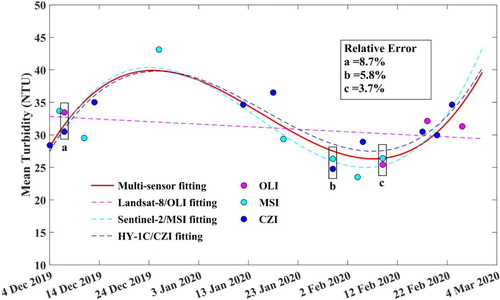
The trend-fitting curves of multi-sensor results and individual sensor results are plotted in . By taking the multi-sensor fitting curve (the red solid curve in ) as a reference, we can find that the frequent observation from the sensors with short revisit periods can describe trends that are more aligned with the practice. The turbidity results of Landsat-8/OLI sensor did not show the ‘increasing, declining, and increasing’ trend as MSI and CZI, since its long revisit period caused many details and major events to be omitted. In brief, the integration of multi-sensor satellite observations can improve monitoring capacity in temporal resolution and provide more detailed information about lake dynamic change.
6. Conclusion
In this study, Landsat-8/OLI, Sentinel-2/MSI and HY-1C/CZI satellite data were integrated to monitor Wuhan lakes’ turbidity variations during the COVID-19 epidemic from December 2019 to February 2020. On the basis of fixed station observations, the empirical turbidity models were developed with high accuracy. The time series of lake turbidity in the period of COVID-19 were then generated. Two questions were answered in this study: (1) how did the lake environment change during the COVID-19 epidemic in Wuhan? (2) did the construction and operation of HH and LH affect the water quality of the nearby lakes? Through analysing the spatio-temporal variations of the lakes’ turbidity during the COVID-19 epidemic we drew the following conclusions:
The mean turbidity of Wuhan lakes decreased by approximately 24.9% after the lockdown of Wuhan and presented a drop of 16.0% compared with that in the same period of the previous year. This might be related to the dramatic decrease in human activities after the lockdown which need further studies and investigations.
No obvious turbidity disturbance was observed in Huangjia Lake and Zhiyin Lake during the construction of HH and LH. After the operation of the two hospitals, the lakes’ turbidity remained stable and satisfactory.
The technology of multi-sensor combination showed an improved capability in temporal resolution for inland lakes monitoring.
This study provides a high-frequency analysis of turbidity variations in Wuhan lakes during the COVID-19 epidemic. The methodology and findings in this study are of great significance for urban lakes management, aquatic environment protection and decision making. In future, we will make further analysis and studies about the factors affecting lake turbidity variations during the COVID-19 epidemic.
Acknowledgement
We thank the USGS for providing Landsat-8 dataset, the Copernicus for providing Sentinel-2 dataset, the NSOAS for providing HY-1C dataset, and the GES DISC for providing rainfall dataset.
Disclosure statement
No potential conflict of interest was reported by the author(s).
Additional information
Funding
References
- Abirhire, Oghenemise, John-Mark Davies, Xulin Guo, and Jeff Hudson. 2020. “Understanding the Factors Associated with Long-Term Reconstructed Turbidity in Lake Diefenbaker from Landsat-Imagery.” Science of The Total Environment 724: 138222. doi:10.1016/j.scitotenv.2020.138222.
- Bachmann, Roger W., Mark V. Hoyer, and Daniel E. Canfield. 2000. “The Potential for Wave Disturbance in Shallow Florida Lakes.” Lake and Reservoir Management 16 (4): 281–291. doi:10.1080/07438140009354236.
- Ban, Xuan, Cheng Yu, Baozhu Pan, Xianyou Ren, Yun Du, and Liang Zhang. 2014. “Application of the CWQII Method and a 2D Water Quality Model to Assess Diversion Schemes for East Lake (Donghu), Wuhan, China.” Lake and Reservoir Management 30 (4): 358–370. doi:10.1080/10402381.2014.942044.
- Bonansea, Matias, María Claudia Rodriguez, Lucio Pinotti, and Susana Ferrero. 2015. “Using Multi-Temporal Landsat Imagery and Linear Mixed Models for Assessing Water Quality Parameters in Río Tercero Reservoir (Argentina).” Remote Sensing of Environment 158: 28–41. doi:10.1016/j.rse.2014.10.032.
- Braga, Federica, Luca Zaggia, Debora Bellafiore, Mariano Bresciani, Claudia Giardino, Giuliano Lorenzetti, Francesco Maicu, et al. 2017. “Mapping Turbidity Patterns in the Po River Prodelta Using Multi-Temporal Landsat 8 Imagery.” Estuarine, Coastal and Shelf Science 198: 555–567. doi:10.1016/j.ecss.2016.11.003.
- Cao, Zhigang, Hongtao Duan, Lian Feng, Ronghua Ma, and Kun Xue. 2017. “Climate- and Human-Induced Changes in Suspended Particulate Matter Over Lake Hongze on Short and Long Timescales.” Remote Sensing of Environment 192: 98–113. doi:10.1016/j.rse.2017.02.007.
- Chen, X., and Lian Feng. 2018. “Remote Sensing of Lakes' Water Environment.” Comprehensive Remote Sensing 8: 249–277. doi:10.1016/B978-0-12-409548-9.10408-7.
- Chen, Zhiqiang, Chuanmin Hu, and Frank Muller-Karger. 2007. “Monitoring Turbidity in Tampa Bay Using MODIS/Aqua 250-m Imagery.” Remote Sensing of Environment 109 (2): 207–220. doi:10.1016/j.rse.2006.12.019.
- Chen, Nanshan, Min Zhou, Xuan Dong, Jieming Qu, Fengyun Gong, Yang Han, Yang Qiu, et al. 2020. “Epidemiological and Clinical Characteristics of 99 Cases of 2019 Novel Coronavirus Pneumonia in Wuhan, China: A Descriptive Study.” The Lancet 395 (10223): 507–513. doi:10.1016/s0140-6736(20)30211-7.
- Chen, Jiang, Weining Zhu, Yong Q. Tian, and Qian Yu. 2020. “Monitoring Dissolved Organic Carbon by Combining Landsat-8 and Sentinel-2 Satellites: Case Study in Saginaw River Estuary, Lake Huron.” Science of The Total Environment 718: 137374. doi:10.1016/j.scitotenv.2020.137374.
- Cheng, Tong, Mu Bing, Liu Rong-Jie, Ding Jing, Zhang Min-Wei, Xiao Yan-Fang, Liang Xi-Jian, and Chen Xiao-Ying. 2019. “Atmospheric Correction Algorithm for HY-1C CZI Over Turbid Waters.” Journal of Coastal Research 90 (sp1): 156–163. doi:10.2112/SI90-019.1.
- Cho, Hyun Jung. 2007. “Effects of Prevailing Winds on Turbidity of a Shallow Estuary.” International Journal of Environmental Research and Public Health 4: 185–192. doi:10.3390/ijerph2007040014.
- Constantin, Sorin, David Doxaran, and Ștefan Constantinescu. 2016. “Estimation of Water Turbidity and Analysis of its Spatio-Temporal Variability in the Danube River Plume (Black Sea) Using MODIS Satellite Data.” Continental Shelf Research 112: 14–30. doi:10.1016/j.csr.2015.11.009.
- Davies-Colley, R. J., and D. G. Smith. 2001. “Turbidity, Suspended Sediment, and Water Clarity: A Review.” JAWRA Journal of the American Water Resources Association 37 (5): 1085–1101. doi:10.1111/j.1752-1688.2001.tb03624.x.
- Dogliotti, A. I., K. G. Ruddick, B. Nechad, D. Doxaran, and E. Knaeps. 2015. “A Single Algorithm to Retrieve Turbidity from Remotely-Sensed Data in all Coastal and Estuarine Waters.” Remote Sensing of Environment 156: 157–168. doi:10.1016/j.rse.2014.09.020.
- Doxaran, David, Jean-Marie Froidefond, and P. Castaing. 2002. “A Reflectance Band Ratio Used to Estimate Suspended Matter Concentrations in Sediment-Dominated Coastal Waters.” International Journal of Remote Sensing 23: 5079–5085. doi:10.1080/0143116021000009912.
- Feng, Lian, Xuejiao Hou, Junsheng Li, and Yi Zheng. 2018. “Exploring the Potential of Rayleigh-Corrected Reflectance in Coastal and Inland Water Applications: A Simple Aerosol Correction Method and Its Merits.” ISPRS Journal of Photogrammetry and Remote Sensing 146: 52–64. doi:10.1016/j.isprsjprs.2018.08.020.
- Feng, Lian, Chuanmin Hu, Xiaoling Chen, Xiaobin Cai, Liqiao Tian, and Wenxia Gan. 2012. “Assessment of Inundation Changes of Poyang Lake Using MODIS Observations Between 2000 and 2010.” Remote Sensing of Environment 121: 80–92. doi:10.1016/j.rse.2012.01.014.
- Garg, Vaibhav, Shiv Prasad Aggarwal, and Prakash Chauhan. 2020. “Changes in Turbidity Along Ganga River Using Sentinel-2 Satellite Data During Lockdown Associated with COVID-19.” Geomatics, Natural Hazards and Risk 11 (1): 1175–1195. doi:10.1080/19475705.2020.1782482.
- Gelda, Rakesh K., Steven W. Effler, Anthony R. Prestigiacomo, Feng Peng, Adam J. P. Effler, Bruce A. Wagner, MaryGail Perkins, David M. O’Donnell, Susan M. O’Donnell, and Donald C. Pierson. 2013. “Characterizations and Modeling of Turbidity in a Water Supply Reservoir Following an Extreme Runoff Event.” Inland Waters 3 (3): 377–390. doi:10.5268/IW-3.3.581.
- Goetz, S. J., N. Gardiner, and J. H. Viers. 2008. “Monitoring Freshwater, Estuarine and Near-Shore Benthic Ecosystems with Multi-Sensor Remote Sensing: An Introduction to the Special Issue.” Remote Sensing of Environment 112 (11): 3993–3995. doi:10.1016/j.rse.2008.05.016.
- Guan, Qi, Lian Feng, Xuejiao Hou, Guy Schurgers, Yi Zheng, and Jing Tang. 2020. “Eutrophication Changes in Fifty Large Lakes on the Yangtze Plain of China Derived from MERIS and OLCI Observations.” Remote Sensing of Environment 246. doi:10.1016/j.rse.2020.111890.
- Güttler, Fabio N., Simona Niculescu, and Francis Gohin. 2013. “Turbidity Retrieval and Monitoring of Danube Delta Waters Using Multi-Sensor Optical Remote Sensing Data: An Integrated View from the Delta Plain Lakes to the Western–Northwestern Black Sea Coastal Zone.” Remote Sensing of Environment 132: 86–101. doi:10.1016/j.rse.2013.01.009.
- Hlaing, S., A. Gilerson, R. Foster, M. Wang, R. Arnone, and S. Ahmed. 2014. “Radiometric Calibration of Ocean Color Satellite Sensors Using AERONET-OC Data.” Optics Express 22 (19): 23385–23401. doi:10.1364/OE.22.023385.
- Hu, Chuanmin, Kendall L. Carder, and Frank E. Muller-Karger. 2000. “Atmospheric Correction of SeaWiFS Imagery Over Turbid Coastal Waters: A Practical Method.” Remote Sensing of Environment 74 (2): 195–206. doi:10.1016/S0034-4257(00)00080-8.
- Hu, Chuanmin, Zhiqiang Chen, Tonya D. Clayton, Peter Swarzenski, John C. Brock, and Frank E. Muller-Karger. 2004. “Assessment of Estuarine Water-Quality Indicators Using MODIS Medium-Resolution Bands: Initial Results from Tampa Bay, FL.” Remote Sensing of Environment 93 (3): 423–441. doi:10.1016/j.rse.2004.08.007.
- IOCCG, 2000. 2000. “Remote Sensing of Ocean Colour in Coastal, and Other Optically-Complex, Waters”.
- Joshi, Ishan D., Eurico J. D’Sa, Christopher L. Osburn, and Thomas S. Bianchi. 2017. “Turbidity in Apalachicola Bay, Florida from Landsat 5 TM and Field Data: Seasonal Patterns and Response to Extreme Events.” Remote Sensing 9: 4. doi:10.3390/rs9040367.
- Kirk, John T. O. 1985. “Effects of Suspensoids (Turbidity) on Penetration of Solar Radiation in Aquatic Ecosystems." Hydrobiologia 125 (1): 195–208. doi:10.1007/BF00045935.
- Kirk, R. M., Paul Komar, Jonathan Allan, and Wayne Stephenson. 2000. “Shoreline Erosion on Lake Hawea, New Zealand, Caused by High Lake Levels and Storm-Wave Run-up.” Journal of Coastal Research 16: 346–356.
- Kuhn, Catherine, Aline de Matos Valerio, Nick Ward, Luke Loken, Henrique Oliveira Sawakuchi, Milton Kampel, Jeffrey Richey, et al. 2019. “Performance of Landsat-8 and Sentinel-2 Surface Reflectance Products for River Remote Sensing Retrievals of Chlorophyll-a and Turbidity.” Remote Sensing of Environment 224: 104–118. doi:10.1016/j.rse.2019.01.023.
- Li, Xiaojuan, Mutao Huang, and Ronghui Wang. 2020. “Numerical Simulation of Donghu Lake Hydrodynamics and Water Quality Based on Remote Sensing and MIKE 21.” ISPRS International Journal of Geo-Information 9 (2). doi:10.3390/ijgi9020094.
- Li, Jian, and David P. Roy. 2017. “A Global Analysis of Sentinel-2A, Sentinel-2B and Landsat-8 Data Revisit Intervals and Implications for Terrestrial Monitoring.” Remote Sensing 9 (9). doi:10.3390/rs9090902.
- Luettich Jr, Richard A., Donald R. F. Harleman, and LÁszlÓ SomlyÓdy. 1990. “Dynamic Behavior of Suspended Sediment Concentrations in a Shallow Lake Perturbed by Episodic Wind Events.” Limnology and Oceanography 35 (5): 1050–1067. doi:10.4319/lo.1990.35.5.1050.
- Matsuzaki, Katsumi, Osamu Murase, Ken’ichi Sugishita, Shuji Yoneyama, Ken’ya Akada, Mayu Ueha, Akemi Nakamura, and Satoe Kobayashi. 2000. “Optical Characterization of Liposomes by Right Angle Light Scattering and Turbidity Measurement.” Biochimica et Biophysica Acta (BBA) – Biomembranes 1467 (1): 219–226. doi:10.1016/S0005-2736(00)00223-6.
- Miyazaki, Y. 2005. “Contribution of Particulate Nitrate to Airborne Measurements of Total Reactive Nitrogen.” Journal of Geophysical Research 110 (D15). doi:10.1029/2004jd005502.
- Mouw, Colleen B., Steven Greb, Dirk Aurin, Paul M. DiGiacomo, Zhongping Lee, Michael Twardowski, Caren Binding, et al. 2015. “Aquatic Color Radiometry Remote Sensing of Coastal and Inland Waters: Challenges and Recommendations for Future Satellite Missions.” Remote Sensing of Environment 160: 15–30. doi:10.1016/j.rse.2015.02.001.
- Nechad, Bouchra, K. Ruddick, and Griet Neukermans. 2009. “Calibration and Validation of a Generic Multisensor Algorithm for Mapping of Turbidity in Coastal Waters.” Proceedings of SPIE – The International Society for Optical Engineering 7473. doi:10.1117/12.830700.
- Palmer, Stephanie C. J., Tiit Kutser, and Peter D. Hunter. 2015. “Remote Sensing of Inland Waters: Challenges, Progress and Future Directions.” Remote Sensing of Environment 157: 1–8. doi:10.1016/j.rse.2014.09.021.
- Park, Jae, Myoung-Jin Um, Young-Il Song, Hyun-Dong Hwang, Mun Kim, and Daeryong Park. 2017. “Modeling of Turbidity Variation in Two Reservoirs Connected by a Water Transfer Tunnel in South Korea.” Sustainability 9: 993. doi:10.3390/su9060993.
- Peng, San, Yi Li, Zhen Yang, and Zhao Zhong. 2012. “Investigation and Evaluation of Water Quality of the East Lake, Wuhan.” Advanced Materials Research 573-574: 631–637. doi:10.4028/www.scientific.net/AMR.573-574.631.
- Penning, W. E., M. Genseberger, R. E. Uittenbogaard, and J. C. Cornelisse. 2012. “Quantifying Measures to Limit Wind-Driven Resuspension of Sediments for Improvement of the Ecological Quality in Some Shallow Dutch Lakes.” Hydrobiologia 710 (1): 279–295. doi:10.1007/s10750-012-1026-z.
- Petus, Caroline, Guillem Chust, Francis Gohin, David Doxaran, Jean-Marie Froidefond, and Yolanda Sagarminaga. 2010. “Estimating Turbidity and Total Suspended Matter in the Adour River Plume (South Bay of Biscay) Using MODIS 250-m Imagery.” Continental Shelf Research 30 (5): 379–392. doi:10.1016/j.csr.2009.12.007.
- Point, D., Gilles Bareille, David Amouroux, Henri Etcheber, and Olivier Donard. 2007. “Reactivity, Interactions and Transport of Trace Elements, Organic Carbon and Particulate Material in a Mountain Range River System (Adour River, France).” Journal of Environmental Monitoring: JEM 9: 157–167. doi:10.1039/b616312b.
- Pujing, Huang, Liu Yan-fang, Fang Lei, and Zhao Jin-hui. 2013. “Study on Non-point Source Pollution of East Lake in Wuhan, China.” Journal of Chemical and Pharmaceutical Research 5: 675–680.
- Ritchie, Jerry C., Paul V. Zimba, and James H. Everitt. 2003. “Remote Sensing Techniques to Assess Water Quality.” Photogrammetric Engineering & Remote Sensing 69 (6): 695–704. doi:10.14358/pers.69.6.695.
- Shen, Huanfeng, Liwen Huang, Liangpei Zhang, Penghai Wu, and Chao Zeng. 2016. “Long-Term and Fine-Scale Satellite Monitoring of the Urban Heat Island Effect by the Fusion of Multi-Temporal and Multi-Sensor Remote Sensed Data: A 26-Year Case Study of the City of Wuhan in China.” Remote Sensing of Environment 172: 109–125. doi:10.1016/j.rse.2015.11.005.
- Stoichev, T., D. Amouroux, J. C. Wasserman, D. Point, A. De Diego, G. Bareille, and O. F. X. Donard. 2004. “Dynamics of Mercury Species in Surface Sediments of a Macrotidal Estuarine–Coastal System (Adour River, Bay of Biscay).” Estuarine, Coastal and Shelf Science 59 (3): 511–521. doi:10.1016/j.ecss.2003.10.007.
- Swain, Ratnakar, and Bhabagrahi Sahoo. 2017. “Improving River Water Quality Monitoring Using Satellite Data Products and a Genetic Algorithm Processing Approach.” Sustainability of Water Quality and Ecology 9-10: 88–114. doi:10.1016/j.swaqe.2017.09.001.
- Vanhellemont, Quinten, and Kevin Ruddick. 2014. “Turbid Wakes Associated with Offshore Wind Turbines Observed with Landsat 8.” Remote Sensing of Environment 145: 105–115. doi:10.1016/j.rse.2014.01.009.
- Vanhellemont, Quinten, and Kevin Ruddick. 2015. “Advantages of High Quality SWIR Bands for Ocean Colour Processing: Examples from Landsat-8.” Remote Sensing of Environment 161: 89–106. doi:10.1016/j.rse.2015.02.007.
- Vignolo, Alicia, Alberto Pochettino, and Daniel Cicerone. 2006. “Water Quality Assessment Using Remote Sensing Techniques: Medrano Creek, Argentina.” Journal of Environmental Management 81 (4): 429–433. doi:10.1016/j.jenvman.2005.11.019.
- Wang, Teng, Jingjing Yan, Jinlong Ma, Fei Li, Chaoyang Liu, Ying Cai, Si Chen, Jingjing Zeng, and Yu Qi. 2018. “A Fuzzy Comprehensive Assessment and Hierarchical Management System for Urban Lake Health: A Case Study on the Lakes in Wuhan City, Hubei Province, China.” International Journal of Environmental Research and Public Health 15: 2617. doi:10.3390/ijerph15122617.
- Wang, Rui, Yingxue Zhang, Wentong Xia, Xiao Qu, Wei Xin, Chuanbo Guo, Jim Bowker, and Yushun Chen. 2018. “Effects of Aquaculture on Lakes in the Central Yangtze River Basin, China, I. Water Quality.” North American Journal of Aquaculture 80 (3): 322–333. doi:10.1002/naaq.10038.
- Wu, Jing, and Hao Xie. 2011. “Research on Characteristics of Changes of Lakes in Wuhan’s Main Urban Area.” Procedia Engineering 21: 395–404. doi:10.1016/j.proeng.2011.11.2031.
- Xing, Zikun, Lloyd H. C. Chua, Haiyan Miao, Jörg Imberger, and Peipei Yang. 2018. “Wind Shielding Impacts on Water Quality in an Urban Reservoir.” Water Resources Management 32 (11): 3549–3561. doi:10.1007/s11269-018-1980-y.
- Xu, Xuan, Xiaolong Huang, Yunlin Zhang, and Dan Yu. 2018. “Long-Term Changes in Water Clarity in Lake Liangzi Determined by Remote Sensing.” Remote Sensing 10: 9. doi:10.3390/rs10091441.
- Zhang, Xinyang, and Xiaoyuan Cai. 2019. Quantitative Evaluation of Plant Priority Protection in Liangzi Lake Wetland Nature Reserve. Les Ulis: EDP Sciences.
- Zhou, Qu, Jian Li, Liqiao Tian, Qingjun Song, and Anna Wei. 2020. “A Coupled Approach for Radiometric Calibration and Parameter Retrieval to Improve Water Quality Estimations in Turbid Inland/Coastal Waters.” Optics Express 28. doi:10.1364/OE.384035.
- Zibordi, Giuseppe, Frédéric Mélin, Jean-François Berthon, Brent Holben, Ilya Slutsker, David Giles, Davide D’Alimonte, et al. 2009. “AERONET-OC: A Network for the Validation of Ocean Color Primary Products.” Journal of Atmospheric and Oceanic Technology 26 (8): 1634–1651. doi:10.1175/2009jtecho654.1.