
 ?Mathematical formulae have been encoded as MathML and are displayed in this HTML version using MathJax in order to improve their display. Uncheck the box to turn MathJax off. This feature requires Javascript. Click on a formula to zoom.
ABSTRACT
The visualization of flood disasters in virtual reality (VR) scenes is useful for the representation and sharing of disaster knowledge and can effectively improve users’ cognitive efficiency in comprehending disaster information. However, the existing VR methods of visualizing flood disaster scenes have some shortcomings, such as low rendering efficiency and poor user experience. In this paper, a tunnel vision optimization method for VR flood scenes based on Gaussian blur is proposed. The key techniques are studied, such as region of interest (ROI) calculation and tunnel vision optimization considering the characteristics of the human visual system. A prototype system has been developed and used to carry out an experimental case analysis. The experimental results show that the number of triangles drawn in a flood VR scene is reduced by approximately 30%–40% using this method and that the average frame rate is stable at approximately 90 frames per second (fps), significantly improving the efficiency of scene rendering and reducing motion sickness.
1. Introduction
With the acceleration of global climate change and the frequent occurrence of extreme meteorological disasters, flood disasters are occurring at an increasing rate. According to a report from the Centre for Research on the Epidemiology of Disasters (CRED), from 1998 to 2017, flood disasters accounted for 43.4% of global natural disasters, affecting more than 2 billion people and causing serious damage to infrastructure and loss of lives and property (Patel and Srivastava Citation2013; Skakun et al. Citation2014; Liu et al. Citation2017; Hu et al. Citation2018a; Wallemacq Citation2018). Therefore, it is of great significance to carry out flood disaster research. Digital Earth, first proposed by Gore in 1998, envisages exploring backward through digital earth, with the computational model to simulate future scenarios, such as urban growth and climate change, etc. It is a full-featured virtual reality system (Goodchild et al. Citation2012). The virtual geographical environment aims to reflect the real and virtual real geographical environment. It integrates computer technology, virtual reality technology, network technology and geographic information technology to abstract geographical phenomena, which can effectively help users understand the digital Earth and provide an important tool for the new generation of scientific experiments and analysis (Lin et al. Citation2013; Çöltekin et al. Citation2019). The ability to visualize the spatiotemporal processes of flood disasters in virtual reality (VR) scenes with stronger immersion and interaction can facilitate the representation and sharing of disaster information and enhance cognitive efficiency in comprehending this information (Huang, Jiang, and Li Citation2001; Lü Citation2011; Lin et al. Citation2013; Chen and Lin Citation2018; Lü et al. Citation2019).
VR technology has been widely used in games, military applications and disaster investigations (Lele Citation2013; Bhagat, Liou, and Chang Citation2016; Li et al. Citation2017; Lu et al. Citation2020), and has relevant research on flood disaster visualization (Massaâbi et al. Citation2018; Sermet and Ibrahim Citation2019; Šašinka et al. Citation2019). VR scenes have the characteristics of strong immersion, high-fidelity rendering and natural interaction, which put forward higher requirements on the efficiency of scene rendering. VR scene rendering efficiency is generally expressed by frames per second (fps). The frame rate that is too low will cause the picture to lag behind the interactive action, inducing motion sickness and affecting the user experience (Billen et al. Citation2008; Han and Kim Citation2017; Çöltekin et al. Citation2020). Generally, the minimum frame rate of VR scene drawing is more than 60 frames, and some game VR scenes have higher requirements to achieve better user experience, so VR scenes need to be optimized (Kamel et al. Citation2017). The existing optimization methods for VR scenes mainly include model simplification based on grid vertex reduction (Dassi et al. Citation2015; Ozaki, Kyota, and Kanai Citation2015; Liu Citation2017), graphics processing unit (GPU) programing optimization (Zhang, Wei, and Xu Citation2020), level of detail (LOD)-based dynamic scheduling (Gao et al. Citation2016; Hu et al. Citation2018b), back culling, view clipping, and occlusion blanking (Chen Citation2011; Wang Citation2011; Wu Citation2013; Geng and Zhu Citation2014; Lai et al.Citation2016; Robles-Ortega, Ortega, and Feito Citation2017), among others. Although certain improvements have been achieved using the above methods, these methods are all based on reducing the amount of data or the rendering burden such that the full view range of a scene can still be rendered with high fidelity from the perspective of a computer. Foveated rendering is also a common VR scene optimization method, but it easily causes visual obstacles such as flicker and blur (Duchowski and Çöltekin Citation2007; Bektaş and Çöltekin Citation2011; Çöltekin et al. Citation2020).
The expression of disaster scenes is generally affected by the scope of disaster. For example, flood disasters in large urban areas have a wide scope, and disaster scenes cover the whole screen during visualization (Wang et al. Citation2019; Zhi et al. Citation2020). However, mountain flood disasters have the characteristics of being widely ranging but linearly distributed along river valleys in mountainous areas (Cui et al. Citation2017). In addition, human users will typically pay more attention to the flood disaster itself and less attention to information beyond the disaster area when interactively exploring a VR flood scene. The existing VR scene optimization methods do not fully consider these characteristics of flood disasters and human vision and thus present redundant information beyond the flood disaster area of interest, resulting in low rendering efficiency and poor user experience.
To address the above problems, this paper proposes a tunnel vision optimization method for VR flood scenes based on Gaussian blur. This method includes two main aspects. First, the functional relationship between eye eccentricity and spatial resolution is analyzed based on the characteristics of the human visual system, and the visual angle range corresponding to high spatial resolution of the human eye is determined. Accordingly, an algorithm for calculating the region of interest (ROI) in a VR flood scene based on the visual cone is designed to provide the input parameters for tunnel vision optimization. Second, based on the ROI calculation results, the scene objects are simplified. On this basis, a Gaussian filter is used to construct a tunnel vision representation, and a tunnel vision optimization method based on the ROI is established. The proposed method is expected to improve the rendering efficiency for VR scenes while enhancing the user experience by ensuring less detail loss.
The remainder of this paper is organized as follows. Section 2 introduces the ROI calculation considering human visual characteristics and the ROI-based tunnel vision optimization method. Section 3 takes a flood disaster in Danba County as an example to describe the development of a prototype system and a corresponding experimental analysis. Section 4 presents the conclusions of this study and provides a brief discussion of future work.
2. Methodology
2.1. Overall framework
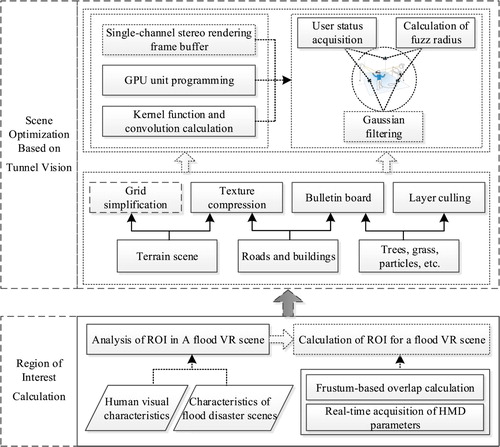
The overall framework of this paper, as shown in , consists of two parts. First, the functional relationship between the eccentricity and spatial resolution of the human eye is comprehensively analyzed. On the basis of human vision characteristics, according to the central position of the user's viewpoint and the position of the vertebral body in the scene, an algorithm for calculating the ROI for a VR flood scene is designed to calculate the area of interest of the user. Second, the calculated ROI is taken as the input to simplify the objects in the scene through grid simplification, texture compression and other techniques, and a tunnel vision representation of the scene is constructed by means of Gaussian filtering. Thus, VR flood scene optimization is realized to improve scene rendering efficiency and reduce motion sickness.
Figure 1. Overall framework.
2.2. ROI calculation considering human visual characteristics
2.2.1. Analysis of human visual characteristics
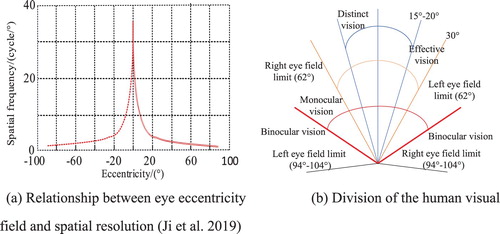
The main photosensitive capacity of the human eye originates from rod cells and cone cells distributed on the retina. The former are connected to common nerve endings; the latter have the ability to transmit signals to the brain and are concentrated in the fovea of the retina while being more sparsely distributed in peripheral areas, such that the central fovea has the highest sensitivity and resolution (Weier et al. Citation2016; Bastani et al.Citation2017). The relationship between eye eccentricity (viewing angle) and spatial resolution is shown in (a). Based on the eccentricity, the visual field of the human eye is divided into different horizons, as shown in (b). Generally, for an image reflected on the retina of the human eye, the central part of the eye can clearly distinguish objects only in the range of approximately 15°–20°, which is called the resolved field of view; the range of 20°–30° is called the effective field of view, where the resolution ability is significantly reduced; and the range of 30°–104° is called the induced field of view, where it is necessary to rotate the eyeballs or head to identify scene objects. There are differences in the visual field of human eye resolution between different users, and there are also slight differences between eyes of the same user (Weier et al. Citation2017; Koulieris et al. Citation2019). This paper focuses on the human visual characteristics between different users.
Figure 2. Human visual characteristics.
Therefore, in view of the above characteristics of human eyes, combined with the linear distribution characteristics of mountain flood disasters, this paper presents the design of an ROI calculation algorithm considering human visual characteristics to calculate the range of the ROI that can be distinguished by a user's two eyes in a VR scene and provides input parameters for VR flood scene optimization.
2.2.2. ROI calculation
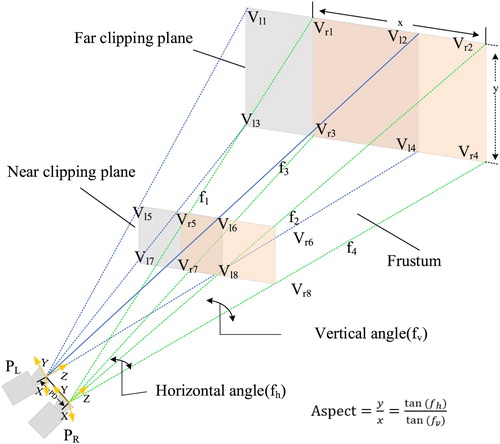
According to the visual field division presented above and the physiological differences between different eyes, the binocular overlap area is regarded as the ROI. The left and right frusta in a VR scene are equivalent to the views of the left and right eyes in the real world, as shown in .
Figure 3. Left and right frusta in a VR scene.
The ROI calculation method considering human visual characteristics mainly consists of the calculation of the offsets, direction vectors and ROI range. The specific procedures are as follows.
The vertical camera angle
is obtained as the initial value of the camera field angle, and the aspect ratio (denoted by Aspect in ) is calculated using
The model transformation matrix is obtained through the built-in functions of the VR platform, and the vertices are converted from the local coordinates into the world coordinates. On this basis, the direction vectors
The vertex coordinates of the left frustum are calculated using formula 3. The vertex coordinates of the right frustum can be calculated similarly, and thus, the range of the user's ROI can be obtained in real time.
2.3. Tunnel vision optimization based on the ROI
2.3.1. Scene object simplification based on bounding box detection
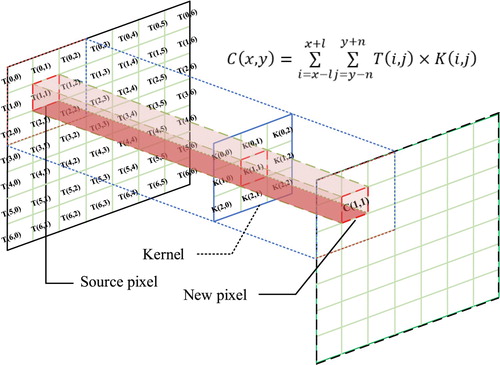
To reduce the number of triangles and improve the efficiency of scene rendering, the bounding box detection method is used to simplify the scene objects. Based on the 8 vertices of the ROI, the space plane equations of the six faces are established (in the form given in formula 4, where a, b, and c are the three parameters of the plane equation and X, Y, and Z are the vertex coordinates), and the rectangular bounding box of each scene object is obtained. Then, the relative positions of each bounding box vertex with respect to each plane are determined in accordance with formula 5. The possible relationships are divided into three types: the point may be on the plane (① in formula 5), on the left side of the plane (② in formula 5), or on the right side of the plane (③ in formula 5). Finally, according to the intersection information with the six faces of the frustum, it is determined whether each vertex of each bounding box lies within the frustum.
(4)
(4)
(5)
(5) After judging all of the vertices on a bounding box, we can judge the relative position relationship between the corresponding scene object and the ROI:
If all vertices of the bounding box are in the ROI, then the scene object must be in the ROI.
If only some of the vertices are in the ROI, then the scene object intersects with the ROI and is considered visible.
If none of the vertices is in the ROI, then the scene object is likely to be outside the ROI, although there is one exception: the ROI may lie entirely within the bounding box of the scene object, which can be avoided through collision detection.
Based on judgments as described above, scene objects that lie outside the ROI can be optimized through grid simplification, texture compression, the bulletin board technique and other approaches. For complex scene objects such as terrain and buildings, the billboard technique is used, and patches are used instead of grids to reduce the amount of data to be rendered. Smaller scene objects (such as grass, stones, etc.) are rendered directly through layer culling.
2.3.2. Tunnel vision optimization based on Gaussian blur
Tunnel vision is a fovea rendering method. Inspired by the visual characteristics of the human eye, it focuses on rendering the central area while blurring the surrounding features in the scene, thus enabling a VR scene to be rendered hierarchically. It guides users to pay attention to key areas and reduces motion sickness in the user experience (Meng et al. Citation2018). A Gaussian filter is a special low-pass filter that takes a normal density distribution function as the calculation template. A convolution operation performed using a Gaussian filter can better preserve the edges in the original image and can yield a better blurring effect without multiple iterations. Therefore, in this paper, a Gaussian blur algorithm is used to blur the peripheral area to realize scene simplification for tunnel vision. The main steps include frame buffer acquisition, fuzzy range calculation and Gaussian filtering.
Frame Buffer Acquisition
Each storage unit of the frame buffer corresponds to one pixel on the screen, and the whole frame buffer corresponds to a single frame image. The computer renders each frame image in turn. In this paper, the left and right eye images are rendered as packaged rendered textures by means of single-channel stereo rendering technology. During single-channel stereo rendering, the GPU shares the work of removing the two eyes and calculating shadows. This effort can be eliminated by traversing each scene object once, and the left and right eyes can be rendered synchronously through alternate rendering.
(2) Calculation of the Fuzzy Range
Through GPU unit programing, the blur range is calculated before each frame is rendered. The number of pixels corresponding to the ROI in the frame buffer is calculated using formula 6:
(6)
(6) Where
and
represent the numbers of pixels in the X-axis and Y-axis directions, respectively, of the left eye frame buffer;
and
represent the numbers of pixels in the X-axis and Y-axis directions, respectively, of the ROI;
represents the distance from
to
; and
represents the distance from
to
.
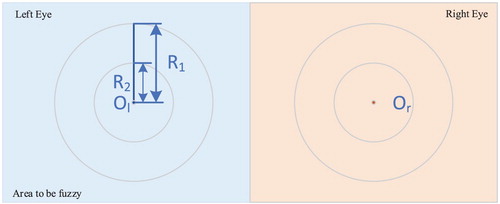
The user status is judged in real time. When the user is slowly browsing the scene, the center of the user's sight is the ‘center of the tunnel,’ and the smaller of the two values representing the size of the overlapping region on the X-axis and Y-axis is the ‘tunnel radius’; when the user is browsing quickly, the ‘tunnel center’ remains unchanged, but the ‘tunnel radius’ is reduced to half of the previous value to reduce the user experience of motion sickness. The frame buffer of the tunnel vision representation for single-channel stereo rendering is shown in . The radius and center of the tunnel are obtained as shown in formula 7.
(7)
(7) Here,
and
represent the centers of the clear areas of the frame buffer for the left and right eyes, respectively, in the computer.
is the radius of the high-fidelity rendering area for slow motion, and
is the radius of the high-fidelity rendering area for fast motion.
(3) Gaussian Filter
Figure 4. Region to be blurred in the frame buffer for single-channel stereo rendering.
By virtue of the increasingly powerful computing capabilities of GPUs, the Gaussian blur convolution operation can be implemented in the fragment shader, and formula 8 is used to determine whether the current fragment needs to be blurred.
(8)
(8) If the current pixel needs to be blurred, the required pixel calculation can be performed by the shader. A Gaussian template is used to convolve the RGB channels of the pixel, and the calculation results are fused. Thus, as shown in , a tunnel-vision-based field of view is constructed to render the ROI in a VR flood scene with high fidelity while reducing the data to be rendered, improving the rendering efficiency and reducing the user's motion sickness.
Figure 5. Convolution calculation process.
3. Prototype system implementation and experimental analysis
3.1. Study area and data processing
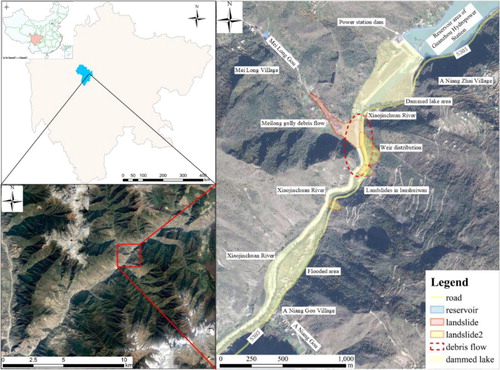
In this paper, a flood disaster in Banmen town (coordinates: 102.01°E, 30.97°N) in Danba County, located in the eastern part of Ganzi Tibetan Autonomous Prefecture, Sichuan Province, was selected as the experimental area for analysis, as shown in . The experimental image data used in this paper have a spatial resolution of 1 m and a digital elevation model (DEM) resolution of 10 m and were provided by the Sichuan Bureau of Surveying, Mapping, and Geoinformation. First, a normalization process based on coordinate conversion was applied to the terrain and image data to map the geospatial coordinates to Unity's own coordinate system. Then, the terrain triangulation network and texture mapping were constructed, and building models and temporal flood simulation data were added to build the initial VR flood scene.
Figure 6. Study area.
3.2. Prototype system implementation
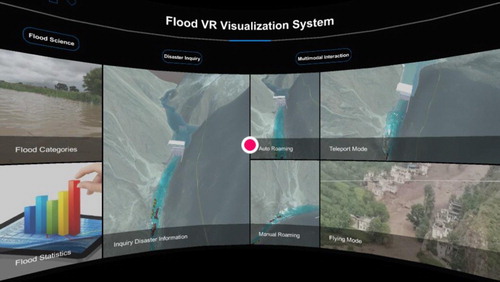
The prototype system presented in this paper is supported by a hardware environment consisting of a Dell T7610 graphics workstation, two Intel Xeon 5–2760 CPUs (40 cores), 64 GB of memory, NVIDIA Quadro K5000 graphics card, and HTC VIVE VR interactive device. Regarding software, the research and development environment based on the Windows 10 LTSC operating system, Microsoft Visual Studio 2017, the.Net framework, Unity3D and Steam was selected to develop the prototype system for the dynamic modeling and interactive analysis of VR flood disaster scenes. The main interface of the prototype system is shown in .
Figure 7. Main interface of the prototype system.
3.3. Experimental analysis
3.3.1. Scene rendering efficiency
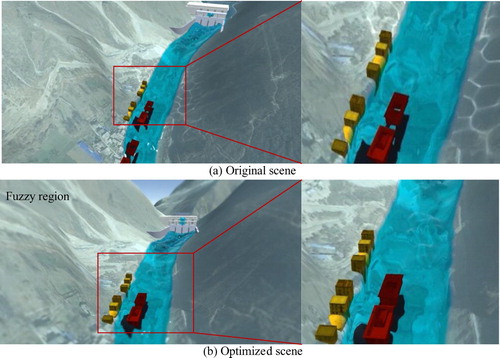
To verify the feasibility of the proposed method, qualitative and quantitative analysis methods were used for experimental verification. First, a qualitative analysis of the VR flood scene for the study area before and after optimization using the method proposed in this paper was carried out. The experimental results are shown in , where panel (a) represents the original scene and panel (b) represents the optimization effect of the proposed tunnel vision method. It can be seen from the figure that the proposed method ensures that the flood, buildings and other objects of concern to the user are rendered with high fidelity, allowing the user to focus on the ROI and improving the ability to perceive and comprehend important information. Thus, it provides effective support for users’ immersive browsing and exploration of VR flood scenes.
Figure 8. Tunnel vision optimization effect.
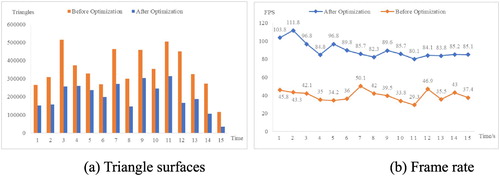
Then, a quantitative analysis was conducted to prove the rendering efficiency of the method for the VR flood scene. As shown in (a), the number of triangular surfaces rendered in the VR flood scene was analyzed. After optimization, the number of triangles drawn was reduced by approximately 30%–40%. As shown in (b), the rendering efficiency analysis shows that the average rendering efficiency before optimization was approximately 45 frames per second (fps), whereas the average rendering efficiency after optimization was approximately 90 fps. These findings demonstrate that the proposed method significantly improves the rendering efficiency for VR flood scenes and meets the general requirements for the rendering efficiency of VR scenes.
Figure 9. Comparative analysis of scene rendering efficiency.
3.3.2. User experience analysis
For scenario visualization, commonly used evaluation indicators include effectiveness, efficiency, and satisfaction (Dong, Liao, and Zhan Citation2019). Therefore, to verify the effectiveness of the method proposed in this paper, in reference to the Zhang et al. (Citation2020) and Li et al. (Citation2019, Citation2020) methods on the basis of fully considering the particularity of the user experience in VR scenes, four questions were designed, including the motion sickness of the user experience, the satisfaction of VR scene expression, the fluency of scene tour interactive exploration and the cognitive efficiency of users on the scene, and questionnaire analysis was carried out, as shown in . The users scored the first three questions based on their experience with the prototype flood VR system built in this paper. The score for each question could range between 1 and 5 points. A lower score indicates a stronger experience and a better effect; a higher score indicates a weaker experience and a worse effect. The fourth question asked the users to determine the numbers of buildings at different risk levels in the VR flood scene after using the system.
Table 1. List of questions in the questionnaire.
We recruited 60 participants to experience the lab VR equipment on-site without any payment, including 34 males and 26 females, aged between 20 and 27 years old, including undergraduate, postgraduate and doctoral students. All of them have a GIS background and some knowledge of flood disasters but have no experience with VR systems. To avoid any influence of the experimental sequence on the results, the 60 participants were randomly divided into two groups: group A and group B. Group A first experienced the VR flood scene before optimization and then experienced the optimized scene, while group B experienced the VR flood scenes in the reverse order. For the experiment, HTC VIVE was selected as the VR head display device. The field of view of this device is 110 degrees, the resolution is 2160 * 1200, and the refresh rate is 90 Hz. The specific experimental steps are as follows:
The system program was debugged and the parameters were set for the VR helmet, controller and other equipment. Then, the steps of operation were explained to the participants, including the interactive operation methods of VR helmet, gamepad and other devices, as well as the specific interactive operation of the prototype system interface;
Participants can choose any position (standing or sitting) to freely interact with the flood VR scene through the handle. They could browse the scene with the help of the helmet, and the duration of the VR experience was 3 minutes;
Once the VR experience was finished, the participants completed the questionnaire, and the completion time for question 4 was recorded.
At the end of the experiment, a total of 60 questionnaires (30 for each group) were collected. There were 29 valid questionnaires in Group A and 28 valid questionnaires in Group B, totaling 57 valid questionnaires. The average scores for the first three questions as well as the correctness rate and completion time for the last question in the valid questionnaire were calculated, as shown in .
Table 2. Comparative analysis of the average scores of the first three questions in the questionnaire survey.
From , it can be seen that the average Q1 scores of both groups A and B after scenario optimization are lower than the average Q1 scores before optimization(Q1Original > Q1Optimized), indicating that the motion sickness of users when experiencing the flood VR scene after optimization by this method was significantly lower than that before optimization. In addition, Q3Original > Q3Optimized shows that the optimized scene interactive tour is more fluent, which is positively correlated with the number of triangular facets and rendering efficiency of the scene drawing analyzed above, which proves that the optimized scene drawing efficiency has been improved from the side. Although the average score of Q2 after optimization is slightly lower than that before optimization, the difference is not significant, indicating that users are satisfied with both the pre-optimization and post-optimization scenarios.
From , the optimized flood VR scene has an impact on the accuracy of users’ understanding and cognition of the scene information. In contrast, the optimized VR flood scene encouraged the users to narrow their focus, so their cognitive efficiency was slightly improved. To verify whether the differences between the average values pre-optimization and post-optimization of the VR flood scene were statistically significant, Q1, Q2, Q3 and Q4 were selected as evaluation indexes, and Mann–Whitney U tests were conducted(Li et al. Citation2020) with a confidence level of 99.9%. The test results are shown in .
Table 3. Comparison and analysis of average completion time and accuracy of Questionnaire Q4.
Table 4. Mann-Whitney U before and after scene optimization.
From , the P = 0.00** < 0.01 of Q1, Q3 and Q4, indicates statistical significance. Thus, after the VR flood scene was optimized using the proposed method, the motion sickness, scene interaction fluency and cognitive efficiency of the user experience were significantly improved compared with the situation before optimization. However, the average difference in the Q2 score was small, with P = 0.027 > 0.01, indicating no statistical significance. This finding indicates that there was little difference in user satisfaction before and after optimization of the VR flood scenario, which is consistent with the statistical results presented in . Analysis suggests that the reason for the above phenomenon might be that the presented VR flood scene was highly realistic. After optimization, the users’ perception of the flood disaster information was not affected, but the users’ focus was more concentrated. Therefore, the scenes before and after optimization were both considered reasonably satisfactory, resulting in unclear significance.
4. Conclusions and future work
To address the problems of low rendering efficiency, severe motion sickness and poor user experience for existing VR flood scenes, this paper has proposed a tunnel vision optimization method for VR flood scenes based on Gaussian blur. First, the functional relationship between eye eccentricity and spatial resolution was comprehensively analyzed, and the view range corresponding to high spatial resolution of the human eye was determined; correspondingly, an algorithm for calculating the ROI based on the visual cone was designed. Then, according to the ROI calculation results, the scene objects were simplified, and on this basis, a Gaussian blur method was applied to optimize a tunnel-vision-based representation of the VR flood scene. Finally, a prototype system was developed, and the flood disaster that occurred in Banmen town in Danba County was selected for experimental analysis. The experimental results show that the proposed method can reduce the number of triangles drawn in each frame of the scene by approximately 30%–40% and that the frame rate throughout the whole roaming exploration process remains stable at approximately 90 fps; thus, the amount of scene data to be rendered is greatly reduced while ensuring a low loss of detail, significantly improving the efficiency of VR scene rendering, reducing the motion sickness of users during the exploration and analysis of the VR scene, and improving the user experience.
Although the above research results are promising, there are still some shortcomings. For example, the accuracy with which the ROI is obtained in the method proposed in this paper needs to be improved. When human eyes look in different directions, there will be subtle changes in their vision characteristics. Eye tracking technology can extract related features to track changes in eye focus in real time in order to predict and respond to the status and needs of users. Therefore, HTC VIVE Pro and eye tracker will be introduced in subsequent research work to dynamically capture and predict the focus of the user in the VR scene in combination with eye tracking technology to further carry out user experience analysis and improve the user experience.
Acknowledgements
We appreciate the detailed suggestions and constructive comments from the editor and the anonymous reviewers.
Disclosure statement
No potential conflict of interest was reported by the author(s).
Additional information
Funding
Notes
**P < 0.01.
References
- Bastani, B., E. Turner, C. Vieri, H. Jiang, B. Funt, and N. Balram. 2017. “Foveated Pipeline for AR/VR Head-Mounted Displays.” Information Display 33 (6): 14–35.
- Bektaş, K., and A. Çöltekin. 2011. “An Approach to Modeling Spatial Perception for Geovisualization.” Procedia – Social and Behavioral Sciences 21: 53–62.
- Bhagat, K. K., W. K. Liou, and C. Y. Chang. 2016. “A Cost-Effective Interactive 3D Virtual Reality System Applied to Military Live Firing Training.” Virtual Reality 20 (2): 127–140.
- Billen, M. I., O. Kreylos, B. Hamann, M. A. Jadamec, L. H. Kellogg, O. Staadt, and D. Y. Sumner. 2008. “A Geoscience Perspective on Immersive 3D Gridded Data Visualization.” Computers & Geoences 34 (9): 1056–1072.
- Chen, W. L. 2011. “Real-Time Terrain Rendering and Optimization for Large-Scale Complex Scene.” Yanshan University.
- Chen, M., and H. Lin. 2018. “Virtual Geographic Environments (VGEs): Originating from or beyond Virtual Reality (VR)?” International Journal of Digital Earth 11 (4): 329–333.
- Çöltekin, A., A. L. Griffin, A. Slingsby, A. C. Robinson, S. Christophe, V. Rautenbach, M. Chen, C. Pettit, and A. Klippel. 2019. “Geospatial Information Visualization and Extended Reality Displays//Manual of Digital Earth.” Springer, Singapore 2020: 229–277.
- Çöltekin, A., I. Lochhead, M. Madden, S. Christophe, A. Devaux, C. Pettit, O. Lock, et al. 2020. “Extended Reality in Spatial Sciences: A Review of Research Challenges and Future Directions.” ISPRS International Journal of Geo-Information 9 (7): 439.
- Cui, P., Y. Jia, F. Su, Y. Ge, X. Chen, and Q. Zou. 2017. “Natural Hazards in Tibetan Plateau and Key Issue for Feature Research.” Bulletin of Chinese Academy of Sciences 32 (09): 985–992.
- Dassi, F., B. Ettinger, S. Perotto, and L. M. Sangalli. 2015. “A Mesh Simplification Strategy for a Spatial Regression Analysis Over the Cortical Surface of the Brain.” Applied Numerical Mathematics 90: 111–131.
- Dong, W. H., H. Liao, and Z. C. Zhan. 2019. “New Research Progress of Eye Tracking-Based Map Cognition in Cartography since 2008.” Acta Geographica Sinica 74 (03): 599–614.
- Duchowski, A. T., and A. Çöltekin. 2007. “Foveated Gaze-Contingent Displays for Peripheral LOD Management, 3D Visualization, and Stereo Imaging.” ACM Transactions on Multimedia Computing, Communications, and Applications 3 (4): 1–18.
- Gao, Q., J. Ming, L. Pang, J. Wang, H. J. Song, L. Qiong, and H. Peng. 2016. “Study of Dynamic Scheduling Strategy for Large-Scale Terrain Visualization in Flight Simulation System.” 2016 9th International Symposium on Computational Intelligence and Design (ISCID). IEEE, 2: 361–365.
- Geng, H., and Y. J. Zhu. 2014. “Rendering Plane’s Virtual Repair Scenes with Object-Oriented Octree.” Computer Engineering and Applications 50 (5): 243–246.
- Goodchild, M. F., H. Guo, A. Annoni, L. Bian, K. De Bie, F. Campbell, M. Craglia, et al. 2012. “Next-generation Digital Earth.” Proceedings of the National Academy of Sciences 109 (28): 11088–11094.
- Han, S., and J. Kim. 2017. “A Study on Immersion of Hand Interaction for Mobile Platform Virtual Reality Contents.” Symmetry 9 (2): 22.
- Hu, P., Q. Zhang, P. Shi, B. Chen, and J. Fang. 2018a. “Flood-induced Mortality Across the Globe: Spatiotemporal Pattern and Influencing Factors.” Science of The Total Environment 643: 171–182.
- Hu, Y., J. Zhu, W. L. Li, Y. H. Zhang, Q. Zhu, H. Qi, H. X. Zhang, Z. Y. Cao, W. J. Yang, and P. C. Zhang. 2018b. “Construction and Optimization of Three-Dimensional Disaster Scenes Within Mobile Virtual Reality.” ISPRS International Journal of Geo-Information 7 (6): 215.
- Huang, B., B. Jiang, and H. Li. 2001. “An Integration of GIS, Virtual Reality and the Internet for Visualization, Analysis and Exploration of Spatial Data.” International Journal of Geographical Information Science 15 (5): 439–456.
- Ji, Y., Y. U. Yun-sen, G. Qin, M. U. Ting-zhou, W.-D. Chen, and R. A. N. Feng. 2019. “System of OLED-on-Silicon Micro Display Based on Visual Perception of Human Eye.” Acta Photonica Sinica 48 (04): 63–70.
- Kamel, B. M. N., Z. Lu, P. Guerrero, C. Jennett, and A. Steed. 2017. “From Urban Planning and Emergency Training to Pokémon Go: Applications of Virtual Reality GIS (VRGIS) and Augmented Reality GIS (ARGIS) in Personal, Public and Environmental Health.” International Journal of Health Geographics 16 (1): 1–11.
- Koulieris, G. A., K. Akşit, M. Stengel, R. K. Mantiuk, K. Mania, and C. Richardt. 2019. “Near-Eye Display and Tracking Technologies for Virtual and Augmented Reality.” Computer Graphics Forum 38 (2): 493–519.
- Lai, G., L. Ding, Z. Qin, and X. Tong. 2016. “An Effective Algorithm Research of Scenario Voxelization Organization and Occlusion Culling.” Earth and Environmental Science 46 (1): 012020.
- Lele, A. 2013. “Virtual Reality and Its Military Utility.” Journal of Ambient Intelligence and Humanized Computing 4 (1): 17–26.
- Li, C., W. Liang, C. Quigley, Y. Zhao, and L. F. Yu. 2017. “Earthquake Safety Training Through Virtual Drills.” IEEE Transactions on Visualization and Computer Graphics 23 (4): 1275–1284.
- Li, W. L., J. Zhu, L. Fu, Q. Zhu, Y. K. Xie, and Y. Hu. 2020. “An Augmented Representation Method of Debris Flow Scenes to Improve Public Perception.” International Journal of Geographical Information Science DOI: 10.1080/13658816.2020.1833016.
- Li, W. L., J. Zhu, Y. H. Zhang, Y. G. Cao, Y. Hu, L. Fu, P. C. Huang, Y. K. Xie, L. Z. Yin, and B. L. Xu. 2019. “A Fusion Visualization Method for Disaster Information Based on Self-Explanatory Symbols and Photorealistic Scene Cooperation.” ISPRS International Journal of Geo-Information 8 (3): 104.
- Lin, H., M. Chen, G. N. Lü, Q. Zhu, J. H. Gong, X. You, Y. N. Wen, B. L. Xu, and M. Y. Hu. 2013. “Virtual Geographic Environments (VGEs): A New Generation of Geographic Analysis Tool.” Earth-Science Reviews 126: 74–84.
- Liu, W. Z. 2017. “Research on Simplified Method of True 3D Model for Tilt Photography.” LiaoNing Technical University.
- Liu, M. W., J. Zhu, Q. Zhu, H. Qi, L. Z. Yin, X. Zhang, B. Feng, H. G. He, W. J. Yang, and L. Y. Chen. 2017. “Optimization of Simulation and Visualization Analysis of Dam-Failure Flood Disaster for Diverse Computing Systems.” International Journal of Geographical Information Science 31 (9): 1891–1906.
- Lü, G. N. 2011. “Geographic Analysis-Oriented Virtual Geographic Environment: Framework, Structure and Functions.” Science China Earth Sciences 54: 733–743. doi:10.1007/s11430-011-4193-2.
- Lü, G. N., M. Batty, J. Strobl, H. Lin, A. X. Zhu, and M. Chen. 2019. “Reflections and Speculations on the Progress in Geographic Information Systems (GIS): A Geographic Perspective.” International Journal of Geographical Information Science 33 (2): 346–367.
- Lu, X. Z., Z. B. Yang, Z. Xu, and C. Xiong. 2020. “Scenario Simulation of Indoor Post-Earthquake Fire Rescue Based on Building Information Model and Virtual Reality.” Advances in Engineering Software 143: 102792.
- Massaâbi, M., O. Layouni, W. B. M. Oueslati, and F. Alahmari. 2018. “An Immersive System for 3D Floods Visualization and Analysis.” International Conference on Immersive Learning. Springer, Cham 69–79.
- Meng, X. X., R. Du, M. Zwicker, and A. Varshney. 2018. “Kernel Foveated Rendering.” Proceedings of the ACM on Computer Graphics and Interactive Techniques 1 (1): 1–20.
- Ozaki, H., F. Kyota, and T. Kanai. 2015. “Out-of-Core Framework for QEM-based Mesh Simplification.” In Proceedings of the 15th Eurographics Symposium on Parallel Graphics and Visualization 87–96.
- Patel, D. P., and P. K. Srivastava. 2013. “Flood Hazards Mitigation Analysis Using Remote Sensing and GIS: Correspondence with Town Planning Scheme.” Water Resources Management 27 (7): 2353–2368.
- Robles-Ortega, M. D., L. Ortega, and F. R. Feito. 2017. “Efficient Visibility Determination in Urban Scenes Considering Terrain Information.” ACM Transactions on Spatial Algorithms and Systems 3 (3): 1–24.
- Šašinka, Č, Z. Stachoň, M. Sedlák, J. Chmelík, L. Herman, P. Kubíček, A. Šašinková, et al. 2019. “Collaborative Immersive Virtual Environments for Education in Geography.” ISPRS International Journal of Geo-Information 8 (1): 3.
- Sermet, Y., and D. Ibrahim. 2019. “Flood Action VR: A Virtual Reality Framework for Disaster Awareness and Emergency Response Training.” In ACM SIGGRAPH 2019 Posters, 1–2.
- Skakun, S., N. Kussul, A. Shelestov, and O. Kussul. 2014. “Flood Hazard and Flood Risk Assessment Using a Time Series of Satellite Images: A Case Study in Namibia.” Risk Analysis 34 (8): 1521–1537.
- Wallemacq, P. 2018. “Economic Losses, Poverty & Disasters: 1998–2017.” Centre for Research on the Epidemiology of Disasters, CRED.
- Wang, W. 2011. “Real-time Rendering Based on GPU for Large-scale Virtual Environment.” Northeast Petroleum University.
- Wang, C., J. M. Hou, D. Miller, I. Brown, and Y. Jiang. 2019. “Flood Risk Management in Sponge Cities: The Role of Integrated Simulation and 3D Visualization.” International Journal of Disaster Risk Reduction 39: 101139.
- Weier, M., T. Roth, E. Kruijff, A. Hinkenjann, A. Pérard-Gayot, P. Slusallek, and Y. M. Li. 2016. “Foveated Real-Time Ray Tracing for Head-Mounted Displays.” Computer Graphics Forum 35 (7): 289–298.
- Weier, M., M. Stengel, T. Roth, P. Didyk, E. Eisemann, M. Eisemann, S. Grogorick, et al. 2017. “Perception-Driven Accelerated Rendering.” Computer Graphics Forum 36 (2): 611–643.
- Wu, X. T. 2013. “Complex Scene Rendering Optimization on GPU.” South China University of Technology.
- Zhang, G. Y., J. H. Gong, Y. Li, J. Sun, B. L. Xu, D. Zhang, J. P. Zhou, L. Guo, S. Shen, and B. X. Yin. 2020. “An Efficient Flood Dynamic Visualization Approach Based on 3D Printing and Augmented Reality.” International Journal of Digital Earth 13 (11): 1302–1320.
- Zhang, F., Q. Wei, and L. Xu. 2020. “An Fast Simulation Tool for Fluid Animation in VR Application Based on GPUs.” Multimedia Tools and Applications 78: 16683–16706.
- Zhi, G. Z., Z. L. Liao, W. C. Tian, and J. Wu. 2020. “Urban Flood Risk Assessment and Analysis with a 3D Visualization Method Coupling the PP-PSO Algorithm and Building Data.” Journal of Environmental Management 268: 110521.