
 ?Mathematical formulae have been encoded as MathML and are displayed in this HTML version using MathJax in order to improve their display. Uncheck the box to turn MathJax off. This feature requires Javascript. Click on a formula to zoom.
ABSTRACT
This paper proposed a geoscience model service integrated workflow-based rainstorm waterlogging analysis method to overcome the defects of conventional waterlogging analysis systems. In this research, we studied a general OGC WPS service invoking strategy, an automatic asynchronous invoking mechanism of WPS services in the BPEL workflow, and a distributed waterlogging analysis services integrated workflow to realize the reconstruction of a waterlogging analysis model based on the proposed method. The proposed method can make use of the flexible adjustment capability of the workflow and not only overcomes the inherent defects of conventional geoscience analysis methods but also realizes the integration and calculation of distributed geospatial data, models and computing resources automatically. The method has better construction convenience, execution reliability, extensibility and intelligence potential than a conventional method and has important value for dealing with more natural disasters and environmental challenges.
1. Introduction
With the rapid development of global industry and urbanization, a large amount of exhaust gas emitted in residents’ daily lives and industrial production has aggravated the ‘heat island effect’, which has promoted the frequent occurrence of regional heavy rainfall (Richards and Edwards Citation2018; Lin Citation2011; Nie Citation2017). At the same time, global warming is leading to a frequent trend of sudden extreme heavy rainfall (Yoo, Jung, and Kim Citation2005; Lu, Li, and Dong Citation2007; Fauchereau Citation2003). If the impervious surface becomes too large, the rainfall-collecting surface will become increasingly larger, the confluence speed will be significantly accelerated, and surface runoff will increase significantly. As a result, rainstorm and waterlogging disasters are increasingly intensifying, which seriously impacts the safe operation of transportation networks and threatens the lives and property of the public.
To address waterlogging, governments around the world have invested large amounts of human and material resources to eliminate the impact of waterlogging on the involved areas, especially urban areas. The application of geospatial information plays a significant role in the identification, prevention, and elimination of the danger of regional waterlogging. Although urban waterlogging analysis systems can solve some of the problems of urban waterlogging, to a large extent, it is difficult to integrate many model resources and utilize distributed, high-precision and diversified spatial information data resources in a distributed environment for the analysis of waterlogging due to the centralized computational mode.
Decision-making and analysis systems based on WebGIS have greatly improved their capacities; for example, a decision-making system based on WebGIS can improve irrigation efficiency and save water resources (Vuolo Citation2015; Maina, Amin, and Yazid Citation2014). An interactive WebGIS system for wetland management helps to share data worldwide (Mathiyalagan Citation2005). A WebGIS system based on comprehensive flood assessment helps to enhance the visual analysis of flood simulation results (Kulkarni Citation2014), and a WebGIS system based on flood emergency management can monitor, predict and warn floods effectively (Karnatak Citation2012; Frolov Citation2016). However, the data of a WebGIS-based urban municipal management system have the problem of overcentralization, which makes it difficult to realize distributed collaborative decision-making analysis and support, so this system is unable to adapt to new technologies, such as distributed computing, cloud computing and the general trend of interdisciplinary collaboration, to a large extent.
Many scholars have engaged in research on geoscience problems (Quan Citation2010) based on geospatial web services, such as research on geographical model sharing-based geospatial web services; a conceptual framework of models and resources sharing and integrating environment were proposed and discussed, and an implementation roadmap that motivates and drives future research in the open web-distributed modeling and simulation was presented (Chen Citation2020); research on hydrological modeling, ecosystem modeling and mapping services by utilizing geospatial services (Granell, Diaz, and Gould Citation2010; Crossman Citation2013); research on online spatial biodiversity model services based on geospatial information services (Singh, Karnatak, and Garg Citation2017); research on spatial information web service-based RS model and GIS model integration and sharing (Chen Citation2014) and service-oriented wrapper system for sharing and reusing distributed geoanalysis models (Zhang Citation2019); and research on GIS model services for shallow landslide prediction and early warning modeling (Segoni Citation2009). Research on remote sensing data processing based on geographic information services has also produced many research results, such as crop water content estimation services based on remote sensing images (Calera Citation2017), irrigation consulting services (Olalla, Calera, and Dominguez Citation2003), agricultural drought monitoring services (Deng Citation2012), research on intelligent discovery services for complex geographical objects (Yue Citation2013), and fire risk assessment by combining geographic information services and remote sensing technology (Chuvieco Citation2010). At present, approaches based on service-oriented architecture (SOA) have solved many deficiencies caused by centralized computational models, but the composition of an SOA service chain is mainly based on a hard coded script; determining how to construct a service workflow according to a general process is still a major challenge.
At present, there are some deficiencies in service composition standardization; existing workflow integration is usually based on hard coding, which is not conducive to the intelligent optimization of a geoscience model workflow. Hence, this paper proposes a model service integrated workflow-based method that implements asynchronous model service integration based on Business Process Execution Language (BPEL) and OWS and applies the method to the analysis of distributed waterlogging points. This method can automatically assemble distributed services based on Open Geospatial Consortium (OGC) geospatial information services and open-process BPEL standards and provides a better solution for decision-making analysis of environmental and disaster problems by fully sharing the data and models in a distributed environment. Additionally, the method provides a good solution to realize the integration of distributed geospatial data, algorithms and models intelligently, autonomously and generally.
2. Literature review
2.1. Rainstorm waterlogging
When a drainage system fails to discharge precipitation in time during a period of continuous rainstorms, waterlogging is formed in the involved area. With the acceleration of global climate change, waterlogging disasters are becoming increasingly serious, particularly in urban areas. Waterlogging has a great impact on people’s daily lives and productive activities. Researchers have carried out various studies on waterlogging and flood disasters based on remote sensing and geographic information system technology, such as studying the causes of urban waterlogging and flood disasters due to global climate change, urbanization, human activities, rainfall intensity, rainfall duration, geographical location conditions (Zhang Citation2016a, Citation2016b; Ma Citation2018) and other factors. For the aspect of waterlogging and flood disaster mapping, optical remote sensing images have been used to extract flood districts and calculate the area of flooding (Feng, Liu, and Gong Citation2015), and remote sensing multitemporal data and GIS tools have been combined to draw the spatial distribution map of a flood disaster (Arnous and Green Citation2015); for the aspect of the impact of waterlogging disasters in cities, asset loss assessment (Hammond Citation2015) and urban waterlogging risk assessment (Jiao, Zhang, and Xu Citation2017) have been performed, a weighted naive Bayesian classifier and GIS technology have been combined to assess the spatial risk of urban waterlogging (Tang Citation2018), and a geographical weighted regression (GWR) model has been utilized to analyze the impact of impervious surface expansion on the temporal and spatial changes of urban waterlogging (Yu Citation2018). Research has also been conducted on urban waterlogging disasters by combining multisource data, including using social media and satellite remote sensing data to monitor waterlogging in rainstorm disasters in real time (Zhang Citation2016; Xiao, Li, and Gong Citation2018) and extracting the waterlogging depth from video data obtained by urban monitoring (Jiang Citation2018). Scholars have also carried out research on a large number of urban rainstorm disaster models, including a global flood disaster model (Sampson Citation2015), rainstorm traffic impact model combined with GIS data (Su, Huang, and Li Citation2016), flood area model for the analysis of urban waterlogging depth (Xue Citation2016) and fuzzy comprehensive evaluation model of waterlogging control in urban subway station operation (Yu Citation2019). In addition, scholars have performed many studies on the prevention and control of urban waterlogging hazards, such as the construction of an urban road waterlogging early warning and monitoring system (Liu Citation2014), analysis of the best risk avoidance path based on data mining (Zhong and Zhang Citation2017), research on a planning model for urban waterlogging traffic diversion (Meng Citation2017) and an effect evaluation model of low-impact development (LID) technology in disaster reduction (Hu Citation2017). In addition, urban water management problems caused by urban waterlogging and water pollution have also attracted wide attention. Some researchers have also made positive progress in the study of urban waterlogging from the aspect of sponge city construction (Wang Citation2018; Xia Citation2017; Sang and Yang Citation2017).
Many factors, such as the rapid growth of population, the acceleration of urbanization, climate change, and the deterioration of the environment, can lead to increasingly serious waterlogging disasters, which will cause great harm to people’s daily lives and productive activities. Although China is currently making great efforts to construct sponge cities, experts and scholars have studied many waterlogging and flood prediction risk assessment models by using RS, GIS and Internet technologies, faced with the situation of intensifying urban water disasters, we need to adopt more efficient and reasonable theoretical and technical methods from the perspective of geospatial web services to help solve the problem of waterlogging.
2.2. OGC standard geospatial web services
OGC has been committed to the development of standards for geospatial data, software and services for a long period of time. OGC standard geospatial web services mainly include Web Coverage Service (WCS), Web Map Service (WMS), Web Feature Service (WFS), Web Processing Service (WPS), and Catalog Service for the Web (CSW), and massive amounts of data, algorithms, models and other resources can be shared based on OGC standards. Over the past 10 years, many researchers have performed much research work with geospatial web services. Regarding remote sensing, this work includes research on flexible remote sensing data processing services (Tan Citation2015) and research on online classification services for remote sensing images (Singh, Garg, and Karnatak Citation2019). Research on emergency systems of geospatial web services includes a service management system to address flood risk (Horita Citation2015), a 3-dimensional GIS network service to simulate urban waterlogging (Singh and Garg Citation2016), a geospatial web service for debris flow disaster assessment (Rosatti Citation2018) and a geospatial service aggregation-based flood emergency response system (Tan Citation2016). Geospatial web services show great activity in the field of GIS, such as geoscience data service sharing research (Ma Citation2017) and research on spatial connection optimization methods of geographical elements based on WFS services (Lan Citation2017). Geoscience model research has also been carried out based on OGC services, such as visualization models of land monitoring based on map services (Sofos Citation2017), research on network service models for landslide early warning (Aydinoglu and Bilgin Citation2015), and online geospatial computing service models for wetland analysis (Feng Citation2011). With powerful data exchange and model sharing capability (Chen Citation2014; Wen Citation2013; Yue, Zhang, and Tan Citation2015), geospatial web services are playing an increasingly important role in the field of human response to the environment and disasters.
2.3. Workflows
By aggregating business processes in sequence, a workflow builds a system that enables users to automatically perform all work only by inputs. Workflows can control, optimize and support core business processes (Van Der Aalst Citation1998) and at the same time can perform many complex, high-density computational and low-efficiency tasks, accelerate production efficiency, and improve revenue. However, the construction of workflows is usually difficult and needs to constantly adapt to user requirements that are simple or complex (Van Der Aalst Citation2003) and have high requirements for the comprehensive level of personnel knowledge. There are many studies on workflows, and some scholars have studied workflow management systems for scientific computing and data processing, such as a BPMN workflow system (Meek, Jackson, and Leibovici Citation2016) and Pegasus management system (Deelman Citation2015). In addition, many scholars have carried out application research related to workflows in the geoscience field. Workflow-based remote sensing models include workflow research on remote sensing image classification (Selsam and Schwartze Citation2016), forest canopy height calculation modeling based on remote sensing workflow technology (Lisein Citation2013), remote sensing image automatic processing workflow research for small-scale agriculture (Stratoulias Citation2017), and field measurement remote sensing spectral radiation information analysis research based on workflow technology (Pompilio Citation2013). In the research of workflows based on geoscience models, scholars have used GIS and workflow technology to carry out archaeological excavation (Katsianis Citation2008), environmental monitoring and comprehensive modeling (Yue Citation2015), urban building energy modeling (Davila, Reinhart, and Bemis Citation2016), and teamwork-oriented modeling for geoproblem solving (Chen Citation2019). In addition, relevant research has applied workflow technology to flood disasters (Ivanov, Kovalchuk, and Boukhanovsky Citation2013; Azamipour Citation2016; Panjalizadeh, Alizadeh, and Mashhadi Citation2014), which improved the efficiency of disaster analysis, decision making and evaluation and achieved a large amount of positive application value. There are also scholars who have combined geospatial web services and workflows to build a service chain (Tan Citation2014) to seamlessly integrate distributed geospatial web services and improve the automation of geographic processing (Shi and Walford Citation2012).
In addition to data processing in scientific research and the construction of geoscience models, workflows can greatly improve the processing speed and utilization efficiency of resources, reduce complex manual labor, and make future business process development trends toward automation and speediness.
3. Methodology
3.1. Waterlogging analysis model
A variety of models can be used to carry out monitoring for waterlogging analysis, but as an important means of urban waterlogging prediction, predisaster analysis plays an important role in the early allocation of a city’s flood emergency resources and the formulation of emergency decision making. On the one hand, the flood discharge capacity of a downstream district can be assessed according to hydrological statistical data from past years; on the other hand, a model of rainstorm and flood disaster analysis can be established dynamically according to a digital elevation model (DEM) to predict the water level distribution situation that the flood discharge area can endure. The purpose of rainstorm and flood analysis models is to search for low-lying land vulnerable to floods, overlay the residential map layer and forecast rainstorms and floods according to geographical and topographical distribution characteristics. Therefore, low-lying land identification models are an important research topic for rainstorm and flood analysis models.
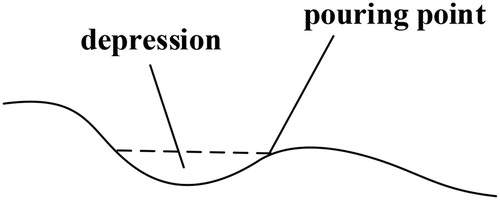
Low-lying areas can be understood to be low-lying and sunken areas in terms of topography and geomorphology. Due to the complex geomorphic environment on the Earth’s surface, low-lying areas have varying shapes and sizes. In farmland and villages, a place that seems flat may have depressions that may accumulate rainfall. However, a common irrigation ditch in farmland will not be used as a depression because the function of the ditch is to drain water and achieve the effect of drainage. First, we should introduce the concept of depression in hydrology. In hydrology, the term ‘flow’ is used to describe a depression and means that the depression has a water collection effect. When too much water is collected, high-intensity precipitation will occur, and the water will submerge the facilities inside the depression. Some village residential areas are located in depression areas, where the rainfall is very large. When ground infiltration and ditch drainage are exceeded, the buildings, roads and other infrastructure in the area are easily affected by a waterlogging disaster. There will be some risks in relatively low-lying areas (in farmland or construction land). As shown in , areas beyond depression will also face risks. When there is a large amount of rainfall, the water in the depression area will overflow from the pour point and may flood the adjacent area. Depression identification and the construction of drainage facilities can reduce the risk of floods caused by rainstorms. Through a drainage system, the water in the depression will be discharged as soon as possible so that the precipitation can be evenly distributed. A depression area identification model is used to locate the areas that may face drainage problems in heavy rain. The identification of depression areas depends on high-resolution topographic data, such as from a DEM or digital surface model (DSM).
Figure 1. Schematic diagram of depression.
The calculation procedure of the depression area identification model designed in this paper is divided into four steps, and the structure of the model is shown in .
DEM data error and error correction
Figure 2. Modeling process of the depression identification model.
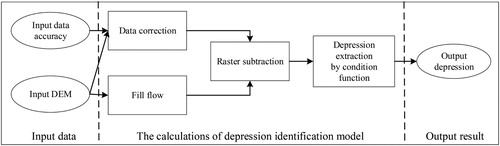
Due to differences in acquisition methods, there are some errors in the elevation values in raw DEM data, and it can be considered that a depression whose vertical height is less than the DEM elevation accuracy is caused by data error, so the data need to be corrected according to the elevation accuracy of the original DEM. The purpose of first filling is to eliminate the potential errors in the assumed data and obtain the DEM data with the best data accuracy.
We can assume that the DEM input data are InputDEM = (Iijm)m×n (where i = 1,2, … ,m; j = 1,2, … ,n), the elevation difference △zij between a depression point and its pour point is calculated by Iij, the set DEM data accuracy is the maximum elevation difference Zmax (greater than 0) between the depression point and its pour point that can be accepted, the DEM data after data error correction are OutputDEM = (Oij)m × n, and whether the pixels are filled is considered true or false; then,
(2) Fill the flow to the water pour point
A depression in the DEM data is a flow in hydrology. According to the analysis of flow in this paper, the elevation value in the flow area will be accumulated after the analysis of filling depressions and is higher than the elevation value of the original DEM, while the elevation values in nonflow areas will not be changed. The result of this process will be used for the calculation in the next step.
Assuming that the definitions of the input data and output data are the same as in (1), the maximum elevation difference between the allowable depression point and its pour point is not specified here, so all the depression points are filled as follows:
(3) Raster subtraction
In the previous step, we obtained a newly produced DEM in which the flows were filled with the elevation values of the water pour points, so there were no depressions. The pixel values in the depression area are always greater than zero, while the pixel values in the nondepression area are always equal to zero. The value of each pixel in the subtraction result between the original DEM and newly produced DEM can be understood as the depth of the depression.
Assuming that m and n are the row and column numbers of the raster, respectively, the DEM data without a depression are A = (aij)m×n, the DEM data with the depression are B = (bij)m×n, and C = (cij)m×n is the depression to be identified (where i = 1,2, … ,m; j = 1,2, … ,n); then,
(4) Extraction of the depression by a conditional function algorithm
After pixel-by-pixel subtraction, the depth data of the depression are obtained, and the area in which the depth is equal to 0 is the area without a depression. Finally, only a conditional function operation is needed to extract the area where the pixel values are greater than zero and obtain the depression map.
Set the original input raster to be D = (dij)m×n, and the depression results extracted by the conditional function are E = (eij)m×n (where i = 1,2, … ,m; j = 1,2, … ,n). The conditional expression is an SQL statement: dij > threshold (threshold is the conditional threshold); then, the conditional function will be:
where TrueValue and FalseValue are two constant values.
3.2. General OGC WPS service invoking strategy
The model service integrated workflow-based method proposed in this paper can convert the model process into a geospatial web service and then build a complex distributed geospatial analysis model via automatic service aggregation based on BPEL. At first, it is necessary to build a distributed service submodel and we need to realize the standardization of the submodel and create conditions for distributed multidisciplinary cooperation. However, because WPS services have different names and parameters that cannot be invoked automatically and directly, we designed the general OGC WPS service invoking strategy, which utilizes the OGC WPS standard service to encapsulate the submodel and designs a service invoking strategy to meet the needs of general invoking of the WPS service with arbitrary parameters.
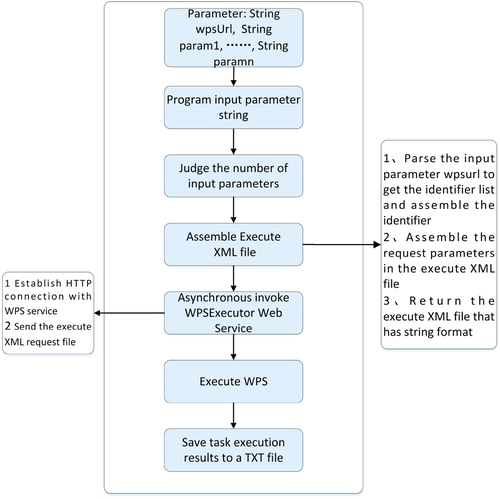
The WPS service specification in OGC provides three basic operations: the metadata of the request service (GetCapabilities), detailed information about the processes (DescribeProcess) and the request to run a process implemented based on the WPS service specification. The WPS service invoking adapter can invoke the WPS service with any number of parameters, as shown in . The adapter can automatically assemble the XML request file according to the number of input parameters and invoke the WPS service via a GET- or POST-based request to obtain the service result in XML format.
The WPSExecuteNp operation can invoke WPS services with an arbitrary number of parameters. This paper proposes the strategy of WPS service invoking, as shown in . When WPSExecuteNp invokes WPS services with a specific number of parameters, it first needs to determine the number of input parameters and then assemble execution XML files according to the input parameters. Next, the WPS executor Web service is invoked to establish the HTTP connection with the WPS service, and then the execute XML request file is sent to invoke the WPS service. Finally, the execution result is stored in a TXT file.
Figure 3. Schematic of general OGC WPS service invoking strategy.
To implement the general WPS invoking method, an arbitrary number of input parameters need to be assembled according to the rules of the WPS service XML request file. The type of input parameter is string, and three types of parameters are encapsulated into the input parameter string. The first type is the URL of the requested WPS service, the second type is geospatial data (i.e. raster data and vector data), and the third type is constant data (such as strings and floats). When assembling execute XML files, the URL of the WPS service is generally fixed as the first parameter of the WPSExecuteNp function, so the rest of the work assembles the second and third types of input data, as shown in . If the input parameter name contains the ‘GeoData’ string prefix, it is assembled in Manner 1. If the input parameter name contains the ‘LiteralData’ string prefix, it is assembled in Manner 2.
Table 1. Assembly of input parameters.
3.3. Automatic asynchronous invoking mechanism of the WPS service in the BPEL workflow
Because of the large amount of computation and long time consumption, and the asynchronous WPS service invoking method can monitor the WPS service task easily and can execute multiple WPS services at one time. However, it is difficult to do that with the synchronous service invoking method. Hence, the paper designs automatic asynchronous invoking mechanism of the WPS service, which can invoke the WPS services automatically and asynchronously based on the general OGC WPS service invoking strategy. This paper selects the BPEL workflow plug-in of the Eclipse development environment to realize business process building. The Eclipse BPEL designer plug-in provides the complete process of BPEL project creation, BPEL process design and BPEL process service publishing and is a full GUI operation; hence, coding is not required. The geographic model calculation is implemented by combining and invoking related geospatial WPS services based on BPEL. The process of invoking WPS services is based on the abovementioned general OGC WPS service invoking strategy. shows the operation process when the BPEL engine invokes WPS services, and shows the operation descriptions of the process.
Figure 4. WPSExecuteNp WPS asynchronous service invoking in the BPEL workflow.
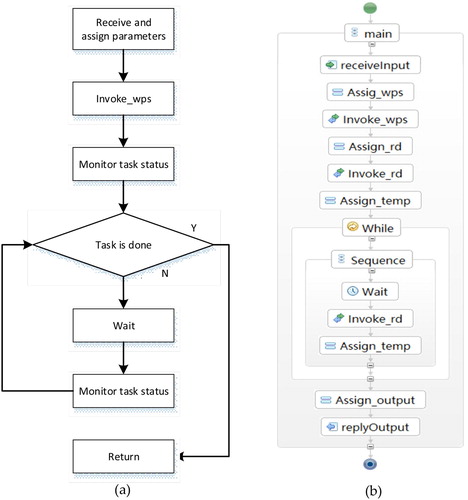
Table 2. WPSExecuteNp workflow operation descriptions.
When implementing the WPSExecuteNp workflow, the specific WPS service is invoked directly through the WPSInvoker service. When invoking a WPS service with the WPSInvoker service in the BPEL workflow, we first need to receive the input parameter string synthesized in Section 3.2 through receiveInput and conduct assign instance operations (i.e. Assign_wps) to assign the received string to specific variables and then use the invoke operation (i.e. Invoke_wps) to generate the UUID number and obtain a TXT file, with the UUID number as the file name and ‘file does not exist’ as the file contents. Next, a WPS service is executed through the WPSInvoker service. Then, the file name of the txt file generated by the Invoke_wps operation is assigned to a specific variable through the Assign_rd operation, and the contents of the txt file are read by the Invoke_rd operation. Then, assign the contents of the file to a temp variable by an instance assign operation (i.e. Assign_temp), and then wait for the service to execute via a while control operation that is a loop to determine whether the value of temp has changed; the loop will be terminated when the contents are no longer ‘file does not exist’. Inside the while control operation, the process is executed sequentially through a sequence operation structure, and then the wait time is set to limit the service execution time. The Invoke_rd operation reads the contents of the TXT file and assigns the contents to the temp variable through Assign_temp. After the WPS service is executed, the execution result is written to the created txt file. The result will be read from the txt file and then assigned to temp. At this time, the while control determines the value of temp, and it will jump out of the while loop if the value of temp has changed. Finally, the WPS service processing result is assigned to the output variable through the Assign_output operation, and the replyOutput operation can output the final result.
3.4. Waterlogging analysis services integrated workflow
According to the general OGC WPS service invoking strategy, the automatic asynchronous invoking mechanism of the WPS service in the BPEL workflow and the waterlogging analysis model, this paper designs the automatic integrated workflow of waterlogging analysis in 8 steps:
Select a sequential execution structure as the main container of the whole process, as shown in . The whole business process is executed in sequence, and the result is returned after completion. There are process structures (i.e. sequential execution structure <sequence>, parallel execution structure <flow>, accept activity <receive> and response activity<replyOutput>) in the design. <sequenceMain> ensures that the whole process is executed sequentially, <flow> implements the process to be executed in parallel, <receiveInput> is used to activate and accept the start execution message, and <replyOutput> returns the final execution result.
Embed a parallel structure flow to complete the process of DEM data error correction and the filling operation, as shown in .
Define the parameter values, WCS service address and WPS service address for the input parameters;
Assign the incoming WCS service address to the defined variable by the assigning activity <assign> and then the activity <invoke> request WCS service of DEM data;
Assign the request result of WCS service to WPS service and the activity <invoke> request to execute WPS service of filling WPS service;
Assign the result of the WCS service and the DEM precision parameter value to the WPS service and execute the DEM data error correction WPS service;
Assign the results of (5) and (6) to the raster subtraction WPS service, and execute the WPS service;
The depth of the depression obtained by subtracting the WPS service is assigned to the conditional function WPS service, and the WPS service is executed;
The final depression result produced by the conditional function WPS service is assigned to replyOutput, and the execution result is returned through a message.
Figure 5. The first step of the BPEL design.
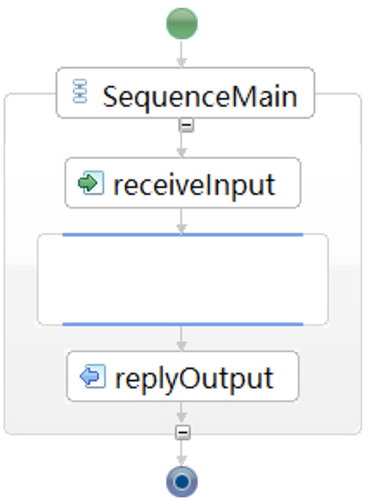
Figure 6. BPEL process design of the waterlogging analysis model.
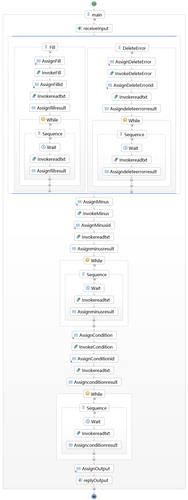
Through the above steps, based on the asynchronous WPS service invoking method of the BPEL workflow presented in Section 3.3, four WPS services are designed to complete the modeling process of depression identification in the rainstorm flood model, as shown in . The flowchart corresponds to the XML description document of the BPEL business process, which can be parsed and executed by any execution engine supporting the BPEL language. The BPEL process is encapsulated as a service and deployed to the execution engine. Only the BPEL process is published as a web service, so we can run, test and debug it. The BPEL business process will be packaged and published in the Orchestration Director Engine (ODE), and then the BPEL process can be run as an independent service.
4. Experiment
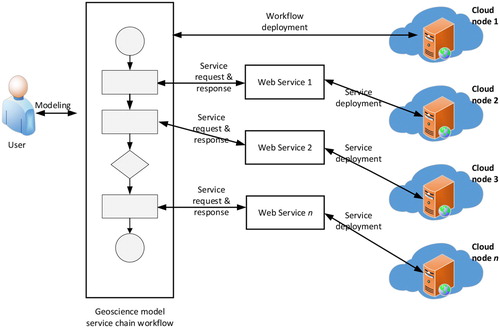
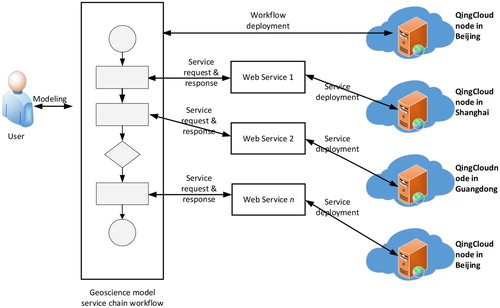
To verify the transformation of the management mode of geospatial resources from a file and spatial database management mode to a geospatial service mode and achieve the goals of realizing distributed geospatial resource sharing and integration by overcoming the heterogeneity of resources, in this study, geospatial resources are stored in distributed cloud nodes in the form of OGC web services. The experimental design of constructing a distributed geospatial web service chain based on OGC standards is shown in . As the basic element of constructing a service chain, distributed service is a kind of standard geospatial web service resource based on the OGC specification. In the experiments, the deployment of distributed geospatial web services is realized with the help of cloud computing technology. The geospatial web service deployment experiments include geospatial server environment construction, geoscience model service publishing and workflow-based integration and execution.
Figure 7. The deployment of a distributed service chain.
In the experiments, the ArcGIS server was adopted as a standard service publishing server for geospatial data, and the ArcGIS server was specifically designed and realized for building WebGIS and geospatial service applications. It is also a powerful OGC standard service publishing software. The ArcGIS server itself has a large number of predefined geospatial processing services and can use the ArcGIS Model Builder module to achieve user-defined geospatial processing services, and these services can be converted into OGC standard WPS services. Therefore, in the experiments, Model Builder was used for modeling and then publishing the built models on the ArcGIS Server as the WPS service, and the DEM data involved were published as a WCS service to provide data access.
We simulated 2 different application scenarios as shown in , and conducted two experiments for a traditional service mode and a distributed mode based on the method presented in this paper. Both experiments conducted waterlogging risk analysis ( and ).
Figure 8. Test1 traditional centralized mode.
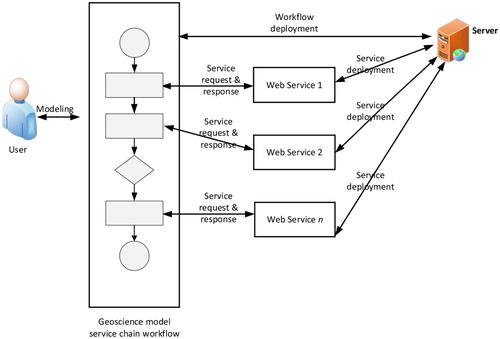
Figure 9. Test2 geoscience model service integrated workflow-based waterlogging analysis.
The 4 required geospatial model services, geospatial data services, service names and URL addresses used in the two experiments are shown in .
Table 4. The names and URL addresses of services.
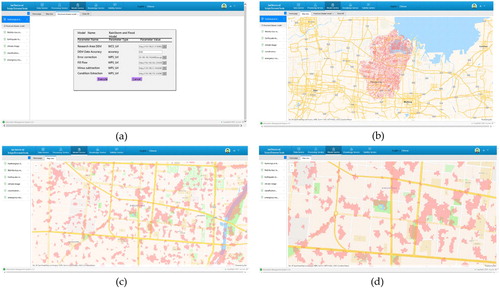
After the establishment of the experimental environment, the geoscience model service integrated workflow was called in the web system, and the corresponding model and data were input as parameters, as shown in (a). Waterlogging analysis results were obtained after the implementation, as shown in (b).
Figure 10. Experiment on geoscience model service integrated workflow-based waterlogging analysis.
5. Discussion
The experiments indicated the feasibility of geoscience model service workflow-based waterlogging analysis. This method automatically integrates distributed algorithms in the form of a BPEL workflow and finally forms a waterlogging analysis application. The method breaks the isolated feature of a traditional centralized emergency analysis system to achieve a specific emergency decision goal by aggregating distributed existing data and algorithm model resources. This method provides a new perspective to solve problems of natural disasters by making full use of widely distributed geospatial resources under the current situation with extremely rich geospatial resources. The method is discussed from the following 5 aspects: construction convenience, reliability, extensibility, scalability, and intelligence potential.
Table 3. Two test experiments.
5.1. Construction convenience
When encountering natural disasters such as floods, the efficiency of emergency response is undoubtedly critical. It is difficult to modify the process and change the data source after a traditional centralized emergency response system is designed and hard coded and deployed. If the data need to be updated, the corresponding algorithm model needs to be updated as well. Thus, the system process must be redesigned and coded, and relevant geospatial data also need to be collected again, which involves considerable time-consuming manual work and undoubtedly brings very inefficient results to complex and fickle natural disaster emergencies. In this study, we adopt open workflow technology, which can only change the workflow without changing the code, and the analysis workflow can be modified at any time according to the needs as designing models with ArcGIS Desktop Model Builder. When a better algorithm or model is found in the distributed environment, the existing algorithm or model can be replaced according to the need, and better analysis results can be obtained without modifying the analysis program itself. When the analysis encounters problems, a traditional pattern or models in Model Builder can only be corrected by modifying the code or model, while this methodology can be improved by replacing the failed services. Therefore, this loosely coupled mode based on workflow and distributed services has very high construction convenience in terms of system construction, modification and error correction.
5.2. Reliability
The execution reliability of the geoscience model service integrated workflow is the ability to resist service failure, machine breakdown and network faults during workflow execution. The reliability of a traditional centralized (Test1) emergency decision-making system depends on a single server; hence, the method faces the risk of serious single-point failure. Once there are problems with the machines that need to perform the calculation tasks, the whole task will fail. The method proposed in this paper can effectively avoid the single-point failure problem and has higher execution reliability in theory because the services can be distributed in the network environment. When a computing node fails in the execution process of a request, an alternative service can quickly be found to enable the workflow to continue to execute, but this is not usually the manner of hard coding method or Model Builder because the services are invoked via hard codes in the system or predefined routes in the model. To prove that the method has higher reliability, we simulated server failure in the Test2 experiment, as shown below ().
Figure 11. The simulation of server failure in Test2.
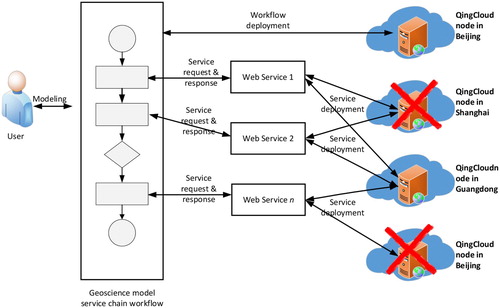
In the experiment, nine identical geospatial model services were found in three cloud nodes during the execution of the workflow. Two servers were shut down during the operation process; that is, the failure of two servers was simulated. Because the service chain dynamically invoked the service on the other servers to replace the failed service, the workflow was completed successfully. However, if we shut down the server with the hard coded traditional centralized (Test1) system, the workflow will fail. Hence, the experiment demonstrated that this method can improve the reliability of the system compared with the hard coded traditional centralized system, which is crucial in emergency analysis.
It should be noted that the workflow of the proposed method will fail if the machine node of the workflow collapses, however, the advantage of the proposed method is that the computational load of the workflow node is usually small, so it is not common for the node to collapse due to the computational load of the workflow. Moreover, even if the node of the workflow fails, it is not difficult to start a new workflow on another node to avoid failure. However, it is usually difficult for the traditional centralized method to create a new duplication on another node quickly because of the huge computational load, system redeployment and data volume.
5.3. Extensibility
The data, algorithm and model of the proposed method in this paper are adopted from an open network environment. Undoubtedly, these aspects are largely adapted to the distribution characteristics of current geospatial resources and have great advantages in the extensibility of information systems. In a traditional centralized flood emergency decision analysis application, which needs to integrate all the data and algorithms into the system, the integration will not be able to be changed due to the software engineering rules and system architecture, making it hard to replace a failed service even if there are better alternatives. Extensions can be made in a traditional hard coding mode by directly modifying the source code, but such changes will cause recompilation, packaging, and deployment. This is usually a very large amount of work, requiring careful analysis in advance and a large amount of testing after the changes to ensure that the changes do not cause new problems and undoubtedly cannot meet the urgent and unexpected demands of the decision-making system. However, the proposed method has obvious advantages in maintaining the openness of a decision-making system. Because it is based on runtime assembly, the algorithm model that needs to be assembled can be dynamically specified, and the proposed method can realize runtime object assembly. The runtime dynamic assembly of this method is based on OGC service interface specifications, which can support dynamic assembly, so the method has better extensibility. By comparison, the Model Builder can use remote geoprocessing services as modeling elements and invoke remote geoprocessing services that are defined by ArcGIS but not OGC standard service specifications, which blocks model sharing in multiple disciplines. Moreover, the model builder can only run on ArcGIS desktops and publish services on the ArcGIS server, but BPEL can run on and publish services on more general web servers (i.e. Tomcat), and it can use not only the WPS services published on the ArcGIS server but also the WPS services on other platforms. BPEL is an open workflow platform that is not only for geographic model building but also aims at large-scale programming and can build more types of geographic applications. Hence, the extensibility of the proposed method is superior to using Model Builder.
5.4. Intelligence potential
Compared with the traditional centralized decision-making system or Model Builder, the proposed method has higher intelligence potential. The traditional centralized decision-making system and Model Builder usually hard code or predefine the model, while the model service integration based on the BPEL workflow can dynamically find superior service alternatives and replace them independently. This undoubtedly creates favorable conditions for improving the intelligence of emergency decision-making applications. At present, there are many service composition methods based on script programs. In the application process, a script control language is relatively weak and lacks standards. Therefore, if only relying on scripts to composite distributed subservices, the flexibility in the modeling process is not high. Based on the BPEL open workflow standard, this study can build a general, standard, readable, and reusable open emergency decision-making model workflow, which will undoubtedly create favorable conditions for the future implementation of intelligent emergency decision-making systems. Second, to improve the application robustness, this paper adopts a method of invoking subservices through dynamic mapping. In the future, service workflows based on semantic or knowledge graphs can be independently optimized to lay the foundation for the intelligent coupling of distributed geospatial resources (i.e. data, models, algorithms, and computing resources). Therefore, the method proposed in this paper has great intelligence potential, which will be further explored in later studies.
5.5. Data transmission
Like all distributed applications, if the data are hosted on distributed servers, the proposed method has to transmit data from one server to another server, but the traditional centralized system needs to transmit data from the distributed server or just copy the data from the distributed server in advance manually only once. It is ok if processing a common volume of geospatial data, but if big data transmission is involved, the proposed method has the challenges of data transmission, similar to all distributed systems. To avoid big data transmission, one can deploy all the involved services on the central server, and in this situation, the proposed method is converted into a centralized system. If the big data hosted on different distributed servers and the data owners do not want to share the data, the proposed method can help the data owners build some data access or analysis services but not share the original data, but in this situation, the traditional method cannot fulfill the requirements. Moreover, the proposed method can be optimized via service migration to avoid data transmission in the future.
6. Conclusion
Waterlogging analysis is critical to address waterlogging emergency responses. However, a traditional centralized solution has the problem of an information island, which leads to isolated decision making. This solution is not conducive to integrating better algorithms or models for emergency decision making, and a traditional centralized computing model is insufficient in terms of its convenience, reliability, extensibility, and intelligence potential for emergency decision-making system construction. However, after the challenges of heterogeneity, standardization and intelligent integration of distributed services are solved, a distributed computing method has great advantages in using data resources, model resources, algorithm resources and computing resources efficiently for sound decision making.
Hence, this paper proposes a geoscience model service integrated workflow-based method to support waterlogging decision making. With the support of OGC standard service specifications and combining web service technology and workflow technology, this study explores the challenges encountered in natural disaster emergency response based on this method and promotes multidisciplinary, multidomain and distributed collaborative geoscience analysis. The proposed method consists of three parts, i.e. a general OGC WPS service invoking strategy, an automatic asynchronous invoking mechanism of WPS services in the workflow and a model service integrated workflow. Based on the proposed method, the reconstruction of a waterlogging analysis model is realized. Finally, the feasibility of this method is verified by building a waterlogging analysis decision application scenario in a cloud environment.
The geoscience model service workflow-based method can not only improve the inherent defects of traditional methods but also automatically realize the integration and calculation of distributed resources, which means that distributed geospatial data resources, model resources, and computing resources can be integrated into the workflow. This method can make full use of flexible adjustment technology for workflow technology to realize the optimization of geoscience models and facilitate the integration of distributed models into information systems to build more powerful decision support systems. In addition, the experiments show that this method has better construction convenience, extensibility, reliability, scalability and intelligence potential than a traditional method.
The study of this method can not only support waterlogging analysis but can also be applied to more natural disaster topics. Therefore, the authors will further apply this method in more fields in future research, hoping to play a great role in addressing broader environmental problems, ecological problems and social problems. In addition, although this method is capable of intelligent optimization, no practical intelligent optimization has been carried out so far. Therefore, an intelligent optimization study of the geoscience model service workflow-based method will be carried out in the next step to comprehensively improve its intelligence and achieve higher execution reliability and stability.
Acknowledgements
This research was funded by the National Key Research and Development Program of China [Grant ID: 2018YFB2100504]; the National Science Foundation of China (NSFC) [Grant ID: 41871312]; the National Key Research and Development Program of China [Grant ID: 2017YFB0504202]; the Fundamental Research Funds for the Central Universities [Grant ID:2042019kf0226]; the Hubei Natural Science Foundation [Grant ID: 2017CFB433]; Open Research Project of The Hubei Key Laboratory of Intelligent Geo-Information Processing [Grant ID: KLIGIP-2017A09] and the Beijing Key Laboratory of Urban Spatial Information Engineering (2017209).
Disclosure statement
No potential conflict of interest was reported by the author(s).
Data availability statement
The data that support the findings of this study are available from the corresponding author, FH, upon reasonable request.
Additional information
Funding
References
- Arnous, M. O., and D. R. Green. 2015. “Monitoring and Assessing Waterlogged and Salt-Affected Areas in the Eastern Nile Delta Region, Egypt, Using Remotely Sensed Multitemporal Data and GIS.” Journal of Coastal Conservation 19 (3): 369–391.
- Aydinoglu, A. C., and M. S. Bilgin. 2015. “Developing an Open Geographic Data Model and Analysis Tools for Disaster Management: Landslide Case.” Natural Hazards and Earth System Sciences 15 (2): 335–347.
- Azamipour, V. 2016. “An Efficient Workflow for Production Allocation During Water Flooding.” Journal of Energy Resources Technology 139 (3): 1–10.
- Calera, A. 2017. “Remote Sensing for Crop Water Management: From ET Modeling to Services for the End Users.” Sensors 17 (5): 1–25.
- Chen, Z. 2014. “A Framework for Sharing and Integrating Remote Sensing and GIS Models Based on Web Service.” The Scientific World Journal 2014: 1–13.
- Chen, M. 2019. “Teamwork-Oriented Integrated Modeling Method for Geo-Problem Solving.” Environmental Modeling & Software 119: 111–123.
- Chen, M. 2020. “Position Paper: Open Web-Distributed Integrated Geographic Modeling and Simulation to Enable Broader Participation and Applications.” Earth-Science Reviews 207: 1–17.
- Chuvieco, E. 2010. “Development of a Framework for Fire Risk Assessment Using Remote Sensing and Geographic Information System Technologies.” Ecological Modeling 221 (1): 46–58.
- Crossman, N. D. 2013. “A Blueprint for Mapping and Modeling Ecosystem Services.” Ecosystem Services 4: 4–14.
- Davila, C. C., C. F. Reinhart, and J. L. Bemis. 2016. “Modeling Boston: A Workflow for the Efficient Generation and Maintenance of Urban Building Energy Models from Existing Geospatial Datasets.” Energy 117: 237–250.
- Deelman, E. 2015. “Pegasus, a Workflow Management System for Science Automation.” Future Generation Computer Systems 46: 17–35.
- Deng, M. 2012. “Building an On-Demand Web Service System for Global Agricultural Drought Monitoring and Forecasting.” In 2012 IEEE International Geoscience and Remote Sensing Symposium, 958–961.
- Fauchereau, N. 2003. “Rainfall Variability and Changes in Southern Africa During the 20th Century in the Global Warming Context.” Natural Hazards 29 (2): 139–154.
- Feng, M. 2011. “Prototyping an Online Wetland Ecosystem Services Model Using Open Model Sharing Standards.” Environmental Modeling & Software 26 (4): 458–468.
- Feng, Q., J. Liu, and J. Gong. 2015. “Urban Flood Mapping Based on Unmanned Aerial Vehicle Remote Sensing and Random Forest Classifier – A Case of Yuyao, China.” Water 7 (12): 1437–1455.
- Frolov, A. V. 2016. “GIS-Amur System of Flood Monitoring, Forecasting, and Early Warning.” Russian Meteorology and Hydrology 41 (3): 157–169.
- Granell, C., L. Diaz, and M. Gould. 2010. “Service-Oriented Applications for Environmental Models: Reusable Geospatial Services.” Environmental Modeling & Software 25 (2): 182–198.
- Hammond, M. J. 2015. “Urban Flood Impact Assessment: A State-of-the-Art Review.” Urban Water Journal 12 (1): 14–29.
- Horita, F. E. 2015. “Development of a Spatial Decision Support System for Flood Risk Management in Brazil That Combines Volunteered Geographic Information with Wireless Sensor Networks.” Computers & Geosciences 80: 84–94.
- Hu, M. 2017. “Evaluation of Low Impact Development Approach for Mitigating Flood Inundation at a Watershed Scale in China.” Journal of Environmental Management 193: 430–438.
- Ivanov, S. V., S. V. Kovalchuk, and A. V. Boukhanovsky. 2013. “Workflow-Based Collaborative Decision Support for Flood Management Systems.” Procedia Computer Science 18: 2213–2222.
- Jiang, J. 2018. “Extraction of Urban Waterlogging Depth from Video Images Using Transfer Learning.” Water 10 (10): 1485–1495.
- Jiao, S., X. Zhang, and Y. Xu. 2017. “A Review of Chinese Land Suitability Assessment from the Rainfall-Waterlogging Perspective: Evidence from the Su Yu Yuan Area.” Journal of Cleaner Production 144: 100–106.
- Karnatak, H. C. 2012. “Spatial Mashup Technology and Real Time Data Integration in Geo-Web Application Using Open Source GIS – A Case Study for Disaster Management.” Geocarto International 27 (6): 499–514.
- Katsianis, M. 2008. “A 3D Digital Workflow for Archaeological Intrasite Research Using GIS.” Journal of Archaeological Science 35 (3): 655–667.
- Kulkarni, A. 2014. “A Web GIS Based Integrated Flood Assessment Modeling Tool for Coastal Urban Watersheds.” Computers & Geosciences 64: 7–14.
- Lan, G. 2017. “Optimizing Multi-Way Spatial Joins of Web Feature Services.” ISPRS International Journal of Geo-Information 6 (4): 1–17.
- Lin, C. 2011. “Impact of the Urban Heat Island Effect on Precipitation Over a Complex Geographic Environment in Northern Taiwan.” Journal of Applied Meteorology and Climatology 50 (2): 339–353.
- Lisein, J. 2013. “A Photogrammetric Workflow for the Creation of a Forest Canopy Height Model from Small Unmanned Aerial System Imagery.” Forests 4 (4): 922–944.
- Liu, Y. 2014. “Design and Implementation of Monitoring and Early Warning System for Urban Roads Waterlogging.” In: International Conference on Computer and Computing Technologies in Agriculture, 610–615. Springer, Cham.
- Lu, R., Y. Li, and B. Dong. 2007. “East Asian Precipitation Increase Under the Global Warming.” Asia-Pacific Journal of Atmospheric Sciences 43 (3): 267–272.
- Ma, X. 2017. “Linked Geoscience Data in Practice: Where W3C Standards Meet Domain Knowledge, Data Visualization and OGC Standards.” Earth Science Informatics 10 (4): 429–441.
- Ma, M. 2018. “Investigation of Inducements and Defenses of Flash Floods and Urban Waterlogging in Fuzhou, China, from 1950 to 2010.” Natural Hazards 91 (3): 1–16.
- Maina, M., M. Amin, and M. Yazid. 2014. “Web Geographic Information System Decision Support System for Irrigation Water Management: A Review.” Acta Agriculturae Scandinavica, Section B – Soil & Plant Science 64 (4): 283–293.
- Mathiyalagan, V. 2005. “A WebGIS and Geodatabase for Florida’s Wetlands.” Computers and Electronics in Agriculture 47 (1): 69–75.
- Meek, S., M. Jackson, and D. G. Leibovici. 2016. “A BPMN Solution for Chaining OGC Services to Quality Assure Location-Based Crowdsourced Data.” Computers & Geosciences 87: 76–83.
- Meng, L. 2017. “Biogeography-Based Optimization for Road Recovery Problem Considering Value of Delay After Urban Waterlog Disaster.” International Journal of Bio-Inspired Computation 9 (3): 157–164.
- Nie, W. 2017. “Impacts of Anthropogenic Heat on Summertime Rainfall in Beijing.” Journal of Hydrometeorology 18 (3): 693–712.
- Olalla, F. M., A. Calera, and A. Dominguez. 2003. “Monitoring Irrigation Water Use by Combining Irrigation Advisory Service, and Remotely Sensed Data with a Geographic Information System.” Agricultural Water Management 61 (2): 111–124.
- Panjalizadeh, H., N. Alizadeh, and H. Mashhadi. 2014. “A Workflow for Risk Analysis and Optimization of Steam Flooding Scenario Using Static and Dynamic Proxy Models.” Journal of Petroleum Science and Engineering 121: 78–86.
- Pompilio, L. 2013. “Spectroradiometric Field Surveys in Remote Sensing Practice: A Workflow Proposal, from Planning to Analysis.” IEEE Geoscience and Remote Sensing Magazine 1 (2): 37–51.
- Quan, R. S. 2010. “Waterlogging Risk Assessment Based on Land Use/Cover Change: A Case Study in Pudong New Area, Shanghai.” Environmental Earth Sciences 61 (6): 1113–1121.
- Richards, D., and P. Edwards. 2018. “Using Water Management Infrastructure to Address Both Flood Risk and the Urban Heat Island.” International Journal of Water Resources Development 34 (4): 490–498.
- Rosatti, G. 2018. “A Web Service Ecosystem for High-Quality, Cost-Effective Debris-Flow Hazard Assessment.” Environmental Modeling & Software 100: 33–47.
- Sampson, C. C. 2015. “A High-Resolution Global Flood Hazard Model.” Water Resources Research 51 (9): 7358–7381.
- Sang, Y. F., and M. Yang. 2017. “Urban Waterlogs Control in China: More Effective Strategies and Actions are Needed.” Natural Hazards 85 (2): 1291–1294.
- Segoni, S. 2009. “Towards a Definition of a Real-Time Forecasting Network for Rainfall Induced Shallow Landslides.” Natural Hazards and Earth System Science 9 (6): 2119–2133.
- Selsam, P., and C. Schwartze. 2016. “Remote Sensing Image Analysis Without Expert Knowledge – A Web-Based Classification Tool on Top of Taverna Workflow Management System.” In: IOP Conference Series: Earth and Environmental Science, 44(4), 1–6.
- Shi, S., and N. Walford. 2012. “Automated Geoprocessing Mechanism, Processes and Workflow for Seamless Online Integration of Geodata Services and Creating Geoprocessing Services.” IEEE Journal of Selected Topics in Applied Earth Observations and Remote Sensing 5 (6): 1659–1664.
- Singh, H., and R. D. Garg. 2016. “Web 3D GIS Application for Flood Simulation and Querying Through Open Source Technology.” Journal of the Indian Society of Remote Sensing 44 (4): 485–494.
- Singh, H., R. D. Garg, and H. C. Karnatak. 2019. “Online Image Classification and Analysis Using OGC Web Processing Service.” Earth Science Informatics 12 (3): 307–317.
- Singh, H., H. C. Karnatak, and R. D. Garg. 2017. “An Automated and Optimized Approach for Online Spatial Biodiversity Model: A Case Study of OGC web Processing Service.” Geocarto International 34 (2): 1–39.
- Sofos, I. 2017. “Applying OGC Standards to Develop a Land Surveying Measurement Model.” ISPRS International Journal of Geo-Information 6 (3): 1–21.
- Stratoulias, D. 2017. “A Workflow for Automated Satellite Image Processing: From raw VHSR Data to Object-Based Spectral Information for Smallholder Agriculture.” Remote Sensing 9 (10): 1–20.
- Su, B., H. Huang, and Y. Li. 2016. “Integrated Simulation Method for Waterlogging and Traffic Congestion Under Urban Rainstorms.” Natural Hazards 81 (1): 23–40.
- Tan, X. 2014. “Cloud- and Agent-Based Geospatial Service Chain: A Case Study of Submerged Crops Analysis During Flooding of the Yangtze River Basin.” IEEE Journal of Selected Topics in Applied Earth Observations and Remote Sensing 8 (3): 1359–1370.
- Tan, X. 2015. “Building an Elastic Parallel OGC Web Processing Service on a Cloud-Based Cluster: A Case Study of Remote Sensing Data Processing Service.” Sustainability 7 (10): 14245–14258.
- Tan, X. 2016. “Agent-as-a-Service-Based Geospatial Service Aggregation in the Cloud: A Case Study of Flood Response.” Environmental Modeling & Software 84: 210–225.
- Tang, X. 2018. “A Spatial Assessment of Urban Waterlogging Risk Based on a Weighted Nave Bayes Classifier.” Science of The Total Environment 630: 264–274.
- Van Der Aalst, W. M. 1998. “The Application of Petri Nets to Workflow Management.” Journal of Circuits, Systems and Computers 8 (1): 21–66.
- Van Der Aalst, W. M. 2003. “Workflow Patterns.” Distributed and Parallel Databases 14 (1): 5–51.
- Vuolo, F. 2015. “Satellite-Based Irrigation Advisory Services: A Common Tool for Different Experiences from Europe to Australia.” Agricultural Water Management 147: 82–95.
- Wang, H. 2018. “A New Strategy for Integrated Urban Water Management in China: Sponge City.” Science China: Technological Sciences 61 (3): 317–329.
- Wen, Y. 2013. “Prototyping an Open Environment for Sharing Geographical Analysis Models on Cloud Computing Platform.” International Journal of Digital Earth 6 (4): 356–382.
- Xia, J. 2017. “Opportunities and Challenges of the Sponge City Construction Related to Urban Water Issues in China.” Science China Earth Sciences 60 (4): 652–658.
- Xiao, Y., B. Li, and Z. Gong. 2018. “Real-Time Identification of Urban Rainstorm Waterlogging Disasters Based on Weibo Big Data.” Natural Hazards 94 (2): 833–842.
- Xue, F. 2016. “Numerical Simulation of Urban Waterlogging Based on Floodarea Model.” Advances in Meteorology 2016: 1–9.
- Yoo, C., K. Jung, and T. Kim. 2005. “Rainfall Frequency Analysis Using a Mixed Gamma Distribution: Evaluation of the Global Warming Effect on Daily Rainfall.” Hydrological Processes: an International Journal 19 (19): 3851–3861.
- Yu, H. 2018. “Spatiotemporal Variance Assessment of Urban Rainstorm Waterlogging Affected by Impervious Surface Expansion: A Case Study of Guangzhou, China.” Sustainability 10 (10): 1–22.
- Yu, H. 2019. “Evaluation of Waterlogging Risk in an Urban Subway Station.” Advances in Civil Engineering 2019: 1–12.
- Yue, P. 2013. “Intelligent Services for Discovery of Complex Geospatial Features from Remote Sensing Imagery.” ISPRS Journal of Photogrammetry and Remote Sensing 83 (3): 151–164.
- Yue, S. 2015. “A Data Description Model for Reusing, Sharing and Integrating Geo-Analysis Models.” Environmental Earth Sciences 74 (10): 7081–7099.
- Yue, P., M. Zhang, and Z. Tan. 2015. “A Geoprocessing Workflow System for Environmental Monitoring and Integrated Modeling.” Environmental Modeling & Software 69: 128–140.
- Zhang, J. 2016a. “Discussion on the Urban Flood and Waterlogging and Causes Analysis in China.” Advances in Water Science 27 (4): 485–491.
- Zhang, N. 2016b. “Social Media Meets Big Urban Data: A Case Study of Urban Waterlogging Analysis.” Computational Intelligence and Neuroscience 2016: 1–9.
- Zhang, F. 2019. “Design and Development of a Service-Oriented Wrapper System for Sharing and Reusing Distributed Geoanalysis Models on the web.” Environmental Modeling & Software 111: 498–509.
- Zhong, W., and Y. Zhang. 2017. “Feature-Filtering Data-Mining Algorithm for Urban Waterlogging Path Optimization in Extreme Weather.” In: 2017 7th International Conference on Advanced Design and Manufacturing Engineering, 1–4.