
ABSTRACT
To find disaster relevant social media messages, current approaches utilize natural language processing methods or machine learning algorithms relying on text only, which have not been perfected due to the variability and uncertainty in the language used on social media and ignoring the geographic context of the messages when posted. Meanwhile, a disaster relevant social media message is highly sensitive to its posting location and time. However, limited studies exist to explore what spatial features and the extent of how temporal, and especially spatial features can aid text classification. This paper proposes a geographic context-aware text mining method to incorporate spatial and temporal information derived from social media and authoritative datasets, along with the text information, for classifying disaster relevant social media posts. This work designed and demonstrated how diverse types of spatial and temporal features can be derived from spatial data, and then used to enhance text mining. The deep learning-based method and commonly used machine learning algorithms, assessed the accuracy of the enhanced text-mining method. The performance results of different classification models generated by various combinations of textual, spatial, and temporal features indicate that additional spatial and temporal features help improve the overall accuracy of the classification.
1. Introduction
The rise in social media, such as Facebook, Twitter, Flickr, LinkedIn, YouTube, and many others, in the past decade, has changed the way people interact with each other, and gain situational awareness (SA) during a disaster event. Social media, on one hand, can be used as a platform to provide critical information to the public about hazardous events for relief and recovery efforts (Houston et al. Citation2015). Disaster managers, on the other hand, can also gather social media data to monitor disaster events in real-time. With this approach, citizens involved with the disaster act as ‘sensors’ providing geo-located information to supplement authoritative data sources (De Longueville, Smith, and Luraschi Citation2009). Having a geographical SA through social media enables the identification of areas with infrastructure damage, affected people, and evacuation zones (Huang and Xiao Citation2015).
To identify social media data relevant to a disaster event and extract useful data for disaster coordination and response, different approaches have been developed (Ashktorab et al. Citation2014; de Albuquerque et al. Citation2015; Huang et al. Citation2015). One of the typical approaches, known as the text-based approach, involves text-matching by searching for specific keywords or groupings of words using machine learning algorithms to determine if the social media data is relevant (Ashktorab et al. Citation2014; Huang and Xiao Citation2015; Bakillah, Li, and Liang Citation2015; Landwehr and Carley Citation2014). This approach builds a classifier that categorizes text on the existence of keywords. Although text-based classification is a fast way to organize large datasets, it has two major limitations while identifying or differentiating all social media data related to a disaster:
Uncertainty and variability in the language used on social media (Bruns and Liang Citation2012). For instance, an algorithm might look on Twitter for the ‘#hurricanekatrina’ hashtag. If a user is unaware of the hashtag or even misspells it, the likelihood of classifying the data as disaster relevant decreases (Bruns and Liang Citation2012).
Social media data can be easily misidentified by purely relying on text without considering the geographic context. For example, during a flooding event, the message ‘the water is very high right now’ could have different contexts. While an individual on a riverfront within the disaster area most likely indicates, ‘the water level is high’, another individual at home far from the impact region could mean, ‘the water in the bathtub is high.’
To overcome these limitations, this study develops a context-aware texting mining method that integrates spatial and temporal information, revealing the geographic context of a social media post, to classify whether a tweet is relevant or not to a disaster. A variety of spatial data could contribute to inform the geographic and environmental context. Some spatial data are highly domain-specific. For example, during a flood event, information about how much rain has fallen and areas of lower elevation are important. This type of information can be derived from radar data products, weather station observations, and a digital elevation model. However, during a forest fire event, climate conditions (e.g. humidity) in the area or wind patterns are more relevant data. Other spatial data are less domain specific, the most prominent being proximity to the disaster. Based on Tobler’s First Law of Geography, individuals posting on social media about a tornado going through their town are more related to the disaster than an individual reading about the same event on social media hundreds of miles away (Tobler Citation1970). In addition to space, time is another important dimension useful in classifying disaster events. For management purposes, a disaster can be broken down into four phases: mitigation, preparedness, emergency response, and recovery. These phases can also be used as general references for social media data (Huang and Xiao Citation2015; Zou et al. Citation2018). Therefore, the first objective of this paper is to identify spatial data from which spatial and temporal features can be produced to help inform the geographic context of text messages.
In addition, current text-based classification models cannot directly assimilate raw spatial (e.g. remote sensing imagery) and temporal data. Instead, the classifier reads features, like text, as coded numeric values. Determining how to code each spatial and temporal feature is an area previously not well studied, but vital for this research. Therefore, this paper also aims to examine how spatial and temporal features can be derived, and to provide a reference on the utilization of the spatial and temporal data as features in the classification models. Furthermore, existing studies show that deep learning-based methods, such as convolution neural network (CNN) and recurrent neural network (RNN), significantly outperformed traditional machine learning approaches, such as support vector machine (SVM; Joachims Citation1998) for text classification tasks (Yu et al. Citation2019). However, it is not clear whether the integration of spatial and temporal features will improve the deep learning-based methods. As such, this study will then compare the performance of CNN models, one of the popular deep learning-based methods, with traditional text-mining approaches (e.g. SVM). In addition, we will further identify the spatial and temporal features that are useful to improve the accuracy of CNN models based on its performance evaluation while combining varying spatial, temporal and textual features.
To sum up, the following contributions are addressed in this research:
First, the paper introduces a methodology for integrating geographic context into classifying disaster relevant social media datasets by fusing spatial data with social media. The method addresses the shortcomings of utilizing only text to identify and extract disaster relevant social media data when considering geographic context is necessary.
Second, this paper demonstrates how to best process spatial and temporal data to derive associated features for classifying and identifying disaster relevant information.
Third, this paper assesses the types of spatial and temporal features necessary for the classification of disaster relevant social media data. Both domain and non-domain specific features are included in the assessment.
Finally, this work evaluates both traditional machine learning algorithms (e.g. SVM), and the state-of-the-art work deep learning-based method, CNNs, on SA information classification with spatial, temporal and textual features.
2. Literature review
2.1. Social media for disaster events
Social media data presents many advantages, such as timeliness of information, relevance at the community level, low cost, and adaptability (Keim and Noji Citation2011), over standard communication methods during disaster events (Houston et al. Citation2015). As a result, they are widely used for real-time dissemination of information by allowing for both sending and receiving of messages during disaster events (Xiao, Huang, and Wu Citation2015; Keim and Noji Citation2011). When traditional sources of communication lack information or cannot keep up to date on current information, social media can also serve as a backchannel communication platform allowing user-driven information acquisition and sharing (Xiao, Huang, and Wu Citation2015; Sutton, Palen, and Shklovski Citation2008). Peer-to-peer backchannel communications on social media fill information gaps when official sources of information are unavailable.
Meanwhile, social media is also widely leveraged for disaster event detection (Ford Citation2011), SA establishment (Huang and Xiao Citation2015), and disaster mapping (Li et al. Citation2018). For example, during an earthquake in Virginia in 2011, people in the eastern United States reported learning about the event on Twitter before feeling the earthquake at their location (Ford Citation2011). Another form of event detection is finding users in need of assistance on social media. For instance, during a 2011 tsunami off the coast of Japan, several tweets were direct requests for assistance (Acar and Muraki Citation2011). One of the tweets read, ‘We’re on the 7th floor of Inawashiro Hospital, but because of the risen sea level, we’re stuck. Help us!’ (Acar and Muraki Citation2011). This type of message is critical to detect, but requires a high degree of verification (Lindsay Citation2011). To overcome the difficulty of disaster event detection, one of the emerging uses of social media for disaster events is the extraction of SA for coordination and relief operations (Huang and Xiao Citation2015). For example, Ashktorab et al. (Citation2014), created Tweedr, a Twitter-based data mining tool that extracts actionable information for disaster relief workers during natural disasters based on keywords. Zahra, Ostermann, and Purves (Citation2017) investigated different types of sources on tweets related to eyewitnesses and classifies them into three types (i) direct eyewitnesses, (ii) indirect eyewitnesses, and (iii) vulnerable eyewitnesses.
While the use of social media for disasters clearly has a variety of advantages over traditional methods of communication, social media has raised concerns to the veracity of its data and grand challenges while being used to make decisions (Goodchild and Glennon Citation2010; Goodchild and Li Citation2012). The first issue is in the accuracy of the information. Using geo-tagged tweets to find incident locations can pose a problem if the user is tweeting about something he or she experienced at a different time and location (Gao, Barbier, and Goolsby Citation2011). Another case of data inaccuracy occurred in 2011 during the Tohoku earthquake. Tweets seeking assistance appeared long after the people in need were rescued creating greater confusion for disaster managers (Lindsay Citation2011). During a disaster event, disaster managers must make timely decisions based on the data available. If the data is unreliable, the decisions could have catastrophic consequences. Another problem with the veracity of social media data is when social media is used maliciously (Huang and Xiao Citation2015; Yang et al. Citation2019). The generation of social media for pranks, attacks, and rumors is common (Lindsay Citation2011). Falsified requests for help can draw first responders away from helping those in true need of assistance. Moreover, the rumors and falsified reports can spread through social media easily (Lindsay Citation2011).
To tackle the reliability issues associated with social media data during a disaster event, a temporal understanding of the generation of social media from the beginning to the end of the disaster is important. Houston et al. (Citation2015) proposed a simple three-phase disaster classification for social media, pre-event, event, and post-event. During the pre-event phase, social media users send and receive information about the disaster event. The three-phase classification is a simple way to classify social media data during a disaster event. Other efforts classified social media into the typical four-phase categorization (mitigation, preparedness, response, and recovery) or even forty-seven different themes during different disaster phases (Huang and Xiao Citation2015). However, in a real-time disaster event the sheer volume of data from social media poses a challenge for storing and analyzing the data generated in real-time and at changing rates. Among the massive data generated during a disaster event, only a small portion contributes to the establishment of SA. Any solution for utilizing relevant social media data during disaster events must have the processing capabilities to handle the stream of data efficiently. The proposed method will overcome the challenges of data volume by using text mining techniques to automatically search through the social media data for SA relevant information.
2.2. Text mining for extracting disaster relevant information
One way to overcome the challenges associated with the volume of social media data is by searching through the text for patterns in the words that might signify data related to a disaster. Many different techniques have been applied for text mining social media data by developing a classification scheme or model to predict if a particular social media post relates to the disaster event. The first step in creating a model is generating a set of keywords. With Hurricane Sandy, the keywords might be sandy, hurricanesandy, or hurricanenyc (Huang and Xiao Citation2015). These keywords act as an initial filter to remove messages irrelevant to the disaster. One inevitable consequence of this filtering approach is not capturing all messages relating to the disaster event. Some social media data users might be unaware of the existence of a certain keyword being used, they might use a unique keyword no one else is using, or their data contains only a picture or video and no text at all (Bruns and Liang Citation2012). To improve the overall accuracy, an understanding of the data misclassified as irrelevant in the current research methodology is necessary.
The next step is determining the n-grams used to train the model. N-grams are a set of co-occurring words within a set of words. For example, during a flood a user posts the message ‘I am stuck in a flash flood please help!’ Using the unigram or 1-gram approach means each word becomes a single token read by the classifier. Increasing to a bigram or 2-gram would lead to two word tokens, such as ‘flash flood’ or ‘please help.’ While increasing the amount of words per token yields more information, the classification accuracy does not improve significantly (Halteren, Zavrel, and Daelemans Citation2001). Hence, when creating a model for disaster events, unigrams are standard practice (Ashktorab et al. Citation2014; Spinsanti and Ostermann Citation2013; Huang and Xiao Citation2015).
Finally, a classification algorithm runs using training data. Traditionally, five machine learning algorithms, K-nearest neighbors, decision trees, naïve Bayes (Zahra, Ostermann, and Purves Citation2017), logistic regression (LR), SVM, and Random Forest (Zahra, Imran, and Ostermann Citation2020), are commonly used for text mining (Ashktorab et al. Citation2014; Spinsanti and Ostermann Citation2013; Huang and Xiao Citation2015; Bruns and Liang Citation2012; Zahra, Ostermann, and Purves Citation2017). However, recent studies indicate that deep learning-based methods achieved better performance than these algorithms and in various natural language processing tasks (Yu et al. Citation2019). For example, a toponym recognition model, extending a general bidirectional recurrent neural network model, is developed for accurate location recognition in social media messages with various language irregularities (Wang, Hu, and Joseph Citation2020). Improving the accuracy of text mining approaches is the main motivation for this research. Instead of following the current research track of focusing solely on the classification schemes and algorithms themselves, this research incorporates spatial information about the social media data into the classification algorithm, and also compared the performance of deep learning-based CNN models, with several traditional classification models for SA information classification.
2.3. Remote sensing for tracking disaster events
Remote sensing data provide additional geographic information for detecting and tracking a disaster event. For example, algorithms detect tornadoes by finding slight differences in the patterns of radar images (Alberts et al. Citation2011). The methods used for detection and tracking of disaster events are similar to the text mining approaches mentioned in the previous section (Roy and Kovordányi Citation2012). However, unlike text mining where training data are discrete, remote sensing data for disasters involves training data that are continuously leading to more complex pattern recognition and processing (Lakshmanan and Smith Citation2009). Moreover, data mining remote sensing images requires separate identification algorithms and attribute extraction methods for each type of disaster event. In other words, the algorithm to detect and track a hurricane will be vastly different from that of a tornado, whereas generalized text mining algorithms apply to many disasters. Consequently, a high degree of domain knowledge of the disaster in the context of remote sensing is required to accurately detect these types of disasters (Lakshmanan and Smith Citation2009). The proposed a context-aware text mining method builds upon the current remote sensing data mining methods described by Lakshmanan and Smith (Citation2009) by combining the spatiotemporal information about the disaster with social media data to determine disaster relevant social media data.
2.4. Social media and authoritative data fusion
During a disaster event, disaster managers and planners use many different data sources to assess the situation. Leveraging other data sources, like satellite or other geographic data, could improve the analysis of social media data during a disaster event. In previous works, Twitter data estimated trajectories of earthquakes, tracked the locations of tornadoes, and detected wildfire hotspots (Crooks et al. Citation2013; Jain Citation2015; De Longueville, Smith, and Luraschi Citation2009). Meanwhile, disaster detection is not always possible using social media as was determined during a 2013 flooding event (Fuchs et al. Citation2013).
One promising area of research is to fuse social media data with other forms of spatial data for disaster events. de Albuquerque et al. (Citation2015) used ‘authoritative’ hydrological data for a flood event with social media messages to confirm the presence of the flood in the disaster region. They also found that the closer the social media data was to the event, the more likely it was to be about the flood event. This simple quantitative assessment shows how additional datasets can improve social media data identification. Similarly, Spinsanti and Ostermann (Citation2013) introduced an approach that first geo-references and retrieves content from social media data, followed by an enrichment with additional geographic context information from authoritative data sources, and clustering spatio-temporally to support filtering and verification.
Another approach to fusing remote sensing data with social media is by using the social media data as a way to overcome the limitations of remote sensing data (Wang et al. Citation2018; Huang, Wang, and Li Citation2018a). For example, social media data was used to verify the presence of water in a specific area during a flooding event when remote sensing imagery was unavailable (Schnebele and Cervone Citation2013). Alternatively, Huang, Wang, and Li (Citation2018) introduced an approach to retrieve near real-time flood probability map by integrating the post-event remote sensing data with the real-time tweets (Huang, Wang, and Li Citation2018a). A flood inundation reconstruction model was further proposed to enhance the normalized difference water index derived from remote sensing imagery with both stream gauge readings and social media messages (Huang, Wang, and Li Citation2018b). Rosser, Leibovici, and Jackson (Citation2017) fused remote sensing, social media and topographic data sources for rapidly estimating flood inundation extent by a Bayesian statistical model to estimate the probability of flood inundation through weights-of-evidence analysis.
To sum up, much progress has been made to extract useful social media information, enrich them with additional authoritative datasets (de Albuquerque et al. Citation2015; Spinsanti and Ostermann Citation2013), and overcome the limitations of or enhance remote sensing data with social media data (Wang et al. Citation2018; Huang, Wang, and Li Citation2018a; Rosser, Leibovici, and Jackson Citation2017; Schnebele and Cervone Citation2013). Given the infancy of spatial and social media data fusion for disaster management, no prior work fully examines the temporal, and particularly spatial features, and incorporates these features for extracting disaster relevant social media data. As such, this paper presents the context-aware text mining method, including the methodology for both social media and spatial data extraction using data mining algorithms.
3. Geographic context-aware text mining
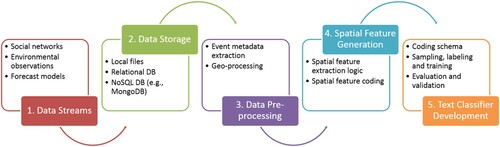
Context-aware text mining is an enhanced text mining method that incorporates SA about the disaster in the form of geographic data into the text classification. The proposed method includes five key components ():
Social media and spatial data streams: A real-time disaster management scenario is the intended use of the method. Data in a variety of formats (e.g. point, polygon, raster, text) and volumes stream into the workflow from multiple sources.
Database storage: With the high volume of data generated dynamically, storage is necessary before and after processing. Due to scalability and spatial functionality, the storage of social media and spatial data is separate. NoSQL databases (e.g. MongoDB) can handle the high volume of social media content, while PostgreSQL/PostGIS supports a variety of spatial queries and operations of spatial data.
Data pre-processing: The social media data streams in a uniform format of text with an associated point in time. However, the challenge with the spatial data is its variety. Before the spatial information can be stored, scripts process the data into uniform data types and file formats. This is also the point in the method where event detection takes place. Disaster event detection is an important step for creating a dynamic spatial filter within the method compared to a traditional bounding box. In turn, the method uses spatial information associated with the dynamic assessment of the disaster extent as a feature in the text classification. It is important to note detecting a disaster event using spatial data is an active research topic that is highly domain specific.
Spatial feature generation: The center of the spatial text mining method is the spatial feature extraction. Using fuzzy logic, spatiotemporal information from a social media post generates the spatial features relevant to the disaster. The result is a social media post with metadata in the form of spatial features.
Text classifier development: Staying consistent with current methods, social media data with geographic metadata travel through a classifier to determine disaster relevant social media posts. This paper evaluates and validates the results from the classifier to determine if the addition of geographic information improves the text classification.
Figure 1. The workflow of geographic context-aware text mining.
3.1. Data streams, processing, and storage
3.1.1. Case study
To test the context-aware text mining method, Hurricane Sandy from 2012 was selected for the case study. Hurricane Sandy (22 October 2012–2 November 2012) was the 18th named tropical cyclone for the 2012 Atlantic Hurricane. It made landfall in the United States (US) as an extratropical cyclone, much weaker than when it hit Cuba days earlier. However, Sandy had a significant spatial impact with winds spanning 945 miles in diameter, making it the largest storm ever observed in the Atlantic (Blake et al. Citation2013). Another important factor for measuring a hurricane is the sustained wind. Numerous weather stations in New York and New Jersey reported sustained winds greater than 70 kts or hurricane strength even though the storm was an extratropical cyclone. The highest recorded wind gust after landfall was 83 kts on the north shore of Long Island, New York (Blake et al. Citation2013). Rainfall is another impact from hurricanes that can lead to flooding, especially in urban and low-lying areas. The heaviest rain occurred in parts of Maryland, Virginia, and Delaware receiving between five and seven inches. The meteorological impact that resulted in the greatest causalities and damage was the storm surge. Sandy caused water levels to rise from Florida to Maine. The highest storm surge and greatest inundation on land occurred in New Jersey and New York, especially in and around New York City.
3.1.2. Data and data processing
Before the collection of data, a study area for Hurricane Sandy was selected. Hurricane Sandy affected states in the southeastern US, like South and North Carolina, as well as many states in the northeast. To capture the disaster beginning right before the stage of landfall, a 400 by 450 mile bounding box was constructed and centered at the location of landfall (). With a diameter over 800 miles at landfall, the bounding box contains the storm and includes major metropolitan areas, such as New York City and Washington, DC.
Figure 2. Study area and storm track of Hurricane Sandy.
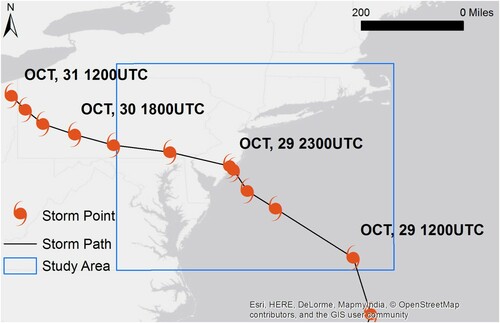
For the case study, Twitter, a text-based microblog with millions of active users, is selected as social media service for disaster relevant message extraction. Twitter provides access to its messages or tweets through two public application programming interfaces (API). The search API allows for retrieval of past tweets based on search criteria (location, keyword, user, etc.). The streaming API retrieves up to 1% of the most recent tweets based on search keywords and spatial extent (Morstatter et al. Citation2013). In total, 12.3 million geo-tagged Tweets were collected from 28 October 2012 to 7 November 2012 () using Twitter streaming API with the ‘Hurricane’ and ‘Sandy’ as search keywords, and global as the geographical boundary. After performing a spatial filter based on the bounding box (), the number of Tweets was reduced to 2.8 million.
Table 1. Hurricane Sandy data.
The meteorological data offers a variety of ways to measure the hurricane both qualitatively and quantitatively. Additionally, the generated data is from different sources with different formats and different spatial and temporal resolutions (). Hurricane track points, produced by the National Hurricane Center, indicate the location of the hurricane center at important stages in the life of the storm (e.g. change in strength or landfall). By connecting the points, one can get a sense of the overall track of the storm. To get more detailed weather measurements on the ground, 128 Automated Weather Observing System (AWOS) stations were used. These stations are primarily located at airports and take measurements at least every hour depending on the conditions. AWOS units collect data on many weather variables, such as wind, temperature, dew point, precipitation, and pressure. The radar data comes from six different NWS radar stations in the study area. In terms of data storage, the radar data was by far the largest dataset at ∼45GB due to the temporal resolution (). Two products were kept for the rest of the study: base reflectivity (the common weather radar view) and storm total precipitation.
The NWS plays a key role in any meteorological disaster by communicating to both the government and public the severity of the event. The issuing of watches, warnings, and advisories () is one well-known way to accomplish this. Storm reports from the NWS were also collected. These reports are a form of volunteer geographic information from experts and the public. Information in the reports includes wind speeds, rain totals, areas of flooding, and damage caused by the storm. The NWS verifies reports through weather data they collected or by in person visits, and updates storm reports frequently during a real disaster event.
Table 2. Hurricane Sandy watch/warning/advisory definitions (NWS Citation2021).
The North American Mesoscale Forecast System (NAM) is a high-resolution forecast of hundreds of products. The NAM model runs every 6 h predicting the next 84 h in hourly time steps. Being able to predict where the storm is heading is important for disaster planning purposes. Five NAM products were selected for this study: MSL pressure (for understanding the disaster extent), 1-hour total surface accumulation, surface wind speed, categorical rain (a binary rain classification), and hybrid radar reflectivity. Finally, the 24-hour precipitation analysis data provides the total precipitation over the last day. Derived from radar and rain gauge reports, this hybrid product provides a high-resolution understanding of how wet it might be in an area ().
One challenge of using the context-aware text mining method is the data variety. Before the data transfers into a database, individual processing of the different data sets occurs. For this study, three important standards were established. First, all spatial data are transformed into the WGS84 coordinate reference system for data analysis. Second, vector data are stored in a Shapefile format and raster data in a GeoTIFF format. This standardization allowed for a simple ingestion into the database. Finally, all date and time parameters were converted into Epoch time. Having the temporal data stored as an integer saves processing time when comparing data.
Each dataset presented its own challenges for standardization. For example, the radar data exists natively in a binary format. The Weather and Climate Toolkit (Ansari, Del Greco, and Hankins Citation2010), developed by the National Oceanic and Atmospheric Administration (NOAA), read and exported the data as GeoTIFFs. Additionally, the radar and NAM model data were originally stored as single band GeoTIFFs for each product. GDAL (GDAL Citation2021) was used to merge the data into multiband GeoTIFFs based on the timestamp. A final challenge involved reading the weather observation data. Each observation comes in a coded text string called a Meteorological Terminal Aviation Routine Weather Report (METAR). Using the Python package METAR (Pollard Citation2021), each observation was decoded.
For the purposes of this study, the hurricane track points simulated the event detection phase of the context-aware text mining method (). With proper domain knowledge of the event detection algorithms, one could implement this step in the workflow.
3.1.3. Data storage
The variety of social media data poses a challenge for traditional data management following the relational model (Huang and Xu Citation2014). Social media services utilize the NoSQL database model as a way to best manage their data. Unlike the traditional relational model, NoSQL implements many different data structures, such as document, graph, or key-value. The flexibility with NoSQL allows for data from multiple social media services to be stored in one location within the workflow. MongoDB (Banker Citation2011) was selected as the NoSQL database. In addition to the reasons state above, MongoDB stores its data in JavaScript Object Notation (JSON) which allows non-uniform fields to be added with no limitations. Most popular programming languages also easily parse JSON. Additionally, MongoDB is scalable allowing multiple servers to store and access the database. For the meteorological data, PostgreSQL was selected as PostgreSQL with the PostGIS extension can store both raster and vector data types, is open source, and provides a wide range of spatial functionality. Note other database systems could provide similar supports for social media data or spatial data management. For example, PostgreSQL also supports JSON data type and offers sufficient JSON operators and function to enable the storage of social media data.
3.2. Spatial feature generation
3.2.1. Spatial feature determination
The key step in the context-aware text mining method is the spatial feature generation. In this step, the spatial data is bound to each social media post as a feature through fuzzy logic. Before performing this task, useful spatial features for the hurricane case study should be determined. Hurricanes are characterized by heavy rain, high winds, and low atmospheric pressure (Roy and Kovordányi Citation2012). Thus, it is logical to include these characterizations as spatial features (i.e. rain, wind, and pressure). Since pressure is related to the hurricanes strength, the category of the storm instead of a pressure measurement was used. A few other useful features were also derived from the core geographic features. A flood feature was added because the flooding and storm surge often have a dangerous impact. Another derived feature added was the presence of an NWS warning meaning an area is in imminent danger of a certain weather hazard. Distance or proximity from the center of the hurricane was the final added spatial feature. Two temporal features were added to reveal temporal detail to the feature space, including (1) the date of the social media post, and (2) a binary indication of whether the location was currently experiencing the storm or the storm had past.
3.2.2. Feature extraction logic
The feature extraction algorithm for the Hurricane Sandy case study used fuzzy logic to determine the value associated with each geographic feature. Given the spatiotemporal complexity of the datasets being used to generate features, ascribing context at the single time of a social media post requires more than a binary logic. details the general conditional logic for each feature. The first decision point in the logic was relation of time to the social media post. If a post happened after the storm dissipated, there was no meteorological data available. However, this does not necessarily mean a post is not disaster relevant. For example, a person might post a picture of a fallen tree after the storm has passed. To account for this, the rule was to use the time when the storm was closest to the point, but note in another feature that the storm had past. A storm was also denoted as past if the distance exceeded a threshold and the storm was located to the northwest of the post.
Table 3. Spatial feature generation logic.
With the time sorted out for a social media post, the next step was to access the data from various sources. Since data was generated on different temporal scales, it was highly unlikely that the meteorological data occurred at the same time as the social media post. To solve this problem, each meteorological data product had a valid time criterion. For instance, to use an NWS warning, the post had to have happened within a warning polygon and within the issue and expire times. Another example, to use a storm report, the post must have occurred within 30 min of the report.
After the temporal bounds are determined, the social media post must satisfy spatial criteria for each meteorological data product. For raster and polygon data, this involved a simple intersection to attain the attribute value. The numerous point data products required a distance calculation. For example, in addition to the 30 min time limit, a social media post needed to be within 10 miles of the storm report to attain the attribute value. The exact spatial and temporal features were chosen based upon accuracy and temporal frequency limitations of the datasets selected as well as physical characteristics of the disaster event. For instance, the same logic used during a tornado event which occurs on a short time scale and smaller area would not provide the appropriate context to the social media post.
The last step in the feature generation algorithm was to rank the data products based on reliability of the data. Each spatial feature had multiple meteorological data sources that could explain the feature. For instance, when describing the wind feature, the most accurate data came from weather station observations. Conversely, the weather model provided wind data, but the spatial and temporal resolutions were not as great. In the event a social media post had values for both data products, the weather station observation was chosen. lays out the ranking for each meteorological data product.
3.3. Annotation and classification
3.3.1. Feature annotation
After the completion of spatial data processing, all features were annotated with a class for the supervised classification. While some machine learning algorithms can handle numerical data, the algorithms used in the spatial text mining framework rely on categorical data. This approach stayed consistent with the transformation of words into categorical vectors.
Annotating the social media text data requires a degree of domain knowledge. Previous studies have created different classification schemes to best describe disaster-related social media (Gao, Barbier, and Goolsby Citation2011; Huang and Xiao Citation2015; Imran et al. Citation2013; Vieweg et al. Citation2010). One common methodology is to create a two-tiered classification scheme (Imran et al. Citation2013). First, social media messages are classified as personal, informative, or other. Personal messages are messages only of interest to the author or their immediate circle. Informative messages are of interest to people beyond the author’s circle. After the initial filter, informative messages are further classified into more classes, including (1) Caution and Advice (CA), (2) Casualties and Damage (CD), (3) Information Sources (IS), (4) Donation and Aid (DA), and (5) People (Imran et al. Citation2013; Vieweg et al. Citation2010). The goal of the two-tiered classification is to describe the overall understanding in disaster events or SA. Based on Imran et al.’s (Citation2013) coding schema, a majority of messages are classified as CA. Therefore, in our work, we created an additional class, named as Infrastructure and Resource (IR) containing messages reporting the status of infrastructure (e.g. transportation) and resource (e.g. gas, power, internet, food), which is not reported by an official news source or requests for donation or aid ().
Table 4. Social media classification scheme.
shows the classification scheme of spatial and temporal features, which are not well studied in the literature. The date feature is the date the post was generated. The disaster status feature is an indication of the spatiotemporal relationship of the hurricane and social media post at the time the post was sent. For example, if the hurricane is moving away from the post, the feature is classified as past. Conversely, if the hurricane is approaching the post location or is overhead, the classification is present. A distance feature measures the proximity of the post to the center of the storm. Distances from the storm were clustered using the density-based spatial clustering of applications with noise (DBSCAN) algorithm discussed in Section 4.
Table 5. Spatial and temporal feature classification schemes.
The classification schemes about other spatial and temporal features are less straightforward requiring domain knowledge. In practical applications, domain experts have generated different scales to measure meteorological features. For example, hurricane strength is measured on the Saffir-Simpson Hurricane Wind Scale (NHC Citation2017). This scale is represented by the storm category feature. Another useful meteorological scale is the Beaufort Wind Scale (Citation2021). The scale provides both land and sea descriptions for different strengths of wind from clam to hurricane force. The wind feature is calculated from the Beaufort Wind Scale. Precipitation intensity feature is calculated using the NWS Radar Scale, which converts radar reflectivity into a precipitation intensity. The final two meteorological features flood and warning, utilize the NWS categorical watches, warnings, and advisories classification. For example, if a post occurred in a flash flood warning, flash flood would be assigned to the flood feature and the warning feature set to true.
3.3.2. Feature classification
Where the spatial feature generation is the key component of the framework, the text mining component is necessary for generating the desired outcome. The goal of this component is to determine if a social media post is disaster relevant or not. Accuracy is the primary indicator of assessment and relates directly to research question two. With the text mining features prepared by the spatial feature generation component, this step required an appropriate choice for text mining algorithms to establish the classification model. Right now, there is a variety of classification algorithms available, such as K-nearest neighbor, decision trees, LR, and neural networks. In particular, the Naïve Bayes and support-vector machines models are commonly used (Ashktorab et al. Citation2014; Spinsanti and Ostermann Citation2013; Huang and Xiao Citation2015; Takahashi, Tandoc, and Carmichael Citation2015). However, deep learning has produced better results for various tasks in text mining, such as topic classification, sentiment analysis, question answering, and language translation (Yu et al. Citation2019). As such, this study will examine the capability of CNN models, one of the popular deep learning-based methods, for SA message classification.
presents the CNN architecture, which is the configuration for tweet message classification. Preprocessing converts tweets into lists of 50 integers and represents each word of the tweet by an integer. The preprocessed tweet then passes through the first layer, word embedding, which expands the word integers to a larger matrix and represents them in a more meaningful way. The word embedding layer uses Word2Vec (Mikolov et al. Citation2013) to embed semantic similarity information in the representation of words and expands each word into a vector of 300. The convolution layer extracts features from the word embedding and transforms them through global max pooling. The convolution layer uses neurons with filter size of 3, stride of 1, zero padding, and depth of 250 (). The extracted features are then concatenated with spatial and temporal features, which represent the tweet’s distance from hurricane center and the surrounding geographic and meteorological environment. Then two fully connected layers predict the themes of each tweet. Dropout layers are utilized before the convolution layer and the last fully connected layer, while activation functions are used after the convolution layer and the fully connected layers.
Figure 3. Overall architecture of the CNN: (a) tweet text only, and (b) using spatially enhanced tweets.
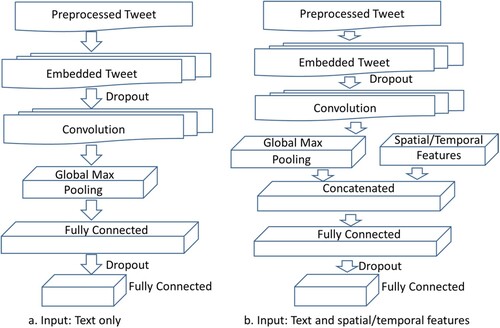
Table 6. Dimensions of layers and operations.
To generate a training sample for classification, the 2.8 million social media posts were filtered using the hashtag #sandy. With 33,963 posts remaining, a random sample of 5000 posts was taken. The authors used the classification () to manually classify the sample. When the class definition of a post was not obvious, experts gave feedback to finalize the class.
One limitation of the concatenation between the spatiotemporal features and the output of the global max pooling layer is that the dimension of the max pooling layer is significantly higher than the one of the spatiotemporal features. An alternative approach is to assign the spatiotemporal features with a higher degree of influence using higher weights.
3.4. Spatiotemporal distribution of sample data
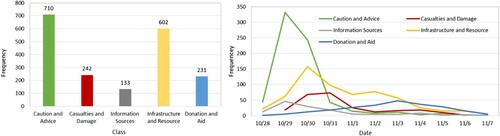
Before running the classification experiment (Section 4), understanding the spatiotemporal distribution of the labeled sample data was important for interpreting the results. Of the 5000 social media posts sampled, 1920 posts were labeled as informative. Within the sample, only 2 posts belong to the People missing or found class, and therefore this class was removed from the classification experiments due to the low sample count.
In , the breakdown in posts per class was not surprising. CA was the most general class and contained the most posts, followed by the IR class. The CA posts include disaster preparation information (e.g. stock up food) and status (e.g. wind speed of the Hurricane Sandy) of a disaster event. During the disaster, the IR class contained posts with information about inaccessible areas or lack of resources. Additional posts about closures and traffic information fell into this class. CD and DA classes had roughly the same number of messages. Both classes occur during and after the disaster event. The IS class had very few samples without a clear temporal pattern. Analysis of the IS class is included in Section 4.
Figure 4. The frequency (Left) and temporal distribution (Right) of informative posts.
4. Experimental design and analysis
This section first describes the experimental design to identify spatial and temporal features for the Hurricane Sandy case study that is key to describing and then classifying disaster relevant social media posts, followed by the results from the spatial and temporal feature determination. Finally, the section discusses the results of the feature combination experiments.
4.1. Experimental design
4.1.1. Selected experiments
To determine if geographic features improve the accuracy of current text-only methods, a series of experiments were designed (). A text-only experiment would serve as the control to the other spatial experiments. The next experiment used all features. However, utilizing all features poses two problems. First, using too many features, especially irrelevant and correlated ones, may not necessarily generate the desired model (Kohavi and Sommerfield Citation1995). Second, the goal of this research is to identify the key spatial features or the minimal number of features that give the best accuracy. As such, four additional experiments tested the number of features based on hypotheses derived from domain knowledge.
Table 7. Context-aware text mining experiment design.
In a disaster event, distance from the center of the event is important for determining the relevancy of social media posts (de Albuquerque et al. Citation2015). Thus, the hypothesis is that distance by itself would improve the classification accuracy when combined with text. Another feature hypothesized to aid in the classification accuracy was the date feature. The classification scheme utilized in this and many other research studies is by nature time sensitive. For example, social media posts about donation and aid are more likely to occur during and after a disaster event (). Since the machine learning algorithms selected for this study are dependent on probabilities, the expectation is that the date feature will improve the classification. In addition, combining the distance and date feature with the text feature would likely give the best results. Out of curiosity, a third experiment related to distance and time was created which combined what the authors determined to be the best features for describing the study based on empirical tests of the features. The last experiment combined the remaining spatial features related to the meteorological data.
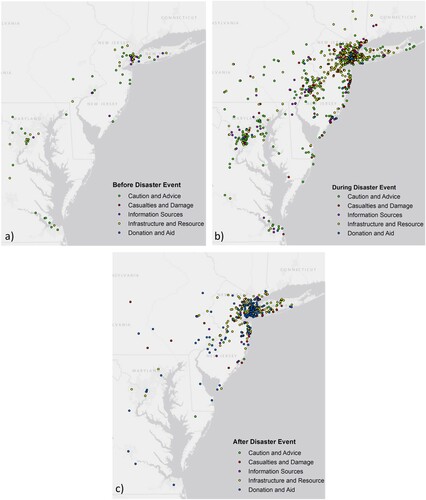
Figure 5. Spatial distribution of sample data by different classes at different disaster stages, including before (28 October; a), during (29–31 October; b), and after disaster event (1–7 November; c).
4.1.2. Performance measures
To assess the results of different classification experiments, the study incorporated a set of performance measures common with model assessment. Running the labeled data through a supervised classifier involves taking a subset of the data to train the classifier and the remainder of the labeled data to test the classifier. One potential error associated with this approach is for bias to exist in the training data resulting suboptimal results. Cross-validation is a technique used to evaluate the model by partitioning the sample data into k equally sized subsamples. From there k–1 subsamples represent training data with a single subsample as the test data. The cross-validation process repeats k times with the results averaged from the k iterations. For this study, the value of k is ten. Moreover, a stratified version of cross-validation ensures a proportional representation of each class in each subsample.
After the cross-validation is complete, several metrics determine the classifiers accuracy: precision, recall, and F-1 score. The precision of a class is the number of correctly classified samples divided by the total number of samples classified as a class. Meanwhile, recall is the number of correctly classified samples divided by the actual number of samples for a class. Another way to think about recall is as a measure of sensitivity in the classification. In theory, precision and recall are unrelated, but in practice, high precision usually leads to a lower recall and vice versa. To overcome this problem of metrics, this study also used F-score to evaluate the results. The F-score is a single measure based on the harmonic mean of the precision and recall. Overall accuracy for an experiment was determined by averaging the F-score over the different classes.
4.1.3. Classifier selection
Before the primary feature experiments, a classification experiment was conducted using only the text feature to select the most effective classification algorithm, which was then used for the remainder of the experiments. As discussed earlier, from the well-established classification algorithms, three were selected based on previous text mining studies: LR, SVM, and CNN.
Not surprisingly, the CNN performed better in text mining tasks demonstrated with higher accuracy values than the other two algorithms in all three evaluation metrics (). Therefore, the remaining experiments utilized the CNN.
Table 8. Text-only algorithm experiment.
4.2. Feature determination
4.2.1. Spatial features
Determining the feature annotation for the distance from the center of the disaster is not a trivial task (Section 3.5.1). Originally, the distance feature contained classes for different distance ranges loosely based on the radius of the storm. For example, if a user posted more than 250 miles away from the storm, the distance was coded as irrelevant because the post was too far away from the storm. While this simple feature annotation provided reasonable results in the classification, there are several issues using this strategy. First, having fixed distance ranges does not account for the potential temporal variability associated with the different text classes. For instance, a social media post classified as DA is more likely to occur after the storm has passed. However, the distance from the center of the storm might be greater than the 250-mile threshold. Second, an arbitrary distance classification does not account for the spatial patterns that exist in the sample data. In fact, the sample data mostly clusters around metropolitan areas. In theory, the social media posts nearest to one another have similar experiences from the disaster.
To test the impacts of the distance feature annotation, an experiment was conducted using the DBSCAN algorithm (Ester et al. Citation1996) to cluster the posts based on distance from the center (l), the date (d), and the latitude (lat) and longitude (lon). DBSCAN is a density-clustering algorithm which groups points based on a minimum number of points (i.e. samples; minpts) within a specified epsilon or search distance (eps). High-density points cluster into groups and low-density points are treated as noise. After running DBSCAN, a set of clusters are produced with each cluster and we can assign each cluster with a unique ID. Next, each clustered sample point is given its associated cluster ID as the distance feature, and the distance feature for all noisy points is set to 0. To test which attributes (l, d, lat and lon) should be used to calculate the distance between samples in DBSCAN, we evaluate the classifiers generated by using the clustering results with different combinations of these attributes, including (1) l, (2) l and d, (3) lat and lon, and d, and (4) lat and lon, along with text as the input features. It is worth noting that the results of DBSCAN are sensitive to the choice of minpts and eps value. In our work, minpts value remained at 4 and the eps value was changed until a consistent number of clusters were found for each experiment setting. The highest F-score occurs when l and d are the clustering attributes. However, using the date feature in the DBSCAN and as a feature in the classification () could result in feature redundancy. To minimize feature redundancy, the second-best trial, lat, lon, and l, was selected as the classification of the distance feature.
4.2.2. Temporal feature
In addition to the distance feature, the temporal feature was hypothesized to be important for improving the text classification. As previously mentioned, the text classification scheme () is associated with time. For example, a day before the disaster event, the few messages were posted primarily related to the CA and IR class. This type of result meets the expectation of a disaster because no damage exists prior to the event.
Spatially, the posts before the storm are in metropolitan areas ((a)). As the storm affects the disaster area, the IS and CD classes become more prominent ((b)). While the frequency of posts increases in the metropolitan areas, the areas hit hardest along the New Jersey coast extending inland become flooded with messages. Finally, after the storm dissipated, the prominent class for social media posts is DA ((c)). The posts after the disaster occur in areas significantly impacted by the storm.
4.3. Feature combination performance
To determine which feature or features best describe the disaster in the classification models and examine whether the addition of features improves the accuracy of the classification, different feature combination experiments are performed based on the CNN models. The 10-fold cross-validation results indicate that each experiment, which combined spatial and temporal features with text, improves the overall accuracy compared to the text-only classification by 4 percentage points on average (). The enhanced proximity and time experiment has the highest average accuracy (0.81) and F-score (0.80) of the experiments. Adding meteorological features and adding distance and time, have a similar amount of improvement to the recall and F-score (). The results from these experiments indicate proximity to the disaster is the best feature to describe the disaster event.
Table 9. Feature combination experiment results.
Assessing individual classes reveals a few patterns that exist in the different experiments. First, adding spatial and temporal features had a large impact on the CA (caution and advice) with an increasing of accuracy and decreasing recall, indicating that more messages (both true and false positives) are classified as CA. Second, the precision of IR category stayed relatively consistent for each experiment. However, the recall increased with the addition of distance and time features, and yet dropped after adding the meteorological features. Third, in general, the DA (damage and donation) classes improved dramatically in the recall resulting in much higher F-scores. For disaster relevant information retrieval, identifying a greater number of disaster relevant posts accurately or increasing the recall is important. In particular, including a distance feature all improves recall significantly, which makes sense given the class definitions and sensitivity to space. Finally, the significant decreasing of precision and increasing of recall indicate that adding additional features can largely reduce false positives for the IS class.
5. Conclusion and future work
This paper presents an enhanced text mining method that considers geographic context by incorporating spatial data into the classification of disaster-relevant social media posts. To extract SA information, current approaches focus on matching or text mining keywords to classify disaster relevant posts. Given the high degree of variability in natural language processing, current methods are not without error and have difficulty understanding context. Specifically, the proposed method ingests and processes spatial data that can inform the geographic context of the disaster at a given place in time to enhance the text data by providing additional SA. Then the method combines the spatial data with the text data and classifies the posts based on relevance using a CNN. Data from Hurricane Sandy provided a means for testing the method. The disaster presents several big data challenges in data volume and variety. Collection, processing, and standardization varied for each spatial data set. Using fuzzy logic, spatial features (e.g. distance, wind, flood, and precipitation) were bound to each social media post in the sample data set.
A group of experiments were designed to test the performance of the spatial and temporal features with the text feature. Based on the results, the addition of spatial and temporal features to the text classification did improve the overall classification accuracy compared to current methods. Moreover, the distance from the disaster and the position relative to the post were determined to be the key features in addition to text for describing the disaster event. From the experiments, the impact of spatial features on individual classes was relative to the class definition. The additional features had a significant impact on classes (e.g. casualties and damage or donation and aid) whose class definitions involved spatial and temporal components.
Currently, research of spatial feature creation and definition is non-existent. For this study, when possible, authoritative definitions from government sources defined the feature bins. The development of the model is only as good as the definitions of the features. In fact, a wide range of diversity of spatial data and varying approaches can be leveraged to derive and code spatial and temporal features, represented as coded numeric values in the classification models, and some of the data are highly domain (or disaster type) specific. This paper defined and characterized several key types of spatial features (e.g. rain, wind, and pressure) for the task of social media message classification in hurricanes characterized by heavy rain, high winds, and low atmospheric pressure. Meanwhile, during an earthquake event, seismic activities (e.g. seismic waves, geographic coordinates of its epicenter, depth of the epicenter) in the area are more useful. As such, more investigation into optimal spatial feature creation from multi-sourced spatial data for different types of disaster events is a possible step in future to improving the classification results given the diversity of spatial data and approaches to derive and code features.
This study focuses on the common machine-learning algorithms for classifying text data. However, given the hybrid nature of the data going into the classifier, the assessment of other algorithms is important for finding the preferred framework classifier. One possible solution is to utilize an ensemble method that combines the predictions of several estimators for a given algorithm. Since quick response is important in disaster management, a framework based on unsupervised learning (Zhou et al. Citation2021), and self-learning methods (Peng et al. Citation2020; Peng, Huang, and Rao Citation2021), avoiding manual labeling process would be more ideal for our task. Additionally, as discussed in the literature review, many different classification schema exist for defining disaster events. Additional research is necessary to understand and better define a classification schema that can leverage the spatial features to extract relevant data. In addition to spatial features, visual features extracted from images associated with the social media posts, could also be further integrated to enhance the extraction of disaster relevant messages (Huang et al. Citation2019). Further, our labeled datasets include mostly CA (Caution and Advice) and IR (Infrastructure and Resource) categories, leading to class-imbalance (i.e. some classes have much fewer training samples than the other classes). In fact, class-imbalance has been widely acknowledged as one of the most challenging problems in machine learning and therefore well addressed in the literature (Sahare and Gupta Citation2012). A potential future work could employ different methods (e.g. weighing the classes differently) to improve class imbalance.
Finally, social media is not going away anytime soon. For disaster applications related to social media data, this study indicates the need for incorporating spatial data sources to improve information retrieval and provide greater SA. Existing studies indicated a high performance for a classification model based on traditional machine learning algorithms (e.g. Naïve Bayes) even when applied to data from a different geographic region with significant differences in social media user and usage characteristics (Zahra, Ostermann, and Purves Citation2017). Further, deep learning-based models pre-training using Twitter data from past events have been demonstrated with higher performance while classifying tweet topic for an upcoming event to establish SA compared with these traditional classification models (Yu et al. Citation2019). In other words, once we build a model with datasets from historical events, it can be applied to classify disaster relevant social media messages generated from a later event. Since spatial datasets for extracting spatial features are generated from real-time forecasting models (e.g. NAM) and physical sensing networks (e.g. weather station observations, remote sensing), this framework is applicable to support both real-time decision making and post disaster analysis as long as a workflow of automatic retrieval of relevant datasets is created. Finally, applications of big geosocial media data are increasing common throughout a range of activities beyond just disaster response, from urban planning to market research to political activism (Shelton et al. Citation2014).
Disclosure statement
No potential conflict of interest was reported by the author(s).
Data availability statement
The datasets used and/or analyzed during the current study will be available from online repositories and the corresponding author on request.
Additional information
Funding
References
- Acar, Adam, and Yuya Muraki. 2011. “Twitter for Crisis Communication: Lessons Learned from Japan's Tsunami Disaster.” International Journal of Web Based Communities 7 (3): 392–402.
- Alberts, Timothy A., Phillip B. Chilson, B. L. Cheong, and R. D. Palmer. 2011. “Evaluation of Weather Radar with Pulse Compression: Performance of a Fuzzy Logic Tornado Detection Algorithm.” Journal of Atmospheric and Oceanic Technology 28 (3): 390–400.
- Ansari, Steve, S. Del Greco, and B. Hankins. 2010. “The Weather and Climate Toolkit.” Paper Presented at the AGU Fall Meeting Abstracts, San Francisco, CA, December 13–17.
- Ashktorab, Zahra, Christopher Brown, Manojit Nandi, and Aron Culotta. 2014. “Tweedr: Mining Twitter to Inform Disaster Response.” Paper Presented at the 11th International Conference on Information Systems for Crisis Response and Management (ISCRAM 2014), University Park, PA.
- Bakillah, Mohamed, Ren-Yu Li, and Steve H. L. Liang. 2015. “Geo-Located Community Detection in Twitter with Enhanced Fast-Greedy Optimization of Modularity: The Case Study of Typhoon Haiyan.” International Journal of Geographical Information Science 29 (2): 258–279.
- Banker, Kyle. 2011. MongoDB in Action. Shelter Island, NY: Manning Publications.
- Beaufort Wind Scale. 2021. “Beaufort Wind Scale.” https://www.weather.gov/tbw/beaufort.
- Blake, E. S., T. B. Kimberlain, R. J. Berg, J. P. Cangialosi, and J. L. Beven II. 2013. “Tropical Cyclone Report: Hurricane Sandy.” National Hurricane Center 12: 1–10.
- Bruns, Axel, and Yuxian Eugene Liang. 2012. “Tools and Methods for Capturing Twitter Data During Natural Disasters.” First Monday 17 (4). doi:10.5210/fm.v17i4.3937.
- Crooks, Andrew, Arie Croitoru, Anthony Stefanidis, and Jacek Radzikowski. 2013. “# Earthquake: Twitter as a Distributed Sensor System.” Transactions in GIS 17 (1): 124–147.
- de Albuquerque, João Porto, Benjamin Herfort, Alexander Brenning, and Alexander Zipf. 2015. “A Geographic Approach for Combining Social Media and Authoritative Data Towards Identifying Useful Information for Disaster Management.” International Journal of Geographical Information Science 29 (4): 667–689.
- De Longueville, Bertrand, Robin S. Smith, and Gianluca Luraschi. 2009. “Omg, from Here, I Can See the Flames! A Use Case of Mining Location Based Social Networks to Acquire Spatio-Temporal Data on Forest Fires.” Paper Presented at the Proceedings of the 2009 International Workshop on Location Based Social Networks, Seattle, WA, November 3.
- Ester, Martin, Hans-Peter Kriegel, Jörg Sander, and Xiaowei Xu. 1996. “A Density-Based Algorithm for Discovering Clusters in Large Spatial Databases with Noise.” Paper Presented at the Second International Conference on Knowledge Discovery and Data Mining (KDD), Portland, OR, August 2–4.
- Ford, R. 2011. “Earthquake: Twitter Users Learned of Tremors Seconds Before Feeling Them.” The Hollywood Reporter, August 23.
- Fuchs, Georg, Natalia Andrienko, Gennady Andrienko, Sebastian Bothe, and Hendrik Stange. 2013. “Tracing the German Centennial Flood in the Stream of Tweets: First Lessons Learned.” Paper Presented at the Proceedings of the Second ACM SIGSPATIAL International Workshop on Crowdsourced and Volunteered Geographic Information, Orlando, FL, November 5.
- Gao, Huiji, Geoffrey Barbier, and Rebecca Goolsby. 2011. “Harnessing the Crowdsourcing Power of Social Media for Disaster Relief.” IEEE Intelligent Systems 3: 10–14.
- GDAL. 2021. “GDAL Documentation.” https://gdal.org/.
- Goodchild, Michael F., and J. Alan Glennon. 2010. “Crowdsourcing Geographic Information for Disaster Response: A Research Frontier.” International Journal of Digital Earth 3 (3): 231–241.
- Goodchild, Michael F., and Linna Li. 2012. “Assuring the Quality of Volunteered Geographic Information.” Spatial Statistics 1: 110–120.
- Halteren, Hans van, Jakub Zavrel, and Walter Daelemans. 2001. “Improving Accuracy in Word Class Tagging Through the Combination of Machine Learning Systems.” Computational Linguistics 27 (2): 199–229.
- Houston, J. Brian, Joshua Hawthorne, Mildred F. Perreault, Eun Hae Park, Marlo Goldstein Hode, Michael R. Halliwell, Sarah E. Turner McGowen, Rachel Davis, Shivani Vaid, and Jonathan A. McElderry. 2015. “Social Media and Disasters: A Functional Framework for Social Media Use in Disaster Planning, Response, and Research.” Disasters 39 (1): 1–22.
- Huang, Qunying, Guido Cervone, Duangyang Jing, and Chaoyi Chang. 2015. “DisasterMapper: A CyberGIS Framework for Disaster Management Using Social Media Data.” Paper Presented at the Proceedings of the 4th International ACM SIGSPATIAL Workshop on Analytics for Big Geospatial Data, Bellevue, WA, November 3–6.
- Huang, Xiao, Cuizhen Wang, and Zhenlong Li. 2018a. “A Near Real-Time Flood-Mapping Approach by Integrating Social Media and Post-Event Satellite Imagery.” Annals of GIS 24 (2): 113–123.
- Huang, Xiao, Cuizhen Wang, and Zhenlong Li. 2018b. “Reconstructing Flood Inundation Probability by Enhancing Near Real-Time Imagery with Real-Time Gauges and Tweets.” IEEE Transactions on Geoscience and Remote Sensing 56 (8): 4691–4701.
- Huang, Xiao, Cuizhen Wang, Zhenlong Li, and Huan Ning. 2019. “A Visual–Textual Fused Approach to Automated Tagging of Flood-Related Tweets During a Flood Event.” International Journal of Digital Earth 12 (11): 1248–1264.
- Huang, Qunying, and Yu Xiao. 2015. “Geographic Situational Awareness: Mining Tweets for Disaster Preparedness, Emergency Response, Impact, and Recovery.” International Journal of Geo-Information 4 (3): 19. doi:https://doi.org/10.3390/ijgi4031549.
- Huang, Qunying, and Chen Xu. 2014. “A Data-Driven Framework for Archiving and Exploring Social Media Data.” Annals of GIS 20 (4): 265–277.
- Imran, Muhammad, Shady Elbassuoni, Carlos Castillo, Fernando Diaz, and Patrick Meier. 2013. “Practical Extraction of Disaster-Relevant Information from Social Media.” Paper Presented at the Proceedings of the 22nd International Conference on World Wide Web Companion, Rio de Janeiro, May 13–17.
- Jain, Saloni. 2015. “Real-Time Social Network Data Mining for Predicting the Path for a Disaster.” Georgia State University.
- Joachims, Thorsten. 1998. “Text Categorization with Support Vector Machines: Learning with Many Relevant Features.” In Machine Learning: ECML-98, 137–142, Berlin.
- Keim, Mark E, and Eric Noji. 2011. “Emergent Use of Social Media: A New Age of Opportunity for Disaster Resilience.” American Journal of Disaster Medicine 6 (1): 47–54.
- Kohavi, Ron, and Dan Sommerfield. 1995. “Feature Subset Selection Using the Wrapper Method: Overfitting and Dynamic Search Space Topology.” Paper Presented at the Proceedings of the First International Conference on Knowledge Discovery and Data Mining (KDD-95), Montreal, Canada, August 20–21.
- Lakshmanan, Valliappa, and Travis Smith. 2009. “Data Mining Storm Attributes from Spatial Grids.” Journal of Atmospheric and Oceanic Technology 26 (11): 2353–2365.
- Landwehr, Peter M., and Kathleen M. Carley. 2014. “Social Media in Disaster Relief.” In Data Mining and Knowledge Discovery for Big Data, edited by Wesley W. Chu, 225–257. Berlin: Springer.
- Li, Zhenlong, Cuizhen Wang, Christopher T. Emrich, and Diansheng Guo. 2018. “A Novel Approach to Leveraging Social Media for Rapid Flood Mapping: A Case Study of the 2015 South Carolina Floods.” Cartography and Geographic Information Science 45 (2): 97–110.
- Lindsay, Bruce R. 2011. “Social Media and Disasters: Current Uses, Future Options, and Policy Considerations.” In Congressional Research Service, Report for Congress, 1–13. Washington, DC.
- Mikolov, Tomas, Ilya Sutskever, Kai Chen, Greg S. Corrado, and Jeff Dean. 2013. “Distributed Representations of Words and Phrases and Their Compositionality.” Paper Presented at the Advances in Neural Information Processing Systems, Lake Tahoe, Nevada, USA.
- Morstatter, Fred, Jürgen Pfeffer, Huan Liu, and Kathleen M. Carley. 2013. “Is the Sample Good Enough? Comparing Data from Twitter's Streaming API with Twitter's Firehose.” Paper Presented at the 7th International AAAI Conference on Weblogs and Social Media, Cambridge, Massachusetts, USA, June 28.
- NHC. 2017. “National Hurricane Center.” http://www.nhc.noaa.gov/.
- NWS. 2021. “Definitions of Weather Watch, Warnings and Advisories.” https://www.weather.gov/lwx/WarningsDefined.
- NWS Radar Scale. 2021. “The Front.” https://www.weather.gov/media/publications/front/06nov_Front.pdf.
- Peng, Bo, Qunying Huang, and Jinmeng Rao. 2021. “Spatiotemporal Contrastive Representation Learning for Building Damage Classification.” Paper Presented at the 2021 IEEE International Geoscience and Remote Sensing Symposium (IGARSS), Brussels, July 11–16.
- Peng, Bo, Qunying Huang, Jamp Vongkusolkit, Song Gao, Daniel B. Wright, Zheng N. Fang, and Yi Qiang. 2020. “Urban Flood Mapping With Bitemporal Multispectral Imagery Via a Self-Supervised Learning Framework.” IEEE Journal of Selected Topics in Applied Earth Observations and Remote Sensing 14: 2001–2016.
- Pollard, Tom. 2021. “METAR.” https://pypi.python.org/pypi/metar.
- Rosser, Julian F., D. G. Leibovici, and M. J. Jackson. 2017. “Rapid Flood Inundation Mapping Using Social Media, Remote Sensing and Topographic Data.” Natural Hazards 87 (1): 103–120.
- Roy, Chandan, and Rita Kovordányi. 2012. “Tropical Cyclone Track Forecasting Techniques – a Review.” Atmospheric Research 104: 40–69.
- Sahare, Mahendra, and Hitesh Gupta. 2012. “A Review of Multi-Class Classification for Imbalanced Data.” International Journal of Advanced Computer Research 2 (3): 160.
- Schnebele, Emily, and Guido Cervone. 2013. “Improving Remote Sensing Flood Assessment Using Volunteered Geographical Data.” Natural Hazards and Earth System Sciences 13 (3): 669–677.
- Shelton, Taylor, Ate Poorthuis, Mark Graham, and Matthew Zook. 2014. “Mapping the Data Shadows of Hurricane Sandy: Uncovering the Sociospatial Dimensions of ‘Big Data’.” Geoforum 52: 167–179.
- Spinsanti, Laura, and Frank Ostermann. 2013. “Automated Geographic Context Analysis for Volunteered Information.” Applied Geography 43: 36–44.
- Sutton, Jeannette, Leysia Palen, and Irina Shklovski. 2008. “Backchannels on the Front Lines: Emergent Uses of Social Media in the 2007 Southern California Wildfires.” Paper Presented at the Proceedings of the 5th International ISCRAM Conference, Washington, DC, USA.
- Takahashi, Bruno, Edson C. Tandoc, Jr., and Christine Carmichael. 2015. “Communicating on Twitter During a Disaster: An Analysis of Tweets During Typhoon Haiyan in the Philippines.” Computers in Human Behavior 50: 392–398.
- Tobler, Waldo R. 1970. “A Computer Movie Simulating Urban Growth in the Detroit Region.” Economic Geography 46 (Sup1): 234–240.
- Vieweg, Sarah, Amanda L. Hughes, Kate Starbird, and Leysia Palen. 2010. “Microblogging During Two Natural Hazards Events: What Twitter May Contribute to Situational Awareness.” Paper Presented at the Proceedings of the SIGCHI Conference on Human Factors in Computing Systems, Montréal Québec, April 22–27, 2006.
- Wang, Jimin, Yingjie Hu, and Kenneth Joseph. 2020. “NeuroTPR: A Neuro-Net Toponym Recognition Model for Extracting Locations from Social Media Messages.” Transactions in GIS 24 (3): 719–735.
- Wang, Han, Erik Skau, Hamid Krim, and Guido Cervone. 2018. “Fusing Heterogeneous Data: A Case for Remote Sensing and Social Media.” IEEE Transactions on Geoscience and Remote Sensing 56 (12): 6956–6968.
- Xiao, Yu, Qunying Huang, and Kai Wu. 2015. “Understanding Social Media Data for Disaster Management.” Natural Hazards 79 (3): 1663–1679. doi:https://doi.org/10.1007/s11069-015-1918-0.
- Yang, Jingchao, Manzhu Yu, Han Qin, Mingyue Lu, and Chaowei Yang. 2019. “A Twitter Data Credibility Framework – Hurricane Harvey as a Use Case.” ISPRS International Journal of Geo-Information 8 (3): 111.
- Yu, Manzhu, Qunying Huang, Han Qin, Chris Scheele, and Chaowei Yang. 2019. “Deep Learning for Real-Time Social Media Text Classification for Situation Awareness–Using Hurricanes Sandy, Harvey, and Irma as Case Studies.” International Journal of Digital Earth 12 (11): 1230–1247.
- Zahra, Kiran, Muhammad Imran, and Frank O. Ostermann. 2020. “Automatic Identification of Eyewitness Messages on Twitter During Disasters.” Information Processing & Management 57 (1): 102107.
- Zahra, Kiran, Frank O. Ostermann, and Ross S. Purves. 2017. “Geographic Variability of Twitter Usage Characteristics During Disaster Events.” Geo-Spatial Information Science 20 (3): 231–240.
- Zhou, Sulong, Pengyu Kan, Qunying Huang, and Janet Silbernagel. 2021. “A Guided Latent Dirichlet Allocation Approach to Investigate Real-Time Latent Topics of Twitter Data During Hurricane Laura.” Journal of Information Science. doi:https://doi.org/10.1177/01655515211007724.
- Zou, Lei, Nina S. N. Lam, Heng Cai, and Yi Qiang. 2018. “Mining Twitter Data for Improved Understanding of Disaster Resilience.” Annals of the American Association of Geographers 108 (5): 1422–1441.