
The Earth system is an integrated system that can be divided into six main subsystems: geosphere, atmosphere, hydrosphere, cryosphere, biosphere, and anthrosphere. These subsystems are interconnected through the flows of global energy, water, and carbon, which are fundamental constituent cycles within the Earth system. To improve our predictive understanding of the subsystem on our changing planet, there is a need to better represent these subsystems through modelling and observations. The central role of these fundamental cycles has prompted scientific institutions or meteorological centers to develop digital platforms dedicated to the integration, modelling, and assimilation of Earth observation data, e.g., Big Earth Data Science Engineering (Guo, Li, and Qiu Citation2020).
Remote sensing through various sensors, such as microwave, optical, and thermal instruments onboard different platforms, is the most appropriate means to achieve global and homogeneous observation of the Earth system surface (hydrosphere, cryosphere, and biosphere) and atmosphere. Remote sensing observations with a physical connection to the evolution of atmosphere, land and ocean variables will promote the incorporation of remote sensing into Earth system research. The first few decades of remote sensing research were limited by the resolutions (spatial, temporal, radiometric and spectral) of sensors and processing power; however, rapid advances in remote sensing (increase in new and improved sensors) and computational capacities are bringing us toward a digital Earth system with unprecedented sensor capacities (number and quality). According to the Union of Concerned Scientists (UCS), as of 2010, there were more than 100 Earth-observation satellites, and by 2020, more than 900 satellites were in orbit measuring Earth’s electromagnetic spectrum from visible to infrared and microwave regions. This allows for an improved understanding of the evolution of many essential variables (Bretherton Citation1985), such as radiation, precipitation, evapotranspiration, soil moisture, ground water, biomass, permafrost, snow, and sea ice, as well as a better ability to predict the behaviour of unique domains, such as Earth’s “three poles”, i.e., the Tibetan Plateau and polar regions, in the context of global changes (Guo et al. Citation2020; Li et al. Citation2020).
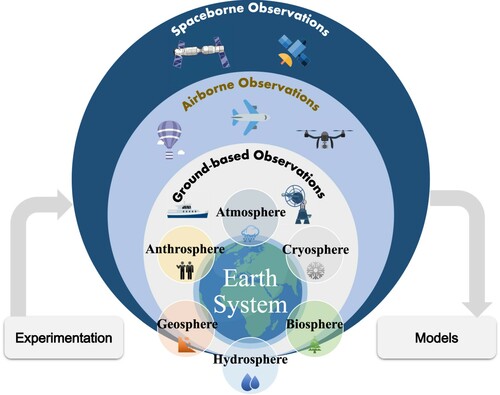
Large-scale experimentation (e.g., ground-based instruments, in situ networks, and airborne and spaceborne observations) plays a significant role in the calibration and validation of remote sensing models and algorithms; promotes the advancement of soil science, hydrology, ecology, oceanography, and other related disciplines; and provides an array of tools for addressing a broad variety of Earth science questions (). Remote sensing experiments have been conducted for many years and have produced invaluable outcomes for the development of new Earth observation missions and new products, such as the Soil Moisture Active and Passive Validation Experiment (SMAPVEX) conducted in North America in 2008, 2012, 2015, 2016, and 2019–2022 separately for supporting the validation and application of the mission products (Colliander et al. Citation2017) and an in situ strategy toward a national coordinated soil moisture monitoring network in the United States (Cosh et al. Citation2021). Coincidentally, a comprehensive remote sensing experiment involving carbon, water and energy cycle studies was conducted in China, including a special soil moisture experiment in the Luan River in 2018 (SMELR18; Zhao et al. Citation2020). For the cryosphere, the snow experiment (SnowEx) campaigns were conducted to explore new approaches for mapping snow characteristics (Brucker et al. Citation2017). Large-scale expeditions, such as the Chinese National Arctic/Antarctic Research Expedition (CHINARE) and the Second Tibetan Plateau Scientific Expedition and Research (STEP), can provide comprehensive in situ tests for remote sensing. The availability of these experimental datasets allows researchers to develop physical models to replicate and understand remote sensing observations, to develop innovative retrieval algorithms for remote sensing products and to enhance their applications in Earth system science.
Figure 1. Conceptual diagram of remote sensing experimentation and Earth system science. Remote sensing experimental research includes spaceborne observations from satellites and space stations; airborne observations from balloons, aircraft, and drones; and ground-based observations from shipborne and land-based instruments.
In this special issue for the International Journal of Digital Earth, we invited contributions from recent studies related to large-scale field experiments as they pertain to a better understanding of our Earth systems. Selected papers focusing on the Earth system surface, including the hydrosphere, cryosphere, and biosphere, were published.
1. The hydrosphere
Surface hydrologic processes contain exchanges of water between the surface and lower atmosphere and infiltration into the soil; thus, soil moisture content is vital because it affects the infiltration and evapotranspiration capacity. Soil moisture monitoring networks are crucial for providing reliable soil moisture information at a large scale. Coopersmith et al. (Citation2021) examined the long-term temporal stability of seven in situ soil moisture networks throughout the continental United States. They concluded that approximately 12 soil moisture sensors are sufficient for a specific network, presuming their locations are distributed to capture the hydrologic heterogeneity of the watershed. After gleaning stable relationships between locations, it is possible to scale a singular permanent station to estimate the average soil moisture within the watershed. Huerta-Batiz et al. (Citation2021) described the Terrestrial Hydrology Experiment 2018 in Mexico (THEXMEX18), which was conducted on a sparse soil-moisture network over an agricultural area, and they exploited this dataset in an assimilation framework to analyze the soil moisture profile in the root zone. They found that root-zone soil moisture (RZSM) can be improved by assimilating soil moisture (SM) information in the top layer of the soil. Although the improvement in RZSM was reduced when assimilating near-surface SM compared with the assimilation of SM at different depths, these results demonstrated that it is possible to exploit unbiased SM retrievals from passive microwave satellite sensors and to infer RZSM conditions in agricultural areas with limited information on SM conditions. With 33 in situ soil moisture measurements for the 1982–2018 period on the Mongolian Plateau, Luo et al. (Citation2020) evaluated four remotely sensed and reanalysis soil moisture products derived from the European Space Agency’s Climate Change Initiative (ESA-CCI), European Centre for Medium-Range Weather Forecasts Interim Re-Analysis (ERA-Interim), Famine Early Warning Systems Network Land Data Assimilation System (FLDAS), and Global Land Data Assimilation System (GLDAS). All four products underestimated the soil moisture in this region at different levels, and ERA-Interim performed best with the highest correlation and lowest uncertainties. Reanalysis data exhibited a decreasing trend mainly due to precipitation changes in the warm season (from April to October) over the past 37 years. However, the current satellite remote sensing of soil moisture is at a very coarse spatial resolution of tens of kilometers and requires downscaling for broader applications. Guo et al. (Citation2021) compared two active-passive brightness temperature downscaling algorithms and found that the linear relationship between brightness temperature and backscatter is still theoretically robust under the case of the Terrestrial Water Resources Satellite with variant incidence angles. The results from the SMELR18 airborne data revealed that the spectral analysis method based on spatial information performs better than the time-series regression method, which relies on multiple repeated observations for a reliable linear relationship.
Long-term droughts significantly impact surface and ground water resources. Mondal and Lakshmi (Citation2021) used the standardized precipitation index (SPI) and standardized precipitation evapotranspiration index (SPEI) to identify long-term droughts in India for the 1951–2015 period. The areal extent of droughts was observed in the two methods, and there was a positive correlation with the terrestrial water storage estimated from the Gravity Recovery and Climate Experiment (GRACE) in most river basins, indicating that major droughts significantly impacted water storage in India.
2. The cryosphere
Snow and ice (marine and continental) are important energy reservoirs following a variation in albedo, thus impacting the quality of weather and climate forecasts. Microwave remote sensing is commonly used for the estimation of snow parameters (snow water equivalent and snow depth) due to the strong volume scattering inside the snowpack. The microstructure of snow strongly affects microwave radiation. Pan et al. (Citation2021) confirmed the repeatability of stereological measurements of snow specific surface area by comparing the estimates from two research groups based on seven samples from two deep snow pits, which was conducted at Steamboat Springs in the Colorado Mountains, United States. The results showed that the stereological specific surface areas measured by the two groups were highly consistent and could be utilized to drive the Microwave Emission Model of Layered Snowpacks (MEMLS) with smaller errors compared with near infrared camera and hand-lens measurements. In addition to snow microstructure, forest cover is another crucial factor influencing the retrieval of snow parameters. Li et al. (Citation2021) examined the influence of tree transmissivity variations in winter utilizing a ground-based radiometry experiment in the boreal forest belt located in Finland. The permittivity variation of trees under cold temperature led to a decrease in tree transmissivity. This phenomenon could be corrected by an approximated temperature-transmissivity relationship to reduce the uncertainties of snow retrieval algorithms for both ground-based and spaceborne observations. Wang et al. (Citation2021) investigated the microwave transmissivity for diverse forest types with ground-based radiometry experiments in Northeast China. They demonstrated that transmissivity at a certain frequency/polarization differed from diverse forest types within the same woody stem volume range. Based on the experimental data, new empirical parameters were generated to describe tree transmissivity as an exponential function of woody stem volume, depending on both frequency and polarization. Underlying soil permittivity and roughness are other unknowns to be considered for microwave remote sensing of snow. Meloche et al. (Citation2021) applied the structure-from-motion (SfM) technique to measure soil roughness at multiple sites across four Arctic tundra ecotypes. From the comparison of three different rough surface reflectivity models, including the Wegmüller and Mätzler model (Weg99), Wang and Choudhury model (QNH), and a geometric optics model, they found that the best performance could be achieved with the Weg99 model parameterized with SfM-based roughness and frozen soil permittivity from the theoretical model of Zhang et al. (Citation2010).
In addition to land, snow is also widely present on sea ice. Ji et al. (Citation2021) analyzed snow features on Arctic sea ice based on in situ observations during the Seventh CHINARE in summer 2016. Their results indicated that snow depth varied between 19 mm and 241 mm, with the depth hoar layer widely developed in the snow on Arctic sea ice. The equivalent snow grain size was small on the surface and large at the bottom along with the snow stratigraphic profiles and could be retrieved at a large scale from MODIS data with an average relative error of 14.6%.
3. The biosphere
The biosphere includes the biogeophysical processes of land surfaces and, in particular, the vegetation of the various ecosystems. Optical remote sensing allows efficient monitoring of forest ecosystems at regional and global scales. Many remote sensing-derived forest thematic products can be estimated from canopy reflectance (CR), 3D cloud points or other types of data. Complex situations of vegetation type, illumination condition, topography, etc. hamper the progress in optical remote sensing. Most of the widely used optical forward models and backward estimation methods are only suitable for forest canopies in flat areas. A satellite-airborne-ground synchronous, fine-scale, optical remote sensing experiment of mixed stands over complex terrain (FOREST) was conducted in Northeast China in 2016 (Cao et al. Citation2021). The object of this experiment was to evaluate recent progress over complex terrain, including large scene reconstruction, radiative transfer modelling and forest parameter retrieval. Taking the reconstructed 3D scenes and ground-measured spectral parameters as inputs, good consistency was found between the airborne-measured reflectance and the reflectance simulated using the LargE-Scale remote sensing data and image simulation framework over the heterogeneous 3D scene (LESS) model. Geng et al. (Citation2021) evaluated a specifically designed CR model over four forest plots using RAMI and UAV measurements for pure forest plantations, which are an ideal type of forest for validating CR models because of their simple background and the low variance in crown structures. The geometric optical model for forest plantations (GOFP) had better consistency with the measurements than the CR models for natural forests because the tree distribution in forest plantations was described more reasonably in the GOFP model. Light detection and ranging (LiDAR), as an active remote sensing technology, can obtain high-precision forest spatial structural information and information under canopy topography and has unparalleled advantages in forest management and ecosystem research. Pang et al. (Citation2021) proposed a Nyström-based spectral clustering algorithm using airborne LiDAR point cloud data to improve the efficiency of individual tree segmentation. Cai et al. (Citation2021) improved the estimation of canopy cover from unmanned aerial vehicle-light detecting and ranging (UAV-LiDAR) data using a pit-free canopy height model (CHM)-based method. UAV-LiDAR has become a promising tool for forest investigations due to its high mobility, low cost, and high point density. Compared with traditional passive optical remote sensing, the large amount of data provided by LiDAR systems offers new opportunities to develop novel methods for vegetation parameter estimation.
Acknowledgments
This special issue was supported by the Second Tibetan Plateau Scientific Expedition and Research Programme (STEP) (No. 2019QZKK0206), the National Natural Science Foundation of China (NSFC) (No. 42090014) and the U.S. Department of Agriculture, Agricultural Research Service. USDA is an equal opportunity provider and employer.
References
- Bretherton, F. P. 1985. “Earth System Science and Remote Sensing.” Proceedings of the IEEE 73 (6): 1118–1127. doi:https://doi.org/10.1109/PROC.1985.13242.
- Brucker, L., C. Hiemstra, H. P. Marshall, K. Elder, R. De Roo, M. Mousavi, F. Bliven, et al. 2017. “A First Overview of SnowEx Ground-Based Remote Sensing Activities during the Winter 2016–2017.” 2017 IEEE International Geoscience and Remote Sensing Symposium (IGARSS), 1391–1394. doi:https://doi.org/10.1109/IGARSS.2017.8127223.
- Cai, Shangshu, Wuming Zhang, Shuangna Jin, Jie Shao, Linyuan Li, Sisi Yu, and Guangjian Yan. 2021. “Improving the Estimation of Canopy Cover from UAV-LiDAR Data Using a Pit-Free CHM-Based Method.” International Journal of Digital Earth 14 (10): 1477–1492. doi:https://doi.org/10.1080/17538947.2021.1921862.
- Cao, Biao, Jianbo Qi, Erxue Chen, Qing Xiao, Qinhuo Liu, and Zengyuan Li. 2021. “Fine scale optical remote sensing experiment of mixed stand over complex terrain (FOREST) in the Genhe Reserve Area: objective, observation and a case study.” International Journal of Digital Earth 14 (10): 1411–1432. doi:https://doi.org/10.1080/17538947.2021.1968047.
- Colliander, Andreas, Michael H. Cosh, Sidharth Misra, Thomas J. Jackson, Wade T. Crow, Steven Chan, Rajat Bindlish, Chunsik Chae, Chandra Holifield Collins, and Simon H. Yueh. 2017. “Validation and Scaling of Soil Moisture in a Semi-Arid Environment: SMAP Validation Experiment 2015 (SMAPVEX15).” Remote Sensing of Environment 196: 101–112. doi:https://doi.org/10.1016/j.rse.2017.04.022.
- Coopersmith, Evan J., Michael H. Cosh, Patrick J. Starks, David D. Bosch, Chandra Holifield Collins, Mark Seyfried, Stan Livingston, and John Prueger. 2021. “Understanding Temporal Stability: A Long-Term Analysis of USDA ARS Watersheds.” International Journal of Digital Earth 14 (10): 1243–1254. doi:https://doi.org/10.1080/17538947.2021.1943550.
- Cosh, M. H., T. G. Caldwell, C. B. Baker, J. D. Bolten, N. Edwards, P. Goble, H. Hofman, et al. 2021. “Developing a Strategy for the National Coordinated Soil Moisture Monitoring Network.” Vadose Zone Journal e20139: 1–13. doi:https://doi.org/10.1002/vzj2.20139.
- Geng, J., Q. Zhang, F. Qiu, J. M. Chen, Y. Zhang, W. Fan, L. Tu, et al. 2021. “Evaluation of GOFP over Four Forest Plots Using RAMI and UAV Measurements.” International Journal of Digital Earth 14 (10): 1433–1451. doi:https://doi.org/10.1080/17538947.2021.1936226.
- Guo, Huadong, Xinwu Li, and Yubao Qiu. 2020a. “Comparison of Global Change at the Earth’ s Three Poles Using Spaceborne Earth Observation.” Science Bulletin 65 (16): 1320–1323. doi:https://doi.org/10.1016/j.scib.2020.04.031.
- Guo, H., S. Nativi, D. Liang, M. Craglia, L. Wang, S. Schade, C. Corban, et al. 2020b. “Big Earth Data Science: An Information Framework for a Sustainable Planet.” International Journal of Digital Earth 13 (7): 743–767. doi:https://doi.org/10.1080/17538947.2020.1743785.
- Guo, Peng, Tianjie Zhao, Jiancheng Shi, Hongxin Xu, Xiuwei Li, and Shengda Niu. 2021. “Assessing the Active-Passive Approach at Variant Incidence Angles for Microwave Brightness Temperature Downscaling.” International Journal of Digital Earth 14 (10): 1273–1293. doi:https://doi.org/10.1080/17538947.2021.1907461.
- Huerta-Batiz, Hector Ernesto, Daniel Enrique Constantino-Recillas, Alejandro Monsivais-Huertero, Juan Carlos Hernandez-Sanchez, Jasmeet Judge, and Ramonn Sidonio Aparicio-Garcia. 2021. “Understanding root-zone soil moisture in agricultural regions of Central Mexico using the Ensemble Kalman Filter, satellite-derived information, and the THEXMEX dataset.” International Journal of Digital Earth (Submitted).
- Ji, Qing, Xiaoping Pang, Xi Zhao, and Ruibo Lei. 2021. “Snow features on sea ice in the western Arctic Ocean during summer 2016.” International Journal of Digital Earth 14 (10): 1397–1410. doi:https://doi.org/10.1080/17538947.2021.1966524.
- Li, Xin, Tao Che, Xinwu Li, Lei Wang, Anmin Duan, Donghui Shangguan, Xiaoduo Pan, Miao Fang, and Qing Bao. 2020. “CASEarth Poles.” Bulletin of the American Meteorological Society 101 (9): E1475–E1491. doi:https://doi.org/10.1175/BAMS-D-19-0280.1.
- Li, Qinghuan, Richard Kelly, Juha Lemmetyinen, Roger D De Roo, Pan Jinmei, and Yubao Qiu. 2021. “The Influence of Tree Transmissivity Variations in Winter on Satellite Snow Parameter Observations.” International Journal of Digital Earth 14 (10): 1337–1353. doi:https://doi.org/10.1080/17538947.2021.1950852.
- Luo, Min, Chula Sa, Fanhao Meng, Yongchao Duan, Tie Liu, and Yuhai Bao. 2020. “Assessing Remotely Sensed and Reanalysis Products in Characterizing Surface Soil Moisture in the Mongolian Plateau.” International Journal of Digital Earth 14 (10): 1255–1272. doi:https://doi.org/10.1080/17538947.2020.1820590.
- Meloche, J., A. Royer, A. Langlois, N. Rutter, and V. Sasseville. 2020. “Improvement of Microwave Emissivity Parameterization of Frozen Arctic Soils Using Roughness Measurements Derived from Photogrammetry.” International Journal of Digital Earth 14 (10): 1380–1396. doi:https://doi.org/10.1080/17538947.2020.1836049.
- Mondal, Arun, and Venkataraman Lakshmi. 2021. “Estimation of Total Water Storage Changes in India.” International Journal of Digital Earth 14 (10): 1294–1315. doi:https://doi.org/10.1080/17538947.2021.1914759.
- Pan, Jinmei, M. T. Durand, Z. Courville, B. J. Vander Jagt, N. P. Molotch, S. A. Margulis, E. J. Kim, M. Schneebeli, and C. Mätzler. 2021. “Evaluation of Stereology for Snow Microstructure Measurement and Microwave Emission Modeling: A Case Study.” International Journal of Digital Earth 14 (10): 1316–1336. doi:https://doi.org/10.1080/17538947.2021.1902006.
- Pang, Yong, Weiwei Wang, Liming Du, Zhongjun Zhang, Xiaojun Liang, Yongning Li, and Zuyuan Wang. 2021. “Nyström-Based Spectral Clustering Using Airborne LiDAR Point Cloud Data for Individual Tree Segmentation.” International Journal of Digital Earth 14 (10): 1452–1476. doi:https://doi.org/10.1080/17538947.2021.1943018.
- Wang, Guangrui, Xiaofeng Li, Xiuxue Chen, Tao Jiang, Xingming Zheng, Yanlin Wei, Xiangkun Wan, and Jian Wang. 2021. “An investigation on microwave transmissivity at frequencies of 18.7 and 36.5 GHz for diverse forest types during snow season.” International Journal of Digital Earth 14 (10): 1354–1379. doi:https://doi.org/10.1080/17538947.2021.1955985.
- Zhang, Lixin, Tianjie Zhao, Lingmei Jiang, and Shaojie Zhao. 2010. “Estimate of Phase Transition Water Content in Freeze-Thaw Process Using Microwave Radiometer.” IEEE Transactions on Geoscience and Remote Sensing 48 (12): 4248–4255. doi:https://doi.org/10.1109/TGRS.2010.2051158.
- Zhao, T., J. Shi, L. Lv, H. Xu, D. Chen, Q. Cui, T. J. Jackson, et al. 2020. “Soil Moisture Experiment in the Luan River Supporting New Satellite Mission Opportunities.” Remote Sensing of Environment 240: 111680. doi:https://doi.org/10.1016/j.rse.2020.111680.