
ABSTRACT
This paper investigates user preferences and behaviour associated with 2D and 3D modes of urban representation within a novel Topographic Immersive Virtual Environment (TopoIVE) created from official 1:10,000 mapping. Sixty participants were divided into two groups: the first were given a navigational task within a simulated city and the second were given the freedom to explore it. A Head-Mounted Display (HMD) Virtual Reality (VR) app allowed participants to switch between 2D and 3D representations of buildings with a remote controller and their use of these modes during the experiment was recorded. Participants performed mental rotation tests before entering the TopoIVE and were interviewed afterwards about their experiences using the app. The results indicate that participants preferred the 3D mode of representation overall, although preference for the 2D mode was slightly higher amongst those undertaking the navigational task, and reveal that different wayfinding solutions were adopted by participants according to their gender. Overall, the findings suggest that users exploit different aspects of 2D and 3D modes of visualization in their wayfinding strategy, regardless of their task. The potential to combine the functionality of 2D and 3D modes therefore offers substantial opportunities for the development of immersive virtual reality products derived from topographic datasets.
1. Introduction
Virtual reality (VR) is a display and control technology that provides an interactive, multi-sensory, computer-generated, three-dimensional virtual environment (VE) to a user. Although the first VR systems began to emerge in the 1960s and their cartographic applications were acknowledged by the 1990s (Taylor Citation1991; Moore Citation1999), only recently has VR become an explicit focus of user research in cartography (e.g. Çöltekin, Lokka, and Zahner Citation2016; Roth et al. Citation2017; Lütjens et al. Citation2019; Zagata et al. Citation2021). Although Çöltekin et al. (Citation2020b) note that VR offers a fundamental paradigm shift in allowing users to experience a sense of place comparable or even identical to the real world, possibly alleviating the need for travel, the full potential of VR technology to provide effective cartographic visualizations, including topographic data maintained by national mapping agencies, has yet to be explored.
VR technologies work by directly coupling the viewer’s position with the image shown on their display (Kraak Citation2002), usually via a desktop monitor (low-immersive), simulators, e.g. flight simulators (semi-immersive), or a Head-Mounted Display (HMD) (immersive). HMD-based VR delivers an immersive and immediate sensory experience of simulated environments (which may or may not resemble reality), particularly those that would otherwise be physically inaccessible to the user due to location, scale, time, or danger (McGreevy Citation1993). More recently, the use of HMD VR to simulate a 3D virtual teaching environment and provide an immersive learning experience has enabled learners to comprehensively acquire knowledge through the senses of hearing, sight, and touch (Sun, Wu, and Cai Citation2019). However, while significant progress has been made in the processing of 2D and 3D data on a computer monitor, cartographic research has tended to focus on the use of low-immersive Virtual Environments, such as those displayed on an LCD (Liquid Crystal Display) desktop monitor, or on a projection screen placed in front of the viewer (e.g. Bischof and Boulanger Citation2003; Kober, Kurzmann, and Neuper Citation2012; Lokka and Çöltekin Citation2019; Lokka and Çöltekin Citation2020).
Although an HMD may be regarded as a barrier that removes the user from actual reality, and, as such, is a defining feature of VR (Peddie Citation2017), according to Shu et al. (Citation2018), the use of HMD-based VR can have a higher positive effect on spatial presence and mental immersion when compared to desktop VR. With regard to the latter, the scene or images of a given area are limited by the physical size, shape, and resolution of the display monitor. In contrast, HMD-based VR can provide users with an all-round visual experience, enhancing their visual stimulation and generating a greater sense of being in the scene. It is therefore important that user research in this area utilizes HMD-based VR and encompasses a range of simulated environments.
In addition to immersion, interactivity is an important factor in VR design. Blom and Beckhaus (Citation2014) propose that what makes environments both interesting and engaging is having worlds that are both active and reactive, particularly through dynamic components and interactions. Experiments that measure participants’ engagement with VR have therefore incorporated user interactivity, including responses to stimuli presented via video monitors (e.g. Lokka and Çöltekin Citation2019).
Today, there is an increasing need to develop intuitive and immersive 3D representations of urban areas. This is particularly important for applications that require the simulation and interaction with VR to be as authentic as possible, such as urban planning, emergency response, environmental and microclimate investigations, as well as gaming. Chen and Lin (Citation2018) recognize the need to develop more human-behaviour-integrated models at large, regional, and local scales. This is especially relevant for national mapping agencies, who hold the responsibility for maintaining topographic data, i.e. that symbolize the national landscape, and these organizations are exploring VR increasingly as a relevant method of display (Kent and Hopfstock Citation2018). The advantages of VR offer a substantial opportunity to establish new products and services for the topographic datasets maintained by national mapping agencies.
This research therefore seeks to advance the technologies of 3D and immersive virtual environments by encouraging the effective use of topographic data maintained by national mapping agencies and widening their application for the sustainable management of natural and human resources – particularly in urban areas. It explores user preferences and behaviour within a geographically referenced 3D model that uses official topographic data to represent the real planet. It recommends the development of 3D and immersive virtual environments for applications that rely on the effective representation of accurate geodata from a first-person view.
Specifically, this study combines the representation of topographic data with immersive VR (IVR) technology. It uses a virtual environment that can be explored using an HMD and a remote (hand-held) controller. In seeking to investigate larger-scale urban environments than those used in desktop VR experiments, it introduces a Topographic Immersive Virtual Environment (TopoIVE), which presents the first step in the development of more human-behaviour-integrated models derived from topographic mapping. The use of a TopoIVE allows user preferences for the 2D and 3D visualization of buildings from a pedestrian perspective to be analysed and interpreted. Understanding how users interact with the TopoIVE is therefore useful for developing more effective applications of topographic datasets, and, more broadly, for advancing the implementation of VR in a variety of applications, from urban planning to humanitarian and disaster relief operations.
The experiment investigates how people navigate and explore a TopoIVE in the first-person-view mode using an HMD. It allows participants to switch between 2D and 3D modes of representing buildings using a remote controller and to either walk over (2D) or through (3D) buildings in the virtual urban environment. It examines user preferences for 3D versus 2D mode and to explores whether these preferences differ when participants undertake a navigational task or are allowed free exploration of the TopoIVE. The experiment therefore aims to test the following hypotheses:
Users prefer one mode of representation (either 3D or 2D) in the TopoIVE (first-person-view mode), regardless of whether they are given a navigational task or are allowed to freely explore the simulated urban environment; and
The mode of representation (2D or 3D) in immersive VR triggers different user behaviours, regardless of whether users are given a navigational task or are allowed to freely explore the TopoIVE.
Testing these hypotheses will provide some insights into the preferences and behaviour of users in a simulated urban environment using an HMD and remote controller when completing navigational and non-navigational tasks. In addition, participants’ characteristics, i.e. age, gender, left/right-handedness, visual defects, video role-playing game experience, IVR experience, and spatial ability (via a mental rotation test) are analysed in order to explore their possible association with user preferences and behaviour.
With an increasing number and breadth of applications of VR, this study brings a new approach to refining user-centred design in this area. In particular, the research aims to inform those national mapping agencies who are exploring IVR to develop new products based on their extensive topographic databases.
2. Related studies
2.1. Virtual reality and virtual environments
Although Sutherland (Citation1965) had described ‘The Ultimate Display’ as a room in which a computer would control the existence of matter, the term ‘virtual reality’ was not coined until 1987 by Jaron Lanier, co-founder of the Visual Programming Lab. With the evolution of VR technologies, attempts have been made to define VR and to explore what would constitute the ideal VR system. According to Milgram and Kishino’s (Citation1994) reality-virtuality continuum, VR lies on the opposite side of real-world experience and is fully computer-generated. More recently, Çöltekin et al. (Citation2020a, 258) describe the ideal VR system as providing humans with experiences that stimulate all the senses and that are indistinguishable from those that could be real, echoing Sutherland’s description of 55 years earlier. The Consumer Technology Association (Citation2020) emphasize a combination of immersion and interactivity in their definition of VR, i.e. as a fully immersive user environment affecting or altering the sensory input(s) (e.g. sight, sound, touch, and smell) that can allow interaction with those sensory inputs by the user’s engagement with the virtual world, typically, but not exclusively, via an HMD, the use of spatial or other audio, and/or motion controllers (with or without tactile input or feedback).
It is, however, important to distinguish between ‘virtual reality’ and ‘virtual environment’. The former refers to an experience that feels real to the user and does not necessarily refer to mimicking reality accurately but to creating a high level of presence (Heeter Citation1992; Slater and Wilbur Citation1997). In this case, presence is defined as a state of consciousness; the psychological awareness of being in a computer-generated space. However, because the word reality may invoke the impression of mimicking present real-world situations in digital space, the term virtual environment was introduced because one can also explore fictional (past or planned) environments. Simulated environments typically completely surround the participant through the use of a head-mounted display (HMD), or a virtual display on the walls around the participants in a room-sized cube, the so-called cave automatic virtual environment (CAVE). This dynamic display enables a direct coupling between the participant’s motor actions and the virtual environment (Cruz-Neira et al. Citation1992).
Within the context of geovisualization, there remains a substantial level of terminological ambiguity in current literature (Hruby, Ressl, and de la Borbolla del Valle Citation2019). Concepts such as virtual geography (Batty Citation1997), geospatial virtual environments (GeoVE) (Slocum et al. Citation2001), virtual globes (Jones et al. Citation2014), virtual landscapes (Minton Citation2014), virtual geographic environments (VGE) (Lin and Gong Citation2001; Konecny Citation2011; Zhang and Moore Citation2013; Zhang et al. Citation2016), VRGIS (Boulos et al. Citation2017), immersive virtual environments (IVE) with collaboration of users in VR (Šašinka et al. Citation2019), and geovisualization immersive virtual environments (GeoIVE) (Hruby, Ressl, and de la Borbolla del Valle Citation2019), are offered but lack clear distinction.
According to Hruby, Ressl, and de la Borbolla del Valle (Citation2019), ‘geovisualization immersive virtual environment’ (GeoIVE) is a subcategory of ‘immersive virtual environment’ (IVE), which is itself a subcategory of ‘virtual geographic environment’ (VGE). Unlike other sub-categories of IVE, a GeoIVE visualizes geographic environments at a 1:1 scale in a generalized but realistic manner. It also offers interactive navigation and a stereoscopic view, allowing users to experience a degree of immersion that generates the sensation of personal presence.
In this paper, we introduce the term ‘TopoIVE’, which we consider to be a sub-category of GeoIVE that utilizes topographic data. Since the virtual environment is modelled from these data, the resulting simulation is less realistic in appearance but preserves faithfulness to the real environment in terms of spatial accuracy. Hence, the TopoIVE aims to provide a starting point for combining VR technology with the full range of topographic datasets that are maintained by national mapping agencies. Together with research into their use, the development of TopoIVEs should explore methods of modelling virtual environments for real-world applications, such as emergency services and disaster relief, that would benefit from the accurate relative positioning of geographical features.
2.2. User performance and 2D/3D preferences
In order to design more effective virtual environments, that is, virtual environments that are more successful in stimulating and replicating real-world user behaviour, it is necessary to understand how users perform within immersive simulations. The extent to which users comply with real-world schema when engaging in virtual environments may suggest their immersivity and hence the level of their success. Preferences for 2D or 3D modes of representation may indicate the efficiency of these options when users are engaged in wayfinding and navigation. Wayfinding concerns the cognitive processes involved in orientation and decision-making through an environment, whereas navigation entails a more precise understanding of locations, determining a specific route between them and the method of travel. Montello (Citation2005) emphasizes the association between wayfinding and planning (and distinguishes this from movement), which is reiterated by Takemiya and Ishikawa’s (Citation2011) view that wayfinding is a purposeful activity to move from an origin to a destination, rather than navigating through an environment randomly. Therefore, Hirtle (Citation2011) recognizes that some spatial information may have more relevance than others in wayfinding contexts, allowing people to navigate more effectively.
Studies of user performance for 2D versus 3D representations in non-VR environments have delivered mixed results, with some advantage in using 3D over 2D when users are engaged in tasks based on extracting information from topographic data. Savage, Wiebe, and Devine (Citation2004), for example, found that participants who were given problem-solving and data-extraction tasks requiring elevation information did not tend to perform any better when using 3D models displayed on a monitor in comparison to the 2D equivalent. A study by Fuhrmann, Komogortsev, and Tamir (Citation2009), involving the use of 3D holographic models, however, found that these models enabled more effective route planning than 2D versions. This was corroborated by Wahyudi, Ramdani, and Bachtiar et al. (Citation2020) in their study of students of varying ages learning about landslides in Bumiaji District, Indonesia, with the participants’ assessments of vulnerability found to be more accurate using 3D representations. Similarly, Hsu, Tsai, and Chen (Citation2018) found that students using 3D representations were able to interpret landscapes more effectively than by using solely 2D topographic maps, while Carbonell-Carrera, Jaeger, and Shipley (Citation2018) discovered that 2D teaching methodologies are still effective and can be complemented by the use of innovative 3D visualization technologies such as AR.
In terms of user preferences, studies have revealed a slight leaning towards 3D representations for topographic mapping and 2D for thematic mapping. In their study of hikers’ preferences between 3D versus 2D representations on trail maps, Schobesberger and Patterson (Citation2008) found that 3D representations were preferred only slightly more than the 2D versions, with a more pronounced preference for 3D revealed at the 26–40 age group. The 2D and 3D trailhead maps with equivalent content and design were displayed for testing in situ on alternate days and under similar conditions, after which participants completed a questionnaire. Similarly, the study by Wahyudi (op. cit.) recorded a very high level of preference for 3D representations of landslides. For thematic maps, Niedomysl et al. (Citation2013) found that participants preferred 2D maps in their study comparing 2D with 3D population density maps of Sweden, although they noted the high level of unfamiliarity with 3D methods of representing these data. For assessing spatial accessibility, participants in the study by Wielebski and Medyńska-Gulij (Citation2019) perceived 3D mapping techniques as being more attractive than their 2D equivalents but considered 2D to be more effective.
The application of eye-tracking hardware and software by Popelka and Brychtova (Citation2013) allowed users’ physiological reactions to simultaneous 2D and 3D terrain representations to be measured. Although the post-experiment questionnaire revealed the users’ preference for 3D representations, the data collected by the eye-tracking equipment indicated that there was no significant difference between participants’ engagement with 2D and 3D versions, which were presented on different sides of a computer monitor. The experiment revealed that the order of the arrangement (i.e. whether the 2D or 3D representations were placed on the left or right sides of the monitor) was more statistically significant in participants’ level of engagement with these representations.
Herbert and Chen (Citation2015) conducted a study that focussed on comparing the effectiveness of 2D and 3D representations for planners, which was based on conducting a series of tasks associated with their everyday workflows. Although the sample was relatively small, the authors concluded that there was no overall preference for one mode over the other, since some tasks (e.g. 2D for making simple measurements and 3D for assessing recession planes and shadows).
The user’s familiarity with virtual environments can also be a factor in affecting their perception of the experience, particularly their level of immersion. Birenboim et al. (Citation2019) conducted an experiment where participants mounted a static bicycle and used HMD to explore a simulated city. Those with prior experience with VR reported lower levels of spatial presence in the IVE experiment.
Hence, there remains a need to investigate user preferences for 2D or 3D representations where participants can choose freely between these modes, to measure their engagement when assigned a wayfinding task or free exploration, and to examine these within the context of using immersive VR. Although previous studies have indicated that user preferences for 2D or 3D representations exist, few have used a head-mounted VR display and therefore the level of immersion has been limited in those experiments.
2.3. Building digital 3D city models
Urban environments and their buildings can be digitally modelled in 3D using many different techniques, from simple extruded polygons to triangulated meshes. There have been different attempts to develop a 3D city modelling taxonomy, for example, Biljecki et al. (Citation2015a) referred to over 100 applications, yet there remains no optimum all-purpose data structure (Ohori, Ledoux, and Stoter Citation2015).
The CityGML 2.0 standard, proposed by the Open Geospatial Consortium (Citation2012), is currently the most popular standard adopted for building 3D city models (Kolbe, Gröger, and Plümer Citation2005). For this standard, elements of the built environment can be modelled using a specific level of detail (LOD) - a term and concept adopted by a wide range of disciplines, from computer graphics to building information modelling, each with its nuances in its definition (Wong and Ellul Citation2016). Within GIS, the concept is most commonly used in 3D city modelling to represent different levels of semantic and geometric complexity. In CityGML, the LOD specifies how much detail should buildings be modelled, ranging from simple 2D models of building footprints (LOD0) to complex 3D exterior and interior models (LOD4) () (Biljecki et al. Citation2016). These LODs can be used in several variants and since there is considerable interest in standards of modelling buildings, they are gradually increasing (Biljecki, Ledoux, and Stoter Citation2016).
Figure 1. Level of detail (LOD) for buildings according to OGC CityGML 2.0 standard (source: authors).
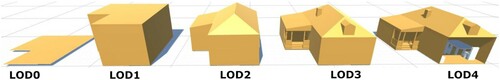
Recent research on LODs focuses on the formalization of 3D city modelling (Biljecki et al. Citation2014; Biljecki et al. Citation2016; Biljecki, Ledoux, and Stoter Citation2016), presenting features in virtual environments (VE) through the selective use of more detailed models (Semmo et al., Citation2012; Lokka and Çöltekin Citation2019), and revising the LOD concept in future CityGML 3.0 specifications (Kutzner, Chaturvedi, and Kolbe Citation2020). Rautenbach, Coetzee, and Çöltekin (Citation2016) noted that users can struggle to perform tasks such as identifying or differentiating between features in the LOD2 model, whereas objects with higher LODs can guide attention by standing out from other objects. The creation of additional objects such as landmarks has also been investigated (Janses-Osmann and Wiedenbauer Citation2004; Nuhn, Reinhardt, and Haske Citation2012). It is, however, important to note that the level of detail does not explicitly convey data quality as defined by ISO Standard 19157 (ISO Citation2013). The LOD is seen as a product specification of a 3D model, and it is different from data quality concepts such as spatial accuracy or completeness. It is therefore possible to devise an LOD1 block model which is accurate and an LOD3 model which is of poorer data quality (Biljecki et al. Citation2015b).
The level of variation (or heterogeneity) in the simulated environment can also influence users’ recall of spatial information. For example, the study by Shushan, Portugali, and Blumenfeld-Lieberthal (Citation2016) asked participants to explore homogenous and heterogenous simulated urban environments on three computer screens and tested their ability to recall their route (by drawing sketch maps) and interviews. Participants using the heterogeneous environment were found to have remembered their route more accurately. In another study, Snopková et al. (Citation2019) discovered that participants who had taken a virtual tour of an indoor environment created richer navigation instructions, mentioned more landmarks, and could recall their characteristics than those who had used a 2D floor plan. It is therefore important to ensure that the LOD is consistent when investigating user engagement in any virtual urban environment.
2.4. Using topographic data in VR
Topographic data collected by national mapping agencies on behalf of the state form an authoritative foundation of national data infrastructure (Kent and Hopfstock Citation2018). These datasets are characterized by their data quality (particularly with regard to accuracy and completeness) and their coverage, which extends over the national territory. Hence, there is immense potential for new VR applications that utilize topographic datasets, and especially for adopting immersive VR, that require a high level of fidelity to the real world.
Although cartographic perspectives of VR have been developed (as discussed above), the application of immersive VR technology to visualize topographic data in a 3D environment has not been fully explored from a user perspective. Responding to the limitations of topographic map symbols, Collinson (Citation1997, 117) suggested that progress in cartography lay in abandoning symbology for the realism of virtual worlds, where maps ‘have sky, and mist, and rain, and shadows, just like the real world’, while Pajarola et al. (Citation1998) proposed the visualization of large topographic scenes through the creation of a virtual reality GIS. In converting existing 2D topographic data for a real-life city into a 3D VR visualization, Halik (Citation2018) noted that the absence of a digital terrain model (DTM) was necessary for an efficient visualization (i.e. with the ground surface as a plane of equal height) and that this could cause problems for environments with higher variations in terrain. Nevertheless, it was demonstrated that a simulated VR environment could be constructed from an existing topographic dataset as maintained by a national mapping agency (as opposed to creating a simulated environment from scratch).
Although it is possible to use other topographic datasets to develop applications of IVR (e.g. Laksono and Aditya Citation2019), there is considerable scope for these to be derived directly from current topographic datasets maintained by national mapping agencies. There are significant advantages offered by the combination of accurate and comprehensive topographic data with IVR capabilities, particularly for real-world user-groups and applications that require such datasets, such as emergency services (police, paramedic, fire and rescue), organizations engaged in disaster relief, urban planning, transport, architecture and utility companies. Hence, national mapping agencies should readily explore the creation of new products that utilize IVR for existing and potential clients and applications.
In this study, we therefore propose the use of immersive virtual environments that are derived from official topographic data (TopoIVE). The rendering of these simulated landscapes may be less realistic than other 3D models, largely due to the generalization of topographic data and their presentation at 1:1 scale. Nevertheless, it represents a step towards the potential implementation of VR by national mapping agencies and the development of new products based on their existing topographic datasets.
3. Methodology
3.1. Approach
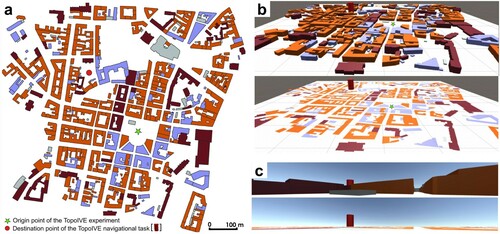
This experiment involves the use of an official topographic dataset (1:10,000 Polish Database of Topographic Objects or BDOT10k) to create an immersive virtual environment (TopoIVE) for the purposes of testing user preferences of 2D versus 3D representations and user behaviour in IVR (). The area covered by the TopoIVE is approximately 1 km² and the representation of 3D buildings was created according to the LOD1 OGC CityGML 2.0 standard, which is the highest level of detail that can be derived from the BDOT10k database. The buildings’ colours were adopted from the original BDOT10k specification according to their function. The VR application allows the user to switch freely between 2D (LOD0) and 3D (LOD1) representations of buildings in the simulation using a remote controller and for their preferences to be recorded and measured.
Figure 2. Experimental design: (a) plan of the fictitious city derived from topographic data (oriented north); (b) bird’s-eye view of 3D and 2D representations of buildings; and (c) first-person view of 3D and 2D representations of buildings in the TopoIVE from the starting point of the experiment, with user height set at 175 cm (source: authors).
People vary widely in their ability to complete spatial tasks, such as locating themselves on a map and visualizing the hidden, internal portions of three-dimensional structures (Ishikawa and Kastens Citation2005). Moreover, Snopková et al. (Citation2019) note that variation in the development of spatial skills and navigation performance is closely related to participants’ predispositions. It is therefore important to consider how variables, including spatial ability, may influence users’ preferences for 2D or 3D representations and their wayfinding behaviour (including observing real-world schema) within immersive virtual environments. If, as Montello (Citation2005) suggests, wayfinding reflects cognitive processes that occur during navigation, analysing wayfinding activities can provide insights into how humans perceive and reason about space.
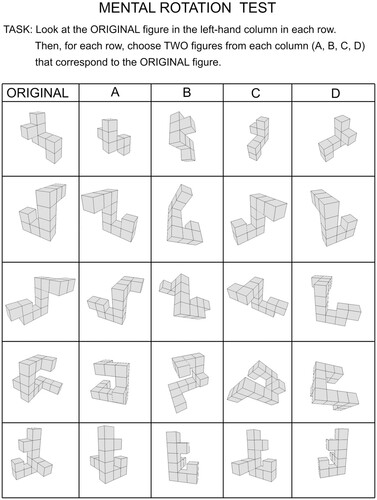
Takemiya and Ishikawa (Citation2011) acknowledge that spatial abilities are likely to have a measurable effect on wayfinding performance. Although Pellegrino, Alderton, and Shute (Citation1984) recognized two major factors, i.e. spatial relations (the mental transformation and rotation of external stimuli) and spatial visualization (the manipulation of surfaces to conform to a solution), a definitive classification of spatial abilities remains elusive. Uttal et al. (Citation2013) classify spatial thinking according to a two-by-two matrix comprising intrinsic representations (relating to the structure and size of individual objects, their parts and the relationship between them) and extrinsic representations (object locations, the relationship between different objects, and the position of objects relative to their reference frames), qualified by either dynamic representations (requiring transformations or manipulations such as scaling, rotating, folding or bending) or static spatial representations (where movement or transformation is not required). Although spatial ability comprises other aspects in addition to mental rotation, Black (Citation2005) identified mental rotation as the strongest predictor of ability in university students’ conceptual understanding of Earth Sciences, and others, such as Wilkening and Fabrikant (Citation2013), applied a mental rotation test (MRT) to assess participants’ use of interactive 3D globe viewers. Similarly, to explore whether spatial ability correlates with preference for 2D or 3D representation or user behaviour, the participants of this experiment undertook an MRT adapted from Vandenberg and Kuse (Citation1978) ().
Figure 3. Mental rotation test (MRT) to measure the spatial ability of participants involved in the study (adapted from Vandenberg and Kuse Citation1978).
In addition to measuring each participant’s mental rotation ability, other characteristics were also recorded: their gender, experience of virtual reality, experience of role-playing games, and whether they had normal vision or required glasses/contact lenses. If there are individual differences in the way that people encode new routes in the context of forming generalizable cognitive maps (Gagnon et al. Citation2018), the recording of these variables enables the participants’ preferences and their behaviour in the TopoIVE to be analysed further.
3.2. Apparatus
As GIS packages have limited functionality for 3D modelling (Buyuksalih et al. Citation2017), a 3D game engine (Unity3D), was used to create the TopoIVE. As an established 3D game engine, Unity3D enables the creation of IVR, particularly the design of urban 3D environments (Indraprastha and Shinozaki Citation2009). However, it also allows the movement and behaviour of participants to be measured, recorded and analysed. The user’s position in the simulated space, as well as their physical movement (including head rotation), can both be captured.
Game engines such as Unity3D use a cartesian system of spatial reference and placing objects closer to the origin generates fewer computational errors when rendering the image (smaller floating numbers result in a more accurate rendering of space and a less ‘jumpy’ image). Since it was derived from actual topographic data, the simulated city was mathematically transformed to the cartesian system using AutoCAD software (with the bottom left-hand corner of the TopoIVE set as the origin, i.e. 0, 0, 0). This ensured a higher accuracy for tracing the movement of participants within the simulated environment, and for pinpointing their actions, such as their switching between 2D and 3D modes of representation.
To ensure sufficient focus on the comparison of 2D and 3D representation of buildings, the TopoIVE created for this experiment does not incorporate variations in elevation. Some modifications were also made to the dataset, i.e. the inclusion of some fictitious buildings and the inversion of spatial locations, in order to avoid participants recognizing the city and navigating according to their familiarity with its built environment. Hence, the TopoIVE adopted here may be termed more accurately as a ‘pseudoTopoIVE’ (as opposed to an ‘orthoTopoIVE’). Nevertheless, sufficient fidelity to the original dataset was retained in order to ensure compatibility with future applications.
The hardware used in the experiment comprised a laptop computer (MSI GS63VR 7RF series, Core i7-7700HQ CPU, GeForce GTX 1060 6 GB) to run the TopoIVE, with participants using a FOVE 0 tethered head-mounted display (HMD) together with a Bluetooth remote controller. FOVE 0 was the first HMD to be equipped with eye-tracking technology and foveated rendering, hence the visual display was superior to that offered by other standard tethered HMDs. The controller allowed participants to switch between 2D and 3D modes of representation and to initiate movement with its two-way joystick (forwards-backwards), in the direction of the participant’s viewing direction in the HMD. The experiment was conducted indoors with one participant at a time seated at a desk in a controlled laboratory environment and supervised by two researchers. The laptop computer was placed on the desk in front of the participants, allowing the researchers to see the image displayed on the HMD in real time.
3.3. Participants
Sixty participants (29 male and 31 female, with a mean age of 22 years), all of whom undergraduate students enrolled on the BSc Geography programme at Adam Mickiewicz University, Poznan (Poland), voluntarily took part in the experiment. Participation was conditional on the absence of known susceptibility to photosensitive epilepsy, which none reported.
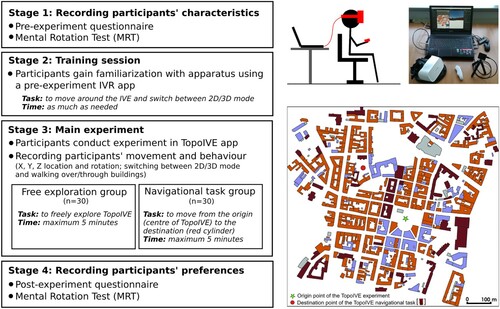
3.4. Procedure
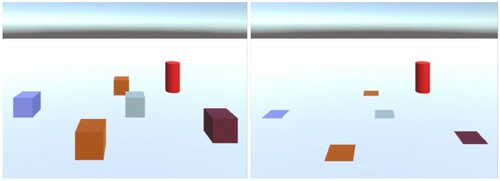
The procedure comprises four stages. Firstly, the participants completed a pre-experiment questionnaire to collect basic information (e.g. age, gender, left/right-handedness, visual defects, video role-playing game experience and IVR experience) and undertook a mental rotation test (see ). After the completion of the questionnaire and mental rotation test, all participants were given a short training session to allow their familiarization with the HMD equipment and Bluetooth controller. A pre-experiment IVR app was created to give each participant experience in moving between different coloured cubes (1 × 1×1 m in size) and a red cylinder placed randomly on a flat surface. The participant could turn the 3D view of the coloured cubes on or off (), although the red cylinder remained in 3D to simulate the destination towards which some participants would be navigating within the TopoIVE. This aimed to ensure that those participants could readily identify their destination without being distracted from their navigational task. Under the supervision of the investigators, the participants were free to use as much time as they needed in order to become familiar with the way of moving and switching between modes (usually under two minutes). Participants were not told whether or not they could walk over/through buildings and none asked if this was either possible or permitted.
Figure 4. 3D (left) and 2D (right) mode in the pre-experiment HMD VR app (source: authors).
For the third stage (the main experiment), the participants were divided into two groups of equal size. The approach followed a between-subjects design, in which the participants were allocated one of two different experimental conditions, with each participant experiencing only one of these conditions. All participants started from a place close to a central point in the TopoIVE (). One group was given a navigational task that required their movement across the TopoIVE from point A (a green star) to point B (a red cylindrical building located between the participant’s location and the north-west corner of the TopoIVE) in the quickest possible time. The other group were given the freedom to explore the TopoIVE without being allocated a specific navigational task. The red cylindrical building was visible from the beginning of the experiment by both groups. Participants could control the start and stop of their movement around the TopoIVE using the Bluetooth remote controller, with a constant speed of 5 m/s in the direction towards which the HMD was pointing ().
Figure 5. The experimental procedure (left), setup and equipment (top-right), and plan of the TopoIVE (bottom-right). The participant’s location in the TopoIVE and their view is presented in real-time on the laptop display for monitoring by the researchers. A video indicating what participants saw in the HMD when conducting the experiment is available at: https://youtu.be/TFcdyX_txfc.
Despite advancements in VR technologies, many users still experience sickness symptoms (Saredakis et al. Citation2020). Various studies have indicated that exposure to episodes of VR can cause nausea and/or disorientation (e.g. McCauley et al. Citation1990; Rebenitsch and Owen Citation2016; Sinitski et al. Citation2018), with the duration of exposure remaining a key factor (Duzmanska, Strojny, and Strojny Citation2018). According to some researchers (e.g. Min et al. Citation2004), users may exhibit symptoms of VR sickness after 10 min, which is when symptoms peaked in the study by Moss and Muth (Citation2011). Although the manufacturers of the FOVE 0 HMD recommend that periods of using the equipment should not exceed 30 min, to follow ethical considerations in the present experiment, both groups of participants were given a maximum of five minutes to accomplish their task, one participant at a time, and so their individual use of the HMD was completed before 10 min.
During the experiment, each participant’s location in the TopoIVE (position X, position Y, position Z), their HMD rotation (rotation X, rotation Y, rotation Z) and their action (switching between 2D/3D mode of representation) were recorded and saved in a spreadsheet (as a CSV file) for further analysis. These data therefore also indicate whether participants observed real-world schema (e.g. walking over buildings in 2D mode or through buildings in 3D mode) while engaged in the TopoIVE.
Participants could remain in the TopoIVE for up to five minutes, regardless of their task. Afterwards, each completed a post-experiment questionnaire that asked them to reflect upon their experience in the TopoIVE and also to state which mode of representation (2D/3D) they preferred and why. They also undertook another mental rotation test to compare any differences between pre-and post-VR results. These steps concluded the fourth and final stage of the procedure.
4. Results
All sixty participants carried out the set tasks using the FOVE 0 headset and TopoIVE and completed the pre- and post-experiment questionnaires. None were ineligible due to epilepsy or other conditions and none demonstrated symptoms of VR sickness whilst participating in the experiment.
4.1. Preferences for 3D or 2D mode of representation
The first hypothesis aimed to establish whether users prefer one mode of representation in the TopoIVE (first-person-view mode), regardless of the task they were given. In order to compare these preferences with the participants’ actual behaviour in the TopoIVE, the time each participant spent in 3D/2D mode was recorded, enabling the percentage time that participants spent in each mode to be calculated, along with the number of times participants switched between modes. These results are compared with the 3D/2D preferences as stated by participants in the post-experiment questionnaire to reveal the extent to which they reflect participants’ behaviour in the TopoIVE.
4.1.1. Analysis by group
The results indicate that for both groups of participants, a greater percentage of time was spent in 3D mode (85%) and a slightly higher percentage of participants in the navigational task group spent more time in 2D mode than those in the free exploration group (18% versus 13%). According to a Mann–Whitney U test (a Kolmogorov–Smirnov test indicated that the distribution is not normal), the percentage of time spent in either mode of representation depending on the task was not statistically significant (2D mode p-value > 0.05 (0.265526); 3D mode p-value > 0.05 (0.259256)). The frequency at which participants switched between 2D and 3D modes in the TopoIVE indicate that, on average, participants belonging to the free exploration group switched between modes slightly more frequently than those in the navigational task group (7.5 versus 6.9 mean switches), but again, the difference between groups was not found to be statistically significant.
According to the post-experiment questionnaire, 77% of all participants (comprising both groups) preferred the 3D mode of representation over the 2D mode, which aligns to the higher percentage of time all participants spent in the 3D mode (85%). In analyzing the preferences for each group, of those allowed to freely explore the TopoIVE (n = 30), 90% preferred 3D mode whereas 10% preferred 2D. Of the participants in the navigational task group (n = 30), mostly (63%) preferred the 3D mode, with 37% preferring 2D. A Chi-squared test confirms that the difference in preferences according to the allocated task is statistically significant (p-value <0.05 (0.0014611)). Although the 3D mode of representation was preferred by all groups and more time was spent in this mode than in 2D, two participants (both of whom were given the navigational task) preferred the 2D mode and spent more time in the 2D mode. Additionally, twelve participants stated they preferred 2D, but actually spent more time in 3D mode. There were three participants in each group who used 3D mode but did not switch to 2D.
summarizes the factors influencing the mode of preference that participants identified in the post-experiment questionnaire (percentage of participants in brackets). Generally, the motivation for choosing a given mode was similar for both groups. The 2D mode is regarded as useful for practical aspects related to wayfinding, such as overcoming problems with visibility (e.g. when obstructed by buildings), orientating oneself more easily, and finding passages between buildings. In contrast, the motivations for selecting 3D mode are more related to aesthetic aspects of the visual experience, such as a more realistic, interesting, or attractive appearance, and better identification of the type of building. Drawing a comparison with regard to the time spent in each mode suggests that the 3D mode was the preferred choice for movement around the TopoIVE, while the 2D mode was selected for orientation and to remove occlusion by providing an unobstructed view of the surroundings.
Table 1. Participants’ stated motivations for choosing the mode of representation in the TopoIVE.
4.1.2. Analysis by participant characteristics
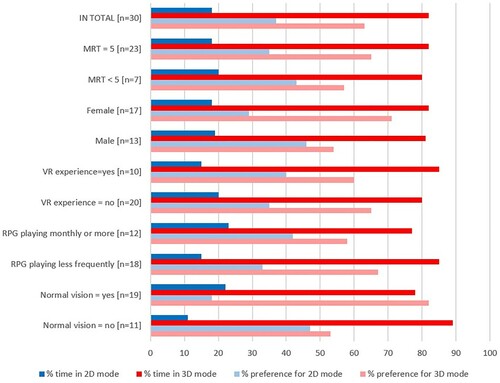
Of the 60 participants, 63% either played video role-playing games less frequently than several times per month or never; 32% had previous experience with immersive virtual reality, mainly in amusement arcades; two-thirds reported normal vision (one-third stated wearing glasses or contact lenses); and 63% gained full marks (i.e. five correct answers) for the mental rotation test. In order to investigate differences between and within groups in the percentage of time spent in either mode of representation, a series of Mann–Whitney U tests were performed. These tests revealed no statistically significant results, neither did tests for 2D or 3D preferences in the post-experiment questionnaire, according to participants’ characteristics (i.e. their MRT score, gender, VR experience, RPG experience, or vision) (). confirms the significantly higher levels in the use of, and preference for, 2D mode amongst participants in the navigational task group regardless of their characteristics.
Figure 6. Percentage of time that participants from both groups spent in 2D and 3D modes of representation and their preferences.
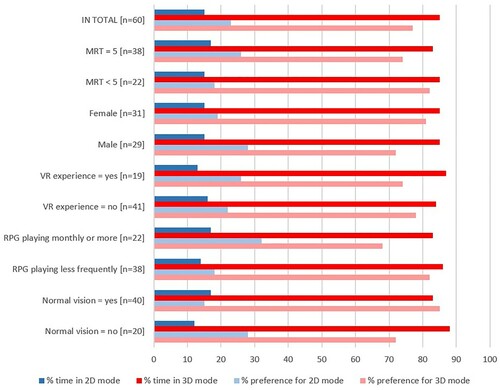
Figure 7. Percentage of time that participants in the free exploration group spent in 2D and 3D modes of representation and their preferences.
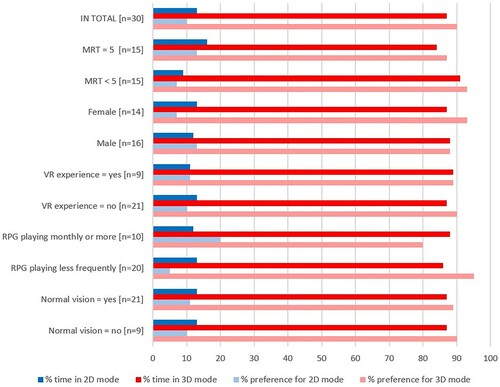
Figure 8. Percentage of time that participants in the navigational task group spent in 2D and 3D modes of representation and their preferences.
present the number of switches participants made between the two modes of representation and their preferences for either mode. Examining the mean number of switches for all participants, the highest were made under each of these categories: a full MRT score (5), male, with experience of VR, playing RPGs monthly or more, and with normal vision. This was the case for both groups (free exploration and navigational task). Those participants who played RPGs games regularly recorded the highest mean number of switches (9.3), particularly for the free exploration group (10.8). It is possible that they tended to be more confident in the experiment and therefore switched between 2D and 3D more often.
Table 2. Number of switches between modes and mode preferences from the post-test questionnaire for participants of both groups.
Table 3. Number of switches between modes and mode preferences from the post-test questionnaire for participants in the free exploration group.
Table 4. Number of switches between modes and mode preferences from the post-test questionnaire for participants in the navigational task group.
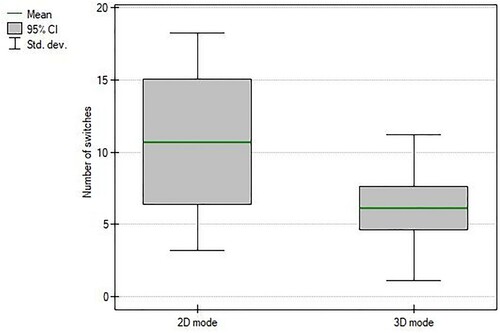
A Mann–Whitney U test again revealed that there was no significant difference between the mean number of switches between modes of representation and the groups and sub-groups. Despite the contrast between the results of male and female participants, a box plot () indicates that there are several outliers caused by a few male participants who switched between modes very frequently. However, the test did find a significant difference between the frequency of switching and participants’ preferences for 2D or 3D mode in the post-experiment questionnaire (). This indicates that those participants who stated a preference for the 2D mode tended to switch between modes more often and, hence, referred to 2D more often than those who preferred 3D.
Figure 9. Box plot indicating the frequency of switching between 2D and 3D modes of representation for male and female participants from both groups.
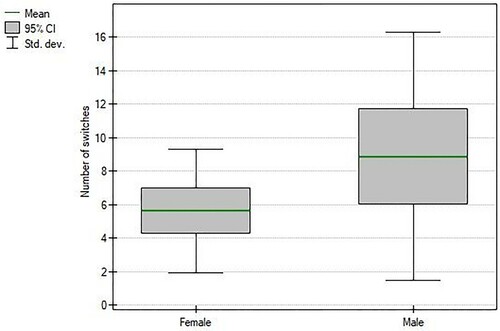
Figure 10. Box plot indicating the frequency of switching between 2D and 3D modes of representation and participants’ post-experiment mode preferences from both groups.
These results indicate that most participants (77%) preferred the 3D mode of representation regardless of the task they were given. They indicated a preference for this mode both during their experience of the TopoIVE (in terms of the duration of time spent in that mode) and in their post-experiment reflective opinion. The hypothesis that participants will prefer one mode (2D or 3D) regardless of their task is therefore accepted. The next section presents the results associated with the second hypothesis relating to the participants’ behaviour in the TopoIVE and their observance of real-world schema.
4.2. User behaviour in the TopoIVE
The second hypothesis aimed to test whether users behave differently when using a 3D or a 2D mode of representation in immersive VR (in first-person-view mode). For example, these modes may trigger different behaviours such as adherence to real-world accessibility schema, e.g. not walking over/through buildings, regardless of whether participants are given a navigational task or are allowed to freely explore the TopoIVE. In order to test the second hypothesis, participants’ locations in the TopoIVE were recorded (X, Y, Z) and it was therefore possible to derive maps from these data to compare the spatial patterns of movement and to establish sections where the 3D or 2D mode was selected by participants. The maps also indicate their behaviour with regard to real-world schema, such as whether or not the participants walked over/through buildings.
4.2.1. Analysis by group
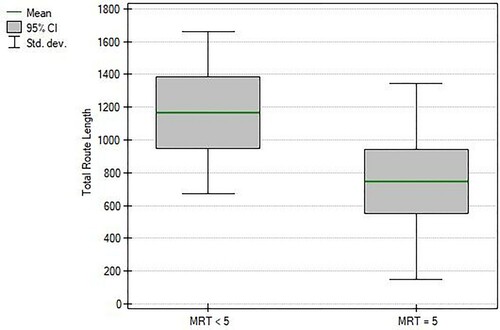
The first two maps () indicate participants’ tracks for each group. As may be expected, there is greater coverage of the TopoIVE by the free exploration group ((a)) than by those undertaking the navigational task ((b)). Those in the latter demonstrate a more focussed direction of travel to the destination building (cf. ), although some participants engaged in an exploration of the TopoIVE after they had completed their objective in reaching their destination. is a box plot comparing the total track lengths of participants in the two groups, which exhibits a statistically significant difference. There is also a statistically significant difference between participants with an MRT result of 5 and those who scored under 5, as represented in . Participants who (according to the post-experiment questionnaire) preferred different modes of representation tended to access different levels of the extent of the TopoIVE. However, since the sample sizes of the preference groups were considerably different (19 for 3D versus 11 for 2D for the navigational group and 27 for 3D versus 3 for 2D for the free exploration group), it was not possible to test for meaningful associations.
Figure 11. Tracks of participants in the TopoIVE from (a) the free exploration group (n = 30), and (b) the navigational task group (n = 30), with blue lines indicating the tracks recorded after participants had reached their destination.
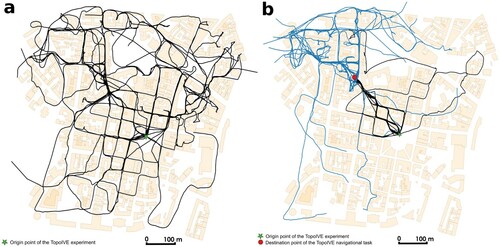
Figure 12. Box plot indicating the total route length for participants from both groups (p-value = 0.017896).
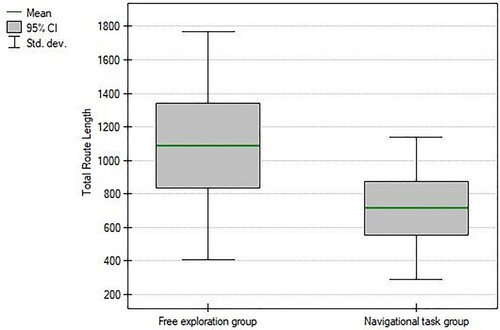
Figure 13. Box plot indicating the total route length for participants with MRT <5 and MRT = 5 from both groups (p-value = 0.002439).
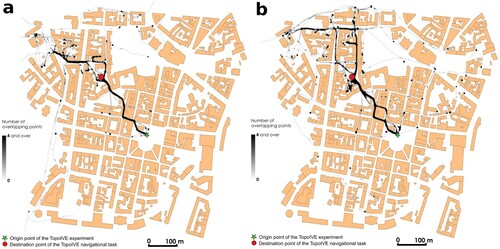
The next four maps indicate the tracks that the participants made while using 2D mode () and 3D mode () for both groups. As the maps indicate, the spatial implementation of 2D mode (i.e. where it was used) is more consistent in the navigational task group and more sporadic in the free exploration group. Indeed, the navigational task group tended to use 2D mode to reach the destination before exploring the TopoIVE in 3D, while the free exploration group seemed to rely on 2D mode for the purposes of orientation and to remove occlusion and reverted to 3D mode while moving around the TopoIVE. These results suggest that participants tended to use 2D mode when fulfilling a navigational task whereas they preferred using the 3D mode to freely explore the TopoIVE.
Figure 14. Tracks of participants in (a) the free exploration group, and (b) the navigational task group while using 2D mode.
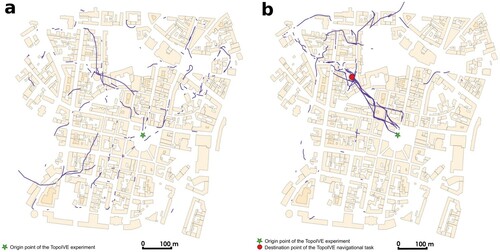
Figure 15. Tracks of participants in (a) the free exploration group, and (b) the navigational task group while using 3D mode.
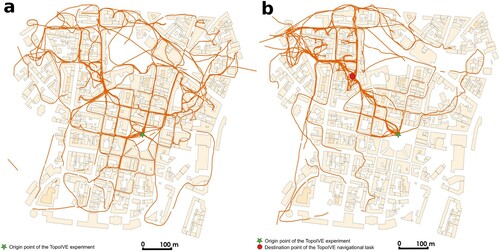
indicates the widespread use of 3D mode in both groups and confirms that participants preferred this mode in terms of where they used it, when and for how long. These maps reinforce the point made earlier that 3D mode tends to have been used for movement, with participants referring to the 2D mode for orientation, i.e. they would stop moving and switch to the 2D mode of representation to ‘get their bearings’ (rather like stopping to consult a 2D map in the real world). It is worth noting that participants in the navigational task group could have opted to remain in 2D mode throughout (since the red cylindrical building was always visible in this mode) and therefore have simply walked in a straight line towards their destination instead of reverting to 3D mode.
4.2.2. Analysis by participant characteristics
In order to investigate whether participants’ behaviour in navigating the TopoIVE varies according to their characteristics (i.e. spatial ability, gender, experience of using VR, frequency of using RPG, and whether they have normal vision), their tracks in the TopoIVE were analysed and a series of linear density maps were created. These reveal whether there are differences in how participants navigated and moved through the TopoIVE. It should be noted, however, that the method of visualizing these data according to the density of routes (as per the maps below) is only applicable for equally sized samples, such as gender in this case.
Firstly, in terms of participants’ general movement throughout the TopoIVE, the maps reveal that the lower half of the simulated city was rarely encountered (even by the free exploration group), since participants tended to move in the direction they were facing when first experiencing the TopoIVE. This implies that the initial view presented to the participants in a virtual environment may have considerable influence over their subsequent direction of travel.
A comparison between the track densities of all male and all female participants () indicates that, overall, there was a greater diversity of routes taken by male participants. However, when comparing the routes undertaken by male and female participants in each group ( and ), the maps indicate that there were general differences in the paths chosen by male and female participants. For example, in the navigational task group, female participants tended to use routes on both sides of the square building in reaching their destination, whereas male participants tended to use only one side. Additionally, once their navigational task had been completed, the female participants tended to explore the TopoIVE by moving in the same direction beyond the destination (the red cylinder), whereas male participants tended to move to the west.
Figure 16. Track densities of (a) male participants from both groups (n = 29), and (b) female participants from both groups (n = 31).
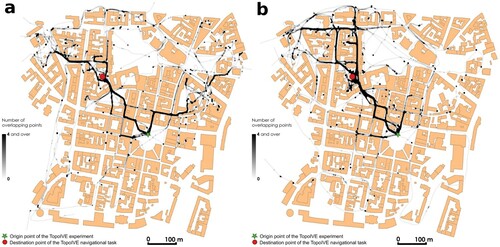
Figure 17. Track densities of (a) male participants in the free exploration group (n = 16), and (b) female participants in the free exploration group (n = 14).
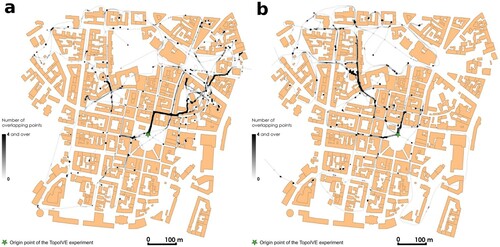
Figure 18. Track densities of (a) male participants in the navigational task group (n = 13), and (b) female participants in the navigational task group (n = 17).
The difference of approaches between the two genders is amplified when comparing the density of participants’ routes in the free exploration group (). Here, there is a clear difference in the choice of direction after participants moved forward and reached the first major junction, with the majority of male participants choosing to go right ((a)) and the majority of female participants choosing to go left ((b)). Since the red cylinder was present as a prominent building in the TopoIVE presented to both the navigational task and the free exploration groups, it is possible that the female participants in the latter were more curious to investigate this landmark and decided to reach it. By contrast, the male participants tended to explore the northeastern region of the TopoIVE.
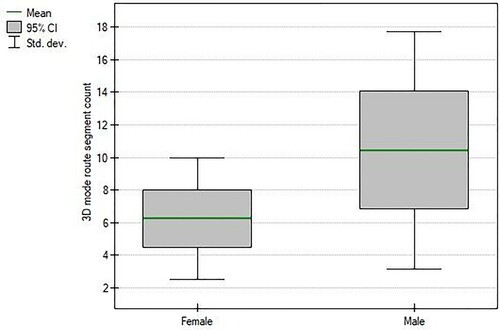
Statistically significant differences corresponding to gender are also indicated by the minimum period spent in 2D mode regardless of group (p-value = 0.048564), the average (mean) time spent in 2D mode (p-value = 0.039079) (), the average (mean) route length in the 3D mode for male and female participants in either group whose MRT score is 5 (p-value = 0.047658), and the number of route segments in the 3D mode for male and female participants in either group whose MRT score is 5 (p-value = 0.037845) (). Although these results reveal differences between the male and female samples within each group, the variance within other variables (such as VR experience) in the sample is too great to allow meaningful tests for the independence of these variables in determining behaviour based on spatial patterns of movement within the TopoIVE.
Figure 19. Box plot indicating the count of route segments in the 3D mode for male and female participants from both groups whose MRT score is 5 (p-value = 0.037845).
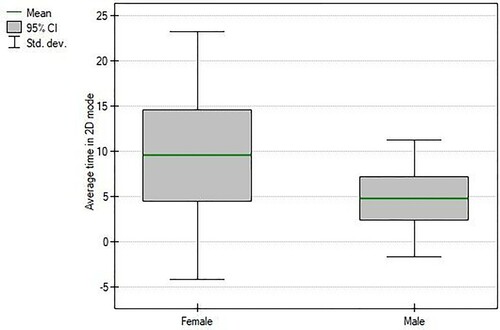
Figure 20. Box plot indicating the average time in the 2D mode for male and female participants from both groups (p-value = 0.039079).
Regarding participants’ behaviour in terms of their adherence to real-world schema, the results indicate that this varies according to the chosen mode of representation. For the 2D mode, there is no statistical difference (p-value = 0.541552) between the two groups, as most users (free exploration group 80%; navigational task group 73%) walked between the building outlines in the 2D mode without walking over them. By contrast, there is a statistically significant difference (p-value = 0.000025) between the two groups when using 3D mode: over 93% of participants in the navigational task group went through buildings at least once, whereas this was only 57% in the free exploration group.
indicates a further analysis of those participants who chose to walk over/through buildings according to their mental rotation test (MRT) score, gender, VR experience, and frequency of playing RPGs. In addition to the tendency for participants with a higher MRT score to walk through or over buildings regardless of 2D or 3D mode, the results suggest that the level of experience in VR and RPGs experience plays a role in how real-world schema are considered in a virtual environment. Those with VR experience and more frequent engagement in RPGs in the free exploration group tended to not walk over/through buildings (regardless of mode), while those without VR experience or lower engagement in RPGs in the navigational task group tended to walk through buildings in 3D mode. This could be explained by the participants’ experience in VR and RPGs conditioning them to observe real-world schema (e.g. from games where real-world schema are simulated) in the TopoIVE.
Table 5. Percentage of participants who walked over/through buildings while using 2D/3D mode.
With regard to participants’ performance in MRT scores before and after the VR experiment, there were no statistically significant differences between groups or between pre-experiment and post-experiment MRT results. In the free exploration group, 7 participants had a lower score in the post-experiment MRT (4 female, 3 male); 17 had the same score; and 6 had a higher score (3 female, 3 male). In the navigational task group, 2 participants had a lower score in the post-experiment MRT (both male); 26 had the same score; and 2 had a higher score (both female). Since a modified MRT was presented (i.e. having different solutions) with the intention of eliminating the possibility of participants remembering answers from the previous test, the elapsed time between pre- and post-experiment MRTs was not required to be consistent.
The results of this experiment suggest that, in general, participants behaved in the simulated city as if they were moving through a city in real life, regardless of the mode of representation (2D or 3D) they used most often or stated as their preference after the test. They could walk over/through buildings, yet most chose to adhere to real-world schema by following the streets. More specifically, the results also confirm the second hypothesis by indicating that the different modes of representation triggered different behaviours in the TopoIVE. Most participants used the 3D mode for moving around the simulated urban environment (and adhered to real-world accessibility schema when doing so) but used the 2D mode to orientate themselves while stationary, regardless of whether they were given the navigational task or were allowed to freely explore the TopoIVE.
5. Discussion
Based on the results of existing studies, the TopoIVE was designed to allow participants to switch between 2D and 3D modes of representation and to allow these preferences to be evaluated and compared with a post-experiment questionnaire. The latter revealed that participants preferred 3D over 2D mode, regardless of the task they were given, and recorded their rationale for doing so: moving through a simulated virtual environment in 3D mode is more familiar and aesthetically engaging, while the 2D mode is more beneficial for the practical purposes of orientation and wayfinding.
The results of the first part of this study support the findings of Shushan, Portugali, and Blumenfeld-Lieberthal (Citation2016) and Birenboim et al. (Citation2019), that users prefer the egocentric approach offered by a first-person point-of-view mode in 3D virtual environments. They also align with those of Wahyudi, Ramdani, and Bachtiar (Citation2020), whose participants indicated a very high level of preference for 3D digital representations of landslides. In terms of the comparison between test and post-experiment preferences between 2D and 3D modes, the results of the post-experiment questionnaire in the present study indicate a similar finding to that of Popelka and Brychtova (Citation2013), whose participants stated a preference for 3D mode in their post-experiment questionnaire. However, the results of the present study demonstrate a far stronger alignment between participants’ use of 3D mode during the test and their stated preference for this mode.
Although the results indicate an overall preference for 3D mode (which was corroborated by results indicating the time participants spent using 3D), this does not necessarily imply that participants regarded 2D mode to be unhelpful or irrelevant. The differences in user preferences were reflected more substantially when comparing the two groups, with a greater proportion of participants in the navigational task group preferring the 2D mode. Only five participants (in total from both groups) chose to remain in 3D mode throughout, while the other 55 made use of both modes. The higher percentage of switching between modes in the navigational task group suggests that the availability of both modes of representation was deemed helpful, probably by combining the wayfinding activities of movement (in 3D mode) and task-driven orientation (in 2D mode). This confirms the findings of Liao and Dong (Citation2017), who observed participants’ combined use of 3D perspective views and 2D building layouts in navigational tasks, and those of Wielebski and Medyńska-Gulij (Citation2019), where participants perceived 3D mapping techniques to be more attractive but considered 2D more effective when assessing spatial accessibility. The lack of statistically significant associations between participants’ characteristics (i.e. MRT score, gender, VR experience, RPG experience, vision) and their preference and use for either mode of representation, however, suggests that other, unidentified, factors may influence these choices. Indeed, since this study used a mental rotation test as a proxy for spatial ability (and found no significant difference between pre- and post-experiment MRT scores), other indicators could have been responsible for participants’ wayfinding behaviour.
The second part of the study, which focused upon comparing participants’ behaviour in the TopoIVE, indicated that most adhered to real-world schema, regardless of the task they were given (free exploration or navigation), but revealed differences according to whether the 2D or 3D mode of representation was selected. Specifically, these differences concern whether participants walked over/through buildings, as well as how each mode of representation was used. Non-experienced VR users, for example, were more willing to walk over/through buildings. Birenboim et al. (Citation2019) found that participants with prior experience of VR reported lower levels of spatial presence in their IVE experiment, which were attributed to the VR-experienced participants being more critical of imperfect representations in the IVE, whereas those without VR experience were likely to have been more distracted by their immersion into VR, which made them more enthusiastic. It is therefore possible that their unfamiliarity of the immersive environment may have triggered some participants to experiment with the schema of the TopoIVE, whereas VR-experienced users tended to limit their movement to the streets. Their familiarity with the limitations of movement (as real-world schema), derived from their experience of other virtual environments, is likely to have influenced their behaviour in the TopoIVE and therefore also their adherence to real-world schema.
It was also clear that participants generally moved in the direction in which they faced when first entering the TopoIVE. This observation suggests that users tend to move forward under the assumption that they enter the TopoIVE facing the most beneficial direction of travel. Changing this initial orientation would therefore provide a useful avenue for further research that could inform producers of immersive virtual environments regarding the most useful initial viewpoint.
When investigating whether participants’ behaviour in the TopoIVE varied according to their characteristics, differences in gender revealed the most pronounced results. There were marked differences in both groups according to how male and female participants navigated through the TopoIVE. These differences support the findings of Gagnon et al. (Citation2018), who confirm that gender is a prominent individual difference variable in spatial memory and navigation, especially in the context of navigation in large-scale space. The difference in how male and female participants behaved in the free exploration group was characterized by the diversity of routes and in the direction in which females tended to move at a specific junction, leading them to explore the area around the red cylinder (the destination point for the navigational task group and present in the TopoIVE for both groups). Gagnon et al. (Citation2018) found that in a free exploration task in a large-scale virtual environment, females revisited previous locations more often and showed lower rates of spreading through an area. The reasons for this are unclear, although Golledge et al. (Citation2000) found that females tended to orient themselves according to landmarks and their visual characteristics, whereas males oriented themselves more according to direction and the spatial relationships between landmarks. Similarly, Liao and Dong (Citation2017) observed opposing gender differences in visual attention on landmarks between 3D and 2D groups of participants, with males fixated longer on landmarks than females when using a 3D map and females paying more visual attention to landmarks than males when using a 2D map. Although these results were not replicated in the present study (i.e. differences between male and female fixations on landmarks according to their preference for 2D or 3D), they nevertheless suggest that the presence of distinctive landmarks can amplify existing gender differences in wayfinding strategies. This is further supported by Munion et al. (Citation2019), whose real-world navigational experiment indicated that gender is associated with the type of wayfinding behaviours someone is likely to produce, and how people move through the environment is related to their ability to locate targets.
6. Conclusion
This study aimed to investigate user preferences and behaviour in an immersive virtual environment (IVE). It involved the creation and implementation of a TopoIVE – a new immersive virtual environment derived from official 1:10,000 topographic base data – that allowed participants to switch between 2D and 3D modes of representation (respectively between LOD0 and LOD1). The division of the participants into two groups according to their task (i.e. navigation to a specific destination or free exploration), enabled their preferences and behaviour to be analysed accordingly.
The results indicated that most participants preferred the 3D mode of representation, although the preference for the 2D mode was slightly higher amongst participants who were assigned the navigational task. The frequency with which participants switched between 2D and 3D modes, however, suggests that they exploited different aspects of 2D and 3D methods of visualization; 2D being used for orientation and 3D for movement, with 2D being used more often in the navigational task group. This mimics real-world wayfinding behaviour to some extent, with pedestrians stopping to consult a 2D map to ‘get their bearings’. However, the 2D mode was also chosen to gain unobstructed views of the surroundings (to remove occlusion). An avenue for further study could assess whether a 2D map is more effective for wayfinding than making buildings less opaque in 3D mode, for example.
In contrast to identifying a preference for a particular mode and recommending its exclusive use (e.g. promoting IVR as a purely 3D representation), the results of this study indicate the value of allowing users to choose between 2D and 3D modes, particularly for navigational tasks. This multi-modality enables users to gain a more holistic understanding of the environment and synergizes the advantages of both perspectives. Given that participants’ characteristics (i.e. their mental rotation test scores, gender, experience of VR or role-playing games) had no significant association with these preferences implies a general acceptance of the benefits of access to both 2D and 3D modes of representation. It is therefore recommended that producers of topographic datasets should develop the functionality of their products using VR accordingly.
The results also indicated that participants tended to adhere to real-world schema while moving through the TopoIVE. Specifically, they chose to walk along streets and not over/through buildings, even when this would have given them an advantage (especially those in the navigational task group). Participants with less experience of VR walked over/through buildings in the TopoIVE more frequently than those with experience, suggesting that the former were not inhibited by previous VR experience that had conditioned the latter into respecting real-world schema. This is potentially significant for the development of virtual environments that rely upon real-world schema to function correctly, e.g. those which are designed to introduce participants to role-play situations (such as emergency responses) and evaluate their behaviour. It cannot be assumed that participants with little or no experience in VR will automatically observe real-world schema, e.g. not walking over/through buildings in order to reach a destination in the simulation of a critical event.
When investigating participants’ routes in moving through the TopoIVE, the results revealed different wayfinding strategies adopted by participants according to their gender. In particular, males and females in the free exploration group demonstrated a clear difference in their choices at a particular road junction. It is possible that the presence of a distinctive feature in the simulated environment, a red cylinder (that was also the destination for the navigational task group), stimulated the curiosity of the female participants, while males decided to walk in the opposite direction. This corroborated the results of related studies, which indicate the influence of landmarks on wayfinding strategies adopted by females, although more research is required in this area to evaluate how this affects behaviour in virtual environments.
Since the navigational performance of participants was not tested in this study, i.e. the time taken for participants in the navigational task group to reach their destination, there is scope to investigate whether the availability of both 2D and 3D modes is advantageous for wayfinding. Further work should also be directed towards identifying the critical moments of decision-making in the virtual environment and what elements influence those wayfinding decisions. The development of the TopoIVE to incorporate further datasets (e.g. elevation, hydrology, and vegetation) and higher levels of detail (LOD) may also reveal insights into how these important factors influence participants’ behaviour and decision-making.
This study recommends that organizations that create and maintain topographic datasets (e.g. national mapping agencies) should develop TopoIVE products, since there are many applications for real-scale immersive exploration using accurate base data. These include urban planning (e.g. to evaluate accessibility and the impact of proposed developments from a first-person view), emergency services such as police, fire and search and rescue (e.g. to prepare and train staff in reacting to hazards or creating a mental map of a disaster zone), military (to prepare staff for urban operations), retail (for evaluating visibility), tourism (e.g. the remote exploration of destinations), and medical applications (e.g. for treating anxiety and agoraphobia). Although smaller-scale renderings would be beneficial for some applications where real-scale exploration is not necessary or where detailed data are not available, the development of TopoIVE products presents a paradigm shift in the way that topographic data are utilized.
Disclosure statement
No potential conflict of interest was reported by the author(s).
Data availability statement
Data available within the article or its supplementary materials.
Additional information
Notes on contributors
Łukasz Halik
Łukasz Halik is an Assistant Professor at Adam Mickiewicz University in Poznań, Poland, where he lectures on virtual reality, augmented reality, GIS and on surveying. His research explores the relationship between extended reality, user and the spatial data especially topographic mapping. He is also Vice-Chair of the ICA Commission on Topographic Mapping.
Alexander J. Kent
Alexander J. Kent is Reader in Cartography and Geographic Information Science at Canterbury Christ Church University in the UK, where he lectures on map design, GIS, remote sensing and on European and political geography. His research explores the relationship between maps and society, particularly the intercultural aspects of topographic map design and the aesthetics of cartography. He is also Chair of the ICA Commission on Topographic Mapping and formerly President of the British Cartographic Society.
References
- Batty, M. 1997. “Virtual Geography.” Futures 29 (4–5): 337–352. doi:https://doi.org/10.1016/s0016-3287(97)00018-9.
- Biljecki, F., G. B. Heuvelink, H. Ledoux, and J. Stoter. 2015b. “Propagation of Positional Error in 3D GIS: Estimation of the Solar Irradiation of Building Roofs.” International Journal of Geographical Information Science 29 (12): 2269–2294.
- Biljecki, F., H. Ledoux, and J. Stoter. 2016. “An Improved LOD Specification for 3D Building Models.” Computers, Environment and Urban Systems 59: 25–37.
- Biljecki, F., H. Ledoux, J. Stoter, and G. Vosselman. 2016. “The Variants of an LOD of a 3D Building Model and Their Influence on Spatial Analyses.” ISPRS Journal of Photogrammetry and Remote Sensing 116: 42–54.
- Biljecki, F., H. Ledoux, J. Stoter, and J. Zhao. 2014. “Formalisation of the Level of Detail in 3D City Modelling.” Computers Environment and Urban Systems 48: 1–15.
- Biljecki, F., J. Stoter, H. Ledoux, S. Zlatanova, and A. Çöltekin. 2015a. “Applications of 3D City Models: State of the Art Review.” ISPRS International Journal of Geo-Information 4: 2842–2889. doi:https://doi.org/10.3390/ijgi4042842.
- Birenboim, A., M. Dijst, D. Ettema, J. de Kruijf, G. de Leeuw, and N. Dogterom. 2019. "The Utilization of Immersive Virtual Environments for the Investigation of Environmental Preferences." Landscape and Urban Planning 189: 129–138. doi:https://doi.org/10.1016/j.landurbplan.2019.04.011.
- Bischof, W., and P. Boulanger. 2003. “Spatial Navigation in Virtual Reality Environments: An EEG Analysis.” Cyber Psychology & Behavior 6 (5): 487–495.
- Black, A. A. 2005. “Spatial Ability and Earth Science Conceptual Understanding.” Journal of Geoscience Education 53 (4): 402–414.
- Blom, K. J., and S. Beckhaus. 2014. “The Design Space of Dynamic Interactive Virtual Environments.” Virtual Reality 18: 101–116. doi:https://doi.org/10.1007/s10055-013-0232-y.
- Boulos, M. N. K., Z. Lu, P. Guerrero, C. Jennett, and A. Steed. 2017. “From Urban Planning and Emergency Training to Pokemon Go: Applications of Virtual Reality GIS (VRGIS) and Augmented Reality GIS (ARGIS) in Personal, Public and Environmental Health.” International Journal of Health Geographics 16 (1): 1–11. doi:https://doi.org/10.1186/s12942-017-0081-0.
- Buyuksalih, I., S. Bayburt, G. Buyuksalih, A. P. Baskaraca, H. Karim, and A. A. Rahman. 2017. ““3D Modelling and Visualization Based on the Unity Game Engine – Advantages and Challenges.” ISPRS Annals of the Photogrammetry, Remote Sensing and Spatial Information Sciences IV-4/W4: 161–166. doi:https://doi.org/10.5194/isprs-annals-IV-4-W4-161-2017.
- Carbonell-Carrera, C., A. J. Jaeger, and T. F. Shipley. 2018. “2D Cartography Training: Has the Time Come for a Paradigm Shift?” ISPRS International Journal of Geo-Information 7 (5): 1–13. doi:https://doi.org/10.3390/ijgi7050197.
- Chen, M., and H. Lin. 2018. “Virtual Geographic Environments (VGEs): Originating from or Beyond Virtual Reality (VR)?” International Journal of Digital Earth 11 (4): 329–333.
- Collinson, A. 1997. “Virtual Worlds.” The Cartographic Journal 34 (2): 117–124.
- Consumer Technology Association. 2020. “Definitions and Characteristics of Augmented and Virtual Reality Technologies (CTA-2069-A).” Report. Accessed July 7, 2021. https://shop.cta.tech/products/definitions-and-characteristics-of-augmented-and-virtual-reality-technologies.
- Cruz-Neira, C., D. J. Sandin, T. A. DeFanti, R. V. Kenyon, and J. C. Hart. 1992. “The CAVE: Audio Visual Experience Automatic Virtual Environment.” Communications of the ACM 35 (5): 64–72.
- Çöltekin, A., A. L. Griffin, A. Slingsby, A. C. Robinson, S. Christophe, V. Rautenbach, M. Chen, Ch Pettit, and A. Klippel. 2020a. “Geospatial Information Visualization and Extended Reality Displays.” In Manual of Digital Earth, edited by H. Guo, M. Goodchild, and A. Annoni, 229–277. Singapore: Springer.
- Çöltekin, A., I. Lochhead, M. Madden, S. Christophe, A. Devaux, C. Pettit, O. Lock, et al. 2020b. “Extended Reality in Spatial Sciences: A Review of Research Challenges and Future Directions.” International Journal of Geo-Information 9 (439): 1–29. doi:https://doi.org/10.3390/ijgi9070439.
- Çöltekin, A., I. Lokka, and M. Zahner. 2016. “On the Usability and Usefulness of 3D (Geo) Visualizations – A Focus on Virtual Reality Environments.” Proceedings of international archives of photogrammetry, remote sensing and spatial information sciences, Prague, 12–19.
- Duzmanska, N., P. Strojny, and A. Strojny. 2018. “Can Simulator Sickness be Avoided? A Review on Temporal Aspects of Simulator Sickness.” Frontiers in Psychology 9 (2132): 1–14. doi:https://doi.org/10.3389/fpsyg.2018.02132.
- Gagnon, K. T., B. J. Thomas, A. Munion, S. H. Creem-Regehr, E. H. Cashdan, and J. K. Stefanucci. 2018. “Not All Those Who Wander Are Lost: Spatial Exploration Patterns and Their Relationship to Gender and Spatial Memory.” Cognition 180: 108–117. doi:https://doi.org/10.1016/j.cognition.2018.06.020.
- Fuhrmann, S., O. Komogortsev, and D. Tamir. 2009. "Investigating Hologram-Based Route Planning" Transactions in GIS 13 (s1): 177–196. doi:https://doi.org/10.1111/j.1467-9671.2009.01158.x.
- Golledge, R. G., R. D. Jacobson, R. Kitchin, and M. Blades. 2000. “Cognitive Maps, Spatial Abilities and Human Wayfinding.” Geographical Review of Japan 73: 93–104.
- Halik, Ł. 2018. “Challenges in Converting Polish Topographic Database of Built-up Areas Into 3D Virtual Reality Geovisualization.” The Cartographic Journal 55 (4): 391–399. doi:https://doi.org/10.1080/00087041.2018.1541204.
- Heeter, C. 1992. “Being There: The Subjective Experience of Presence.” Presence: Teleoperators & Virtual Environments 1 (2): 262–271.
- Herbert, G., and X. Chen. 2015. “A Comparison of Usefulness of 2D and 3D Representations of Urban Planning.” Cartography and Geographic Information Science 42 (1): 22–32. doi:https://doi.org/10.1080/15230406.2014.987694.
- Hirtle, C. S. 2011. “The Effect of Activity on Relevance and Granularity for Navigation.” In Spatial Information Theory, edited by M. Egenhofer, N. Giudice, R. Moratz, and M. Worboys, Proceedings of the 10th International Conference COSIT 2011, Belfast, Maine, 12th–16th September. Berlin: Springer, 73–89.
- Hruby, F., R. Ressl, and G. de la Borbolla del Valle. 2019. “Geovisualization with Immersive Virtual Environments in Theory and Practice.” International Journal of Digital Earth 12 (2): 123–136. doi:https://doi.org/10.1080/17538947.2018.1501106.
- Hsu, H.-P., B.-W. Tsai, and C.-M. Chen. 2018. “Teaching Topographic Map Skills and Geomorphology Concepts with Google Earth in a One-Computer Classroom.” Journal of Geography 117 (1): 29–39. doi:https://doi.org/10.1080/00221341.2017.1346138.
- Indraprastha, A., and M. Shinozaki. 2009. “The Investigation on Using Unity3D Game Engine in Urban Design Study.” ITB Journal of Information and Communication Technology 3 (1): 1–18. doi:https://doi.org/10.5614/itbj.ict.2009.3.1.1.
- Ishikawa, T., and K. A. Kastens. 2005. “Why Some Students Have Trouble with Maps and Other Spatial Representations.” Journal of Geoscience Education 53 (2): 184–197.
- ISO. 2013. ISO 19157 Standard: Geographic Information – Data Quality. Geneva: Standard, International Organization for Standardization.
- Janses-Osmann, P., and G. Wiedenbauer. 2004. “The Representation of Landmarks and Router in Children and Adults: A Study in a Virtual Environment.” Journal of Environmental Psychology 24 (3): 347–357.
- Jones, K., R. Devillers, Y. Bédard, and O. Schroth. 2014. “Visualizing Perceived Spatial Data Quality of 3D Objects Within Virtual Globes.” International Journal of Digital Earth 7 (10): 771–788. doi:https://doi.org/10.1080/17538947.2013.783128.
- Kent, A. J., and A. Hopfstock. 2018. “Topographic Mapping: Past, Present and Future.” The Cartographic Journal 55 (4): 305–308.
- Kober, S. E., J. Kurzmann, and C. Neuper. 2012. “Cortical Correlate of Spatial Presence in 2D and 3D Interactive Virtual Reality: An EEG Study.” International Journal of Psychophysiology 83: 365–374. doi:https://doi.org/10.1016/j.ijpsycho.2011.12.003.
- Kolbe, T. H., G. Gröger, and L. Plümer. 2005. “CityGML: Interoperable Access to 3D City Models.” In Geo-information for Disaster Management, edited by P. van Oosterom, S. Zlatanova, and E. M. Fendel, 883–899. Berlin: Springer.
- Konecny, M. 2011. “Review: Cartography: Challenges and Potential in the Virtual Geographic Environments Era.” Annals of GIS 17: 135–146. doi:https://doi.org/10.1080/19475683.2011.602027.
- Kraak, M.-J. 2002. “Visual Exploration of Virtual Environments.” In Virtual Reality in Geography, edited by P. Fisher, and D. Unwin, 58–67. London: Taylor & Francis.
- Kutzner, T., K. Chaturvedi, and T. H. Kolbe. 2020. “CityGML 3.0: New Functions Open Up New Applications.” PFG – Journal of Photogrammetry, Remote Sensing and Geoinformation Science 88: 43–61. DOI:https://doi.org/10.1007/s41064-020-00095-z.
- Laksono, D., and T. Aditya. 2019. “Utilizing a Game Engine for Interactive 3D Topographic Data Visualization.” ISPRS International Journal of Geo-Information 8 (8): 361–378. doi:https://doi.org/10.3390/ijgi8080361.
- Liao, H., and W. Dong. 2017. “An Exploratory Study Investigating Gender Effects on Using 3D Maps for Spatial Orientation in Wayfinding.” International Journal of Geo-Information 6 (3): 1–19. doi:https://doi.org/10.3390/ijgi6030060.
- Lin, H., and J. Gong. 2001. “Exploring Virtual Geographic Environments.” Geographic Information Sciences 7: 1–7. doi:https://doi.org/10.1080/10824000109480550.
- Lokka, I. E., and A. Çöltekin. 2019. “Toward Optimizing the Design of Virtual Environments for Route Learning: Empirically Assessing the Effects of Changing Levels of Realism on Memory.” International Journal of Digital Earth 12 (2): 137–155. doi:https://doi.org/10.1080/17538947.2017.1349842.
- Lokka, I.-E., and A. Çöltekin. 2020. “Perspective Switch and Spatial Knowledge Acquisition: Effects of age, Mental Rotation Ability and Visuospatial Memory Capacity on Route Learning in Virtual Environments with Different Levels of Realism.” Cartography and Geographic Information Science 47 (1): 14–27. doi:https://doi.org/10.1080/15230406.2019.1595151.
- Lütjens, M., T. P. Kersten, B. Dorschel, and F. Tschirschwitz. 2019. “Virtual Reality in Cartography: Immersive 3D Visualization of the Arctic Clyde Inlet (Canada) Using Digital Elevation Models and Bathymetric Data.” Multimodal Technologies and Interaction 3 (1): 1–15. doi:https://doi.org/10.3390/mti3010009.
- McCauley, M., L. Hettinger, T. Sharkey, and J. Sinacori. 1990. “The Effects of Simulator Visual-Motion Asynchrony on Simulator Induced Sickness.” Proceedings of the flight simulation technologies conference and exhibit dayton, Ohio. doi:https://doi.org/10.2514/6.1990-3172.
- McGreevy, M. W. 1993. “Virtual Reality and Planetary Exploration.” In Virtual Reality: Applications and Explorations, edited by A. Wexelbrat, 163–198. Boston, MA: Academic Press Professional.
- Milgram, P., and F. Kishino. 1994. “Taxonomy of Mixed Reality Visual Displays.” IEICE Transactions on Information and Systems 77: 1321–1329.
- Min, B. C., S. C. Chung, Y. K. Min, and K. Sakamoto. 2004. “Psychophysiological Evaluation of Simulator Sickness Evoked by a Graphic Simulator.” Applied Ergonomics 35 (6): 549–556.
- Minton, J. 2014. “Real Geographies and Virtual Landscapes: Exploring the Influence on Place and Space on Mortality Lexis Surfaces Using Shaded Contour Maps.” Spatial and Spatio-Temporal Epidemiology 10: 49–66. doi:https://doi.org/10.1016/j.sste.2014.04.003.
- Montello, D. R. 2005. “Navigation.” In The Cambridge Handbook of Visuospatial Thinking, edited by P. Shah, and A. Miyake, 257–294. Cambridge: Cambridge University Press.
- Moore, K. 1999. “VRML and Java for Interactive 3D Cartography.” In Multimedia Cartography, edited by W. Cartwright, M. P. Peterson, and G. Gartner, 205–216. Berlin: Springer.
- Moss, J. D., and E. R. Muth. 2011. “Characteristics of Head-Mounted Displays and Their Effects on Simulator Sickness.” Human Factors 53: 308–319. doi:https://doi.org/10.1177/0018720811405196.
- Munion, A. K., J. K. Stefanucci, E. Rovira, P. Squire, and M. Hendricks. 2019. “Gender Differences in Spatial Navigation: Characterizing Wayfinding Behaviors.” Psychonomic Bulletin & Review 26: 1933–1940.
- Niedomysl, T., E. Elldér, A. Larsson, M. Thelin, and B. Jansund. 2013. "Learning Benefits of Using 2D Versus 3D Maps: Evidence from a Randomized Controlled Experiment." Journal of Geography 112 (3): 87–96. doi: https://doi.org/10.1080/00221341.2012.709876.
- Nuhn, E., W. Reinhardt, and B. Haske. 2012. “Generation of Landmarks from 3D City Models and OSM Data.” Proceedings of the AGILE 2012 international conference on geographic information science, Avignon, 24th–27th April, 365–369.
- Ohori, K. A., H. Ledoux, and J. Stoter. 2015. “An Evaluation and Classification of nD Topological Data Structures for the Representation of Objects in a Higher-Dimensional GIS.” International Journal of Geographical Information Science 29 (5): 825–849.
- Open Geospatial Consortium. 2012. “OGC City Geography Markup Language (CityGML) Encoding Standard 2.0.0.” Technical Report.
- Pajarola, R., T. Ohler, P. Stucki, K. Szabo, and P. Widmayery. 1998. “The Alps at your Fingertips: Virtual Reality and Geoinformation Systems.” Proceedings of the 14th international conference on data engineering, Orlando, FL, 23rd–27th February.
- Peddie, J. 2017. Augmented Reality: Where We Will All Live. Berlin: Springer.
- Pellegrino, J. W., D. L. Alderton, and V. J. Shute. 1984. “Understanding Spatial Ability.” Educational Psychologist 19 (4): 239–253. doi:https://doi.org/10.1080/00461528409529300.
- Popelka, S., and A. Brychtova. 2013. "Eye-Tracking Study on Different Perception of 2D and 3D Terrain Visualisation." The Cartographic Journal 50 (3) 240–246. doi.https://doi.org/10.1179/1743277413Y.0000000058.
- Rautenbach, V., S. Coetzee, and A. Çöltekin. 2016. “Investigating the Use of 3D Geovisualizations for Urban Design in Informal Settlement Upgrading in South Africa.” The International Archives of the Photogrammetry, Remote Sensing and Spatial Information Sciences XLI-B2, 23rd ISPRS Congress, Prague, Czech Republic, 12th–19th July.
- Rebenitsch, L., and C. Owen. 2016. “Review on Cybersickness in Applications and Visual Displays.” Virtual Reality 20: 101–125. doi:https://doi.org/10.1007/s10055-016-0285-9.
- Roth, R. E., A. Çöltekin, L. Delazari, H. F. Filho, A. Griffin, A. Hall, J. Korpi, et al. 2017. “User Studies in Cartography: Opportunities for Empirical Research on Interactive Maps and Visualizations.” International Journal of Cartography 3 (1): 61–89. doi:https://doi.org/10.1080/23729333.2017.1288534.
- Saredakis, D., A. Szpak, B. Birckhead, H. A. D. Keage, A. Rizzo, and T. Loetscher. 2020. “Factors Associated With Virtual Reality Sickness in Head-Mounted Displays: A Systematic Review and Meta-Analysis.” Frontiers in Human Neuroscience 14 (96): 1–17. doi:https://doi.org/10.3389/fnhum.2020.00096.
- Savage, D. M., E. N. Wiebe, and H. A. Devine. 2004. "Performance of 2D Versus 3D Topographic Representations for Different Task Types." Proceedings of the Human Factors and Ergonomics Society Annual Meeting 48 (16): 1793–1797. doi:https://doi.org/10.1177/154193120404801601.
- Schobesberger, D., and T. Patterson. 2008. “Evaluating the Effectiveness of 2D vs. 3D Trailhead Maps: A Map User Study Conducted At Zion National Park, United States.” The Bulletin of the Society of Cartographers 42 (1–2): 3–8.
- Semmo, A., M. Trapp, J. E. Kyprianidis, and J. Döllner. 2012. "Interactive Visualization of Generalized Virtual 3D City Models using Level-of-Abstraction Transitions." Computer Graphics Forum 31 (3/1): 885–894.
- Shu, Y., Y.-Z. Huang, S.-H. Chang, and M.-Y. Chen. 2018. “Do Virtual Reality Head-Mounted Displays Make a Difference? A Comparison of Presence and Self-Efficacy Between Head-Mounted Displays and Desktop Computer-Facilitated Virtual Environments.” Virtual Reality 23: 437–446. doi:https://doi.org/10.1007/s10055-018-0376-x.
- Shushan, Y., J. Portugali, and E. Blumenfeld-Lieberthal. 2016. “Using Virtual Reality Environments to Unveil the Imageability of the City in Homogenous and Heterogenous Environments.” Computers, Environment and Urban Systems 58: 29–38. doi:https://doi.org/10.1016/j.compenvurbsys.2016.02.008.
- Sinitski, E., A. A. Thompson, P. C. Godsell, J. L. N. Honey, and M. Besemann. 2018. “Postural Stability and Simulator Sickness After Walking on a Treadmill in a Virtual Environment with a Curved Display.” Displays 52: 1–7. doi:https://doi.org/10.1016/j.displa.2018.01.001.
- Slater, M., and S. A. Wilbur. 1997. “A Framework for Immersive Virtual Environments (FIVE): Speculations on the Role of Presence in Virtual Environments.” Presence: Teleoperators & Virtual Environments 6 (6): 603–616.
- Slocum, T. A., C. Blok, B. Jiang, A. Koussoulakou, D. R. Montello, S. Fuhrmann, and N. R. Hedley. 2001. “Cognitive and Usability Issues in Geovisualization” Cartography and Geographic Information Science 28 (1): 61–75. doi:https://doi.org/10.1559/15204001782173998.
- Snopková, D., H. Švedová, P. Kubíček, and Z. Stachoň. 2019. “Navigation in Indoor Environments: Does the Type of Visual Learning Stimulus Matter?” ISPRS International Journal of Geo-Information 8 (6): 251–226. doi:https://doi.org/10.3390/ijgi8060251.
- Sun, R., Y. J. Wu, and Q. Cai. 2019. “The Effect of a Virtual Reality Learning Environment on Learners’ Spatial Ability.” Virtual Reality 23: 385–398. doi:https://doi.org/10.1007/s10055-018-0355-2.
- Sutherland, I. E. 1965. “The Ultimate Display.” Proceedings of the Congress of the International Federation of Information Processing (IFIP) 2: 506–508. doi:https://doi.org/10.1109/MC.2005.274.
- Šašinka, Č, Z. Stachoň, M. Sedlák, J. Chmelík, L. Herman, P. Kubíček, A. Šašinková, et al. 2019. “Collaborative Immersive Virtual Environments for Education in Geography.” ISPRS International Journal of Geo-Information 3 (8): 1–25. doi:https://doi.org/10.3390/ijgi8010003.
- Takemiya, M., and T. Ishikawa. 2011. “I Can Tell by the Way You Use Your Walk: Real-Time Classification of Wayfinding Performance.” In Spatial Information Theory, edited by M. Egenhofer, N. Giudice, R. Moratz, and M.Worboys. Proceedings of the 10th international conference COSIT 2011, Belfast, MA, 12th–16th September. Berlin: Springer, 73–89.
- Taylor, D. R. F. 1991. “Conceptual Basis for Cartography: New Directions for the Information Era.” The Cartographic Journal 28 (2): 213–216.
- Uttal, D. H., N. G. Meadow, E. Tipton, L. L. Hand, A. R. Alden, C. Warren, and N. S. Newcombe. 2013. “The Malleability of Spatial Skills: A Meta-Analysis of Training Studies.” Psychological Bulletin 139 (2): 352–402. doi:https://doi.org/10.1037/a0028446.
- Vandenberg, S. G., and A. R. Kuse. 1978. “Mental Rotations, a Group Test of Three-Dimensional Spatial Visualization.” Perceptual and Motor Skills 47 (2): 599–604. doi:https://doi.org/10.2466/pms.1978.47.2.599.
- Wahyudi, H. B., F. Ramdani, and F. A. Bachtiar. 2020. "2D and 3D Geovisualization: Learning user Preferences in Landslide Vulnerability." Journal of Information Technology and Computer Science 5 (1): 75–85. doi:https://doi.org/10.25126/jitecs.202051167.
- Wielebski, Ł, and B. Medyńska-Gulij. 2019. “Graphically Supported Evaluation of Mapping Techniques Used in Presenting Spatial Accessibility.” Cartography and Geographic Information Science 46 (4): 311–333. doi:https://doi.org/10.1080/15230406.2018.1479311.
- Wilkening, J., and S. I. Fabrikant. 2013. “How Users Interact with a 3D geo-Browser Under Time Pressure.” Cartography and Geographic Information Science 40 (1): 40–52. doi:https://doi.org/10.1080/15230406.2013.762140.
- Wong, K., and C. Ellul. 2016. “Using Geometry-Based Metrics as Part of Fitness-for-Purpose Evaluations of 3D City Models.” ISPRS Annals of the Photogrammetry, Remote Sensing and Spatial Information Sciences IV IV-2/W1: 129–136.
- Zagata, K., J. Gulij, Ł Halik, and B. Medyńska-Gulij. 2021. “Mini-Map for Gamers Who Walk and Teleport in a Virtual Stronghold.” ISPRS International Journal of Geo-Information 10: 96–112. doi:https://doi.org/10.3390/ijgi10020096.
- Zhang, C., M. Chen, R. Li, C. Fang, and H. Lin. 2016. “What’s Going on About Geo-Process Modeling in Virtual Geographic Environments (VGEs).” Ecological Modelling 319: 147–154. doi:https://doi.org/10.1016/j.ecolmodel.2015.04.023.
- Zhang, S., and A. Moore. 2013. “The Usability of Online Geographic Virtual Reality for Urban Planning.” ISPRS International Archives of the Photogrammetry, Remote Sensing Spatial Information Sciences XL-2/W2: 145–150.