
 ?Mathematical formulae have been encoded as MathML and are displayed in this HTML version using MathJax in order to improve their display. Uncheck the box to turn MathJax off. This feature requires Javascript. Click on a formula to zoom.
ABSTRACT
Land subsidence can be observed with time-series of Interferometric Synthetic Aperture Radar (InSAR) data. However, existing approaches only reveal subsidence signals that are multi-scale mixed, which is not conducive to the systematic analysis of subsidence of different mechanisms. A deformation signal decomposition (DSD) method based on spectral analysis is used to decompose the deformation extracted by time-series InSAR into three classes of deformation signals. They refer to large-scale deformation related to geological settings, medium-scale deformation caused more by group excavation, and small-scale deformation along linear infrastructures. TerraSAR-X datasets for Shanghai spanning April 2013 to September 2020, and Sentinel-1A datasets spanning January 2016 to September 2020 are used in this study. The results were cross-verified between the TerraSAR-X and Sentinel-1A datasets, and validated against levelling measurements. Subsidence signals caused by different mechanisms were automatically decomposed, which facilitates a systematic analysis for targeted diagnosis of land subsidence signals. A detailed analysis was conducted jointly at three scales of surface displacement, geological conditions, major construction activities, and subsidence mechanisms. It indicated that construction activities were the leading cause of land subsidence, and suggests that local authorities that wish to mitigate surface subsidence may benefit from primarily considering this process.
1. Introduction
The metropolitan city of Shanghai, China is located on the delta of the Yangtze River, and built on soft layers of soil characterized by high water content, high compressibility, low permeability, and low shear strength (Shen et al. Citation2014). Consequently, Shanghai has been suffering severe land subsidence since the twentieth century, related to a history of over-withdrawal of groundwater and booms in urban construction (Xu et al. Citation2016; He et al. Citation2019). Uneven land subsidence poses a threat to further development of the city (Wu, Shen, and Yang Citation2017; Qin et al. Citation2017). For example, three people were lost in a sinkhole occurring in Guangzhou on December 1, 2019. Careful monitoring of land subsidence in the city facilitates an assessment of risk to prevent such tragedies, and ensure the city’s safety more generally.
Geodetic techniques for land subsidence monitoring such as Global Navigation Satellite System (GNSS) or levelling, are generally time-consuming, labour-intensive, and only operated on a few spots (Del Soldato et al. Citation2021). Routine levelling monitoring with one point per kilometre is conducted only in the central urban district and some key locations, as performing levelling or GNSS with a high enough monitoring density over the whole area of Shanghai is over budget. Compared with these approaches, Interferometric Synthetic Aperture Radar (InSAR) has advantages in large-scale deformation monitoring in terms of cost and efficiency as it does not require the installation of servicing of further equipment (Bamler and Hartl Citation1998; Massonnet and Feigl Citation1998; Massonnet et al. Citation1993; Zebker et al. Citation1994). However, when using the conventional InSAR technique of creating single interferograms between pairs of satellite acquisitions, atmospheric and orbital errors affect the accuracy and reliability of the results (Ferretti, Prati, and Rocca Citation2001). In contrast, the advanced time series InSAR methods use a series of SAR images covering the same extent at different dates to retrieve surface displacement and minimize the effects of atmospheric and orbital errors (Berardino et al. Citation2002; Ferretti, Prati, and Rocca Citation2001; Hooper et al. Citation2004). Time series InSAR is an efficient way to monitor surface deformation (Crosetto et al. Citation2016), and successful application cases include the monitoring of land deformation (Cigna et al. Citation2012; Li et al. Citation2016; Du et al. Citation2018), landslides (Dong et al. Citation2018; Li et al. Citation2020), mines (Wang et al. Citation2013), bridges (Qin et al. Citation2019), railways (Chang, Dollevoet, and Hanssen Citation2017), subway and highways (Perissin, Wang, and Lin Citation2012), and buildings (Ezquerro et al. Citation2020; Garcia et al. Citation2021).
Many studies using time series InSAR technique have been conducted to monitor and analyse ground subsidence in Shanghai (Jiang et al. Citation2016; Yang et al. Citation2018; Zhao et al. Citation2015; Yu et al. Citation2020; Perissin, Wang, and Lin Citation2012). The majority of the previous studies focused on a small part of the Shanghai area like infrastructures (Jiang et al. Citation2016; Perissin, Wang, and Lin Citation2012; Qin et al. Citation2017), coastal area (Zhao et al. Citation2019; Yang et al. Citation2018), and the Chongming area (Yu et al. Citation2020). Few of these studies conducted a systematic deformation analysis of the whole area of Shanghai, nor did they try to classify different scales of land subsidence for further targeted research. In these previous studies on land subsidence monitoring, the deformation with different scales and mechanisms was generally fused. It is often difficult to analyse the reasons behind the subsidence signals. For example, when linear infrastructure deformation and the large-scale geologically-related land subsidence are mixed. In this case, it is difficult to identify each specific factor and interpret a precise deformation mechanism since linear infrastructure deformation is correlated to not only large-scale regional land subsidence but also postconstruction consolidation and cyclic loading of running vehicles. Therefore, automatic decomposing of different scales of deformation and systematic and tailored analysis on different scales of deformation in Shanghai are conducive to settlement management and mitigation.
This study used X- and C- band SAR data stacks and employed time series InSAR analyses, along with deformation signal decomposition (DSD), to map different components of deformation over Shanghai. Based on the decomposed three scales of deformation over Shanghai, the analysis on different scales of surface deformation with their geological settings and subsidence mechanisms were carried out. The study can also provide a reference for similar application scenes in other cities.
2. Study area and datasets
2.1. Shanghai
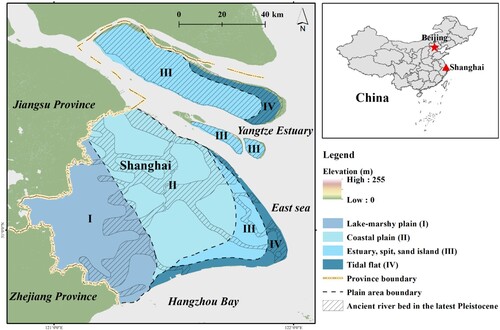
Shanghai is located on the Yangtze River Delta with a total land area of 6340 km2. It is one of the largest industrial and economic cities in China. It is underlain by loose Quaternary sediments with a thickness of 200 ∼ 300 m that were deposited during the Pleistocene and Holocene periods (Shen et al. Citation2014; Shen and Xu Citation2011). The Shanghai area can be divided into four geomorphological units: a lake-marshy plain; a coastal plain; an estuary, spit, sand island; and a tidal flat, as shown in (Wu et al. Citation2015). Many fossil river courses developed in the Quaternary period, and the ancient river channel beds since the Late Pleistocene have had substantial effects on construction. The ground elevation in Shanghai is shallow, only 2.5 ∼ 4.0 m. The thick layer of soft soil is easy to compress and deform, which provides an intrinsic factor for land subsidence growth and long-term development.
Figure 1. The location of Shanghai and geological settings.
Land subsidence in Shanghai was first recorded in 1921 (Chai et al. Citation2004; Xue et al. Citation2005; Xu et al. Citation2008). Due to groundwater overexploitation from 1921 to 1965, the maximum cumulative land subsidence in urbanized areas reached 2.6 m (He et al. Citation2019). From 1963, measures to control groundwater withdrawal began to be implemented, and in 1966, artificial recharge was carried out in the urban area. At the end of the 1960s, ground deformation in urban areas was generally controlled (Ye et al. Citation2016; Wu et al. Citation2019). However, since the 1980s, the booming urban construction activities in Shanghai, especially the rapid exploitation of underground space, have impacted land subsidence (Shen and Xu Citation2011; Xu et al. Citation2016).
Urban construction has developed rapidly, including reconstruction of old districts, construction of new residential areas, a large number of intensive high-rise and super high-rise buildings, and exploitation of underground space. By the end of 2019, the construction area of houses with more than eight stories has increased from 9.59 × 10⁶ m2 in 1990 to 4.96 × 10⁸ m2. The shallow soft soil layer settlement caused by urban construction in some regions accounts for a considerable proportion of the total settlement. For instance, after completing the three high-rise buildings in the Lujiazui area, the surrounding area within 100 m subsided 23.1, 26.4, and 63.3 mm on average from April 2000 to April 2001 (Zhang and Wei Citation2002). Under these circumstances, the impact of engineering construction activities, especially the deformation of shallow soft soil layers induced by the dewatering of foundation pits, has continued to increase (Xu et al. Citation2012). Geologists pointed out that engineering construction activities have become the leading cause of land subsidence during the current construction boom (Yan and Yang Citation2020).
Meanwhile, during the development of urbanization, more and more linear infrastructures such as railways and highways have been built, forming a relatively complete transportation network. Land subsidence has characteristics of significant unevenness in the region. When the long-distance, high-sensitivity linear infrastructure passes through the ground settlement area, it will suffer differential settlement, threatening its operational safety. With the development and accumulation of land deformation, the threat will increase (He et al., Citation2019). At the same time, due to static loads, dynamic loads, and structural construction issues, deformation will occur along the lines that these linear infrastructure projects follow. The loss of land elevation caused by land deformation threatens the safety and sustainable development of the city for a very long period. The prevention and mitigation of natural and anthropogenic hazards related to subsidence can only be achieved by long-term deformation monitoring.
2.2. Datasets
154 X-band TerraSAR-X (TSX) images acquired from April 2013 to September 2020 and 124 C-band Sentinel-1A (S1A) images between January 2016 to September 2020 formed two complementary SAR datasets, and were used to reveal recent land subsidence over Shanghai. The capacity and performance of these two types of satellite images to observe subsidence have already been validated in several previous studies (Strozzi, Teatini, and Tosi Citation2009; Li et al. Citation2016; Du et al. Citation2018; Ezquerro et al. Citation2020). The spatial coverage of the two datasets is shown in , and the detailed parameters are summarized in . The temporal coverage of the TSX images is longer than that of the S1A images, while the limited spatial extent of the TSX images, covering most of the central downtowns and part of the suburbs, is still not enough to cover the whole city of Shanghai. The S1A images have advantage in the spatial coverage to cover the whole of Shanghai.
Figure 2. The coverage of TSX and S1A images, and the location of the levelling points. The blue rectangle in the upper left corner is the frame of the S1A images. The red and green rectangles represent the two frames of the TSX images (i.e. the west and the east). The base map is the SRTM DEM, and the red-coloured districts are central urban districts, while the grey/white areas are suburban districts.
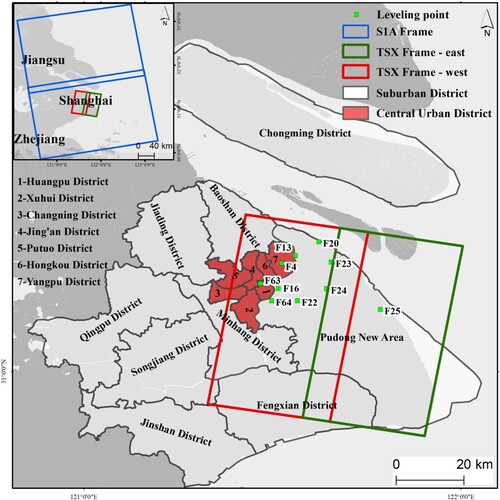
Table 1. Basic parameters of the X- and C-band SAR datasets used in this study.
External DEM data was provided by the National Aeronautics and Space Administration (NASA) from Shuttle Radar Topography Mission (SRTM), with a spatial resolution of 90 m. Additionally, in-situ measurements of ten levelling benchmarks, whose positions are shown in , were used in this paper. The levelling data was acquired once a month from April 2013 to September 2020 by the Shanghai Institute of Geological Survey (SIGS) and was processed using a least squares estimation.
3. Methodology
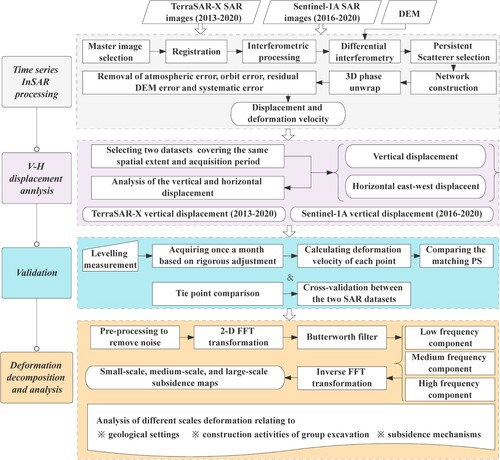
To evaluate different scales of deformation in Shanghai, we exploit deformation decomposition on time series InSAR results of the X- and C- band SAR datasets. The method mainly consists of four parts: time series InSAR processing, vertical and horizontal displacement analysis, validation, and deformation decomposition. The overall flowchart of the data processing is shown in .
Figure 3. The flowchart of the data processing.
3.1. Time series InSAR method
In this study, the time series InSAR method with Persistent Scatterer (PS) (Ferretti, Prati, and Rocca Citation2001) was employed to derive original deformation measurements carried out by StaMPS (Hooper et al. Citation2012). The steps in the processing include master image selection, registration, differential interferograms generation, PS selection, network construction, phase unwrapping, and removal of error phases.
Using dual-method of amplitude dispersion (0.3 used for the TSX and 0.4 for the S1A) and phase stability dramatically improves the density and accuracy of target points. Based on the extracted points, a Delaunay triangulation is established, and three-dimensional phase unwrapping is carried out. At last, atmospheric and orbital errors of each point are estimated and removed by the spatiotemporal filtering method, obtaining the final deformation phase and surface elevation valuation. When a linear deformation model is used, the deformation phase is
(1)
(1) where
is linear deformation rate in the satellite line-of-sight (LOS) direction;
is wavelength; and
is the imaging interval of SAR image sets. It is worth remarking that the estimated deformation rate from the above equation is in the satellite LOS direction.
3.2. Vertical and horizontal displacements
Aiming to understand whether horizontal displacement is negligible or not in Shanghai, we calculated vertical and horizontal displacements. Here the north–south displacement was ignored because of the insensitivity of satellite observations to the settlement in the north–south direction (Hu et al. Citation2014). Vertical and horizontal east–west displacements can be obtained by intercepting the two datasets covering the same spatial extent and acquisition period based on the equation (2).
(2)
(2) where
is the deformation observed along the LOS direction;
is the east–west horizontal deformation;
is the vertical deformation;
is the heading angle; and
is the incidence angle.
The study’s next step can be further carried out based on the vertical and horizontal displacement analysis. Vertical settlement dominated the deformation field in Shanghai significantly according to the following analysis of vertical and horizontal displacement and previous studies (Pepe et al. Citation2016; Zhao et al. Citation2019). Hence, all the SAR LOS measurements are projected into the vertical direction according to incidence angles :
(3)
(3)
3.3. Validation
The results were cross-verified between the TerraSAR-X and Sentinel-1A datasets based on tie point comparison, and validated against levelling measurements. Levelling measurements were acquired once a month by the SIGS. For each time of acquisitions, the measurement values on each point were obtained by rigorous adjustment of the level monitoring network. Each levelling point has a time series displacement, with a calculated deformation velocity through the least square. The validation was then carried out on each point by finding the matching PS points within a distance of 100 m.
3.4. Settlement decomposition
Based on different spatial frequencies of deformation distribution, we aim to separate different scales (spatial wavelength) of deformation to conduct tailored analysis and diagnosis. The input of the settlement decomposition process is the deformation velocity map derived by the technique described in the above, and the outputs are three different scales of deformation component based on assigned spatial frequency thresholds defined by users.
Data pre-processing needs to be done at the first step before the input. It is generally assumed that the land subsidence is continuous in space in a large or small area, even though some sudden settlements. Thus, the single scattered settlement in the deformation velocity map that looks like pepper and salt can be reckoned unreasonable and be regarded as noise signals to remove. We choose a two-dimensional median filter to ensure that high-frequency signals that are likely to be noise are reduced as much as possible.
Then we perform a two-dimensional Fourier transform on the input of velocity map to get the frequency spectrum distribution map of the velocity. The analysis of the frequency spectrum and spatial wavelength of the velocity map contributes to the next step of the decomposition threshold selection (Solano-Rojas et al. Citation2020). Based on the assigned frequency threshold, the map will be separated into three-component maps representing low frequency, medium frequency, and high frequency by the Butterworth filter (Gonzalez Citation2018). Next, the three-component maps will be inverse Fourier transform to back to spatial filed. The outputs stand for three spatial scales of land subsidence to be analysed more systematically and targeted. Here we classified deformation signals into long-wavelength larger than 1000 m, medium one between 50 and 1000 m, and small one shorter than 50 m.
The transfer functions of the Butterworth filter are defined as (Gonzalez Citation2018):
(4)
(4)
(5)
(5)
(6)
(6)
Where represents filter;
,
,
stand for the cut-off frequency of low, high and intermediate frequencies respectively;
is bandwidth;
is the order of Butterworth filter; and
is the distance between any point
and the frequency centre.
In this manuscript, is set to 2. The inverse of frequency
equivalent to wavelength, and different wavelength signals mean different scales of deformation in the city. As for cut-off frequency,
is set to 0.001, and
is set to 0.02. Because the third filter can be seen as the synergy result of low and high filters, in the actual calculation, values of equation (6) can be obtained by.
(7)
(7) Once we get the different scales of deformation, we can carry out more systematic and goal-directed analysis relating to geological settings, construction activities of group excavation, and subsidence mechanisms, which is more conducive to the management and control of land subsidence.
4. Results and validation
The results consist of the analysis of vertical and horizontal displacements from 2016 to 2020, the original vertical deformation velocity maps retrieved by the two SAR data stacks, and the three different scales deformation derived by the DSD method. At the same time, the InSAR monitoring results were cross-compared between the two S1A and TSX datasets. Moreover, with levelling measurements, a comparison between InSAR results and levelling points was conducted to verify the reliability of the InSAR monitoring results.
4.1. Deformation velocity map
Firstly, the vertical and horizontal displacements derived by the approach in section 3.2 were analysed. Selecting the two datasets of the same acquisition period and spatial extent, we obtained the vertical and horizontal east–west displacements from 2016 to 2020, shown in . Negative values of the velocity with red colour represent subsidence, while positive values coloured blue indicate uplift. The red triangle represents the reference point. Compared with the vertical displacement in (b), the horizontal east–west displacement in (a) is insignificant, with velocity values between −2 mm/y and 2 mm/y. Almost no deformation areas can be found in the horizontal deformation map. While in (b), the deformation velocities range from −10 mm/y and 5 mm/y, and some deformation areas in Minhang District, Fengxian District, and Pudong New Area are evident. The value of land subsidence in the horizontal direction of Shanghai is obviously smaller than that in the vertical direction. Combining previous studies (Pepe et al. Citation2016; Zhao et al. Citation2019), it can be deemed that vertical settlement dominated the deformation field in Shanghai.
Figure 4. Deformation velocity map from 2016 to 2020 in (a) east-west direction, and (b) vertical direction. The red triangle represents the reference point.
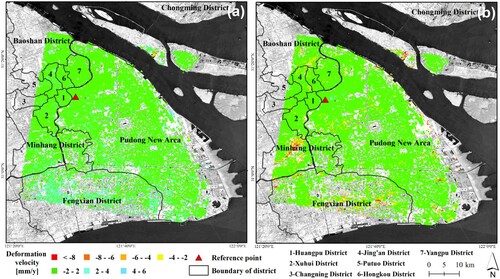
Owing to the insignificant horizontal displacement in Shanghai, we obtained the vertical deformation velocity maps from the two data stacks, the TSX images from April 2013 to September 2020 and the S1A images from January 2016 to September 2020, shown in . Same as , the red colour indicates subsidence, while the blue colour represents uplift mainly caused by the control of exploitation of groundwater and groundwater recharge measures (He et al. Citation2019). The red triangle represents the reference point. The data acquisition periods for these two datasets are different. The extent of the TSX images is relatively small, not enough to cover the whole city of Shanghai, while most of the central downtowns and part of the suburbs are all included. Due to the settlement in Shanghai being slow and long-lasting, both vertical deformation velocity maps from the TSX and S1A datasets present similar spatial deformation patterns as follows despite these differences.
Figure 5. Vertical deformation velocity map (a) from the TSX dataset from 2013 to 2020 and (b) from the S1A dataset from 2016 to 2020. The red triangle represents the reference point.
In (a), most areas in the observation frame are stable, with the velocity between −2 mm/y and 2 mm/y. It shows that under the effective control of surface settlement in recent years, the land deformation in Shanghai has been significantly mitigated, and there is a tendency to maintain stability (Ye et al. Citation2016). The efforts mainly include starting to control groundwater withdrawal in 1964, along with artificial recharge, and starting to significantly reduce groundwater withdrawal from the fourth confined aquifer in 1997 over Shanghai. Considering the time coverage of TSX is long to eight years, monitoring points in many areas are missing, such as Disneyland in Pudong New Area, which is linked to the enormous changes on the ground surface. Regardless of this impact, small areas with the rate of −4 mm/y–−8 mm/y are distributed alone in the surrounding suburban areas, which are part of Fengxian District, part of Minhang District, part of Baoshan District, and east coastal zone of Pudong New Area. Their respective triggering factors are different, but they are generally associated with Shanghai’s typical soft soil foundations and human activities.
In (b), the similar deformation distribution pattern derived by the S1A dataset from January 2016 to September 2020 is presented. Like the result retrieved by TSX, most areas in (b) represent a stable trend with velocity in −2 mm/y–2 mm/y. While different from long-time TSX, S1A results compensate for the lack of monitoring points in some areas of the TSX result due to the enormous changes on the ground, such as Disneyland opened in 2016 in Pudong New Area. However, there is a noticeable difference in point density between downtown areas and suburban areas. In other words, downtown areas have denser monitoring points than suburban areas. Only part of areas with the velocity in −4 mm/y–−8 mm/y are distributed in the surrounding areas, like Songjiang District, Chongming District, Jinshan District, Minhang District, which are missing in the TSX result, and part of Minhang District, the east coastal zone of Pudong New Area. Moreover, some areas show an uplift trend, which is related to that Shanghai began to control groundwater exploitation and carried out groundwater recharge measures in recent years.
The analysis above is conventional and blended as conducted in many previous studies. Based on the preliminary investigation, we can initially locate some subsidence risks, but specifically targeted and systematic analysis requires further classification and extraction, seen in Section 5.
4.2. Comparison between the two datasets
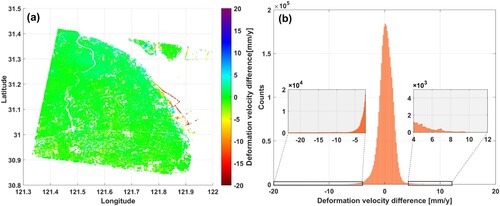
Considering that the coverage of the TSX dataset is smaller, we clipped the range of the S1A to that is the same as the TSX. The comparison was carried out on the tie points depending on their positions. The differences of the vertical velocities from the two SAR datasets were calculated on each pair of tie points. The distribution and histogram of differences between these two monitoring results are shown in . The comparison results show that even though the two data sets’ period, resolution, orbit, and wavelength are not the same, the agreement between the S1A and TSX results is good in most areas. It is worth noting that the difference of the velocity on the coastal dyke in the east is evident with the value above −10 mm/y, which is caused by the different detectable deformation sizes of the two datasets in such severely deformed places (Zhao et al. Citation2019). For X-band TSX data, the settlement on the coastal line may exceed the detectable deformation level of the SAR data. Ultimately, the mean difference between S1A and TSX is −0.86 mm/y, and the standard deviation is 3.14 mm/y. The conclusion can be drawn that the consistency between the velocity maps from S1A and TSX datasets in this study is high in most areas.
Figure 6. Distribution and histogram of differences of deformation velocity unveiled by the S1A and TSX datasets.
4.3. Validation between InSAR and levelling measurement
Further validation of the derived deformation velocity between two InSAR measurements and ten Levelling points was conducted. The position of the levelling points is illustrated in . Aiming at matching levelling measurements and InSAR retrieved results, we chose PS points around levelling benchmarks within the distance of 100 m. Here we supposed that the deformation among these points is slow and linear. The deformation velocity of ten measures, respectively, with levelling (blue point), S1A datasets (orange point), and TSX (red point) is shown in . Moreover, the accumulative displacement curves of three levelling points as the representative are drawn in , in which the legend is the same as .
Figure 7. Deformation velocity between InSAR and levelling benchmarks.
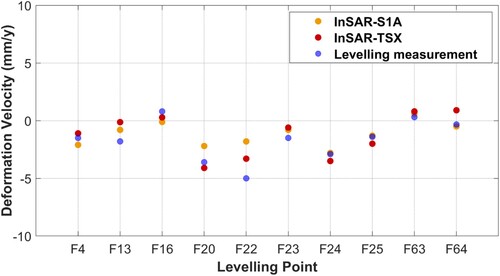
Figure 8. Displacement comparison between InSAR and levelling benchmarks. (a) F4 (b) F16 (c) F24.
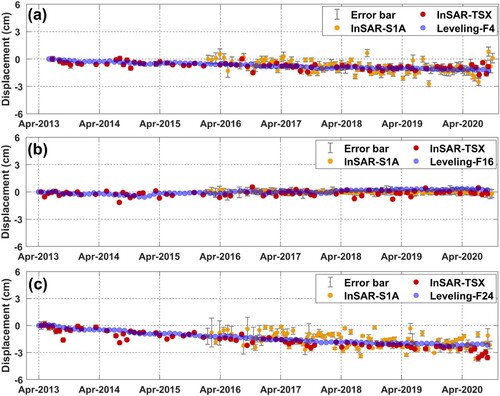
In terms of deformation velocity, the mean absolute error of the S1A is 1.01 mm/y, and the standard deviation is 1.03 mm/y. For TSX, the average error is 1.05 mm/y, and the standard deviation is 0.79 mm/y. From , the differences between InSAR and levelling points are minor except for the benchmark F24. The time series of the three measurements also show a good consistency in the trend even though the results of S1A are relatively more fluctuant.
4.4. Different scales of land subsidence in Shanghai
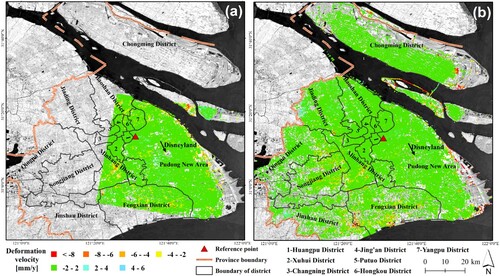
Three different wavelengths of land subsidence in Shanghai calculated on the above vertical displacement maps are obtained by the DSD method clarified in Section 3.4. They refer to the large-scale deformation related to geological settings, medium-scale one caused more by group excavation, and small-scale deformation distributed along the linear infrastructure.
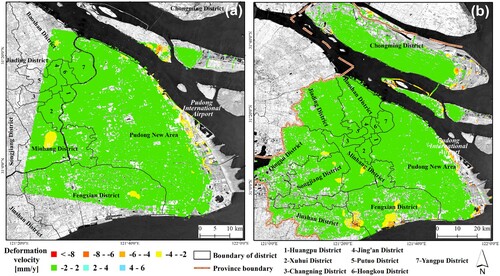
For large-scale deformation in the city, the result of the TSX dataset is illustrated in (a). During the year 2013–2020, there was fewer large-scale deformation in Shanghai, according to the TSX InSAR monitoring observation. Typical settlement areas are located in the middle part of Minhang District, part of Fengxian District, and areas of Pudong International Airport. Besides, the result of the S1A dataset is shown in (b). During 2016–2020, there was also fewer large-scale settlement over the whole area of Shanghai, whose distribution was similar to the result of the TSX dataset, except for very few regions. We can find that large-scale deformation in 2016–2020 calculated by S1A is mainly located on several areas. They include the middle of Minhang District, the southern part of Fengxian District, the boundary of Jinshan District and Fengxian District, the eastern of Songjiang District, the coastal area of Pudong New Area, and the east part of Chongming District. The same areas detected by the two datasets consist of Pudong International Airport and Minhang District. Pudong International Airport area with InSAR monitoring observation has been discussed in the previous paper that stated deformation patterns in Pudong International Airport area are associated with the underlying geological conditions (Jiang et al. Citation2016). We select the other subsided area in the results of the two datasets, Minhang District, to conduct a detailed analysis of the deformation (see Section 5.1).
Figure 9. The large-scale deformation map of (a) TSX from 2013 to 2020 and (b) S1A from 2016 to 2020.
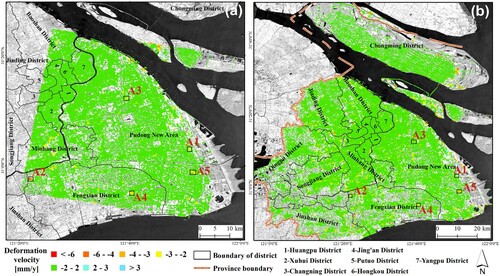
The medium-scale subsidence result of the TSX dataset is illustrated in (a), and the S1A dataset is in (b). The two results’ medium-scale subsidence areas are distributed more in the peripheral areas around central urban districts. In the central urban districts, there are few detected deformation areas. The extent of the detected medium-scale subsidence is usually up to 1 km2. The small yellow blocks in with a velocity around −3 mm/y represent the medium-scale deformation, such as the middle east of Pudong New Area and Minhang District. For these detected zones, more detailed monitoring can be realized by on-site measurements, and corresponding prevention measures can be made then. We choose cases A1 ∼ A5 in to explain the medium-scale deformation in the city that is more related to urban construction activities (see Section 5.2).
Figure 10. The medium-scale deformation distribution of (a) TSX from 2013 to 2020, (b) S1A from 2016 to 2020.
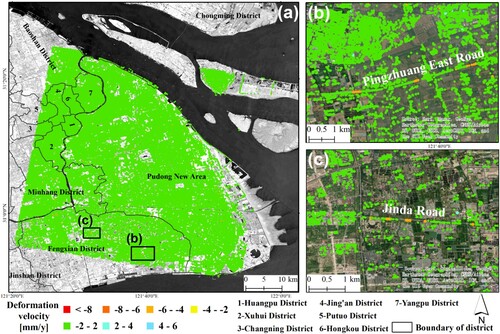
Considering that the resolution of the S1A is not high enough for the fine monitoring of small-scale deformation along linear objects in this study, we analysed the result of the long-term high-resolution TSX dataset observation on the small-scale deformation only. The result is shown in . Through decomposition, the high spatial frequency component of the TSX dataset from April 2013 to September 2020 is fewer than the other two spatial frequency components. Among them, part of Pingzhuang East Road in the eastern direction of Minhang District and Jinda Road in the middle of Minhang District were affected by the small-scale subsidence.
Figure 11. The small-scale deformation along linear infrastructure by TSX from 2013 to 2020.
5. Discussion
In Section 4.1, original deformation maps where different scales of deformation mix together were illustrated briefly. However, systematic analysis of different scales of deformation with tailored diagnosis on various influencing factors remains difficult. Using the results in Section 4.4, further study with its mechanisms can be realized.
5.1. Large-scale deformation
Large-scale deformation, in general, is related to the geological environment and large-scale, large-volume withdrawal of groundwater based on the research of land subsidence in Shanghai (Xu et al. Citation2016). In recent years, groundwater extraction has been controlled remarkably in Shanghai, and groundwater recharge measures have been carried out correspondingly (Shi et al. Citation2016). Thus, we consider the geological condition more in this study. In terms of geological features, most of the areas of Shanghai are located in the coastal plain region, which is a typical soft soil area. Consequently, its inherent soft nature provides a method for the growth and development of ground deformation geohazard.
For large-scale deformation in the city, we focus on the deformation area in Minhang District according to the result in Section 4.3. The distribution of the Ancient River Course (ARC) in the latest Pleistocene (Shi Citation2011), along with the decomposed deformation velocity distribution, is shown in . The cutting depth of the ARC in the latest Pleistocene is considerable, between 10 and 30 m, and the sediments are more complicated, which has a significant impact on engineering construction in Shanghai. As for engineering geological settings of the ARC in the latest Pleistocene, the foundation soil sequence table is shown in , in which the soil layers in bold are the prominent deposition of the ARC. The layer ⑤3 (Gray – brown-grey clay) is distributed in the ARC area all over. For its physical characteristic, the moisture content is usually between 28.3% ∼ 38.8%. The void ratio is 0.77 ∼ 1.10. The cohesion is 9.8 ∼ 25.4. The coefficient of compressibility is 0.26 ∼ 0.58 MPa−1. The modulus of compressibility is 5.10 ∼ 6.68 MPa. From these indexes, the soil of layer ⑤3 is uneven, which easily causes uneven settlement of buildings with larger loads. Moreover, we can find that the hard soil layer ⑥ (dark-green – brown-yellow clay) is missing, and layer ⑦ (grass-yellow – grey silt, sand) is cut, which is usually the bearing stratum of the pile foundation. The pile foundation conditions in the ARC areas become complex and changeable. From , we can see that the same deformation area of the two datasets in Minhang District locates on the part of the ARC, and the hydrogeological profile of two lines, 1-1’ and 2-2’, are shown in below.
Figure 12. The decomposed velocity of the two datasets overlapped and distribution of the Ancient River Bed in the latest Pleistocene in Minhang District, and a mark of line 1-1’ and 2-2’.
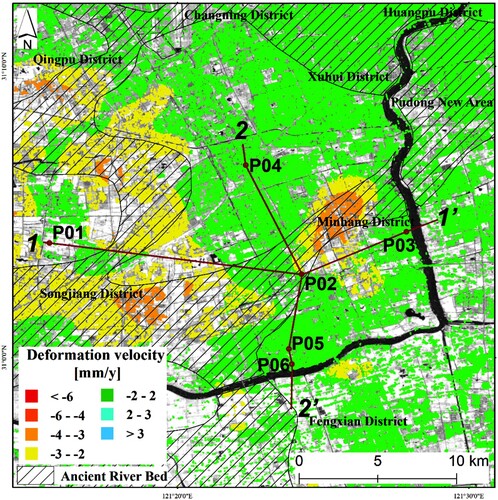
Figure 13. Deformation velocity and hydrogeological settings along profiles of lines (a) 1-1’ (b) 2-2’. The light grey background of velocity represents the distribution of ARC.
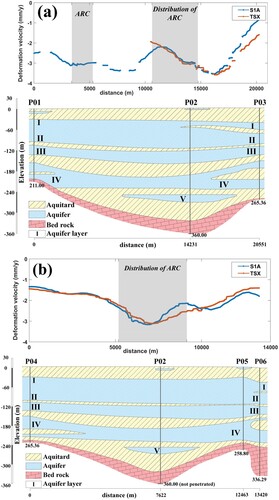
Table 2. Engineering geological foundation soil sequence table in the ARC area.
The profile of deformation velocity by the TSX and S1A datasets and corresponding hydrogeological settings along the line marked 1-1’ are presented in (a). The line labelled 2-2’ is shown in (b). The deformation velocities derived by the two datasets display the same trend in both profiles, and the spatial pattern of velocity profiles match the hydrogeological curves at the same position. It is because the compactness of the soil layer correlates with the thickness of the aquifer and aquitard.
Besides, the intersection point P02 is located in a deformation-prone position combined with the two profiles. The Bedrock is deeper than its nearby areas, and it has more silt, sand soil layers than other areas. Deeper Bedrock and more silt, sand soil layers create a natural condition to drainage consolidation. Coupled with the impact of the ARC from an engineering geological perspective, relatively large-scale deformation is prone to occur. Locating to the geological settings, we can take the tailored prevention measures more effectively.
5.2. Medium-scale deformation
Differing from the large-scale deformation, the medium-scale deformation in Shanghai is more related to major construction activities that are often accompanied by displacements in a relatively small area up to a square kilometre. In recent years, numerous engineering constructions have become a significant factor affecting the development of land subsidence, especially in the suburbs, which warrants further investigation (Xu et al. Citation2016). It mainly has a significant impact on the shallow soft soil layer. The surface subsidence of the construction is caused primarily by the early dewatering of the foundation pit and the various later loads of urban buildings, activities, and infrastructures. In dewatering of the foundation pit, the pore water stress is dissipated with the water in the pores of the soil discharging. The effective stress of the soil will increase, resulting in the consolidation and compression of the soil layer, which is reflected as ground settlement or deformation on a macroscale. It is why the formation of the relatively small ground subsidence funnel is related to nearby engineering activities.
Urban construction activities mainly include new construction, reconstruction, continued construction, and expansion. For new construction and reconstruction, which will lead to significant changes on the ground surface, the monitoring results often lack enough points exactly on the construction area. Instead, it may cause subsidence in the relatively small nearby areas. While for expansion construction, especially some underground activities, a medium-scale deformation will be detected in the land surface.
shows several typical medium-scale deformation areas detected by the TSX images from 2013 to 2020 labelled A1 ∼ A5 in the first column. Each row corresponds to historical optical images, reflecting the occurrence of urban construction activities. Their geographic position is already illustrated in . The length of these medium-scale deformation areas is generally several hundred metres to one kilometre.
Figure 14. Cases of medium-scale deformation by the TSX images from 2013 to 2020 and their historical construction activities. The optical images are from Google Earth.
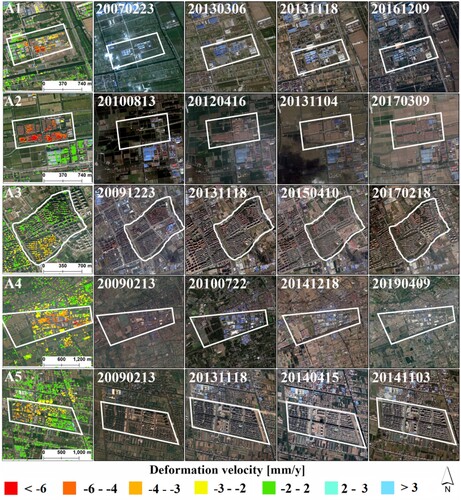
For the areas A1, A2, and A4, the group of buildings had just been constructed before 2013. The post-construction deformation was in-progress during the observation period. Besides, these areas were also affected by the surrounding construction activities after 2013 revealed by the optical images. While the surrounding areas with construction from 2013 could not show observation points due to the surface change and low coherence. For areas A3 and A5, the deformation velocity values are smaller than A1, A2, and A4. According to the optical images, the deformation signals in these two areas are mainly affected by the surrounding urban construction. The settlement in these areas, therefore, is relatively slight. In total, they illustrate that the medium-scale deformation is mainly correlated with the construction activities nearby or at the scene.
Moreover, we collected information on major construction projects during the early stage of data observation, posted on the DataShanghai website. shows the frequency of major construction activities in each district and corresponding detected deformation in terms of the number of deformed areas and percentage of deformation points. Due to the limited coverage of TSX data, we only plot the statistic results of S1A in each district except for Chongming District and Pudong New Area. Note that the construction information in Chongming District is lacking. For the special semi-urban and semi-suburban area, Pudong New Area, construction activities are mainly located in the semi-suburban area. It is the reason why the number of deformation areas is large but percentage of deformation points is not so high in the Pudong New Area, which is not plotted in .
Figure 15. The plot of the monitoring results of the S1A dataset and related construction activities in each district. Districts with a light pink background are central urban districts.
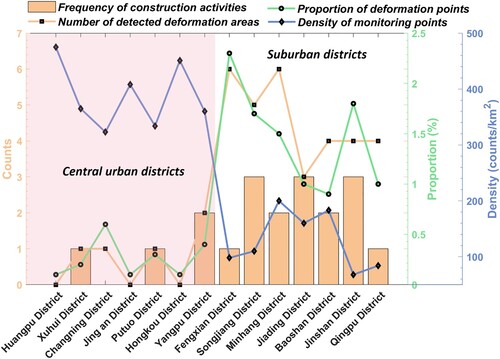
In , the orange bar is the frequency of construction activities, and the orange line represents the number of detected settlement areas. The green polyline represents the percentage of deformation points in all extracted points in each district, and the light blue line is the density of detected monitoring points, that is, persistent scatterers. The districts masked in light pink are the central urban areas. We can find that the major construction activities in the central urban areas are few, and the number of detected deformation areas is also small. In contrast, the suburb areas were experiencing development, the frequency of engineering activities and detected deformation areas is high, and the proportion of the settlement points. Meanwhile, an apparent inverse relationship between the density of monitoring points and the frequency of construction activities is shown in the diagram. On the other hand, there is a clear positive correlation between the frequency of construction activities and the detected deformation in the number of areas and proportion of points. The diagram further illustrates the impact of engineering activities on land subsidence.
Taking a medium-scale deformation as an example shown in , a building in the middle area of Xinhua Hospital was built in 2012 and the reconstruction of the underground garage of Xinhua Hospital from 2016 to 2018 caused deformation on the ground. The construction project affected the Xinhua Hospital itself and caused slight deformation in the western building area next to the Hospital. We chose three parts of detected points, P1, P2, and P3, which gradually moved away from Xinhua Hospital, to identify the influence of the construction on the medium area. The accumulative displacements of P1, P2, and P3 show that the deformation of P1 is most severe, and P3 is influenced slightly. Moreover, the velocity fitting values in revealed detailed temporal evolutions of the displacements. Two evident acceleration periods (from 2013 to 2015 and from 2018) are indicated by the red arrows. They corresponded to the construction activities in the area. Note that the accuracy of the ends of the velocity fitting values is greatly affected by the fitting process. The buildings to the east of Xinhua Hospital were almost unaffected by the construction activity.
Figure 16. Xinhua Hospital medium-scale deformation distribution and the accumulative displacements of monitoring points.
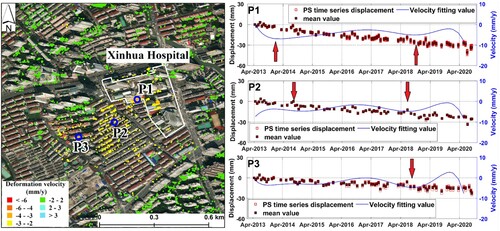
Based on the result of the detected deformation, the medium-scale deformation can be located for the general survey on the whole area of the city.
5.3. Linear infrastructure deformation
Small-scale deformation, which has a higher spatial frequency than medium-scale deformation, generally is related to linear infrastructure deformation. It is well known that uneven land deformation along the lines has an awful effect on the safety of the linear infrastructures. While sometimes due to static loads, dynamic loads, and structural construction issues, infrastructures may produce deformation, and then the deformation spreads to the surrounding small areas. Thus, the infrastructure deformation and surrounding subsidence mix together, leading to an unclear deformation mechanism. In this paper, based on spatial frequency, we selected infrastructure-controlled deformation on the city-scale monitoring measurement, on which targeted reinforcement measures for the infrastructure itself can be implemented.
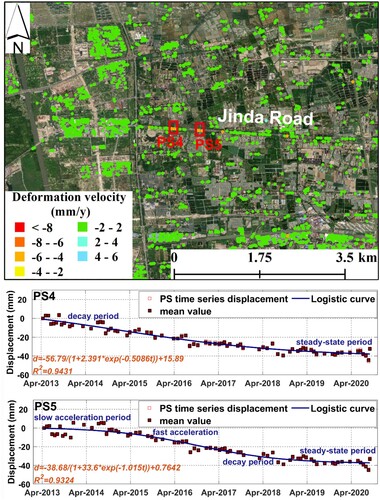
Zooming into the frame of the detected deformation section of the Pingzhuang East Road and the Jinda Road, both were built between 2009 and 2013 according to historical optical images (Google Earth), deformation velocities are illustrated in and . From east to west along the Pingzhuang East Road, three deformed sections are marked as PS1, PS2, and PS3. These infrastructure-controlled subsidence sections detected by the DSD method along the lines will impact the safety of daily operation. The accumulative displacements of the points on these three sections derived by the TSX dataset are shown in on the right. The hollow squares on the time series curves represent the cumulative displacements of each point, and the solid block represents the average cumulative settlement of the selected points. Logistic regression function was conducted to further analyse the time evolution characteristic. The curve is characterized by four stages: slow acceleration period, fast acceleration period, decay period and steady-state (Xu et al. Citation2021). From the temporal evolution of the deformation, it can be found that the subsidence trend of the three sections became more and more severe from east to west. While they all experienced a similar pattern of evolution, the temporal evolution fit the logistic curve well. At the end, the deformation trends have slowed down, reaching the steady-state period. The same procedure for the Jinda Road is conducted, and the corresponding deformed sections are PS4 and PS5, shown in . It is consistent with the deformation mechanism of soft soil consolidation subsidence. Due to that Pingzhuang East Road was built early in 2009, the first two periods (slow and fast acceleration periods) were not covered in the observation.
Figure 17. Pingzhuang East Road infrastructure-controlled deformation distribution and the accumulative displacements of monitoring points.
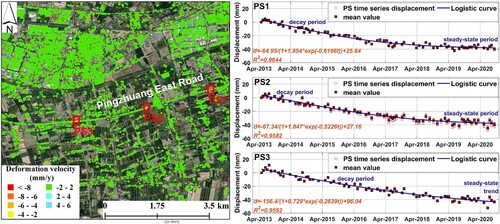
Figure 18. Jinda Road infrastructure-controlled deformation distribution and the accumulative displacements of monitoring points.
Fortunately, the monitoring results in this paper showed that there was fewer such infrastructure-controlled deformation in Shanghai. The short-time deformation during the observation period may be undetected due to the low coherence throughout the long-time observation. However, this method can be used to alert the occurrence of the infrastructure-controlled settlement in future daily monitoring with InSAR.
5.4. Comparison of different scales of deformation
Based on the decomposed deformation by the TSX dataset, a crosswise comparison of the three scales of settlement can be made to identify the proportion of each scale. Accordingly, the most influential factors affecting the current land subsidence in Shanghai can be clarified. For large-scale deformation, medium-scale deformation, and infrastructure-controlled deformation, we separately count the number of deformed areas and the percentage of deformed points to the total observation points, as described in . The counts of deformation areas for large-scale, medium-scale, and infrastructure-controlled are separately 3, 23, and 2. The proportions of the three scales deformation points whose velocities are smaller than −3 mm/y to the total observation points are below 1%, explaining the macroscopic stability of land subsidence control in Shanghai. The number of detected deformation areas of large-scale and infrastructure-controlled ones is smaller than the number of medium-scale. It is the same with the percentage of deformation points.
Table 3. The comparison of different scales of deformation by the TSX datasets.
The crosswise comparison of the deformation in three scales shows that the medium-scale deformation is the most significant in terms of the number of deformed areas and the proportion of deformed observation points. Correspondingly, the most crucial factor currently affecting the stability of land subsidence in Shanghai is engineering construction activities.
6. Conclusion
We applied time-series InSAR techniques and the DSD method to map and extract different scales of land subsidence in Shanghai from 2013 to 2020 using 154 TerraSAR-X images and 124 Sentinel-1A images. The three different scales of deformation refer to the large-scale deformation related to the geological environment, the medium-scale deformation caused by major construction activities with group excavation, and the small-scale deformation, which is distributed along linear infrastructures.
The monitoring results showed that most areas of Shanghai are getting stable, especially in the downtown area with subsidence rate of −2 mm/y–2 mm/y. While in the suburban area, mainly due to the construction activities, relatively obvious deformation with a mean velocity of −6 mm/y occurred. Additionally, validation by cross-comparison between the results of the two data stacks and the ten levelling benchmarks measurements, showed good agreements, and demonstrated the accuracy of the retrieved monitoring results getting at the millimetre level.
For the more systematically and detailed analysis over the whole area of Shanghai, three different scales of the subsidence were then obtained based on different spatial frequencies. The large-scale deformation, such as one spot retrieved in Minhang District, is mainly affected by geological settings, accelerating by other triggering factors. Construction activities in an area generally induced medium-scale subsidence. The results showed that this type of subsidence was scattered in the surroundings where construction is developing. The small-scale deformation referred to linear infrastructure-controlled settlement, which occurred on specific sections of the line. The ultimate crosswise comparison of the three scales of deformation shows that the engineering activity is the main factor affecting the land subsidence in Shanghai recently.
To summarize, this paper revealed that most downtown areas of Shanghai are getting stable, but that surface subsidence in the suburban area is relatively evident. Three different scales (from large to small) of deformation were classified and analysed, with regard to their geological settings, construction activities, and subsidence mechanism, providing a more precise and organized analysis. The method and application in this paper can be used as a reference for other city-scale urban monitoring. Possible future work could be focused on developing further settlement decomposition and extraction methods such as deep learning, which is more robust for monitoring larger areas.
Geolocation information
The study area in this paper is Shanghai, China.
Acknowledgements
The authors were sincerely grateful to the European Space Agency (ESA) for providing Sentinel-1A images. GoogleTM Earth provided massive high-resolution optical images for the result interpretation and validation. The authors thank the Shanghai Institute of Geological Survey (SIGS) for providing levelling data. The authors would like to thank Dr. Matthew Gaddes and the anonymous reviewers for providing valuable suggestions.
Data availability statement
The S1A images that support the findings of this study are openly available at https://scihub.copernicus.eu/dhus/#/home. The DEM SRTM data is openly available at https://srtm.csi.cgiar.org/srtmdata/. The information on major construction projects is available at https://data.sh.gov.cn/. The geological hazard assessment report is available at https://hd.ghzyj.sh.gov.cn:8080/dzkc/wxpg/. Optical Google Map is available in GoogleTM Earth. The TSX images and levelling data that support the findings of this study are not available due to commercial restrictions.
Disclosure statement
No potential conflict of interest was reported by the author(s).
Additional information
Funding
References
- Bamler, R., and P. Hartl. 1998. “Synthetic Aperture Radar Interferometry.” Inverse Problems 14 (4): R1–R54. doi:10.1088/0266-5611/14/4/001.
- Berardino, P., G. Fornaro, R. Lanari, and E. Sansosti. 2002. “A New Algorithm for Surface Deformation Monitoring Based on Small Baseline Differential SAR Interferograms.” IEEE Transactions on Geoscience and Remote Sensing 40 (11): 2375–2383. doi:10.1109/Tgrs.2002.803792.
- Chai, J. C., S. L. Shen, H. H. Zhu, and X. L. Zhang. 2004. “Land Subsidence due to Groundwater Drawdown in Shanghai.” Geotechnique 54 (2): 143–147. doi:10.1680/geot.2004.54.2.143.
- Chang, L., R. P. B. J. Dollevoet, and R. F. Hanssen. 2017. “Nationwide Railway Monitoring Using Satellite SAR Interferometry.” IEEE Journal of Selected Topics in Applied Earth Observations and Remote Sensing 10 (2): 596–604. doi:10.1109/Jstars.2016.2584783.
- Cigna, F., B. Osmanoglu, E. Cabral-Cano, T. H. Dixon, J. A. Avila-Olivera, V. H. Garduno-Monroy, C. DeMets, and S. Wdowinski. 2012. “Monitoring Land Subsidence and its Induced Geological Hazard with Synthetic Aperture Radar Interferometry: A Case Study in Morelia, Mexico.” Remote Sensing of Environment 117: 146–161. doi:10.1016/j.rse.2011.09.005.
- Crosetto, M., O. Monserrat, M. Cuevas-Gonzalez, N. Devanthery, and B. Crippa. 2016. “Persistent Scatterer Interferometry: A Review.” ISPRS Journal of Photogrammetry and Remote Sensing 115: 78–89. doi:10.1016/j.isprsjprs.2015.10.011.
- Del Soldato, M., P. Confuorto, S. Bianchini, P. Sbarra, and N. Casagli. 2021. “Review of Works Combining GNSS and InSAR in Europe.” Remote Sensing 13 (9). doi:10.3390/rs13091684.
- Dong, J., L. Zhang, M. G. Tang, M. S. Liao, Q. Xu, J. Y. Gong, and M. Ao. 2018. “Mapping Landslide Surface Displacements with Time Series SAR Interferometry by Combining Persistent and Distributed Scatterers: A Case Study of Jiaju Landslide in Danba, China.” Remote Sensing of Environment 205: 180–198.
- Du, Z. Y., L. L. Ge, A. H.-M. Ng, X. J. Li, and L. Y. Li. 2018. “Mapping Land Subsidence Over the Eastern Beijing City Using Satellite Radar Interferometry.” International Journal of Digital Earth 11 (5): 504–519. doi:10.1080/17538947.2017.1336651.
- Ezquerro, P., M. Del Soldato, L. Solari, R. Tomás, F. Raspini, M. Ceccatelli, J. A. Fernández-Merodo, N. Casagli, and G. Herrera. 2020. “Vulnerability Assessment of Buildings due to Land Subsidence Using InSAR Data in the Ancient Historical City of Pistoia (Italy).” Sensors 20 (10): 2749. doi:10.3390/s20102749.
- Ferretti, A., C. Prati, and F. Rocca. 2001. “Permanent Scatterers in SAR Interferometry.” IEEE Transactions on Geoscience and Remote Sensing 39 (1): 8–20. doi:10.1109/36.898661.
- Garcia, A. J., B. González-Rodrigo, S. Martinez, R. Martinez, and M. Marchamalo. 2021. “Building Health Monitoring in the old Town of Madrid: Applicability of SAR Imagery to the Monitoring of Underground Works Through Classification Indexes.” International Journal of Digital Earth 14 (3): 271–287. doi:10.1080/17538947.2020.1815878.
- Gonzalez, Rafael C. 2018. Digital Image Processing. New York: Pearson Education.
- He, X. C., T. L. Yang, S. L. Shen, Y. S. Xu, and A. Arulrajah. 2019. “Land Subsidence Control Zone and Policy for the Environmental Protection of Shanghai.” International Journal of Environmental Research and Public Health 16 (15), ARTN 2729. doi:10.3390/ijerph16152729.
- Hooper, A., D. Bekaert, K. Spaans, and M. Arikan. 2012. “Recent Advances in SAR Interferometry Time Series Analysis for Measuring Crustal Deformation.” Tectonophysics 514-517: 1–13. doi:10.1016/j.tecto.2011.10.013.
- Hooper, A., H. Zebker, P. Segall, and B. Kampes. 2004. “A new Method for Measuring Deformation on Volcanoes and Other Natural Terrains Using InSAR Persistent Scatterers.” Geophysical Research Letters 31 (23): 1–5. Artn L23611. doi: 10.1029/2004gl021737.
- Hu, J., Z. W. Li, X. L. Ding, J. J. Zhu, L. Zhang, and Q. Sun. 2014. “Resolving Three-Dimensional Surface Displacements from InSAR Measurements: A Review.” Earth-Science Reviews 133: 1–17. doi:10.1016/j.earscirev.2014.02.005.
- Jiang, Y. N., M. S. Liao, H. M. Wang, L. Zhang, and T. Balz. 2016. “Deformation Monitoring and Analysis of the Geological Environment of Pudong International Airport with Persistent Scatterer SAR Interferometry.” Remote Sensing 8 (12): 1021.
- Li, M. H., L. Zhang, C. Ding, W. L. Li, H. Luo, M. S. Liao, and Q. Xu. 2020. “Retrieval of Historical Surface Displacements of the Baige Landslide from Time-Series SAR Observations for Retrospective Analysis of the Collapse Event.” Remote Sensing of Environment 240, ARTN 111695. doi:10.1016/j.rse.2020.111695.
- Li, Y. S., J. F. Zhang, Z. H. Li, Y. Luo, W. L. Jiang, and Y. F. Tian. 2016. “Measurement of Subsidence in the Yangbajing Geothermal Fields, Tibet, from TerraSAR-X InSAR Time Series Analysis.” International Journal of Digital Earth 9 (7): 697–709. doi:10.1080/17538947.2015.1116624.
- Massonnet, D., and K. L. Feigl. 1998. “Radar Interferometry and its Application to Changes in the Earth’s Surface.” Reviews of Geophysics 36 (4): 441–500. doi:10.1029/97rg03139.
- Massonnet, D., M. Rossi, C. Carmona, F. Adragna, G. Peltzer, K. Feigl, and T. Rabaute. 1993. “The Displacement Field of the Landers Earthquake Mapped by Radar Interferometry.” Nature 364 (6433): 138–142. doi:10.1038/364138a0.
- Pepe, A., M. Bonano, Q. Zhao, T. Yang, and H. Wang. 2016. “The Use of C-/X-Band Time-Gapped SAR Data and Geotechnical Models for the Study of Shanghai’s Ocean-Reclaimed Lands Through the SBAS-DInSAR Technique.” Remote Sensing 8 (11): 911.
- Perissin, D., Z. Y. Wang, and H. Lin. 2012. “Shanghai Subway Tunnels and Highways Monitoring Through Cosmo-SkyMed Persistent Scatterers.” ISPRS Journal of Photogrammetry and Remote Sensing 73: 58–67.
- Qin, X. Q., X. L. Ding, M. S. Liao, L. Zhang, and C. S. Wang. 2019. “A Bridge-Tailored Multi-Temporal DInSAR Approach for Remote Exploration of Deformation Characteristics and Mechanisms of Complexly Structured Bridges.” ISPRS Journal of Photogrammetry and Remote Sensing 156: 27–50. doi:10.1016/j.isprsjprs.2019.08.003.
- Qin, X. Q., T. L. Yang, M. S. Yang, L. Zhang, and M. S. Liao. 2017. “Health Diagnosis of Major Transportation Infrastructures in Shanghai Metropolis Using High-Resolution Persistent Scatterer Interferometry.” Sensors 17 (12): 2270.
- Shen, S. L., H. N. Wu, Y. J. Cui, and Z. Y. Yin. 2014. “Long-term Settlement Behaviour of Metro Tunnels in the Soft Deposits of Shanghai.” Tunnelling and Underground Space Technology 40: 309–323. doi:10.1016/j.tust.2013.10.013.
- Shen, S. L., and Y. S. Xu. 2011. “Numerical Evaluation of Land Subsidence Induced by Groundwater Pumping in Shanghai.” Canadian Geotechnical Journal 48 (9): 1378–1392. doi:10.1139/t11-049.
- Shi, Y. J. 2011. “Ancient River bed Distribution and its Effect on Construction in Land Area of Shanghai (in Chinese).” Journal of Engineering Geology 19 (2): 277–283.
- Shi, X. Q., S. M. Jiang, H. X. Xu, F. Jiang, Z. F. He, and J. C. Wu. 2016. “The Effects of Artificial Recharge of Groundwater on Controlling Land Subsidence and its Influence on Groundwater Quality and Aquifer Energy Storage in Shanghai, China.” Environmental Earth Sciences 75 (3), ARTN 195. doi:10.1007/s12665-015-5019-x.
- Solano-Rojas, D., S. Wdowinski, E. Cabral-Cano, and B. Osmanoğlu. 2020. “Detecting Differential Ground Displacements of Civil Structures in Fast-Subsiding Metropolises with Interferometric SAR and Band-Pass Filtering.” Scientific Reports 10 (1): 15460. doi:10.1038/s41598-020-72293-z.
- Strozzi, T., P. Teatini, and L. Tosi. 2009. “TerraSAR-X Reveals the Impact of the Mobile Barrier Works on Venice Coastland Stability.” Remote Sensing of Environment 113 (12): 2682–2688. doi:10.1016/j.rse.2009.08.001.
- Wang, Q. J., H. D. Guo, Y. Chen, Q. Z. Lin, and H. Li. 2013. “Application of Remote Sensing for Investigating Mining Geological Hazards.” International Journal of Digital Earth 6 (5): 449–468. doi:10.1080/17538947.2011.629009.
- Wu, H. N., S. L. Shen, and J. Yang. 2017. “Identification of Tunnel Settlement Caused by Land Subsidence in Soft Deposit of Shanghai.” Journal of Performance of Constructed Facilities 31 (6): 04017092. Artn 04017092. doi:10.1061/(Asce)Cf.1943-5509.0001082.
- Wu, Y. X., T. L. Yang, P. C. Li, and J. X. Lin. 2019. “Investigation of Groundwater Withdrawal and Recharge Affecting Underground Structures in the Shanghai Urban Area.” Sustainability 11 (24), doi:10.3390/su11247162.
- Wu, C. J., G. L. Ye, L. L. Zhang, D. Bishop, and J. H. Wang. 2015. “Depositional Environment and Geotechnical Properties of Shanghai Clay: A Comparison with Ariake and Bangkok Clays.” Bulletin of Engineering Geology and the Environment 74 (3): 717–732. doi:10.1007/s10064-014-0670-0.
- Xu, Y. S., L. Ma, Y. J. Du, and S. L. Shen. 2012. “Analysis of Urbanisation-Induced Land Subsidence in Shanghai.” Natural Hazards 63 (2): 1255–1267. doi:10.1007/s11069-012-0220-7.
- Xu, Y. S., S. L. Shen, Z. Y. Cai, and G. Y. Zhou. 2008. “The State of Land Subsidence and Prediction Approaches due to Groundwater Withdrawal in China.” Natural Hazards 45 (1): 123–135. doi:10.1007/s11069-007-9168-4.
- Xu, Y. S., S. L. Shen, D. J. Ren, and H. N. Wu. 2016. “Analysis of Factors in Land Subsidence in Shanghai: A View Based on a Strategic Environmental Assessment.” Sustainability 8 (6), ARTN 573. doi:10.3390/su8060573.
- Xu, X. B., D. Z. Zhao, C. Ma, and D. J. Lian. 2021. “Monitoring Subsidence Deformation of Suzhou Subway Using InSAR Timeseries Analysis.” IEEE Access 9: 3400–3416. doi:10.1109/Access.2020.3047574.
- Xue, Y. Q., Y. Zhang, S. J. Ye, J. C. Wu, and Q. F. Li. 2005. “Land Subsidence in China.” Environmental Geology 48 (6): 713–720. doi:10.1007/s00254-005-0010-6.
- Yan, X. X., and T. L. Yang. 2020. “Suggestions for a Strategy on Land Subsidence Prevention and Control in Shanghai Under the New Situation (in Chinese).” Shanghai Land & Resources 41 (3): 1–2.
- Yang, M. S., T. L. Yang, L. Zhang, J. X. Lin, X. Q. Qin, and M. S. Liao. 2018. “Spatio-Temporal Characterization of a Reclamation Settlement in the Shanghai Coastal Area with Time Series Analyses of X-, C-, and L-Band SAR Datasets.” Remote Sensing 10 (2): 329.
- Ye, S. J., Y. Q. Xue, J. C. Wu, X. X. Yan, and J. Yu. 2016. “Progression and Mitigation of Land Subsidence in China.” Hydrogeology Journal 24 (3): 685–693. doi:10.1007/s10040-015-1356-9.
- Yu, Q. B., Q. Wang, X. X. Yan, T. L. Yang, S. Y. Song, M. Yao, K. Zhou, and X. L. Huang. 2020. “Ground Deformation of the Chongming East Shoal Reclamation Area in Shanghai Based on SBAS-InSAR and Laboratory Tests.” Remote Sensing 12 (6), ARTN 1016. doi:10.3390/rs12061016.
- Zebker, H. A., P. A. Rosen, R. M. Goldstein, A. Gabriel, and C. L. Werner. 1994. “On the Derivation of Coseismic Displacement-Fields Using Differential Radar Interferometry - the Landers Earthquake.” Journal of Geophysical Research-Solid Earth 99 (B10): 19617–19634. doi:10.1029/94jb01179.
- Zhang, A. G., and Z. X. Wei. 2002. “Past, Present and Future Research on Land Subsidence in Shanghai City.” Hydrogeology and Engineering Geology 5: 72–75. (in Chinese)
- Zhao, Q., G. Y. Ma, Q. Wang, T. H. Yang, M. Liu, W. Gao, F. Falabella, P. Mastro, and A. Pepe. 2019. “Generation of Long-Term InSAR Ground Displacement Time-Series Through a Novel Multi-Sensor Data Merging Technique: The Case Study of the Shanghai Coastal Area.” ISPRS Journal of Photogrammetry and Remote Sensing 154: 10–27. doi:10.1016/j.isprsjprs.2019.05.005.
- Zhao, Q., A. Pepe, W. Gao, Z. Lu, M. Bonano, M. L. He, J. Wang, and X. Tang. 2015. “A DInSAR Investigation of the Ground Settlement Time Evolution of Ocean-Reclaimed Lands in Shanghai.” IEEE Journal of Selected Topics in Applied Earth Observations and Remote Sensing 8 (4): 1763–1781.