
 ?Mathematical formulae have been encoded as MathML and are displayed in this HTML version using MathJax in order to improve their display. Uncheck the box to turn MathJax off. This feature requires Javascript. Click on a formula to zoom.
ABSTRACT
China has become a major investor and constructor of electrical power plants in developing countries. However, the impacts of China's overseas power stations (COPSs) on the developing countries hosting them are poorly understood. Here, a novel method is proposed to evaluate the influence of COPSs in 80 host countries. First, their electricity consumption from 1971 to 2017 was estimated using data provided by the World Bank, International Energy Agency, and World Resources Institute. Regression analysis was then used to predict consumption from 2018 to 2025. Finally, three parameters were used to evaluate the influences of COPSs. The results show that: 1) COPSs significantly increased the total installed capacity of 35 of the host countries by > 20%. 2) The power generated by COPSs is greater than the growing demands of 32 of the host countries. 3) COPSs will increase the per capita electricity consumption of all 80 host countries. 4) Among the 437 COPSs existing in 2000–2019, renewable power plants (including hydropower) were most numerous, accounting for 51.3%. This proportion increased significantly after 2013 and renewable plants will continue to dominate as China will no longer invest in new coal-fired power stations after 2021.
1. Introduction
Electricity is the primary driver of socio-economic development, is the most dynamic and efficient form of energy, and is essential for growth in all sectors of the economy (Rajkumari Citation2020). Ensuring access to affordable, reliable, sustainable, and modern energy services by 2030 is an important part of the United Nations Sustainable Development Goal 7 (SDG7). However, nearly 800 million people worldwide still lived without electricity in 2018. Developing countries, especially those in the Belt and Road Initiative area, face the problem of relatively undeveloped power facilities (Morrissey Citation2017; IEA Citation2014; Valasai et al. Citation2017; GEIDCO Citation2018). Also, in Belt and Road Initiative countries, (1) the development and usage of power resources, and power generation and consumption levels, are far lower than those in developed countries. (2) There are uneven levels in construction of power infrastructure, especially in South Asia, Southeast Asia, West Asia, and North Africa. These areas have power industries and infrastructure (such as power grids) that are underdeveloped, and there are widespread problems such as ageing power equipment and serious overload and management issues. (3) Asian and African Belt and Road countries have strong demands for energy projects, power-grid interconnections, renewable energy, and advanced power technology. However, their current low levels of power technology have hindered the development of renewable energy systems (Sovacool et al. Citation2011). Therefore, Belt and Road Initiative countries have pressing demands for transnational power investment and technical support.
China has the world’s greatest electricity generation capacity. It has much experience and technology related to the construction and operation of hydropower, coal, solar, wind, and other types of power stations (Tang et al. Citation2019). In 2013, China put forward the Belt and Road Initiative (China Citation2015; Aoyama Citation2017) and, by the end of January 2020, had signed agreements with 138 countries (herein referred to as Belt and Road Initiative agreement countries; Liu Citation2020). The Belt and Road Initiative considers energy projects to be a key component of international cooperation (Duan et al. Citation2018). Since the Belt and Road Initiative was put forward, China has invested in and provided construction services for many power station projects (known as China’s overseas power stations, COPSs) in participating countries. The number of COPSs has grown rapidly and they have gradually become an important source of investment and technology for developing countries. Published datasets show that China has invested in industrial parks (Li et al. Citation2019), highways (Jia, Wu, and Niu Citation2019), railways (Xiao et al. Citation2019) and other projects abroad. China’s overseas power projects (Yin et al. Citation2019; Jiang et al. Citation2019) comprise the largest number of Belt and Road Initiative-related projects; there are 86 participating countries, including Guinea, Djibouti, Cambodia, Laos, and other less-developed countries. Also, China is actively building cross-border power-grid connectivity projects and has achieved connectivity with Russia, Mongolia, Kyrgyzstan, Vietnam, Laos, Myanmar, and other countries (Liu, Yang, and Liu Citation2018). These collaborations and investments have significantly improved the power and energy situations of the countries involved.
However, recent statistics on global power development and the effects of electricity projects on electricity supplies are incomplete. The World Bank’s per-capita electricity consumption data for each country is only available up to 2014. British Petroleum has provided scattered statistics for a small number of countries from 1965 to 2019 (BP Citation2020). The International Energy Agency (IEA) claims to provide the world’s most authoritative and comprehensive source of global energy data (IEA Citation2021). However, the IEA only provides data on national electricity consumption from 1960 to 2018, and several countries are excluded. The number of COPSs only began to increase significantly after 2016. The influence of COPSs on host countries was not considered in the studies of the World Bank and British Petroleum, and many COPSs were excluded from the IEA database.
Timely and accurate power data, such as those relating to investment and power demand, are the basis of power station investment. Chinese overseas power stations represent major investments in their host countries and the exclusion of related data causes significant analytical uncertainty. However, recent research on national electricity consumption and electricity demand prediction has focused on the development of complex models. Rivera-Gonzalez et al. (Citation2019) modelled Ecuador’s electricity supply and demand until 2040 using the Long-range Energy Alternatives Planning (LEAP) system. Pakistan’s electricity supply and demand were investigated by Perwez et al. (Citation2015) using the LEAP system. In contrast, Zhang et al. (Citation2012) built sophisticated models to study the supply and demand of electricity in Japan under various conditionsFew studies have investigated the impacts of the Belt and Road Initiative-related cooperation and investment on energy development in host countries. Some researchers analysed the spatial distribution of various Chinese global power investment categories as of December 31, 2017 (Li, Gallagher, and Mauzerall Citation2020). Some researchers analysed the carbon emissions of COPSs in 15 Belt and Road Initiative countries before June 2019 and discussed their impacts on regional environmental sustainability (Tao, Liang, and Celia Citation2020). As there are few other studies, the impacts of COPSs on their host countries are poorly understood.
To address this problem, the objectives of the present study were 1) to propose a method for estimating the electricity consumption of COPSs host countries from 1971 to 2017 using global energy data provided by the World Bank, IEA and World Resources Institute (WRI), 2) to simulate and analyse the electricity consumption of these countries from 2018 to 2025, and 3) to propose a method for evaluating the influence of COPSs in these countries.
The innovation and contributions of this study are: 1) It provides a detailed framework for assessing the impacts of COPSs on the power status of host countries, thus making up for the deficiencies of existing research. 2) Electricity consumption datasets are provided for 80 of the host countries from 1971 to 2017, which forms useful basic data for related research. 3) The electricity consumption of the 80 countries is simulated for the period 2018–2025, providing a useful dataset for studying their power development. 4) This study has policy implications for the Chinese government and enterprises considering investment in overseas electric power stations.
2. Study area and data
2.1. Study area
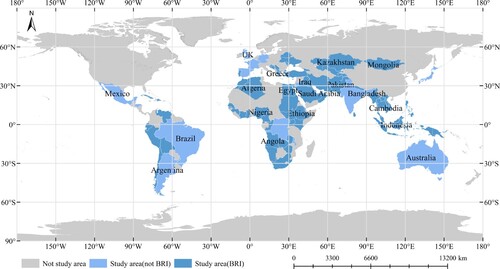
There are 86 countries involved in Chinese power projects (Yin et al. Citation2019; Jiang et al. Citation2019); of these, Kyrgyzstan, Liberia, and Mauritania have Chinese power transmission and distribution projects (TDPs) but no COPSs, so were excluded. Furthermore, the World Bank and other institutions could not provide suitable energy data for Somalia, Chad, and the Maldives, which were also excluded. Therefore, suitable data were available for 80 countries, which are widely distributed across Asia, Europe, Africa, North America, South America, and Oceania, with most in Asia and Africa. Sixty-nine of the 80 countries were Belt and Road Initiative agreement countries. Twenty are considered least-developed countries and account for 42.6% of the world’s least-developed countries. The locations of the 80 studied countries are shown in and they are listed in (in the Appendix).
Figure 1. World map showing the 80 countries considered in this study (BRI = Belt and Road Initiative agreement countries).
2.2. Data
This study used datasets from the World Bank (WB Citation2021), WRI (Byers et al. Citation2019), IEA (IEA Citation2021) and COPSs (Yin et al. Citation2019; Jiang et al. Citation2019). A summary is provided in .
Table 1. Data sources used to study the 80 COPS host countries.
2.2.1. World Bank data
The World Bank’s electric energy-related data are comprised of four parts (WB Citation2021): 1) global population changes, 2) global per capita power consumption, 3) global transmission and distribution losses, and 4) the global proportions of power generated by various types of power stations. The data cover 264 countries, regions, and organizations worldwide. The time period ranges from 1971 to 2014, although statistics are unavailable for some years and for 14 of the 83 countries hosting COPSs.
2.2.2. WRI and IEA data
The WRI’s Global Power Plant Database includes global power plant data up to February 2018 that cover 85.4% of the world’s total installed capacity (Rivera-Gonzalez et al. Citation2019). The database includes the type, name, location, installed capacity, and measured or estimated power generated by each power station. Three countries – Somalia, Chad, and the Maldives – have no data in the WRI database. The IEA’s global per capita electricity consumption breakdown is based on information from 2017 (IEA Citation2021), the most recent year for which statistics were available. Data were unavailable for 14 of the 83 countries hosting COPSs.
2.2.3. COPS datasets
In this paper, China’s overseas power stations are defined as power stations built in countries other than China with the strong participation of Chinese companies. For example, Chinese enterprises may have played an important role in engineering procurement construction (EPC), investment, or equipment supply. Many institutions and researchers have tracked China's global investment and construction progress. For example, the Inter-American Dialogue and Global Development Policy Centre have established the China-Latin America Finance Database, which is related to China's investments in Latin America (Gallagher and Myers Citation2021). The China Africa Research Initiative at Johns Hopkins University’s School of Advanced International Studies (SAIS-CARI) has established the Chinese Loans to Africa (CLA) Database, which is related to China's investment in Africa (Brautigam et al. Citation2021). The AidData database expands the frame of reference to include Chinese developmental finance, commercial finance, grants and technical assistance. AidData was the first database to incorporate project locations, thereby enabling global spatial analysis (AidData Citation2017; Bluhm et al. Citation2018). The Reconnecting Asia database tracks seven types of infrastructure projects active across the Eurasian supercontinent since 2006: power plants, roads, railways, ports, intermodal, transmission networks and pipelines (CSIS Citation2020). China’s Global Energy Finance Database tracks overseas energy sector developmental finance provided by China’s two global policy banks – the China Development Bank and the Export-Import Bank of China (Gallagher Citation2019). Ray et al. (Citation2021) integrated various databases and verified and improved their accuracy to produce a geolocated dataset of Chinese overseas developmental finance. Some of these datasets do not provide detailed information, such as on the installed capacity of power station projects. Some have limited coverage and others only include investment statistics while ignoring construction project data, which is equally important to our research.
The COPSs data used in this paper were derived from two datasets: A dataset of China’s overseas hydropower station projects from 2002 to 2019 (Yin et al. Citation2019) and A dataset of China’s overseas power projects (2000–2019) (Jiang et al. Citation2019). These two datasets are from the same institution and provide the information required for the present study. One contains data on hydropower stations while the other focuses on other types of COPSs. They include COPS information reported by China’s Ministry of Commerce, Chinese companies, news media, and other relevant entities and media. The Yin and Jiang datasets include data on 437 Chinese energy and power projects in 86 countries, including 110 hydropower stations, 160 thermal power stations, 62 photovoltaic power stations, 24 wind power stations, 28 ‘other’ power stations, and 53 power transmission and distribution projects (TDPs). The data include each project’s number, name, status, construction unit, scale, country, region and type.
The Yin dataset divides China's role in these projects into four categories: construction (70.9% of cases), investment and construction (20%), investment (7.3%) and acquisition (1.8%). Information on Chinese participation is not part of Jiang’s dataset but we were able to add it. In Jiang’s dataset, China’s roles include engineering procurement construction (EPC, 61.5% of cases), construction (20.5%), equipment supply (6.4%), investment and construction (4.3%), investment (2.1%), and ‘other’ (5.2%). Chinese enterprises had various vital roles in these projects.
3. Methods
Power shortages result from differences between the total power demand and actual power supply. Such shortages seriously affect healthy economic development and can cause very high economic losses (Woo and Pupp Citation1992; Sun, Wang, and Ma Citation2009; Ou, Huang, and Yao Citation2016). However, most of the studied countries do not publish historical electricity demand data, making it difficult to estimate their electricity demands. However, there are abundant data for estimating national electricity consumption. Therefore, this study used actual electricity consumption data to analyse changes in the electric energy status of the 80 countries hosting COPSs. Power consumption data represent actual electricity consumption. Future consumption can be simulated based on historical data. If the electricity-generating capacity of a COPS fails to meet the growth in consumption, serious electricity shortages may occur; conversely, if it exceeds it, power gaps will be reduced.
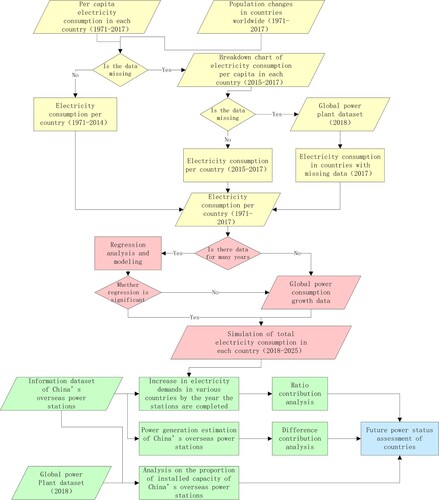
First, data from the World Bank, WRI, and IEA were used to calculate the electricity consumption of the 80 host countries from 1971 to 2017. Then, regression analysis was used to build a regression model to simulate their electricity consumption from 2018 to 2025. Finally, data on COPSs were used to calculate each host country’s 1) proportion of the total installed capacity provided by COPSs in 2018 and (2) proportion of annual increase in electricity consumption that was provided by COPSs. These analyses helped to evaluate the impact of COPSs on the power status of host countries. An analysis flowchart is shown in .
Figure 2. Flowchart of the analytical process used in this study.
3.1. Electricity consumption of host countries, 1971–2017
Electricity consumption between 1971 and 2017 was estimated for each of the 80 host countries using three methods. Data on per capita electricity consumption were unavailable for 11 countries: Guinea, Papua New Guinea, Uganda, Equatorial Guinea, Laos, Djibouti, Burundi, Malawi, Afghanistan, Liberia, and Mauritania. Therefore, their electricity consumption in 2017 was only estimated using the WRI’s Global Power Plant Database (Rivera-Gonzalez et al. Citation2019).
3.1.1. Annual power consumption estimates for all countries, 1971–2014
We used World Bank data on national per capita electricity consumption and population changes for the period 1971–2014 (WB Citation2021). By multiplying each country’s population (P) by their per capita electricity consumption (PCEC), their total annual electricity consumption (TAEC) was obtained:
(1)
(1)
However, because the World Bank data ends in 2014 and excludes 11 of the host countries, this method could only estimate the power consumption of 69 countries from 1971 to 2014.
3.1.2. Estimated annual electricity consumption of all countries, 2014–2017
The IEA has published a broken-line map of the world’s per capita electricity consumption from 2015 to 2017 (IEA Citation2021). By multiplying the global population (P) by the global PCEC, the TAEC of each country between 2015 and 2017 was estimated:
(2)
(2)
3.1.3. Estimated annual electricity consumption of countries without power data for 2017
As stated earlier, of the 80 host countries, data on per capita electricity consumption were unavailable for 11 of them. To address this problem, Tao, Liang, and Celia's (Citation2020) methodology for estimating power station generation was implemented. Of the 83 countries with power stations built by China, 27 were selected that had similar conditions and economic levels to those of the 11 data-deficient countries. The WRI’s Global Power Plant Database has statistics for these 27 countries’ installed capacity and annual actual generating capacity of some power stations. Accordingly, the capacity factors of different types of power stations could be obtained, which are defined as the ratio of a power plant’s actual generation to its maximum potential generation within a given time period. According to these capacity factors, the annual generating capacities were estimated for data-deficient power stations. Then, the annual total generating capacity and electricity consumption of the 11 data-deficient countries were estimated for 2017. The specific steps were as follows:
The installed capacity of each power station is the summed power rating of its generator units, which was used to calculate the maximum generation potential as:
(3)
Where Gi,b is the maximum potential generation of the ith power station at full load per year and Mi is its installed capacity according to the WRI Global Power Plant Database. EquationEquation (3)(3)
(3) was used to calculate the maximum potential generation of each power station in the WRI Global Power Plant Database.
| (2) | The annual generating capacity and EquationEquation (3) | ||||
| (3) | The average capacity factor of the same type of power station as in EquationEquation (4) | ||||
| (4) | By multiplying the maximum potential generation calculated by EquationEquation (3) | ||||
| (5) | The estimated power generated by each power station in each country was totalled to obtain the annual generating capacity of the 11 data-deficient countries in 2017. The average power transmission and distribution losses of neighbouring countries were used as estimates of these country’s losses. After deducting the power transmission loss from the annual generating capacity, the 2017 electricity consumption of the 11 countries was estimated. | ||||
Table 2. Capacity factors of various power station types worldwide.
3.2. Simulated electricity consumption of host countries, 2018–2025
Based on the electricity consumption of each country from 1971 to 2017, a regression model was constructed and used to simulate consumption from 2018 to 2025. The 11 countries with only 2017 consumption data, as well as 31 other countries (such as Pakistan and Nepal), were unsuitable for regression simulation because their regression models had low R2 values. Their electricity consumption was predicted based on predicted demand growth rates in different regions of the world () contained in the IEA World Energy Outlook 2019 (IEA Citation2019). The electricity consumption of the remaining 38 countries was simulated by regression analysis and, to evaluate its accuracy, was compared with consumption data from the IEA.
Table 3. International Energy Agency forecasts of annual growth in electricity demand in various regions from 2018 to 2030.
3.3. Impact of COPSs on the electricity supplies of host countries
The power generation capacities of COPSs were estimated based on the capacity factors of the different types of power stations given in Section 3.1.3. To evaluate the contribution of COPSs to solving electricity shortages in developing countries, this study used 1) the ratio of the installed capacity of COPSs to the total installed capacity of the host countries in 2018 [R1 in EquationEq. (5)(5)
(5) ], 2) the ratio of electricity generation by COPSs to the annual increase in the electricity consumption of the host country [R2,k in EquationEq. (7)
(7)
(7) ], and 3) the difference between the power generation of COPSs and the annual increase in the electricity consumption of the host countries [D2,k in EquationEq. (6)
(6)
(6) ].
3.3.1. Proportion of the total installed capacity of host countries provided by COPSs
The ratio of the installed capacity of each COPS to the total installed capacity of each host country in 2018 (R1) was used to measure the station’s impact on the country’s electric energy situation. R1 is defined as:
(5)
(5)
Where Ci is the installed capacity of the ith COPS; Tj is the installed capacity of the jth power station in the host country in 2018; and m and o are the numbers of COPSs and total power stations in the host country, respectively. R1 describes the impact of COPSs on solving the electric energy problems of the 80 studied countries, where greater values indicate greater contributions.
3.3.2. Comparative analysis of COPS contributions to the annual electricity consumption of host countries
To illustrate the impact of COPSs on the electricity consumption of host countries, this study adopted two comparative analysis methods: difference analysis and ratio analysis. These were used to compare the generation capacity of COPSs to the host countries’ annual increases in electricity consumption and, hence, provide a measure of the impact of COPSs on the future energy status of each host country.
The difference between the power generation of COPSs and the annual increase in the electricity consumption of the host countries was defined as the difference contribution D2,k. The calculation method is:
(6)
(6)
Where is the annual generating capacity of China’s ith COPS in year
(> 2007),
is the electricity consumption of the host country in year
,
is the electricity consumption of the host country in 2017, and n is the total number of COPSs in the country.
The Ratio of the power generated by COPSs to the host country’s annual increase in electricity consumption is defined as the ratio contribution :
(7)
(7)
3.3.3. Future power status assessment of each country
Two parameters, D2,k and , were used to evaluate the future electricity development situation of various countries in terms of the influence of COPSs. When D2,k > 0 or
> 1, it indicates that the generating capacity of COPSs not only met the power demands but also provided a surplus for future increases. When D2,k < 0 or
< 1, the generating capacity did not meet the power demands, so new power stations are needed. Greater values of D2,k and
indicate greater contributions by China.
4. Results
4.1. Electricity consumption survey of the 80 host countries, 1971–2017
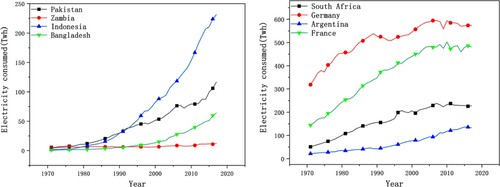
This study calculated the total electricity consumption of the 80 COPS host countries from 1971 to 2017. Electricity consumption has increased over time in most countries. Countries with higher electricity consumption have tended to have greater increases in consumption. For example, in , the increase in consumption was greater in Indonesia than in Zambia. However, in 10 of these countries, electricity consumption has fallen slightly in recent years or remained stable. Among them, Germany, France, Spain, the United Kingdom and Japan are developed countries, while Argentina, Brazil, the Bolivarian Republic of Venezuela, Saudi Arabia and South Africa are developing countries that have experienced developmental issues in recent years. The results for some countries are shown in . For other countries, please see Table S1 (Tables S1 as Supplemental Data).
Figure 3. Electricity consumption in 8 representative countries, 1971–2017
4.2. Electricity consumption forecasts for COPS host countries, 2018–2025
The electricity consumption forecast of the 80 host countries between 2017 and 2025 ranges predicts average annual consumption growth rates of 0.2–8.6%. These countries added 2,051.03 TWh of electricity consumption at an average annual growth rate of 3.1%, which is equivalent to 23.3 times the annual output of China’s Three Gorges Dam hydropower stations.
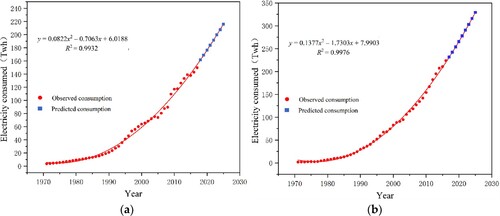
shows regression models of electricity consumption in Malaysia and Indonesia. For 38 of the countries, regression analysis provided good simulations of changes in electricity consumption. Apart from Bangladesh (R² = 0.8677) and Belarus (R² = 0.8665), the R² values of the other countries’ models were all > 0.9405. The regression simulations show that the growth rates in the average consumption of the 38 countries from 2017 to 2025 ranged from 0.9% to 8.5% with a mean of 3.9%. Data from 38 countries were used in regression analysis to predict electricity consumption from 2018 to 2025 (Table S2).
Figure 4. Historical and predicted electricity consumption in (a) Malaysia and (b) Indonesia, with fitted polynomial models.
For the 42 countries for which good regression models could not be built, the average annual electricity demand growth rates for various regions (World Energy Outlook, 2019) were used to estimate their electricity consumption for the period 2018–2025 (Table S2). For the 38 countries for which good regression models could be established, growth in electricity consumption was also simulated by the average annual electricity demand growth rates for various regions (World Energy Outlook, 2019). The results of the two methods were then compared. The absolute relative error between the two methods ranged from 0.29% to 16.89% with a mean absolute percentage error (MAPE) of 6.67%. Because the regression model was more targeted, its electricity consumption estimates were used to estimate the consumption of the 38 countries with poor models.
4.3. Impact of COPSs on the electricity supplies of host countries
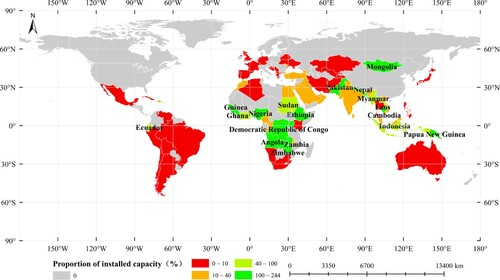
4.3.1. Ratio of COPS installed capacity to total installed capacity of host countries
Table S3 and shows the ratio of the total installed capacity of COPSs to the total installed capacity of 78 of the 80 host countries in February 2018. The WRI’s Global Power Plant Database does not include power stations in Honduras, South Sudan, Somalia, Chad, and the Maldives, so their total installed capacities are unknown and R1 values could not be calculated. It can be seen from Table S3 that the R1 values of 15 of the countries were > 100% and those of the 20 other countries were > 20%, indicating that COPSs would have significant positive impacts on the future electricity supplies of those countries. Some interesting phenomena can be found in the spatial distribution. Countries with R1 values > 100% are mainly located in sub-Saharan Africa, countries with R1 values of 40–100% are mainly in South and South-east Asia, and those with R1 values of 10–40% are mainly in the Middle East. The spatial distribution of R1 values has a strong correlation with the global power status distribution. Countries with more severe power shortages tend to have higher R1 values.
Figure 5. Proportion of installed capacity provided by COPSs in host countries.
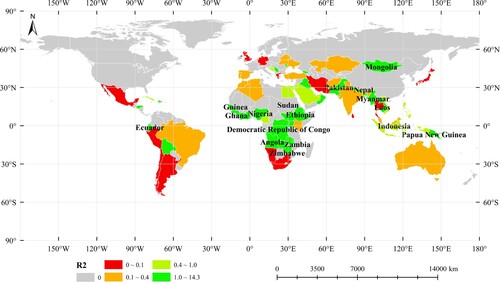
4.3.2. Comparative analysis of COPS generation and annual increases in electricity consumption
Table S4 shows the differences between the generating capacities of COPSs and the annual increases in electricity consumption of the host countries, denoted as D2,k and R2,k, respectively. The greater the value of coefficient R2,k, the greater the contribution of China to the country’s electricity consumption. When R2,k > 1, it indicates that China’s contribution will reduce the power gap of the country. Table S4 and show that in cases where only COPSs are considered, the generating capacity will meet the growing demands of 32 of the host countries because their R2,k-values are > 1. This means that the power gaps of 32 countries will be reduced by COPSs. These countries are mainly in sub-Saharan Africa and Southeast Asia, regions with the world’s worst power shortages. COPSs accounted for > 40% of the future electricity consumption of 11 countries, including Jordan, Indonesia and Egypt. The power generation of COPSs accounted for > 20% of the total electricity consumption of 10 countries, including Australia, Kuwait and Malaysia. The spatial distribution of R2,k values in is similar to that of the R1 values in . Therefore, COPSs play an essential role in meeting the increasing annual electricity requirements of countries worldwide.
Figure 6. Ratio of the power generated by COPSs to each country’s annual increase in electricity consumption (R2,k).
4.4. Error analysis
To investigate the error in the predictive model proposed in Section 3.1.2, IEA power consumption data for 2018 was compared with the 2018 predictions. The accuracy of the electricity consumption forecasts for 44 countries was analysed using IEA data. The average relative errors between predicted and measured electricity consumption of these countries were −0.99%, with a MAPE of 4.05%. Analysis of the proposed model found that the average annual growth rates in electricity consumption in all 80 countries between 2017 and 2025 ranged from 0.2% to 8.6%. The electricity consumption across the 80 countries had an average annual growth rate of 3.1%, which is almost the same as the 3% annual increase in global electricity consumption estimated by the IEA (IEA Citation2019). The average relative error of −0.99% and the average annual consumption growth rate of 3.1% indicate that this model has good overall predictive accuracy.
5. Discussion
This study calculated the electricity consumption of 80 COPS host countries from 1971 to 2017 and simulated their consumption from 2018 to 2025. It then estimated the power generated by COPSs and, thus, determined their influence on the power status of host countries. The results show that COPSs will significantly increase the electricity supply of the 80 host countries and reduce the power gaps in certain countries, especially those in sub-Saharan Africa and Southeast Asia where electricity supply is the worst in the world. However, under the background of global efforts to achieve SDG7, it is not sufficient to only consider increases in power supply. The goal of SDG7 is to ensure access to affordable, reliable and sustainable modern energy services for all. The United Nations has set six indicators to measure the achievement of SDG7, among which SDG7.1.1 indicates the proportion of the population with access to electricity, SDG7.2.1 indicates the proportion of energy consumed that was renewable, and SDG7.b.1 indicates the renewable energy installed capacity of developing countries. In this discussion section, the influences of COPSs on these three indicators are analysed from multiple aspects and policy implications are discussed.
5.1. Statistical analysis of COPSs
5.1.1. Statistical analysis of power stations by type
According to analyses of COPSs, it was found that thermal power plants composed the highest proportion (36.6%), followed by hydropower stations (25.2%). In and , ‘Others’ refers to other types of renewable energy stations, like biomass energy power stations. Renewable energy plants (including hydropower) account for 51.3% of the total ().
Figure 7. Proportions of COPSs by energy type.
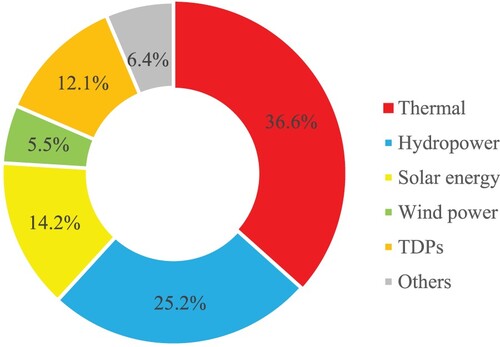
Figure 8. Types of COPSs in Belt and Road Initiative agreement countries.
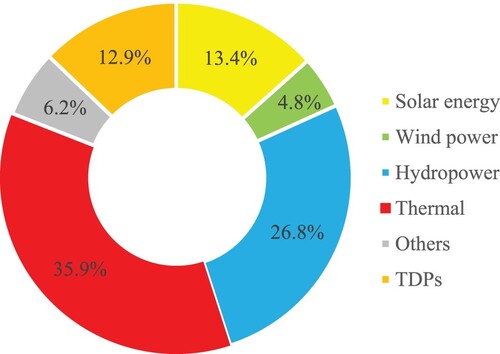
When discussing COPSs, the Belt and Road Initiative is an unavoidable topic because many projects are carried out under it. There were 373 COPSs in Belt and Road Initiative agreement countries, accounting for 85.4% of all COPSs and comprising 100 hydropower, 18 wind, 50 photovoltaic, 134 thermal and 23 ‘other’ COPSs, as well as 48 TDPs. Renewable COPSs (including hydropower, solar, wind and ‘other’) accounted for 51.2%, which is more than thermal COPSs (35.9%). shows the proportions of COPS types in the 69 Belt and Road Initiative agreement countries considered in this study, which are largely the same as in all 80 host countries. Thermal power stations account for the highest proportion, followed by hydropower stations. The quantity of renewable COPSs is significantly higher than that of thermal COPSs. As the cost of renewable energy generation decreases (IEA Citation2020), renewable plants will become increasingly competitive and their proportion will increase accordingly. This will increase the share of renewable energy consumed and contribute to goal SDG7.2.1.
5.1.2. Statistical analysis of installed capacity by type
Although 51.3% of power stations are renewable ones, their installed capacity accounts for only 41.3% of the total capacity. In contrast, 36.6% of power plants are thermal, yet they provide 58.7% of the installed capacity. This difference is due to the fact that thermal power stations tend to have a greater installed capacity than renewable ones. In terms of the installed capacity of the various COPS types, thermal power stations accounted for the highest proportion (58.7%), followed by hydropower stations (32.0%) and other renewable energy stations (9.3%). The installed capacity of all renewable energy power stations (including hydropower) accounted for 41.3% of the total, which is far greater than the 2018 global proportion of 33% (REN21 Citation2019). This shows that COPSs will enhance the renewable energy generation capacity of developing countries, thus contributing to SDG7.b.1.
When currently planned COPSs are completed, they will fill the estimated annual energy gap of 1,102.55 TWh. The global electrical energy consumption was approximately 242,291.77 TWh in 2017. When currently planned COPSs are completed, COPSs will provide 4.5% of this 2017 figure. This will have a positive impact on the global power supply and may increase the proportion of the global population that has access to electricity, thus contributing to SDG7.1.1.
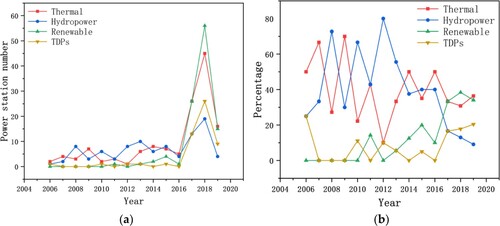
5.1.3. Temporal analysis of power station projects by type
shows the numbers and percentage changes in start-ups of each type of power station over time. (a) shows that the number of COPS ‘contracts and start-ups’ has increased gradually since 2006. The number of renewable COPS start-ups increased significantly after 2013, and the number of power TDPs increased significantly after 2016. According to (b), since 2006, the proportions of thermal and hydropower projects have declined, whereas the proportions of renewable projects and TDPs have increased significantly since 2010. After 2016, the number and proportion of renewable power stations increased significantly. This is because the Chinese government put forward the policy Guiding Opinions on Promoting the Construction of Green Belt and Road Initiative in 2017. Overall, a trend from thermal to renewable energy COPSs is gradually emerging, and from construction to the coordinated development of COPSs with TDPs, which have positive impacts on SDG7.2.1 and SDG7.b.1. On September 21, 2021, China's President Xi Jinping announced that China will strongly support the development of green and low-carbon energy projects in developing countries and will no longer participate in new coal-fired electricity projects. Hence, renewable power stations will become the main type of COPS .
Figure 9. Proportions of COPS types in terms of installed capacity.
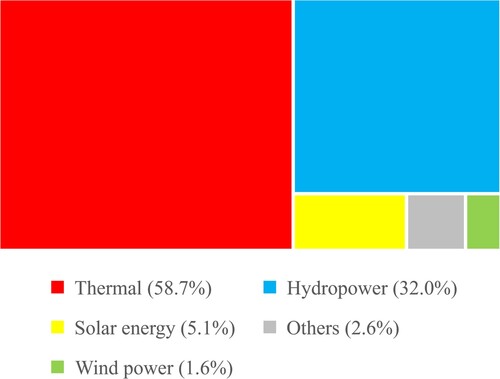
Figure 10. Trends in start-ups of various types of power projects from 2006–2019 in terms of (a) numbers and (b) proportions (TDPs = transmission and distribution projects).
5.2. Analysis of changes in COPS types in the 80 host countries
For a long time, conventional power stations, such as thermal ones, have been the main driver of global energy availability. However, due to their high pollution rates (including carbon emissions), renewable energy power stations have attracted increasing global attention. Chinese enterprises participating in overseas power industries previously focused on coal (Hannam et al. Citation2015); however, but signing the Paris Agreement in 2015, China shelved some proposed or planned coal-fired plants (Edenhofer et al. Citation2018) while investing in and constructing more renewable plants. The changes in energy types in the 70 countries for which data on the power generation ratio of various types of power stations were available were analysed to determine the influence of COPSs on each country’s energy mix. This reflects their positions in terms of climate change, carbon emissions, and other environmental problems related to energy development. It can also reflect the influence of COPSs on the implementation of SDG7.2.1 in these countries. Because hydropower is a conventional type of renewable energy, the analysis of renewable energy power stations is usually divided into groups that include and exclude hydropower.
5.2.1. Analysis of renewable energy excluding hydropower
Table S5(A) shows the results of the analysis of the power generation ratio of renewable energy power stations (excluding hydropower) in 70 countries under the influence of China. In 2014, the development level of renewable energy power stations in those countries was low. The proportion of renewable energy power generation in 55 of the 70 countries was lower than the global average of 6.01%. The proportion was < 2% in 41 of those countries, which was far less than the global average. Since 2014, China has built and invested in 106 renewable energy power stations in 70 countries, helping 36 countries increase the share of electricity generated by renewable energy, and filling the gap among the five countries with no renewable energy.
5.2.2. Analysis of renewable energy including hydropower
Table S5(B) shows an analysis of the power generation ratio of renewable COPSs (including hydropower) in 70 countries. The table shows that in some countries with developed hydropower resources, the installed capacity of renewable power stations accounted for a relatively high proportion of the total because of the impact of hydropower. The proportion of renewable energy power generation in 36 countries exceeded the global average level of 22.25%. Since 2014, China has built and invested in 166 new power stations in 70 countries, helping 45 countries increase their share of renewable energy power generation.
Table S5(A) and S5(B) show that, regardless of the presence of hydropower, COPSs will increase the proportion of renewable energy generation, with average increases of 2.89% and 3.70% in 36 and 44 countries, respectively. Hence, China is making positive contributions to SDG7.2 by greatly improving global renewable energy sharing.
5.3. Impact of COPSs on per capita electricity consumption in the 80 host countries
The per capita electricity consumption (PCEC) is the ratio of total electricity consumption to the total population. COPSs will increase power generation in the 80 host countries, which are mainly developing countries and generally suffer from energy shortages. The increase in power generation will lead to an increase in total power consumption. Therefore, COPSs will affect the PCEC of these countries. The following methods were used to estimate this impact from 2018 to 2025.
Estimation of annual total population
| (2) | Estimation of annual total electricity consumption | ||||
| (3) | The annual PCEC from 2018 to 2025 was calculated by dividing the annual total electricity consumption by the annual total population from 2018 to 2025. | ||||
This method was used to calculate the annual PCEC from 2018 to 2025 in 80 countries. The results show that new COPSs will increase the PCECs of these countries by 0.36–2,846.39 kWh (Table S6). The PCECs of Georgia, Laos and Mongolia were significantly greater than the global average.
The accuracy of the proposed model was tested by comparison with national population data from 2019 and 2020 published by the World Bank (WB Citation2021). The results show that the MAPEs in the population predictions for the 80 host countries in 2019 and 2020 were 1.03% and 1.14%, respectively.
5.4. Policy implications
China should increase its proportion of renewable energy (excluding hydropower) COPSs. The number and installed capacity of renewable COPSs currently account for 51.3% and 41.3% of the totals, respectively. However, the number and installed capacity of hydropower stations account for 49.1% and 77.5% of these values. As a renewable energy source, hydropower can meet the increasing demand for electricity while not contributing to global warming (Jiang et al. Citation2018). However, with people pay more and more attention to ecological protection (Zheng et al. Citation2021; Qu et al. Citation2022), the construction of hydropower stations has also caused controversy (Tang et al. Citation2012) due to impacts on aquatic environments and river hydrology (Magilligan and Nislow Citation2005), ecology (e.g. migratory fish breeding; Ligon et al. Citation1995), environmental flows (Renofalt, Jansson, and Nilsson Citation2010), ecological compensation (Fu et al. Citation2014), and social environments (e.g. immigration and land occupation issues; Liu et al. Citation2013). In addition, the environmental impacts of dam burst events are significant (Li, Li, and Ge Citation2018). In view of these problems, increases in renewable power stations other than hydropower are encouraged.
Governments around the world should plan to have more sustainable power supplies and major global investors in foreign power projects, such as China, should invest more in renewable energy. The analysis of the types and installed capacities of COPSs shows that thermal power stations are still the main source of global power. This is a challenge for sustainable electricity development in COPS host countries. This study’s analysis of 2014 global electricity energy data indicates that 1) in 2014, more than 1 billion people lived without electricity; hence, only 85.6% of the world’s population had access to electricity. The 80 host countries contain 80.5% of the world’s population without access to electricity, which is more than 800 million people. 2) Due to old technology and ageing equipment, power losses during transmission and distribution remain relatively high in developing countries, with the 80 COPS host countries and regions having losses > 10%. Transmission and distribution losses are greater than the global average in 56 of the 80 countries examined in this study. 3) Worldwide, renewable energy use is relatively low. Only 6% of electricity was generated from renewable energy sources in 2014, excluding hydropower, or 22.25% when hydropower is included. Solving these problems requires the joint efforts of host governments and investors. Host governments should develop policies that favour renewable energy generation. Major global power project investors, including China, should increase investment in the power sector to reduce the global power imbalance and, in the processes of investment and construction, renewable energy projects should be preferred.
5.5. Limitation analysis
This study calculated and simulated the electrical energy consumption of countries hosting COPSs from 1971 to 2025 and analysed the impacts of COPSs on their future electric energy status. However, the methods used in this study have the following limitations.
The electric energy project data were collected mainly from the official websites of various Chinese construction companies. Those projects were generally relatively important large-scale projects, and many small construction projects were not counted. For example, according to statistics from the Chinese Ministry of Commerce, in 2019, Chinese enterprises signed 6,944 new contracts for foreign engineering projects in the Belt and Road Initiative region (China Citation2019). Only 1,169 of these projects were included in the data collected on projects outside of China.
The WRI’s Global Power Plant Database, which contains data on 34,700 power plants in various countries and regions of the world, is currently designed to provide a comprehensive dataset of global power plant information. However, the installed capacity of all power stations in that dataset is only approximately 85.4% of the world’s total installed capacity. Hence, there will inevitably be errors associated with using that database.
Statistics from the World Bank and WRI related to electricity are incomplete. Therefore, in Section 4.3.1, only the R1 values of 78 countries could be calculated, while in Section 5.2, the changes in power generation types could only be analysed for 70 countries.
Chinese enterprises have participated in COPS projects in various vital ways. However, the impact of those projects on local energy and power status is also influenced by the participation of the host country and other parties. For example, many local workers participated in the construction of the coal-fired power station at Qassim Port in Pakistan. Therefore, the contributions of such projects to the local energy supply include the contributions of both China and other parties.
6. Conclusions
This study proposed a method for evaluating the influence of COPSs on the electricity status of 80 host countries. Based on electricity consumption observations and predictions for the period 1971–2025, the impact of COPSs was evaluated in terms of three parameters. The following conclusions can be drawn:
COPSs will significantly increase the total installed capacity of the 80 host countries, especially in sub-Saharan Africa, Central Asia and Southeast Asia, where power shortages are the world’s most serious. The total installed capacity of COPSs is higher than the total installed capacity of 15 of those countries in 2018. In another 20 countries, COPSs will provide more than 20% of their total installed capacity.
The additional power generation capacity provided by COPSs will help the 80 host countries meet their growing electricity demands, especially in sub-Saharan Africa, Central Asia and Southeast Asia. The additional power generated by COPSs is higher than the demands of 32 countries, mainly distributed in sub-Saharan Africa and Asia. In another 11 and 10 countries, it is more than 40% and 20% of their increases in electricity consumption, respectively. The total additional power generated by COPSs from 2018–2025 is estimated to be 2,051.03 TWh, which is 23.3 times the combined annual generating capacity of the Three Gorges power stations.
COPSs will increase the PCECs of the 80 host countries by between 0.36 kWh and 2,846.39 kWh. The PCECs of Georgia, Laos and Mongolia will increase to above the global average due to the impact of COPSs.
Among the 437 COPSs, from 2000 to 2019, renewable COPSs (including hydropower) were the most numerous, accounting for 51.3%. The focus of COPSs has shifted from conventional thermal power to renewable power and TDPs. The number of renewable start-ups increased significantly after 2013, while the number of power TDPs increased significantly after 2016. As China will no longer invest in coal-fired power stations, renewable energy plants and power TDPs will become the main types of new COPSs in future.
Disclosure statement
No potential conflict of interest was reported by the author(s).
Data availability statement
The data that support the findings of this study are available from the corresponding author upon request.
Additional information
Funding
References
- AidData. 2017. “Data from: Geocoding Methodology, Version 2.0.1” (dataset). Accessed May 22, 2021. https://www.aiddata.org/publications/geocoding-methodology-version-2-0.
- Aoyama, Rumi. 2017. ““One Belt, One Road”: China's New Global Strategy.” Journal of Contemporary East Asia Studies 5 (2): 3–22. doi:10.1080/24761028.2016.11869094.
- Bluhm, Richard, Axel Dreher, Andreas Fuchs, Bradley Parks, Austin Strange, and Michael Tierney. 2018. Connective Financing: Chinese Infrastructure Projects and the Diffusion of Economic Activity in Developing Countries.
- BP. 2020. BP statistical review of world energy. London: BP Amoco.
- Brautigam, D., J. Hwang, J. Link, and K. Acker. 2021. “Data from: Chinese Loans to Africa Database, Version 2.0” (dataset). China Africa Research Initiative and Boston University Global Development Policy Center. Accessed May 22, 2021. https://chinaafricaloandata.org.
- Byers, Logan, Johannes Friedrich, Roman Hennig, Aaron Kressig, Xinyue Li, Colin Mccormick, and Lauar Malaguzzi Valeri. 2019. “Data from: A Global Database of Power Plants” (dataset). World Resources Institute. Accessed May 22, 2021. www.wri.org/publication/global-database-power-plants.
- China. 2015. “Vision and actions on jointly building silk road economic belt and twenty-first-century maritime silk road” (dataset). Ministry of Commerce of the People's Republic of China. http://zhs.mofcom.gov.cn/article/xxfb/201503/20150300926644.shtml.
- China. 2019. “China's investment cooperation with countries along the “One Belt and One Road” route from January to December 2018.” People's Republic of China, Accessed May 30. http://fec.mofcom.gov.cn/article/fwydyl/tjsj/201901/20190102829089.shtml.
- CSIS. 2020. “Data from: Reconnecting Asia” (dataset). Center for Strategic and International Studies. Accessed May 22, 2021. https://reconnectingasia.csis.org/database/.
- Duan, Fei, Qiang Ji, Bing-Yue Liu, and Ying Fan. 2018. “Energy investment risk assessment for nations along China’s Belt & Road Initiative.” Journal of Cleaner Production 170: 535–547. doi:10.1016/j.jclepro.2017.09.152.
- Edenhofer, Ottmar, Jan Christoph Steckel, Michael Jakob, and Christoph Bertram. 2018. “Reports of coal’s terminal decline may be exaggerated.” Environmental Research Letters 13 (2): 024019. doi:10.1088/1748-9326/aaa3a2.
- Fu, B., Y. K. Wang, P. Xu, K. Yan, and M. Li. 2014. “Value of ecosystem hydropower service and its impact on the payment for ecosystem services.” Science of the Total Environment 472: 338–346. doi:10.1016/j.scitotenv.2013.11.015.
- Gallagher, K. P. 2019. “Data from: China’s Global Energy Finance” (dataset). Global Development Policy Center, Boston University. Accessed May 22, 2021. https://www.bu.edu/cgef/.
- Gallagher, Kevin P, and Margaret Myers. 2021. “Data from: China-Latin America Finance Database” (dataset). Washington: Inter-American Dialogue. Accessed May 22, 2021. https://www.thedialogue.org/map_list/.
- GEIDCO. 2018. Global Energy Internet Development Index 2018. BeiJing: Global Energy Interconnection Development and Cooperation Organization.
- Hannam, Phillip M., Zhenliang Liao, Steven J. Davis, and Michael Oppenheimer. 2015. “Developing country finance in a post-2020 global climate agreement.” Nature Climate Change 5 (11): 983–987. doi:10.1038/nclimate2731.
- IEA. 2014. Africa energy outlook. A focus on the energy prospects in sub-Saharan Africa. Paris: International Energy Agency.
- IEA. 2019. World Energy Outlook 2019. Paris: International Energy Agency.
- IEA. 2020. Projected Costs of Generating Electricity. Paris: International Energy Agency.
- IEA. 2021. “Data from: Electricity consumption per capita” (dataset). International Energy Agency. Accessed May 22, 2021. www.iea.org/weo.
- Jia, Zhanhai, Mingquan Wu, and Zheng Niu. 2019. “Data from: A dataset of China’s overseas highway project information from 2006 to 2019” (dataset). Science Data Bank. Accessed May 22, 2021.
- Jiang, T., Z. Z. Shen, Y. Liu, and Y. Y. Hou. 2018. “Carbon Footprint Assessment of Four Normal Size Hydropower Stations in China.” Sustainability 10 (6). doi:10.3390/su10062018.
- Jiang, Yu, Mingquan Wu, Changjun Huang, and Zheng Niu. 2019. “Data from: A dataset of China’s overseas power projects (2000–2019)” (dataset). Science Data Bank. Accessed May 22, 2021.
- Li, Humei, Mingquan Wu, Zheng Niu, and Qi Li. 2019. “Data from: Information dataset of China’s overseas industrial parks from 1992 to 2018 “ (dataset). Science Data Bank. Accessed May 22, 2021.
- Li, Z. K., W. Li, and W. Ge. 2018. “Weight analysis of influencing factors of dam break risk consequences.” Natural Hazards and Earth System Sciences 18 (12): 3355–3362. doi:10.5194/nhess-18-3355-2018.
- Li, Z. S., K. P. Gallagher, and D. L. Mauzerall. 2020. “China's global power: Estimating Chinese foreign direct investment in the electric power sector.” Energy Policy 136: 111056. doi:10.1016/j.enpol.2019.111056.
- Ligon, Franklin, K., Dietrich, William, E., Trush, William, J. 1995. “Downstream Ecological Effects of Dams: A geomorphic perspective.” Bioscience 45 (3): 183–192.
- Liu, Changming, Hui Yang, and Hongzheng Liu. 2018. “China-central Asia Energy Internet Construction under the Framework of “One Belt and One Road": Opportunities, Challenges and Policy Suggestions.” Qinghai Social Sciences (01): 58–64.
- Liu, J. G., C. F. Zang, S. Y. Tian, J. G. Liu, H. Yang, S. F. Jia, L. Z. You, B. Liu, and M. Zhang. 2013. “Water conservancy projects in China: Achievements, challenges and way forward.” Global Environmental Change-Human and Policy Dimensions 23 (3): 633–643. doi:10.1016/j.gloenvcha.2013.02.002.
- Liu, Meng. 2020. “List of countries that have signed cooperation documents with China to jointly build “One Belt And One Road.” China Belt and Road Network, Accessed May 30. https://www.yidaiyilu.gov.cn/info/iList.jsp?tm_id = 126&cat_id = 10122&info_id = 77298.
- Magilligan, F. J., and K. H. Nislow. 2005. “Changes in hydrologic regime by dams.” Geomorphology 71 (1-2): 61–78. doi:10.1016/j.geomorph.2004.08.017.
- Morrissey, James. 2017. The energy challenge in sub-Saharan Africa: A guide for advocates and policy makers: Part 2: Addressing energy poverty.
- Ou, Peng, Ruting Huang, and Xin Yao. 2016. “Economic Impacts of Power Shortage.” Sustainability 8 (7). doi:10.3390/su8070687.
- Perwez, Usama, Ahmed Sohail, Syed Fahad Hassan, and Usman Zia. 2015. “The long-term forecast of Pakistan's electricity supply and demand: An application of long range energy alternatives planning.” Energy 93: 2423–2435. doi:10.1016/j.energy.2015.10.103.
- Qu, Yi, Yaomin Zheng, Peng Gong, Jinlian Shi, Liping Li, Shudong Wang, Chunyu Luo, Hongqiang Zhang, and Lei Xu. 2022. “Estimation of Wetland Biodiversity Based on the Hydrological Patterns and Connectivity and its Potential Application in Change Detection and Monitoring: A Case Study of the Sanjiang Plain, China.” Science of The Total Environment 805: 150291. doi:10.1016/j.scitotenv.2021.150291.
- Rajkumari, Laxmi. 2020. “Relation between electricity consumption and economic growth in Karnataka, India: An aggregate and sector-wise analysis.” The Electricity Journal 33 (5): 106768. doi:10.1016/j.tej.2020.106768.
- Ray, R., K. P. Gallagher, W. Kring, J. Pitts, and B. A. Simmons. 2021. “Geolocated dataset of Chinese overseas development finance.” Scientific Data 8 (1): 241. doi:10.1038/s41597-021-01021-7.
- REN21. 2019. Renewables 2019 Global Status Report. Paris: REN21 Secretariat.
- Renofalt, B. M., R. Jansson, and C. Nilsson. 2010. “Effects of hydropower generation and opportunities for environmental flow management in Swedish riverine ecosystems.” Freshwater Biology 55 (1): 49–67. doi:10.1111/j.1365-2427.2009.02241.x.
- Rivera-Gonzalez, Luis, David Bolonio, Luis F. Mazadiego, and Robert Valencia-Chapi. 2019. “Long-Term Electricity Supply and Demand Forecast (2018-2040): A LEAP Model Application towards a Sustainable Power Generation System in Ecuador.” Sustainability 11 (19). doi:10.3390/su11195316.
- Sovacool, Benjamin K., Saroj Dhakal, Olivia Gippner, and Malavika Jain Bambawale. 2011. “Halting hydro: A review of the socio-technical barriers to hydroelectric power plants in Nepal.” Energy 36 (5): 3468–3476. doi:10.1016/j.energy.2011.03.051.
- Sun, Tianqing, Xiaohua Wang, and Xianguo Ma. 2009. “Relationship between the economic cost and the reliability of the electric power supply system in city: A case in Shanghai of China.” Applied Energy 86 (10): 2262–2267. doi:10.1016/j.apenergy.2008.12.008.
- Tang, Ling, Jiabao Qu, Zhifu Mi, Xin Bo, Xiangyu Chang, Laura Diaz Anadon, Shouyang Wang, et al. 2019. “Substantial emission reductions from Chinese power plants after the introduction of ultra-low emissions standards.” Nature Energy 4 (11): 929–938. doi:10.1038/s41560-019-0468-1.
- Tang, X. Q., Q. Y. Li, M. Wu, W. J. Tang, F. Jin, J. Haynes, and M. Scholz. 2012. “Ecological Environment Protection in Chinese Rural Hydropower Development Practices: A Review.” Water Air and Soil Pollution 223 (6): 3033–3048. doi:10.1007/s11270-012-1086-8.
- Tao, Yiheng, Haiming Liang, and Michael A. Celia. 2020. “Electric power development associated with the Belt and Road Initiative and its carbon emissions implications.” Applied Energy 267: 114784. doi:10.1016/j.apenergy.2020.114784.
- Valasai, Gordhan Das, Muhammad Aslam Uqaili, HafeezUr Rahman Memon, Saleem Raza Samoo, Nayyar Hussain Mirjat, and Khanji Harijan. 2017. “Overcoming electricity crisis in Pakistan: A review of sustainable electricity options.” Renewable and Sustainable Energy Reviews 72: 734–745. doi:10.1016/j.rser.2017.01.097.
- WB. 2021. “Data from: World Bank Database” (dataset). World Bank. Accessed May 22, 2021. https://data.worldbank.org.cn/indicator.
- Woo, C. K., and R. L. Pupp. 1992. “Costs of service disruptions to electricity consumers.” Energy 17 (2): 109–126. doi:10.1016/0360-5442(92)90061-4.
- Xiao, Jianhua, Mingquan Wu, Fujie Yin, and Zheng Niu. 2019. “Data from: A dataset of China’s overseas railway project from 2007 to 2019” (dataset). Science Data Bank. Accessed May 22, 2021.
- Yin, Fujie, Mingquan Wu, Jianhua Xiao, and Zheng Niu. 2019. “Data from: A dataset of China’s overseas hydropower station projects from 2002 to 2019” (dataset). Science Data Bank. Accessed May 22, 2021.
- Zhang, Qi, Keiichi N. Ishihara, Benjamin C. McLellan, and Tetsuo Tezuka. 2012. “Scenario analysis on future electricity supply and demand in Japan.” Energy 38 (1): 376–385. doi:10.1016/j.energy.2011.11.046.
- Zheng, Yaomin, Shudong Wang, Yue Cao, Jinlian Shi, Yi Qu, Liping Li, Tianjie Zhao, Zhenguo Niu, Rui Yang, and Peng Gong. 2021. “Assessing the Ecological Vulnerability of Protected Areas by Using Big Earth Data.” International Journal of Digital Earth 14 (11): 1624–1637. doi:10.1080/17538947.2021.1962995.
Appendix
Table A1. Names of the 80 COPS host countries included in the main analysis.