
 ?Mathematical formulae have been encoded as MathML and are displayed in this HTML version using MathJax in order to improve their display. Uncheck the box to turn MathJax off. This feature requires Javascript. Click on a formula to zoom.
ABSTRACT
With the aim of guaranteeing the interests and health of tourists, this study comprehensively evaluates the suitability of the environment in different cities in China for tourism by considering the impacts of climate, vegetation and environmental factors on health. The Universal Thermal Climate Index (UTCI), total precipitation (PREC), Vegetation Leaf Area Index (LAI), concentration of particulate matter with a diameter of less than 2.5 μm (PM2.5), and the downward UV radiation at the surface (UVB) are used as indices. In addition, the Delphi–AHP–TOPSIS algorithm is introduced and is used for the comprehensive evaluation of the environmental suitability of 684 cities in China for tourism in 2019. It is found that Chinese cities vary greatly in terms of the suitability of their environments for tourism. Among the factors that affect the environmental suitability, the LAI is important, with an increase in the LAI generally being advantageous. In contrast, an increase in the PM2.5 concentration is a key factor that limits the environmental suitability of an area. Thus, urban landscaping and control of the atmospheric quality are essential and effective ways of improving the suitability of the environment of cities in China for tourists.
1. Introduction
Cities comprise the spaces where people live and where the various activities that people are engaged in are concentrated. Cities are also the focus of many tourist activities. Tourists are becoming more dependent on services, and tourism is becoming more important to cities – many tourist facilities are located in cities, and tourism in cities is developing along with other aspects of urban development (Modica et al. Citation2016). As people’s incomes and amount of leisure increase, their ideas about tourism are also becoming more mature, and they want their vacations to consist of more than just sightseeing. Along with these changes, tourists are paying more attention to cities’ environmental conditions, including the climate and the quality of green spaces. Since the mid-1990s, Shanghai, Beijing, Hangzhou, Dalian and other cities in China have set themselves the goal of developing themselves as tourist cities. In order to increase their competitiveness in terms of attracting tourists, these cities have continuously improved their environments. However, research on the development and optimization of the urban environment in China from the perspective of the health of tourists is still at a preliminary stage. It has become urgent to scientifically and reasonably evaluate the suitability of urban tourist environments and to find out what improvements need to be made so that urban environments can be made more suitable for tourists.
Suitability analysis is widely applied in different research fields with the purpose of determining whether it is appropriate and convenient to conduct certain activities in a specific area (Modica et al. Citation2016; Sakieh et al. Citation2015), and the results are often used to guide scientific practice. This type of analysis can be applied to evaluating the suitability of the environment in a particular area for tourists (Cheng et al. Citation2020). A suitable environment is an important factor affecting the development, competitiveness or even survival of the tourist industry in a particular place (Lin et al. Citation2019).
There has been much research on the suitability of the environment for tourists both inside and outside China. However, most of this research has focused only on the condition of tourist facilities (Li et al. Citation2020), environmental quality (Dhami et al. Citation2017; Ayhana et al. Citation2020) and climatic comfort (Yang et al. Citation2017). Li et al. (Citation2020) comprehensively investigated the suitability of urban leisure tourism from the perspectives of tourist resources, roads, population and transportation. Dhami et al. (Citation2017) studied the suitability of localities in West Virginia in the United States for ecotourism based on remoteness, slope gradients, vegetation, and wildlife. Yang et al. (Citation2017) used the Universal Thermal Climate Index to analyze the suitability of the climate in different tourist destinations in China in summer. Ayhana et al. (Citation2020) used factors such as altitude, soil properties and vegetation types to evaluate the suitability of rural areas in Turkey for tourism. However, few studies have evaluated the suitability of the tourist environment based on the overall impact of the environment on the health of tourists. In addition, evaluations of the suitability of the environment have mostly focused on the tourist destination and analyzed its suitability from the perspective of land use. The tourists themselves are often neglected in these studies; in other words, the health of tourists is not taken into account in the establishment of indexing systems and the setting of related thresholds, and thus the evaluation results obtained by using these systems are not sufficient to guide tourists on how to travel in a healthy manner.
Research on how the environment influences the health of tourists has mainly focused on three aspects. The first is the evaluation of environmental quality from the perspective of health, which is the aspect most directly related to the current study. The second aspect concerns the assessment of health risks, and the third aspect consists of a safety evaluation. Studies of these three aspects have different bases, and the research is conducted from the different perspectives of tourists’ health, risk avoidance and safety improvement. There have been relatively few studies in which the influence of the environment on the health of tourists has been considered; however, this study also draws on the results of research into health risks to tourists and safety evaluations.
Assessments of the environment in relation to healthy tourism have focused on the health status of tourists and considerations of the environmental conditions needed for healthy and appropriate tourist activities. There have been relatively few such studies and the ones that there have been focused mainly on the fields of health science and on the environment in human settlements. Relatively few studies have looked at tourist activities. Zheng (Citation2005) discussed strategies for evaluating the tourist industry from a health perspective and pointed out that, in the short term, the spread and distribution of diseases, the condition of the water, air, soil and food, the risk of personal injury and even the physical condition of tourists are all in a process of constant change. In the long run, the overall impact of the allocation of health resources and environmental changes (natural and cultural) on population health will be different in tourist destinations. Therefore, the focus of research into tourist health also changes constantly. Barton and Marcus (Citation2006) and others discussed the use of a health map of the local human habitat from the perspectives of the natural environment, built environment, activities, local economy, community, lifestyle and people. In this study, the natural environment was considered to include the air, water and land. In the Evaluation Index System of Healthy Cities in China issued in 2018 (National Patriotic Health Campaign Committee Citation2018), a healthy environment is considered to be a first-level indicator. The secondary indicators include air quality (the proportion of days with good air quality and days with pollution that is classed as severe or above), water quality (the degree to which drinking water quality is controlled and safety guarantee of the centralized water source land), waste disposal (the rate of hazard-free treatment of waste) and other factors (in rural areas, the density of public toilets, including that of non-hazardous sanitary toilets; in urban areas, the amount of green space per capita, the extent to which biological disease vectors are controlled and the proportion of ‘national health’ counties). Together, these indicators form part of the system for evaluating the health of cities. Yang et al. (Citation2021) conducted a comprehensive evaluation of the tourist environment in Kunming from the perspective of ‘healthy tourism’; this included considerations of the scenery, noise levels (or quietness), air quality, vegetation coverage rate, humidity, temperature, convenience of facilities, sanitation, health, overall tourist experience and communications. According to the results of a questionnaire given to tourists, air quality and the amount of vegetation coverage were considered the most important factors.
Assessments of health risks to tourists mainly concern the consideration of health risk factors. Most studies evaluate tourism destinations from the perspectives of natural, economic, social and overall risk, whereas relatively few studies simply consider the impact of the environment on health. Therefore, it draws lessons from some achievements related to the ecological environment. Xi et al. (Citation2007) took 10 key adventure tourism routes in China as examples and explored a line-based safety assessment model for tourist destinations; the ecological and environmental conditions were also evaluated based on the climate conditions – this was done by using the difference in climate change and the probability of natural disasters occurring as indicators. Faraji Sabokbar et al. (Citation2016) carried out a risk assessment in tourism system using a fuzzy set and a scale-based rough set. Environmental and health factors were considered to be external context risks, and pollutants weather, hygiene and a clean environment, and disease were used as specific indicators. In their case study of health risks in a tourist city, Kaewrat and Janta (Citation2021) used nitrogen dioxide (NO2) as the primary health risk assessment indicator.
In relation to tourism, safety evaluation refers to
the tolerable degree of risk related to tourist activities; a tolerable degree of risk implies that activities can be engaged in under normal, stable conditions and that tourists, tourist enterprises and tourist facilities are free from physical and mental pressure, or from injury or property loss, without danger and interference from external factors. (China Tourism Research Institute Citation2012)
To sum up, most research in this field has focused on the avoidance of risks and ensuring safety, whereas little attention has been paid to the standards that the tourist environment should meet under real conditions. In addition, most studies on environmental health and on risks and safety related to tourism have been comprehensive studies that have considered the natural environment, traffic, disasters, crime, economic conditions and social policies as far as possible. Although this kind of research is very important, its relevance to specific situations is limited.
China has paid much attention to the improvement of the quality of the environment in recent years, and relevant studies have clearly demonstrated that the environment in China has been improving in recent decades (Li et al. Citation2019). The amount of environmental research related to tourism is still relatively small and most of it has focused on the effect of tourism on the quality of the environment. There has been little research on tourists’ own experience and health, failing to give the strategy about how to improve the ecological environment. By improving tourists’ experience from a health perspective, heath care and tourism can be integrated.
In order to provide guidance on how to improve the natural environment for tourists in a more targeted manner, this study does not consider overall systems such as natural or societal systems but rather focuses on an assessment of the suitability of the natural environment for tourism from the perspective of tourists’ health. The more targeted and refined results will provide better support for decision-makers.
There are many methods that can be used to evaluate the suitability of the environment in a particular area for tourism, but they rely too much on individual experience to quantify the suitability. This type of evaluation is actually a multi-criteria decision making (MCDM) problem, where the best solution needs to be selected based on multiple criteria. The key is to reasonably prioritize and scientifically quantify the criteria so as to finally determine the optimal solution (Hafezalkotob et al. Citation2019). In evaluations of the tourist environment, the key is to determine the weights of different indices and how to quantify the samples for these indices. There are many multi-criteria methods applicable to evaluations of the suitability of the tourist environment; these include the Delphi method, the AHP (Analytical Hierarchy Process) algorithm (Kiker et al. Citation2005; Goepel Citation2019), the PROMETHEE (Preference Ranking Organization Method for Enrichment Evaluations) algorithm (Brans Citation1982; Zhang et al. Citation2019), the MAUT (Multi-Attribute Utility Theory) algorithm (Torrance, Boyle, and Horwood Citation1982; Bidoux, Pignon, and Bénaben Citation2019) and the ELECTRE (Elimination Et Choix Traduisant la Realite) algorithm (Yaralıoğlu Citation2004; Zhou, Wang, and Zhang Citation2019). Of these, the AHP algorithm is one of the most scalable MCDM algorithms and is especially suitable for the evaluation of the optimal solution within a multi-level index system framework (Goepel Citation2019). However, the relative importance of each criterion has to be related to its initial scientific value. The assignment of each relative importance often relies on research experience and requires repeated expert consultations and discussions; this is precisely how the Delphi method operates. Therefore, the use of a combined Delphi–AHP method is undoubtedly a good way of prioritizing the criteria in an MCDM problem – the Delphi method can be used to set the initial values of the index weights; the AHP method is then applied to check and correct the consistency of the weights. After the results have been fed back, further rounds of the Delphi–AHP decision-making process are then executed until the Delphi expert opinion is consistent with the AHP test results. Kim, Jang, and Lee (Citation2013) applied the Delphi–AHP algorithm to environmental management decision-making and achieved good results. However, despite having obvious advantages when applied to hierarchical analysis, the AHP algorithm mostly adopts empirical methods to quantify the samples within the indices, including setting different thresholds and quantifying them by grade; this can be greatly affected by subjective factors and thus easily cause discrepancies in the results (Joshi, Banwet, and Shankar Citation2011; Wang, Yang, and Zhou Citation2018). The TOPSIS (Technique for Order Preference by Similarity to an Ideal Solution) algorithm can deal with this problem. This algorithm uses the distance between the index sample and the optimal sample to quantify the suitability of the index, thus avoiding the problems that result from the use of thresholds. A combined AHP–TOPSIS algorithm has been successfully applied to evaluations of the competitiveness of cities in terms of tourism (Yue et al. Citation2010) and to evaluations of the suitability of tourist developments (Du et al. Citation2018). Another combined algorithm, the Delphi–AHP–TOPSIS algorithm, can deal even better with the multi-criteria decision-making and criterion quantification in MCDM problems. This algorithm has proved to be effective in solving MCDM problems in fields such as performance improvement (Joshi, Banwet, and Shankar Citation2011), business management (Sekhar, Patwardhan, and Vyas Citation2015), and public management (Zhang et al. Citation2019). However, its application to the evaluation of the suitability of tourist environments has not yet been reported, and whether it is applicable in this field still needs to be tested.
In this study, the Delphi–AHP–TOPSIS algorithm is used to comprehensively evaluate the suitability of the environment in mainland China and Hainan Island for tourism from the perspectives of climatic comfort, environmental impacts on health (including impacts on the respiratory system and skin), the status of vegetation and the natural environment, and the degree to which precipitation interferes with activities. The suitability of 684 cities across China is compared. The total number of days suitable for tourism as well as the proportion of suitable days within each season are analyzed in detail as are the effects of different factors on the suitability of the environment for tourism. This is done with the aim of providing information on which tourists can base their travel planning. Fifty representative cities are also categorized according to their environmental suitability; the factors that are beneficial to the environment as well as those that limit the environmental suitability are identified, and targeted strategies and focuses for optimizing and improving the suitability of the environment for tourists are proposed.
The Chinese government attaches great importance to the protection of the natural environment. In particular, President Xi Jinping’s theories such as ‘building a shared future for humans and nature’ and ‘green is gold’ provide an important basis for improving the environment. Under the guidance of national policies, China’s tourism authority is also actively promoting the improvement of the natural environment in China for tourists. This study provides a reference for Chinese government departments such as the Ministry of Culture and Tourism, the Ministry of Ecology and Environment and the Ministry of Natural Resources that will assist with their joint efforts to improve the suitability of the natural environment in Chinese cities for tourists.
Studies on the suitability of the tourist environment in cities in China, especially wide-ranging studies concerned with the natural environment and the health of tourists are rare, and those that there have been unable to provide good guidance to tourism administration and urban planning departments for carrying out environment policy and planning. Therefore, this study is of great significance and value.
In addition, this study is centered on the health of tourists and develops evaluation indexes that describe the suitability of the natural environment for tourism. The focus is on tourists’ health, rather than just safe or risk-free travel. Health has higher requirements and thresholds than safety, which means that this study attaches great importance to the people-oriented concept and provides guidance for year-round healthy travel as well as support for decision-makers.
2. Research area and data
2.1. Research area
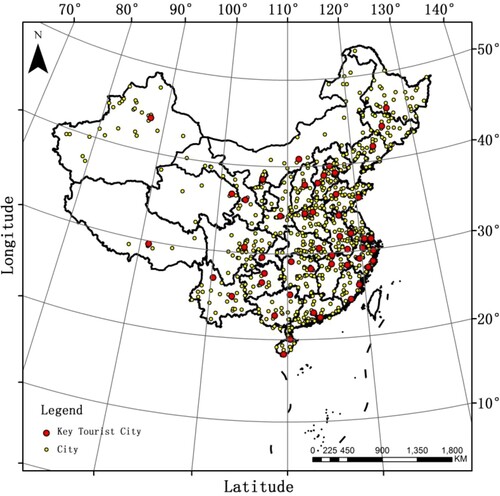
In this research, the mainland of China and Hainan Island were used as the research area; this area covers the approximate latitudes 73° 33′ E–135° 5′ E and longitudes 18° 9′ N–53° 33′. Using the administrative division data issued by the Ministry of Civil Affairs of the People’s Republic of China in 2020 (http://www.mca.gov.cn/article/sj/xzqh/2020/) as a reference, an analysis of the temporal and spatial characteristics of the suitability of the environment for tourism was conducted for 4 municipalities, 293 prefecture-level cities, and 387 county-level cities (684 cities in total). Prefecture-level and county-level cities are part of China’s system of administrative divisions. Municipalities and county-level cities are generally true urban areas, whereas county-level cities are essentially rural. The center of a county-level city is referred to as the county town and has certain urban characteristics. The areas outside the county in a county-level city consist of countryside. The differences in the suitability of the environment between these different types of city were one of the aspects considered in the study. After considering the number of inbound tourists and the inbound tourism revenue for different cities provided in the Yearbook of China Tourism Statistics 2019, 50 key tourist cities were selected for study, namely Beijing, Tianjin, Baoding, Chengdu, Fuzhou, Guangzhou, Guiyang, Guilin, Harbin, Haikou, Hangzhou, Hefei, Hohhot, Huangshan, Jinan, Jinhua, Jiujiang, Kunming, Lhasa, Lanzhou, Lijiang, Luoyang, Nanchang, Nanjing, Nanning, Ningbo, Qingdao, Sanya, Xiamen, Shanghai, Shangrao, Shenzhen, Shenyang, Shijiazhuang, Suzhou, Taizhou, Taiyuan, Wenzhou, Urumqi, Wuhan, Xi’an, Sining, Xuzhou, Yinchuan, Zhangjiajie, Changchun, Changsha, Zhengzhou, Chongqing and Zunyi. The research area and the distribution of these key cities are shown in . These 50 key cities were also selected to be evenly distributed and cover the eastern, central, and western regions of China. They can thus be considered representative of the spatial–temporal characteristics of the suitability of the environment for tourism in China.
Figure 1. Research area and spatial distribution of cities.
2.2. Data
From the indexes used for evaluating the natural environment for tourism used in previous studies on tourist health, those indexes that are directly related to tourist activities and tourist health were selected for use in this study. In previous studies, climate and vegetation conditions were mentioned the most (Zou and Zheng Citation2011; Xi et al. Citation2007; Cao et al. Citation2021). Therefore, climate amenity and vegetation conditions were included in the system of indexes used in this study. Environmental pollution and health factors are also factors that researchers both inside and outside of China have focused on. However, skin health problems, especially in relation to summer coastal tourism, have often been ignored in previous research (Peattie, Clarke, and Peattie Citation2005). This study comprehensively analyzed the suitability of the environment of Chinese cities for healthy and comfortable travel based on three aspects: climate suitability, suitability of the green environment and an assessment of effects on health. Five specific indexes were used: the Universal Thermal Climate Index (UTCI; units: K), total precipitation (PREC; m), Vegetation Leaf Area Index (consisting of the High Vegetation Leaf Area Index (LAIH; m2/m2) and the Low Vegetation Leaf Area Index (LAIL; m2/m2)), concentration of particulate matter with a diameter of no more than 2.5 μm (PM2.5; μg/m2), and downward UV radiation at the surface (UVB; J/m2). These indices were used as quantitative indicators of environmental suitability and represented the climate suitability, weather impacts, vegetation conditions, health of the atmospheric environment and the amount of radiation experienced.
To characterize climate conditions, previous studies have mostly used temperature and humidity. However, in the case of China, a country that spans a large range of latitudes and longitudes, there are obvious regional differences in tourist experience that can also result from a combination of the temperature and humidity. In order to account for these differences, in this study, one innovation was the use of the UTCI as a parameter. This index, which attempts to represent the level of human comfort, is based on the latest bioclimatological technology. The UTCI integrates various climate indicators, including the air temperature, wind, radiation and humidity and considers the intensity of different physiological reactions (including sweating, shivering, skin moisture, skin blood flow, as well as rectal, skin and face temperatures) under different combinations of these indicators. The UTCI can thus be used to characterize the thermal stress and degree of comfort experienced by the human body under outdoor environmental conditions. This index is directly related to people’s feelings and reactions, and is applicable to all climates, seasons and scales and is a much better way of evaluating the suitability of the environment than the use of single indices such as the air temperature or humidity.
Since precipitation and other weather conditions have a great impact on tourist activities, particularly outdoor activities, the precipitation can be used as an index to measure the suitability of the weather for tourism. In establishing a threshold for precipitation, the degree to which precipitation influences tourist activities should be fully considered, and the segmentation is processed to as far as possible correspond to the degree to which precipitation affects tourist activities. The total precipitation can be used to characterize the impacts of adverse weather on tourist activities. Precipitation affects tourist activities to varying degrees – light precipitation may have only a minor impact, but heavy rainfall can make the environment completely unsuitable for tourist activities. Therefore, in this study, the total precipitation was used to quantify the impact of precipitation on the suitability of the environment for tourism.
To describe vegetation conditions, previous researchers mostly used rough, time-limited data such as the vegetation coverage rate or the area of green space per capita. These data usually had a specific value for a given city for a given year, and interpolation or trend analysis had to be used to deal with any missing data, thus greatly affecting the accuracy of the evaluation. In this study, vegetation leaf area indexes – the shrub leaf area index and tree leaf area index – were used to characterize the vegetation. These data were available for every month of the year, and the spatial resolution of the data was as high as 1 km × 1 km. This is a much higher precision than that of traditional statistical yearbook data. The Vegetation Leaf Area Index – i.e. the vegetation leaf area expressed as a percentage of the land area – is the generally preferred index for characterizing vegetation conditions. In this study, a combination of the High Vegetation Leaf Area Index and the Low Vegetation Leaf Area Index was used to characterize the vegetation environment. The High Vegetation Leaf Area Index mainly simulates the growth of vegetation such as evergreen and deciduous trees, whereas the Low Vegetation Leaf Area Index mainly simulates the coverage of grassland, irrigated crops, shrubs, etc. This combined use of the LAIH and LAIL in the evaluation of the suitability of the environment for tourism aimed to reflect the respective influences of trees and shrubs in different regions, thereby providing more detailed information for future optimized decision-making.
As people’s ideas about healthy travel become increasingly mature, a clean atmosphere has become one of the important criteria that tourists use in the selection of destinations. Atmospheric particulate matter is currently the primary factor affecting air quality in China. These particles can enter the human body’s circulatory system through the respiratory tract and cause harm to health (Lim et al. Citation2012). In previous studies, the number of days when air quality met a particular standard was used to characterize air pollution; these data are very rough as there is only one value per year. There may also be some differences between the indexes used by different cities, some of which use the AQI for evaluating air quality, whereas others use the PM2.5 and PM10 concentrations. As a result, comparisons between different places in previous studies involved a great deal of uncertainty. In this study, the most commonly used air quality indicator – the PM2.5 concentration –was used to represent the air quality. Daily data with a spatial resolution of 1 km × 1 km were used; this allowed more accurate evaluation and simulation of the local environment from a health perspective and demonstrates the importance of health factors to the study.
In order to remedy the lack of attention previously paid to skin health, one innovation in this study was to include the amount of ultraviolet radiation as a health indicator. Ultraviolet radiation is one of the main health factors that tourists are concerned about (Franco, Shani, and Poria Citation2021), especially in summer when ultraviolet radiation is strong. This is often a particular consideration for female tourists, who are more concerned about skin health. UV radiation can damage skin cells and even increase the risk of skin cancer (Savoye et al. Citation2017). In the existing literature on the suitability of the environment in particular places for tourists, the danger of skin damage is rarely taken into account (Durand et al. Citation2020). In this study, the amount of downward UV radiation at the surface was used to characterize the impact of ultraviolet radiation on the skin.
The values of the UTCI, Vegetation Leaf Area Index and total precipitation and downward UV radiation at the surface were obtained from the European Centre for Medium-Range Weather Forecasts (ECMWF) ERA5 reanalysis dataset (https://www.ecmwf.int/en/forecasts/datasets/reanalysis-datasets/era5). The ERA5 dataset uses advanced models and data assimilation systems to incorporate a large amount of historical observation data into global estimates to provide reanalysis data for atmospheric, land and marine climate variables. Daily values of all the parameters that were the focus of this study – UTCI, PREC, LAI (LAIH and LAIL), PM2.5 and UVB – were used. However, since the day-to-day changes in the leaf area index are not large, the daily LAI (LAIH and LAIL) data were actually obtained from the ERA5 monthly LAI data. ERA5 daily data were used for the UTCI and for PREC; for UVB, the data for 6:00 UTC (14:00 Beijing time) were extracted from the ERA5 hourly data. This time corresponds to the time of day when the UV rays are strongest and so was considered appropriate for measuring the damage to the skin caused by UV rays. The PM2.5 data were acquired from the real-time urban air quality release platform (http://106.37.208.233:20035/); the inverse distance weighting (IDW) spatial interpolation algorithm (Setianto and Triandini Citation2013) was applied to these data to give the daily PM2.5 values for the research area. The data used in this study covered the whole of the year 2019.
The data used in this research had high temporal and spatial resolutions. With the exception of the monthly LAI data, the data used were daily data and had a spatial resolution of 1 km × 1 km. These data were either generated using the most advanced data assimilation systems or were based on field measurements; the quality and precision of the data were high. Compared with annual data, such as that available in statistical yearbooks, these data provided more information and were more reliable. This allowed the results of the evaluation of the suitability of local environments for tourism that was carried out in this study to be more detailed and, therefore, to provide more powerful support to decision-makers.
3. Method
This study selected indices relevant to healthy and comfortable travel: the UTCI, Vegetation Leaf Area Index, total precipitation, downward UV radiation at the surface and PM2.5. The coupled Delphi–AHP–TOPSIS (Delphi–Analytic Hierarchy Process–Technique for Order Preference by Similarity to Ideal Solution) algorithm was then used to carry out a comprehensive evaluation of the suitability of the environment in different Chinese cities for tourism.
3.1. Development of an index system for evaluating the suitability of the environment for tourism based on the Delphi method
After considering the scope of indicators used in previous research, we developed a customized index system for use in this study. This system included climate conditions (climate elements: temperature and humidity; weather conditions: PREC), vegetation conditions (vegetation cover status: LAI; vegetation greenness: NDVI), environmental risks (smog health risk: PM2.5, PM10; ultraviolet radiation risk: UVB).
The Delphi method was used to carry out expert evaluation. Ten experts participated in the Delphi consultation. These experts had backgrounds in tourism geography (three), tourism management (three), tourism ecology (two) and population geography (two); three were professors, four were associate professors and three were lecturers.
The experts evaluated the preliminary indicator system consisting of ecological and environmental factors and gave an approval score to each indicator ranging from strongly agree (5) to strongly disagree (1). The experts were required to put forward their own opinions and suggestions on the structure and detail of the index system and measurement indexes. All 10 of the questionnaires sent out in the first phase were returned. The two first-level indicators – climate conditions and vegetation conditions – received a high degree of recognition from the experts: both indexes had an average score of over 3.5 and a soundness of below 1, indicating that the expert scores were relatively concentrated. However, the PM10 index received a score of less than 2.8 (). The following points were made by the experts. (1) The focus of this study is on the evaluation of the environment from the perspective of tourists’ health; a health impact assessment should, therefore, be used instead of an assessment of the level of environmental risk. (2) As there is some overlap between the vegetation cover and vegetation greenness in terms of their ability to representing vegetation conditions, the vegetation cover should be adopted as a more representative indicator. (3) In the representation of climate elements, the most advanced UTCI, which combines temperature and humidity, could be used to provide a better measurement standard for representing the sensation of comfort. (4) There are some overlaps between the PM2.5 and PM10 indexes, and the impact of PM10 on health is far less than that of PM2.5; therefore, only one of these indexes should be used.
Table 1. Questionnaire results of Delphi index system building in the first stage.
Based on the experts’ opinions, we adjusted the index system and parameter selection and adapted the questionnaire used in the second stage. The purpose of the second questionnaire was mainly to solicit the experts’ opinions on the adjusted system: a rating system ranging from strongly agree (5) to strongly disagree (1) was again used. As before, of the 10 questionnaires that were sent out, 100% were returned. In the second round, all of the indicators received a score of above 3.5, indicating that the proposed system could be considered reliable. However, the experts also put forward some further suggestions for modifying the system: (1) the climate and vegetation conditions should be classified as higher-level indicators of the natural environment, and health effects should be classified as indicators of health impacts. (2) Based on the focus of this study, the terms ‘dimension’, ‘sub-dimension’ and ‘indicator’ should be modified to make them more consistent with the characteristics of this study. After receiving these expert opinions, further refinements to the index system were made and the revised system was fed back to the 10 experts, who all expressed satisfaction with the results. Thus, the final index system and measurement standards were determined; these are shown in .
Table 2. Index system for evaluating the suitability of the environment for tourism with levels of expert approval for different indicators.
3.2. Weights assigned for use in the Delphi–AHP algorithm for determining the suitability of the environment for tourism
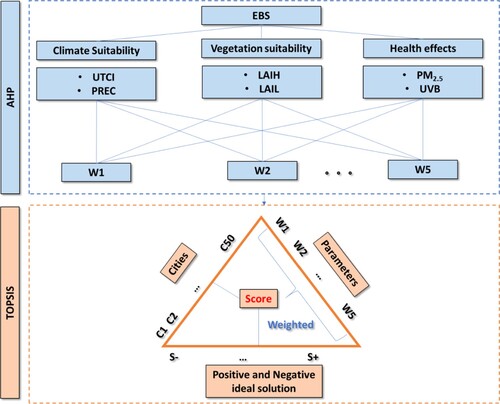
The analytic hierarchy process is a multi-criteria decision-making method that generally includes a target layer, a criterion layer and a sub-criteria layer. The key to AHP is to establish an appropriate hierarchical model based on the actual problem and the influencing factors (Dong and Thomas Citation2014). In the AHP, a problem is decomposed into sub-problems; the solutions to these sub-problems are then aggregated into one conclusion. In this study, the overall decision-making target was the suitability of the environment for tourism. Therefore, in this case, the criterion layer included the climate conditions, vegetation conditions and health effects; the decision-making factors used in the sub-criterion layer were the UTCI, PREC, LAI (LAIH and LAIL), PM2.5 and UVB. Each of these factors had a weight, W, as shown in . The AHP provided a structured framework for evaluating the suitability of the environment. Using the Delphi expert consultation method, a scale with values of 1–9 (Goepel Citation2019) was constructed, and pairs of factors were compared to quantify priorities and to test for consistency. If the consistency test failed, the results were fed back to the experts; a second round of scoring was then performed by the Delphi experts and, subsequently, an AHP consistency test was carried out. This process was repeated until a consistent pairwise comparison matrix was obtained. Finally, calculations were carried out to obtain the weight of each factor. The detailed steps used in these calculations were as follows.
Figure 2. Technology roadmap of the AHP–TOPSIS algorithm.
Let P1, P2, … Pm represent the index parameters, and W1, W2, … , Wm be the normalized weight vectors of the parameters that satisfy Equation (1):
(1)
(1)
Using the Delphi method, based on expert consultation, the relative importance of each index parameter, P, to the suitability of the environment was obtained. This importance was quantified using the scale described in .
Table 3. Judgment matrix scale.
The 10 experts in tourism that were mentioned earlier were invited to compare the importance of pairs of factors. The average values of the scores given by experts were then used to construct an m × m pairwise comparison matrix (Equation (2)):
(2)
(2) where aij represents the ratio of the weight of parameter Pi to that of parameter Pj (Wi/Wj); aii = 1; aij = 1/aji; i, j = 1, 2, … , m.
If any random i, j, k = 1, 2, … , m in the pairwise comparison matrix, A, satisfy aij = aikakj, then A is called a completely consistent matrix; otherwise, it is an incompletely consistent matrix. The weight vector, W, can be obtained by solving Equation (3) (Goepel Citation2019):
(3)
(3) where λmax is the largest eigenvalue of the pairwise comparison matrix, A. The consistency of A needs to be within an acceptable range; this consistency can be tested using the consistency ratio, CR:
(4)
(4) where RI is the average random consistency for matrices of the same order, which can be obtained by looking up the table. If CR ≤ 0.1, this indicates that the consistency of the constructed pairwise comparison matrix is acceptable; otherwise, the pairwise comparison matrix needs to be reconstructed until a more consistent one is obtained. Finally, after three rounds of expert evaluation and scoring, a relatively consistent matrix was obtained for UVB, LAI, PM2.5, UTCI and PREC:
(5)
(5)
Using the algorithm described above, the weight vectors for the parameters UTCI, PREC, LAIH, LAIL, PM2.5 and UVB were then obtained: [0.2636, 0.5109, 0.0366, 0.0366, 0.1155, 0.0368].
3.3. Evaluation of the suitability of the environment for tourists based on the Delphi–AHP–TOPSIS method
The TOPSIS method was used to refine the rough index values obtained by using the AHP algorithm. The main idea of the TOPSIS method is to define the ideal positive and negative solutions to a problem, calculate the distances from the parameter to these ideal solutions, sort the parameters and then use appropriate scores to evaluate the samples. In this study, scores were calculated for UTCI, PREC, LAIH, LAIL, PM2.5 and UVB using the TOPSIS algorithm; then, with the help of the Delphi–AHP method, the weight of each parameter was obtained (see Section 3.1). Finally, scores representing the suitability of the environment for tourism were obtained for the 684 Chinese cities that were the subject of this study. Details of the individual steps of the TOPSIS algorithm follow below.
First, all of the parameter samples were normalized in order to remove the dimensional effects of the parameter samples on the model; all the parameters values were then converted into positive ones in order to ensure that the effects of the parameter values on the evaluation of the environmental suitability all worked in the same direction. For example, LAIH and LAIL are positive indices; that is, the larger, their values the better; PM2.5 and UVB are negative indices, that is, the smaller their values the better. The UTCI is a staged index. The document that defines the UTCI states that no thermal stress is experienced in the temperature range 9–26°C, whereas thermal stress will be felt if the temperature is above 26°C or below 9°C. Therefore, temperature samples within the range of 9–26°C were defined as being optimal UTCI samples. Samples below 9°C were normalized to give positive values; those above 26°C were inverted to give positive values. PREC is a threshold-type index and is this study had a threshold set at ‘heavy rain’ (8 mm/h), meaning that it was considered that precipitation exceeding 8 mm/h made the environment completely unsuitable for tourist activities. After positive normalization, this threshold value was 0. For precipitation less than or equal to 8 mm/h, the values were inverted to give positive ones. The specific formulae used to make these conversions were (Equation (6))
(6)
(6) where xi is the value of the parameter sample to be positively normalized and xmax and xmin are the maximum and minimum values of the parameter, respectively.
The parameter values were normalized to reveal the distribution of each parameter within the sample population. The formula used for this was (Equation (7))
(7)
(7) where xN,STD is the standardized sample value,
is the normalized sample value mentioned above, and xmean and xstd are the mean and standard deviation of the samples, respectively.
The distances from the sample value to the positive and negative ideal solutions were then calculated (Equation (8)):
(8)
(8) Here,
and
are the distances to the positive and negative ideal solutions, and Si+ and Si− are the positive and negative ideal solutions, respectively,
. i is the specific sample number, and n is the number of samples.
The closeness was calculated using Equation (9):
(9)
(9) where ξ is the sample score.
Finally, the weighted sum of the parameter sample scores was calculated using the TOPSIS algorithm and the weight vector, W, for each parameter obtained that was obtained by the Delphi–AHP algorithm. The result was the final total score for the suitability of the environment for tourism as obtained by the Delphi–AHP–TOPSIS method (Equation (10)):
(10)
(10) where the EBS (Environmental Suitability Score) is a score in the range [0, 100]. This score was then used to compare the suitability of the environments of different Chinese cities for tourism.
4. Analysis of results
4.1. Temporal–spatial characteristics of the suitability of the environment in Chinese cities for tourism
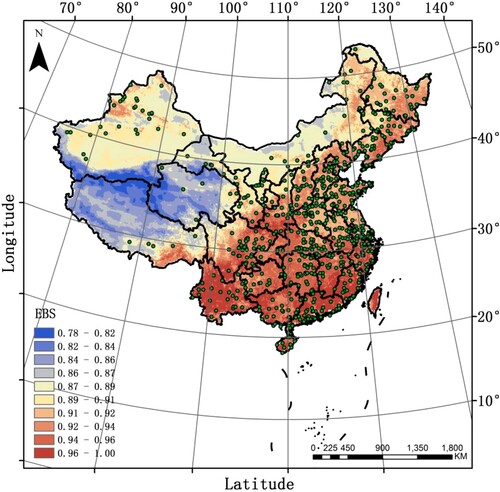
Using the AHP–TOPSIS algorithm, a score representing the annual average suitability of the environment in 684 cities in China for tourism was obtained for the year 2019. The spatial distribution of the results is shown in . Clear differences in the suitability of the environment can be seen: generally, cities in eastern and southern China have the highest environmental suitability, those in the north and northeast have a relatively high suitability, and those in inland northwestern regions have a low suitability. These patterns in environmental suitability are closely aligned with the major geographical boundaries within China. For example, there are significant differences in environmental suitability between the areas lying to the south and to the north of the Qinling Mountains–Huaihe River line. The area south of this line has better vegetation coverage, longer periods of suitable temperatures, weaker UV radiation and less air pollution. Together, these positive factors lead to the area south of the Qinling Mountains–Huaihe River line having the highest environmental suitability. In the north of China, air pollution is relatively serious and vegetation coverage is low, and this affects the suitability of the environment in this area. Northeast China has high vegetation coverage; however, due to the low temperatures experienced here, the environment is less suitable for tourism than that in southern China. There are also significant differences in environmental suitability between the areas to the east and to the west of the Heihe River–Tengchong line. As a result of the influence of the altitude, topography and proximity to the sea, the vegetation coverage, temperature and ultraviolet intensity in the area east of the Heihe River–Tengchong line produce an environment that is more suitable for tourism than the areas to the west. This line thus forms a clear dividing line in terms of environmental suitability.
Figure 3. Spatial distribution of the annual average suitability of the environment for tourism in China in 2019.
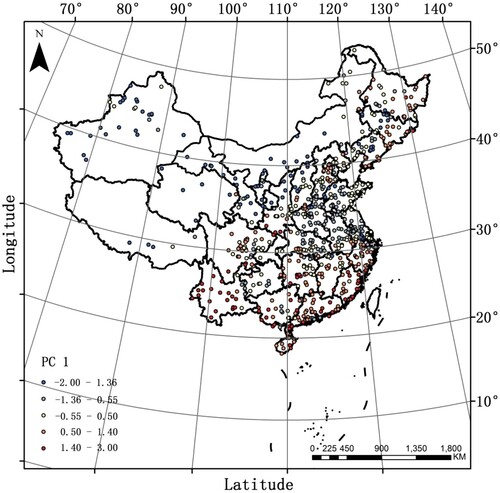
Principal component analysis was performed on the different indexes – i.e. UTCI, PREC, LAI (LAIH and LAIL), PM2.5 and UVB – for the 684 Chinese cities. There were three principal components; the contribution of the first principal component (PC1) was 63.45%. The scores for the first principal component for the 684 cities are shown in . It can be seen that PC 1 is mainly affected by the temperature, vegetation coverage and air pollution. There is some spatial correlation in the scores – the principal component scores for neighboring cities are similar and display certain geographical patterns. For example, the first principal component scores of the coastal cities in Yunnan, Fujian and Guangdong are similar and among the highest, whereas there are differences between the scores of the cities in southern China, those that lie on the North China Plain and cities in inland northwestern regions, indicating that environmental factors have different effects in different regions. The spatial distribution of the principal component (environmental factors) scores for the 684 cities is different from that of the EBS (). Some cities have similar EBS scores but different PC 1 scores. For example, the urban area of Beijing and the neighboring cities in Hebei Province have a similar EBS, but Beijing’s PC 1 score is higher than that of these neighboring cities. The reason for this is that Beijing has a higher proportion of green space, and so its LAIH and LAIL are significantly higher than those of the surrounding areas. In addition, the PC 1 scores of the cities on the Shandong peninsula are quite different from those of cities in Shandong that lie further inland, mainly because the hilly areas in Shandong have better vegetation coverage and suffer less from environmental pollution. The principal component analysis also shows that there are regional differences in the contributions of different environmental factors to the EBS. This in-depth analysis of the effects of different factors on the EBS helps to clarify the factors that affect the suitability of the environment in different cities for tourism and provides information that can be used to improve the environment.
Figure 4. First principal component scores of 684 cities in China.
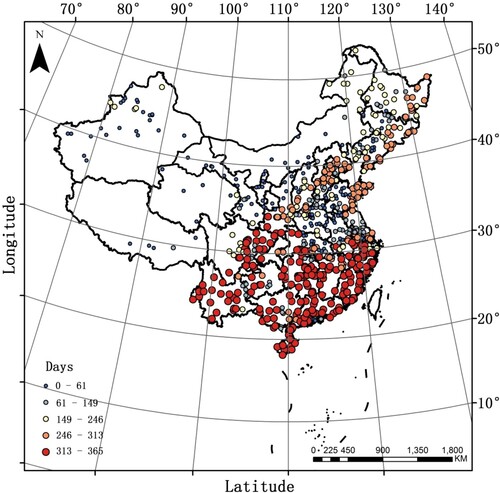
The number of days when the environmental suitability was higher than the national average (EBS > 93.67) for the 684 different cities in 2019 is shown in . It can be seen that, again, there are obvious regional differences in the length of time that was suitable for tourist activities. Cities in southern China lying to the south of the Qinling Mountains–Huaihe River line had more than 300 days that were suitable for tourist activities, showing that they have favorable environmental conditions for the development of tourism. In addition, cities near to a line connecting Xi’an and Beijing and those along a line from the Shandong Peninsula to the three provinces of Northeast China also had a high number of days that were suitable for tourism – in the range 250–300 days. However, other cities that lie on the North China Plain have a relatively low suitability for tourism – the number of days in 2019 that were suitable for tourist activities was less than 150 in most cases and no higher than 250. This means that the environment in most cities on the North China Plain was not suitable for tourist activities for more than half the year. There is, therefore, still a lot to do to improve the suitability of the environment in the north of China for tourism. The cities on the North China Plain have abundant cultural and natural resources, including the Beijing–Hangzhou Grand Canal and ancient towns. However, the environment in this part of China is not favorable for the healthy and sustainable development of tourism. Therefore, it is imperative to carry out targeted environmental measures based on the characteristics of the tourist environment. In the case of the inland cities in the northwest of China, the time period suitable for tourist activities is very short – less than 60 days in 2019 – and is limited by natural environmental conditions. For these areas, the key to the development of tourism is to plan tours according to the time periods that are suitable for tourism; the marketing of tourism in these areas should also reflect this.
Figure 5. Number of days suitable for tourism in the 684 cities across China.
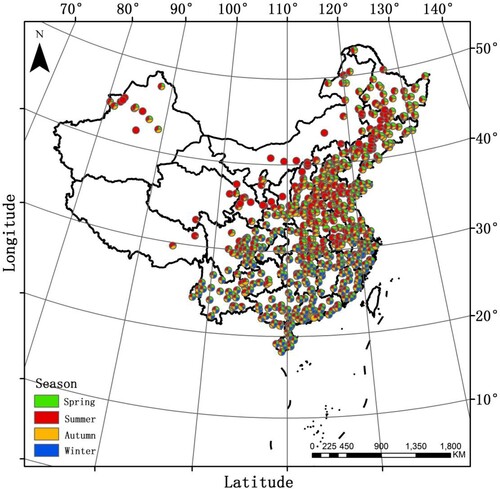
In order to gain a deeper understanding of the temporal distribution of the suitability of the environment in China for tourism, statistics were derived for the proportion of days in each season that can be considered suitable for tourism (). It was found that cities can be roughly divided into three groups in terms of their seasonal suitability. Cities in the south of China are suitable for tourist activities throughout the year, and the number of suitable days are evenly distributed across the four seasons. These cities are thus very suitable for the development of types of tourism that have high environment requirements, such as wellness tourism and ecological tourism. The cities on the North China Plain as well as some cities on the Northeast China Plain are suitable for tourist activities in the spring, summer, and autumn but not suitable for most of the winter, and have significantly more suitable days in summer than in spring and autumn. This is due to the air temperature and the serious environmental pollution caused by heating systems in winter. Cities in Inner Mongolia, Gansu, Xinjiang and other inland northwestern inland regions are generally suitable for tourism only in summer. However, there are some oasis cities in Xinjiang that are also suitable for tourism both in summer and autumn, which means that these areas should make use of these time windows to develop ‘exotic’ tourist activities.
Figure 6. Seasonal proportions of the days suitable for tourism in the 684 cities across China.
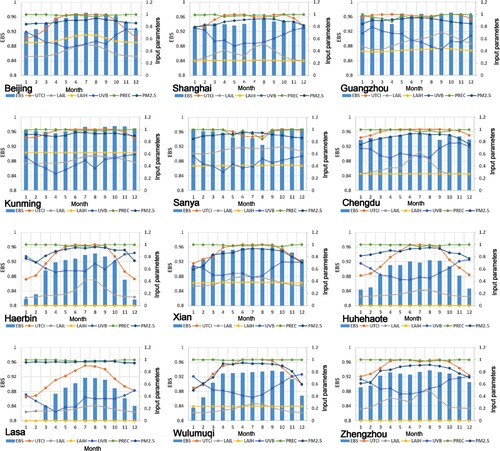
The monthly values of the environmental suitability for tourism and of environmental factors were also analyzed for 12 cities, namely Beijing, Shanghai, Guangzhou, Kunming, Sanya, Chengdu, Harbin, Xi’an, Hohhot, Lhasa, Urumqi and Zhengzhou (). In order to remove dimensional effects, the results (the value x(N,STD) after the positive conversion described in Section 3.2) for UTCI, PREC, LAIH, LAIL, PM2.5 and UVB were normalized to the range [0,1]: the higher the value, the more helpful the parameter to the improvement of the environmental suitability. The EBS scores were also divided by 100 so that they fell within the range [0,1]: the higher the EBS, the higher the environmental suitability. The monthly EBS scores exhibit obvious regional characteristics: Kunming’s EBS does not change much throughout the year and is always relatively high. For Sanya and Chengdu, the environmental suitability falls to its lowest point in August and September; whereas Guangzhou’s and Shanghai’s EBS are low in April and May. Other cities, such as Beijing, Harbin, Xi’an, Hohhot, Lhasa, Urumqi and Zhengzhou, are typical in that they are suitable for tourism in summer but not in winter and spring. Different environmental factors have different effects on the suitability of the environment. The effect of precipitation on the environmental suitability does not change much from month to month except for some cities such as Sanya that are affected to a certain extent. The UTCI greatly affects the suitability of Beijing, Harbin, Xi’an, Hohhot, Lhasa, Urumqi and Zhengzhou for tourism in winter. The effects of PM2.5 are mostly felt in winter and spring, particularly in cities such as Harbin, Xi’an, Urumqi, Zhengzhou, and Chengdu. The UVB affects the environment of all cities in summer. LAIL contributes positively to the suitability of the environment in all cities in summer whereas there is not much change in the contribution of LAIH from month to month.
Figure 7. Monthly average values of the EBS and normalized parameters (UTCI, PREC, LAIH, LAIL, PM2.5 and UVB) for 12 selected cities.
4.2. Analysis of the optimization of the environment for tourism
By applying the AHP–TOPSIS algorithm proposed in this research and using UTCI, PREC, LAIH, LAIL, PM2.5 and UVB as the parameters, daily scores for the suitability of the environment for tourism (EBSs) were calculated for 50 representative cities in 2019. The average EBS for 2019 was then calculated for each city and used as the indicator for determining the environmental suitability of these cities. The normalized standardized results for UTCI, PREC, LAIH, LAIL, PM2.5 and UVB – that is, the standardized values obtained using the AHP–TOPSIS algorithm – reflect the contributions of these six parameters to the EBS: the higher the value, the greater the contribution. A comprehensive ranking of these 50 representative tourist cities based on the EBS was then produced for 2019 (). The standardized results for the six factors (UTCI, PREC, LAIH, LAIL, PM2.5 and UVB) were also compared: the parameter with the largest value made the greatest positive contribution to the EBS; conversely, the parameter with the smallest standardized value made the smallest contribution to the EBS and was the limiting factor in terms of environmental suitability. Using this method, the positive and limiting factors in terms of the suitability of the environment were identified for these 50 cities. These results provide further information on which decision-making related to the development of tourism in these cities can be based.
Table 4. Ranking of 50 representative tourist cities in terms of environmental suitability in 2019.
In terms of environmental suitability, the top five tourist cities were found to be Kunming, Xiamen, Lijiang, Guangzhou and Jinhua, which are located in Yunnan, Fujian, Guangdong and Zhejiang provinces, demonstrating that cities in the southwest and in southeastern coastal areas of China have the best environment. The bottom five cities were Changchun, Urumqi, Hohhot, Sining, and Lhasa, which are located in Jilin, Xinjiang, Inner Mongolia, Qinghai and Tibet, respectively. In general, cities in northeast and northwest China have much lower environmental suitability than those in the southeastern coastal areas of China.
The comparative analysis of the factors that benefit the environmental suitability of tourist cities and of the limiting factors showed that precipitation is the main factor that limits the environmental suitability of southeastern coastal cities such as Sanya, Fuzhou and Ningbo, especially in summer, as, during this period, the concentrated rainfall makes these areas much less suitable for tourist activities. PM2.5 is the main factor affecting the environmental suitability of cities like Beijing, Xi'an and Chengdu. In these areas, smog is common throughout the year and significantly affects the experience of tourists. Cities such as Hefei, Sining, and Hohhot have low coverage by high or low vegetation, which clearly affects their suitability for tourism. Kunming and Lhasa are significantly affected by the amount of UV radiation. Sanya, Sining and Lhasa have good air quality, which is an advantage in terms of their suitability for tourism. Kunming, Guilin and Huangshan have good vegetation coverage, which is of significant help to their environmental suitability. For Nanning, Chengdu and Chongqing the UTCI values are moderate, which is also an advantage. Northeastern cities such as Shenyang, Harbin and Changchun benefit from having relatively low amounts of UV radiation.
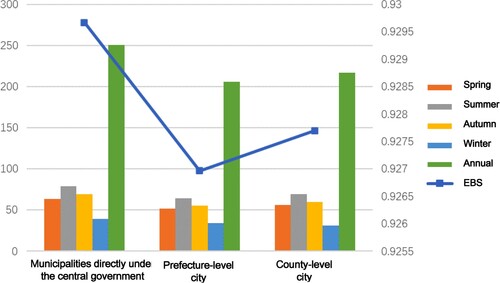
The average values of the tourist environmental suitability scores (EBSs) of 4 municipalities directly under the central government, 293 prefecture-level cities and 387 county-level cities and the number of days suitable for tourist activities in each season and throughout the year in each city were then calculated (). According to the results, both the EBS and number of days suitable for tourist activities are generally higher for the municipalities than for the county-level cities and higher for the county-level cities than the prefecture-level ones. The vegetation and environmental conditions in municipalities have been significantly improved during the process of modern urban planning and governance, making municipalities far superior in terms of environmental suitability and the number of days suitable for tourism. Compared with prefecture-level cities, the climate and environmental conditions in county-level cities are less affected by urbanization and industrialization, which makes county-level cities slightly more suitable for tourism than prefecture-level cities. The number of days suitable for tourist activities exhibits relatively consistent seasonal patterns. Generally, summer has the most days suitable for tourist activities, followed by autumn, spring and winter. Strengthening the environmental governance of prefecture-level cities and increasing vegetation coverage are important ways of improving the suitability of their environments for tourism.
Figure 8. Differences between the environmental suitability of cities at different administrative levels.
5. Conclusions
In this study, a comprehensive evaluation of the suitability of the environment in 684 cities in China for tourism in 2019 was conducted using the Delphi–AHP–TOPSIS algorithm. In this evaluation, UTCI, PREC, LAI (LAIH and LAIL), PM2.5 and UVB were used as indices to quantify the degree of comfort related to the temperature, the effects of the weather, vegetation, air quality and UV radiation. A comparative analysis of the seasonal changes in the environmental suitability of 684 cities in China for tourism was also conducted, and 50 representative cities were ranked according to their environmental suitability. The factors that were of benefit to the environment in each city as well as the limiting factors were extracted. Based on these positive and negative factors, strategies and focuses for improving the environment in different cities were proposed.
Obvious geographical differences were found in the suitability of different cities in China for tourism. The environmental suitability was found to be highest in cities in the east and south of China, relatively high in northern and northeastern China and low in inland northwestern regions. These results are in line with the evaluation of ecotourism in China carried out by Geng et al. (Citation2019). The suitable periods for tourism and the number of days suitable for tourism in different seasons in China both exhibited obvious regional characteristics. Generally, cities in the south of China are more suitable for tourism than cities in the north and northeast of China, which, in turn, are more suitable than cities in inland northwestern parts of the country. Cities in the north of China, therefore, still have a lot potential for improving the suitability of their environments for tourists.
Tourist cities in the southwest of China and in southeastern coastal regions have the best environments. The top five cities were found to be Kunming, Xiamen, Lijiang, Guangzhou and Jinhua. The cities with the least suitable environments are Changchun, Urumqi, Hohhot, Sining, and Lhasa. Cities in the northeast and northwest of China are thus much less suitable for tourism than those in southeastern coastal areas.
There are differences in the suitability of the environment for tourists between municipalities directly under the central government, prefecture-level cities and county-level cities. Generally speaking, municipalities are more suitable for tourist activities than county-level cities, and county-level cities are more suitable than prefecture-level ones. Strengthening the environmental governance of prefecture-level cities and increasing their vegetation coverage are important ways of improving the environmental suitability of cities at this level.
The effects of weather conditions, vegetation and health-related factors, especially PM2.5, UVB and LAIL, on the suitability of the environment in different typical tourist cities exhibit obvious seasonal changes. The south and southwest of China, as represented by Yunnan Province and the Pearl River Delta, has a relative high environmental suitability, whereas northwest China has a relatively low suitability due to contributions from various factors. PM2.5 is a key factor limiting the suitability of cities in China for tourism, so controlling the air quality is an effective way of improving their suitability.
6. Discussion
With the aim of benefiting the interests and health of tourists, in this study, impacts on health related to climate, vegetation and the environment were used as indices to evaluate the environmental suitability of cities in China. In order to successfully achieve this goal, in this study, the advantages of the AHP and TOPSIS algorithms were combined and a new Delphi–AHP–TOPSIS algorithm was constructed.
The UTCI has been widely investigated in research into the selection of thermal indicators (Blazejczyk et al. Citation2012), body heat transfer and temperature regulation (Fiala et al. Citation2012), dressing indexes (Havenith et al. Citation2012) and bioclimatic conditions (Ge et al. Citation2017; Dobek, Wereski, and Krzyżewska Citation2020; Rozbicka and Rozbicki Citation2020); however, it is rarely used as an indicator of the suitability of the environment for tourists. In this study, the most advanced form of the UTCI used in bioclimatology for the analysis of human comfort was used. Compared with individual indicators such as the air temperature and humidity, the UTCI is superior in its ability to evaluate the suitability of the environment for tourists (Zou Citation2018). In order to characterize the effect of solar radiation on the skin, the intensity of ultraviolet radiation (UVB) was also incorporated into the system of indexes that were used in this study, further demonstrating how the proposed system for evaluating the suitability of the environmental for tourism took tourists’ health into account.
In China, research on the suitability of the environment for tourism has mostly focused on particular areas, including ecologically fragile areas such as the Qinghai–Tibet Plateau (Zhou, Fang, and Su Citation2010), the Wusuli River (Zhong, Xiao, and Zhao Citation2002), the Hexi Corridor (Xiao Citation2018), specific provinces such as Jilin (Wang et al. Citation2020) and Guangxi (Gao Citation2019), or a few typical tourist cities (Gu et al. Citation2015). However, there have been few studies on the suitability of the environment in cities in China in general. Unlike previous studies, which mostly focused on prefecture-level administrative areas (Gu et al. Citation2015), this study evaluated the suitability of the environment in 684 cities across China for tourism. In this way, a better view of spatial patterns in environmental suitability that could provide more useful information for decision-making related to tourism could be gained.
The AHP–TOPSIS algorithm has been widely applied to the selection of tourist destinations (Hsu, Tsai, and Wu Citation2009; Önder and Sundus Citation2013) and in tourism cluster performance evaluation (Joshi, Sharma, and Singh Citation2020); however, it has rarely been applied to evaluations of the suitability of the environment for tourists. In this study, the Delphi–AHP–TOPSIS algorithm, which combines both subjective and objective evaluation, was developed. As well as being able to take into account the weight differences between different indices, this algorithm could also give objective suitability scores. Compared with objective evaluation methods such as the entropy evaluation method (Shen et al. Citation2013) and the CRITIC method (Rostamzadeh et al. Citation2018), this method was considered more appropriate and delivered more reliable evaluation results.
By taking into account various factors including comfort, tourist experience and health, in this study, a comprehensive evaluation of the suitability of the environment of 684 cities in China for tourism was conducted. This included a detailed comparative analysis of the temporal and spatial patterns in cities’ environmental suitability as well as the influencing factors. The results of this study will aid decision-making related to how to further improve the environment for tourists, help tourists to select destinations and help to improve the environment for tourists in general. In future research, based on the results of this study, predictive analysis and research on the suitability of the environment of cities in China for tourists should be carried out with a view to providing tourists, travel companies and governments with appropriate predictions and forecasts.
Acknowledgements
We would like to acknowledge the ECMWF ERA5 for funding the development and analysis of the UTCI, PREC, LAI and UVB products. Particular thanks are also due to the China Urban Air Quality Real Time Release Platform team for granting free access to the ground-based PM2.5 data and their calibration and maintenance. We also want to express our sincere gratitude to the anonymous reviews and editors for their efforts to improve the paper.
Disclosure statement
No potential conflict of interest was reported by the author(s).
Additional information
Funding
References
- Ayhana, ÇK, T. C. Taşlıa, F. Özkökb, and H. Tatlıc. 2020. “Land Use Suitability Analysis of Rural Tourism Activities: Yenice, Turkey.” Tourism Management 76: 103949. doi: 10.1016/j.tourman.2019.07.003
- Barton, H., and G. Marcus. 2006. “A Health Map for the Local Human Habitat.” Journal of the Royal Society for the Promotion of Health 126 (6): 252–252. doi: 10.1177/1466424006070466
- Bidoux, L., J. P. Pignon, and F. Bénaben. 2019. “Planning with Preferences Using Multi-Attribute Utility Theory Along with a Choquet Integral.” Engineering Applications of Artificial Intelligence 85: 808–817. doi: 10.1016/j.engappai.2019.08.002
- Blazejczyk, K., Y. Epstein, G. Jendritzky, H. Staiger, and B. Tinz. 2012. “Comparison of UTCI to Selected Thermal Indices.” International Journal of Biometeorology 56: 515–535. doi:10.1007/s00484-011-0453-2.
- Brans, J. P. 1982. “Preference Ranking Organization Method for Enrichment Valuations (in French).” Vrije University Brussel, 183–213.
- Cao, Y., N. Zhang, X. Zhang, and J. Zhang. 2021. “Warning Dissemination and Public Response in China’s New Warning System: Evidence from a Strong Convective Event in Qingdao City.” Journal of Risk Research 25 (1): 67–91.
- Cheng, D., J. P. Lin, Z. J. Zhong, M. Q. Zhou, and Y. J. Han. 2020. “Climate Comfort of Cold Shelter Tourism in Kunming.” World Ecology 9 (1): 57–65. (In Chinese.)
- China Tourism Research Institute. 2012. China Tourism Dictionary. Shanghai: Shanghai Dictionary.
- Dhami, I., J. Deng, M. Strager, and J. Conley. 2017. “Suitability-Sensitivity Analysis of Nature-Based Tourism Using Geographic Information Systems and Analytic Hierarchy Process.” Journal of Ecotourism 16: 41–68. doi: 10.1080/14724049.2016.1193186
- Dobek, M., S. Wereski, and A. Krzyżewska. 2020. “Bioclimatic Conditions of Lublin Based on the Universal Thermal Climate Index (UTCI).” Miscellanea Geographica 24 (3): 118–127. doi:10.2478/mgrsd-2020-0025.
- Dong, Q. X., and L. S. Thomas. 2014. “An Analytic Hierarchy Process Model of Group Consensus.” Journal of Systems Science and Systems Engineering 23: 362–374. doi: 10.1007/s11518-014-5247-8
- Du, J. P., J. G. Shao, C. R. Zhou, and J. Sun. 2018. “Study on Reclamation Decision of Coal Mine Temporary Construction Land Based on Ecological Suitability and Triangle Model.” Journal of Natural Resources 33 (11): 1872–1885. (In Chinese.) doi: 10.31497/zrzyxb.20171063
- Durand, C., O. Catelinois, A. Bord, J. B. Richard, M. L. Bidondo, C. Ménard, and C. Delpierre. 2020. “Effect of an Appearance-Based vs. a Health-Based Sun-Protective Intervention on French Summer Tourists’ Behaviors in a Cluster Randomized Crossover Trial: The PRISME Protocol.” Frontiers in Public Health, 654.
- Faraji Sabokbar, H., A. Ayashi, A. Hosseini, A. Banaitis, N. Banaitienė, and R. Ayashi. 2016. “Risk Assessment in Tourism System Using a Fuzzy Set and Dominance-Based Rough Set.” Technological and Economic Development of Economy 22 (4): 554–573. doi: 10.3846/20294913.2016.1198840
- Fiala, D., G. Havenith, P. Bröde, B. Kampmann, and G. Jendritzky. 2012. “UTCI-Fiala Multi-Node Model of Human Heat Transfer and Temperature Regulation.” International Journal of Biometeorology 56: 429–441. doi: 10.1007/s00484-011-0424-7
- Franco, M., A. Shani, and Y. Poria. 2021. “Always the Sun: The Uniqueness of Sun Exposure in Tourism.” Tourism Review International 25 (1): 19–30. doi: 10.3727/154427220X16064144339165
- Gao, W. Q. 2019. “Study on the Suitability Evaluation of Regional Dwelling Environment in Guangxi.” Journal of Changchun University 29 (11): 1–6. (In Chinese.)
- Ge, Q., Q. Kong, J. Xi, and J. Zheng. 2017. “Application of UTCI in China from Tourism Perspective.” Theoretical and Applied Climatology 128: 551–561. doi:10.1007/s00704-016-1731-z.
- Geng, S. F., A. D. Guo, J. Yang, Y. Pei, L. V. Fang, B. X. Li, and J. C. Xi. 2019. “Comprehensive Evaluation on the Suitability of Green Tourism Base in China.” Geoscience 39 (9): 1507–1515. (In Chinese.)
- Goepel, Klaus D. 2019. “Comparison of Judgment Scales of the Analytical Hierarchy Process—A New Approach.” International Journal of Information Technology & Decision Making 18 (2): 445–463. doi: 10.1142/S0219622019500044
- Goodman, E. D., and Z. Liu. 2013. “AHP (Analytic Hierarchy Process) and Computer Analysis Software Used in Tourism Safety.” Journal of Software 8 (12): 3115.
- Gu, Y. Q., J. Yang, X. L. Feng, C. Li, and X. M. Li. 2015. “Spatial Differentiation of Tourism Environment Suitability of Typical Tourism Cities in China.” Geographic Science 35 (4): 410–417. (In Chinese.)
- Hafezalkotob, A., A. Hafezalkotob, H. Liao, and F. Herrera. 2019. “An Overview of MULTIMOORA for Multi-Criteria Decision-Making: Theory, Developments, Applications, and Challenges.” Information Fusion 51: 145–177.
- Havenith, G., D. Fiala, K. Błazejczyk, M. Richards, P. Bröde, I. Holmér, H. Rintamaki, Y. Benshabat, and G. Jendritzky. 2012. “The UTCI-Clothing Model.” International Journal of Biometeorology 56: 461–470. doi:10.1007/s00484-011-0451-4.
- Hsu, T. K., Y. F. Tsai, and H. H. Wu. 2009. “The Preference Analysis for Tourist Choice of Destination: A Case Study of Taiwan.” Tourism Management 30 (2): 288–297. doi: 10.1016/j.tourman.2008.07.011
- Joshi, R., D. K. Banwet, and R. Shankar. 2011. “A Delphi-AHP-TOPSIS Based Benchmarking Framework for Performance Improvement of a Cold Chain.” Expert Systems with Applications 38 (8): 10170–10182. doi: 10.1016/j.eswa.2011.02.072
- Joshi, S., M. Sharma, and R. K. Singh. 2020. “Performance Evaluation of Agro-Tourism Clusters Using AHP–TOPSIS.” Journal of Operations and Strategic Planning 3 (1): 7–30. doi:10.1177/2516600X20928646.
- Kaewrat, J., and R. Janta. 2021. “Health Risk Assessment of Residents in a Tourist City: A Case Study of Nakhon Si Thammarat Province.” Walailak Journal of Science and Technology 18 (5): 11510. doi: 10.48048/wjst.2021.11510
- Kiker, G. A., T. S. Bridges, A. Varghese, T. P. Sager, and I. Linkov. 2005. “Application of Multicriteria Decision Analysis in Environmental Decision Making.” Integrated Environmental Assessment and Management 1 (2): 95–108. doi: 10.1897/IEAM_2004a-015.1
- Kim, M., Y. C. Jang, and S. Lee. 2013. “Application of Delphi-AHP Methods to Select the Priorities of WEEE for Recycling in a Waste Management Decision-Making Tool.” Journal of Environmental Management 128: 941–948. doi: 10.1016/j.jenvman.2013.06.049
- Li, L., G. L. Hou, S. Y. Xia, and Z. F. Huang. 2020. “Spatial Distribution Characteristics and Influencing Factors of Leisure Tourism Resources in Chengdu.” Journal of Natural Resources 35 (3): 683–697. (In Chinese.) doi: 10.31497/zrzyxb.20200314
- Li, Y., Y. Xue, J. Guang, G. de Leeuw, R. Self, L. She, C. Fan, Y. Xie, and G. Chen. 2019. “Spatial and Temporal Distribution Characteristics of Haze Days and Associated Factors in China from 1973 to 2017.” Atmospheric Environment 214: 116862. doi: 10.1016/j.atmosenv.2019.116862
- Lim, S. S., T. Vos, A. D. Flaxman, G. Danaei, K. Shibuya, and H. Adair-Rohani. 2012. “A Comparative Risk Assessment of Burden of Disease and Injury Attributable to 67 Risk Factors and Risk Factor Clusters in 21 Regions, 1990–2010: A Systematic Analysis for the Global Burden of Disease Study 2010.” Aerosol Air Quality Research 380: 2224.
- Lin, J. P., H. Wang, B. Liu, Z. J. Zhong, and D. Cheng. 2019. “Research on the Driving Factors of Consumption Demand for Cold Shelter Tourism among the Elderly in China – Based on the Theory of ‘Push Pull’ Model.” Sustainable Development 9: 485–495. (In Chinese.) doi: 10.12677/SD.2019.93058
- Modica, G., M. Pollino, S. Lanucara, L. L. Porta, G. Pellicone, S. D. Fazio, and C. R. Fichera. 2016. “Land Suitability Evaluation for Agro-Forestry: Definition of a Web-Based Multi-Criteria Spatial Decision Support System (MC-SDSS): Preliminary Results.” Lecture Notes in Computer Science, 399–413. doi: 10.1007/978-3-319-42111-7_31
- National Patriotic Health Campaign Committee. 2018. “Evaluation Index System of Healthy Cities in China.”
- Önder, E., and D. A. G. Sundus. 2013. “Combining Analytical Hierarchy Process and Topsis Approaches for Supplier Selection in a Cable Company.” Journal of Business, Economics and Finance 2: 56–74.
- Peattie, S., P. Clarke, and K. Peattie. 2005. “Risk and Responsibility in Tourism: Promoting sun-Safety.” Tourism Management 26 (3): 399–408. doi: 10.1016/j.tourman.2003.11.020
- Rostamzadeh, R., M. K. Ghorabaee, K. Govindan, A. Esmaeili, and H. B. K. Nobar. 2018. “Evaluation of Sustainable Supply Chain Risk Management Using an Integrated Fuzzy TOPSIS – CRITIC Approach.” Journal of Cleaner Production 175: 651–669. doi: 10.1016/j.jclepro.2017.12.071
- Rozbicka, K., and T. Rozbicki. 2020. “Long-Term Variability of Bioclimatic Conditions and Tourism Potential for Warsaw Agglomeration (Poland).” International Journal of Biometeorology. doi:10.1007/s00484-020-01957-2.
- Sakieh, Y., A. B. Jabbarian, A. Danekar, J. Feghhi, and S. Dezhkam. 2015. “Scenario-Based Evaluation of Urban Development Sustainability: An Integrative Modeling Approach to Compromise Between Urbanization Suitability Index and Landscape Pattern.” Environment, Development and Sustainability 17: 1343–1365. doi: 10.1007/s10668-014-9609-7
- Savoye, I., C. M. Olsen, D. C. Whiteman, A. Bijon, L. Wald, L. Dartois, F. Clavel-Chapelon, M. C. Boutron-Ruault, and M. Kvaskoff. 2017. “Patterns of Ultraviolet Radiation Exposure and Skin Cancer Risk: The E3N-SunExp Study.” Journal of Epidemiology 28 (1): 27–33. doi: 10.2188/jea.JE20160166
- Sekhar, C., M. Patwardhan, and V. Vyas. 2015. “A Delphi-AHP-TOPSIS Based Framework for the Prioritization of Intellectual Capital Indicators: A SMEs Perspective.” Procedia – Social and Behavioral Sciences 189 (1): 275–284. doi: 10.1016/j.sbspro.2015.03.223
- Setianto, A., and T. Triandini. 2013. “Comparison of Kriging and Inverse Distance Weighted (IDW) Interpolation Methods in Lineament Extraction and Analysis.” Journal of South East Asian Applied Geology 5 (1): 21–29.
- Shen, J. H., Z. W. Yu, B. H. Zhou, and Z. Y. Shi. 2013. “Suitability Analysis and Countermeasures of Regional Hot Spring Tourism Development.” Journal of Natural Resources 28 (12): 2127–2138. (In Chinese.)
- Torrance, G. W., M. H. Boyle, and S. P. Horwood. 1982. “Application of Multi-Attribute Utility Theory to Measure Social Preferences for Health States.” Operations Research 30 (6): 1043–1069. doi: 10.1287/opre.30.6.1043
- Wang, L. M., J. X. Li, Y. Liu, and Y. Wu. 2020. “Climate Suitability Analysis of Summer Tourism in Jilin City.” Meteorological Disaster Prevention 2: 40–44. (In Chinese.)
- Wang, H., S. Yang, and W. Zhou. 2018. “Tourism Resources Evaluation and Sustainable Development Planning Based on AHP and PCA: A Case Study of Chongqing.” Science and Technology Innovation Guide 15: 107–111. (In Chinese.)
- World Tourism Organization. 2002. “Safety and Security in Tourism: Partnerships and Practical Guidelines for Destinations.”
- Xi, J. C., H. L. Liu, X. B. Qi, et al. 2007. “Study on Safety Risk Assessment Model of Tourist Destination – Taking 10 Key Adventure Tourist Routes in China as an Example.” Journal of Mountain 25 (3): 370375.
- Xiao, H. Z. 2018. “Evaluation of Ecotourism Suitability of Hexi Corridor Based on GIS.” Master’s thesis, Sichuan Normal University. (In Chinese.)
- Yang, C. Y., Q. Chen, Q. Yang, et al. 2021. “Correlation Analysis of Tourist Perception and Tourism Environmental Quality in the Horizon of Health Tourism.” Journal of Southwest Forestry University 5 (3): 99–102. (In Chinese.)
- Yang, J., Z. C. Zhang, X. M. Li, J. C. Xi, and Z. X. Feng. 2017. “Spatial Differentiation of China’s Summer Tourist Destinations Based on Climatic Suitability Using the Universal Thermal Climate Index.” Theoretical and Applied Climatology 134 (3-4): 859–874. doi: 10.1007/s00704-017-2312-5
- Yaralıoğlu, K. 2004. “Uygulamada karar destek yöntemleri, ilkem ofset.” Buca, İzmir.
- Yue, C. J., Z. W. Wu, T. X. Zheng, and X. L. Yi. 2010. “Evaluation of Tourism Competitiveness of Coastal Cities.” Journal of Natural Resources 25 (5): 795–801. (In Chinese.)
- Zhang, Z. X., W. N. Hao, X. H. Yu, G. Chen, S. J. Zhang, and J. Y. Chen. 2019. “Pythagorean Fuzzy Preference Ranking Organization Method of Enrichment Evaluations.” International Journal of Intelligent Systems 34: 1416–1439. doi: 10.1002/int.22101
- Zheng, Li. 2005. A Research on Science of Tourism Health. Central China Normal University, Master’s Thesis.
- Zhong, L. S., D. N. Xiao, and S. D. Zhao. 2002. “Ecotourism Suitability Evaluation of Wusulijiang National Forest Park.” Journal of Natural Resources 17 (1): 7175. (In Chinese.)
- Zhou, Q. W., H. C. Fang, and W. C. Su. 2010. “Evaluation of Ecotourism Suitability of Western Sichuan Plateau Based on GIS and Neural Network.” Resources Science 12: 2384–2390. (In Chinese.)
- Zhou, H., J. Q. Wang, and H. Y. Zhang. 2019. “Stochastic Multicriteria Decision-Making Approach Based on SMAA-ELECTRE with Extended Gray Numbers.” International Transactions in Operational Research 26: 2032–2052. doi: 10.1111/itor.12380
- Zou, J. H. 2018. “Analysis on the Spatial and Temporal Characteristics of Tourism Environment Comfort of Important Tourism Cities in China.” Master’s thesis, Hunan Normal University. (In Chinese.)
- Zou, Y., and F. Meng. 2020. “Chinese Tourists’ Sense of Safety: Perceptions of Expected and Experienced Destination Safety.” Current Issues in Tourism 23 (15): 1886–1899. doi: 10.1080/13683500.2019.1681382
- Zou, Y. G., and X. M. Zheng. 2011. “Safety Evaluation Model and Empirical Research of Scenic Spots.” Chinese Journal of Safety Science 21 (3): 156162.