
 ?Mathematical formulae have been encoded as MathML and are displayed in this HTML version using MathJax in order to improve their display. Uncheck the box to turn MathJax off. This feature requires Javascript. Click on a formula to zoom.
ABSTRACT
The unified management and planning of national or provincial natural resources distributed both aboveground and underground have become increasingly important. Accurate depictions of natural resource elements and their interactions are key to achieving integrated and systematic management of natural resources. However, current spatiotemporal data models are based only on data descriptions, attribute records, and other model knowledge of a more general basis, without intuitively describing relationships between these elements and natural resources. This paper, therefore, proposes an integrated data-model-knowledge representation model to explicitly describe the time, space, and interaction of natural resource entities through an integrated knowledge graph. First, this study constructs a conceptual model using the aspects of semantics, scale, and data-model-knowledge, thereby explicitly describing the relationships of natural resources. Second, a logical model of natural resource representation is proposed, that is integrated with time, space, attributes, and relationships. Finally, taking the management of water resources as an example, this paper realizes the meticulous presentation of the levels of detail and rich semantic relations of natural resource entities. The findings of this study lay the foundation for a more efficient, precise, and lucid perception of the distribution laws and complicated interactional relationships of natural resources, both aboveground and underground.
1. Introduction
Natural resource informatization has become an important basis of ‘Digital Twin Earth’ constructions (Rosen, Fischer, and Boschert Citation2019), which support applications of simultaneous representation, analysis, and simulation of the real world, such as Virtual Reality (VR) (Jamei et al. Citation2017; Kühne, Edler, and Jenal Citation2021), require a unified platform for representing the basic information of territorial space (Liu and Zhou Citation2021). Natural resource management has long been conducted by means of ‘multi-plan actions’, in which different departments carry out independent measuring, management, and application of resources and techniques. Moreover, geographical data are readily available for data exploration in order to understand the nature of the underlying dynamic environmental processes (Cova and Goodchild Citation2002; Goodchild, Yuan, and Cova Citation2007; Lü et al. Citation2018; Zhu, Zhang, et al. Citation2019). Yet, there are often inconsistencies in data objects, spatiotemporal references, data formats, and semantic identifications between natural resources (Li et al. Citation2016) obtained separately from different departments during the informatization of the resources. Meanwhile, different departments also perform management work oriented to respective natural resource objects (Yao et al. Citation2018), which results in a low correlation between application systems and tends to require a considerable workload to achieve interconnection and intercommunication of data and information sharing (Wen et al. Citation2017; Jiang Citation2020). Therefore, it is urgent to establish a unified model that considers the full characteristics of various natural resources in order to realize the integrated expression and management of multi-source heterogeneous data (Lü et al. Citation2019).
Recently, the focus of natural resource management has shifted from two-dimensional (2D), macroscopically separated, and abstract means, to three-dimensional (3D), integrated, and more meticulous means (Bak and Mill Citation2020; Thellbro, Bjärstig, and Eckerberg Citation2018). However, natural resources, including forests, grasses, oceans, lakes, arable lands, and minerals (Ahmed et al. Citation2020), inherently present a 3D spatial distribution involving not only the aboveground, but also the underground and underwater regimes. Because of this, the spatiotemporal granularity of the related data varies greatly (Pei et al. Citation2020), and the interactional relationships are extremely complicated.
Traditional 3D data models can be generalized into three types according to the different modeling ideas and methods which have been adopted: 3D vector data models (Bishr Citation1998), which are based on 3D topological relations; volumetric data models (Höhne et al. Citation1990); and mixed data models, which combine different models (Wu Citation2004). Moreover, managing data through symbolization or layering by using maps as templates tends to lead to overlays of 2D geometric representations (Perrin, Beauvais, and Puppo Citation2001) and crossed attributes of multiple factors. Such methods cause difficulties in not only satisfying the demands of the integrated expression of natural resources (Feng et al. Citation2018), but also in efficiently expressing and analyzing the dynamic changes and complex relations of natural resource entities. Therefore, it is necessary to more clearly express and manage natural resources as entities.
This research, therefore, develops an integrated data-model-knowledge (Huang and Harrie Citation2020) representation that is oriented to natural resources in order to achieve unified expression and management. This model summarizes the characteristics of attributes, time, and space of natural resources based on an in-depth analysis. Three aspects, that of semantics, scale, and model, are included in the model to provide an integrated data-model-knowledge foundation for the unified representation and integrated management of the dynamic multi-granularity of natural resource entities (Zhang et al. Citation2020). The relationships between natural resource entities are depicted through a knowledge graph, and complicated interactions are depicted by mechanism models. The proposed model also designs the logical storage structure of natural resource entities within the logical layer, which adopts the structure of a spatiotemporal relationship graph for the explicit expression of spatiotemporal relationships. Further, the proposed integrated data-model-knowledge model also incorporates a spatiotemporal query pattern based on a knowledge graph to optimize structure matching and semantic matching results. To test the applicability of the modeling approach, the model is applied to a typical use case study, which demonstrates the model's computational performance.
The remainder of this paper is structured as follows. Section 2 reviews related works on spatiotemporal geographic information system (GIS) models, while Section 3 describes the conceptual model of natural resource entities under semantic, scale, and data-model-knowledge levels. Section 4 presents the design of a logical model to store and manage the time, space, and attributes of natural resource data along with the structure of the spatiotemporal relationship graph. Section 5 discusses the application of the model to typical use cases of the unified management of natural resources and unified territorial spatial planning. Finally, Section 6 concludes the paper and outlines future work.
2. Related work
Traditional modeling of geographic entities is carried out by the stratification of thematic geography and by using vector or raster data structures as the basic unit within a single layer. This type of modeling technique divides space into layers. However, a truly complete geographic entity must be split into multiple fine objects as well as divided into multiple layers (different mapsheets or data layers). Thus, the continuity and integrity of the space and time of geographical entities are difficult to guarantee. At the same time, it is difficult to express the internal semantic connection between stratified entities and similar elements (Mennis, Peuquet, and Qian Citation2000). Accordingly, in the field of spatial information science, a series of spatiotemporal data models have been developed to deal with the complex relationships between space, time, and attributes.
Data storage formats such as SHP (shapefile), BIM (building information model) (Zhu, Wang, et al. Citation2019), and CAD (computer-aided design) are widely used in the dimension of geometric and semantic information expression in GIS. Molenaar (Citation1990) first put forward a formal data structure for 3D vector maps (FDS), which defined the four geometric features of point, line, surface, and volume, and explicitly expressed the topological relations between them. The FDS has a strong ability to express position, shape, and topological relations. In a later study, Zlatanova, Rahman, and Pilouk (Citation2002) simplified the 3D FDS model to some extent as follows. Considering the optimization of storage space and the topological relationship of geometric objects, a simplified spatial model (SSM) was proposed, which was oriented to network applications and had the advantage of visual query, thereby removing the arc elements from the traditional 3D FDS. However, it remains difficult to accurately construct the internal structure of spatial entities (Bak and Mill Citation2020) using the SSM; moreover, the comprehensive consideration of complex aggregation relationships between entities is still lacking. City Geography Markup Language (CityGML) proposes a standard of the semantic information model for a three-dimensional, multi-purpose and multi-scale representation of cities and regions (Kolbe, Gröger, and Plümer Citation2005; Gröger et al. Citation2012), but whether it is perfectly suitable for natural resources modeling and representation remains to be discussed. For the temporal dimension, the snapshot model (Armstrong Citation1988) was then proposed to express a series of changing states of objects as a whole. To avoid the disadvantage of the snapshot model in which the snapshot features of each unchanged part are repeatedly recorded, Langran and Chrisman (Citation1988) analyzed the ground-state correction model and space-time complex model in detail and produced the space-time cube model, which compensates for the shortcomings of the snapshot model. The space-time cube model can intuitively express temporal semantics (Kraak Citation2003), but it also has the disadvantage that the operation on the cube becomes increasingly complex as data increases, so as to eventually become unmanageable (Bach et al. Citation2017). As alternate model types, base states with amendment models and object-oriented spatiotemporal data models can extend the time dimension based on the space dimension, which work well with vector data but have a weakness in expressing and storing raster data (Peuquet and Duan Citation1995). Therefore, a spatiotemporal cadastral model was then proposed based on the graph theory (Angles and Gutierrez Citation2008) in order to better express changes in spatiotemporal objects that are discrete and continuous in space (Wilcox, Harwell, and Orth Citation2000). Later, the ground-state correction model was extended, in that a dynamic multistage ground-state correction model was proposed (Nan et al. Citation2006). State-based spatiotemporal dynamic data models can deal with the temporal sequence changes of objects in spatiotemporal processes to a certain extent, but most of them can only describe the overall characteristics of objects based on 2D space vector objects, thereby focusing more on reducing the redundant storage of spatiotemporal data and tending to lack in the semantic expression of 3D space (Peuquet and Duan Citation1995). Moreover, such state-based models cannot well describe the phenomena or changes in geographic entities. In general, they lack a holistic representation of both geometry and time.
A significant number of methods and algorithms exist for the description and expression of relationships. In terms of temporal relationships, Allen (Citation1983) studied the description and reasoning of temporal topological relationships, identifying 13 temporal relationships and describing the reasoning results of 13 temporal topological relationships in the form of a combination table. In another study, Bassiri et al. (Citation2009) investigated temporal topological relationships between time periods based on rough set theories and defined 68 temporal topological relationships. In research on describing spatial relationships, the topological method of point sets (Egenhofer and Franzosa Citation1991), the region joining algorithm (Randell, Cui, and Cohn Citation1992), the symbolic projection method (2D String) (Chang, Shi, and Yan Citation1987), the outer rectangle method, and the generalized intersection model description method (Renz and Nebel Citation2007) have all been used. Overall, however, existing research has generally focused on the individual descriptions of temporal and spatial relationships and tends to largely ignore spatiotemporal associations and interactional relationships within and between geographic objects.
When it comes to representation for the evolution and changes information of geographic objects in a structured way, the main method can be classified as those based on ontologies and those based on graphs. A formula-based method that represents geospatial knowledge through a numerical model can only be used for variations in single geographic objects (Deng et al. Citation2017; Leung et al. Citation2019). An ontology-based method solves some of the limitations of the formula-based method by defining the concept of knowledge and describing the relationship between entities. Although this method has the ability to simulate complex geographical phenomena, it focuses more on the description of the relationship between processes and scenes, and weakly expresses the relationship between geographical objects and the processes (Xue et al. Citation2019; Huang et al. Citation2019). Graph-based method makes up for the weakness of the ontology-based method, which describes the attributes and relationships between geographic entities. However, this method considers time as an attribute of geographic entities, so it is difficult to express the direction of event evolution (Wang et al. Citation2018; Fan et al. Citation2020). As to the immersive and perceptible visualization method, VR is a potential tool. But there exist blocks that file format of various data sources is not standardized and format transformation from geospatial data to virtual 3D environments is required (Keil et al. Citation2021).
In summary, despite the great diversity of spatiotemporal data models, limitations in the integrated and explicit expression of time, space, attributes, and complex relationships of natural resources still exist. This lack of support for the expression of spatiotemporal correlation means that the interaction and dynamic evolution process between spatiotemporal objects of natural resources cannot be sufficiently reflected. Moreover, the demands for the interconnection and intercommunication of data and information sharing, and for the integrated management of natural resources, cannot be met directly or effectively.
3. A conceptual model for the unified expression of natural resource entities with multi-granularity
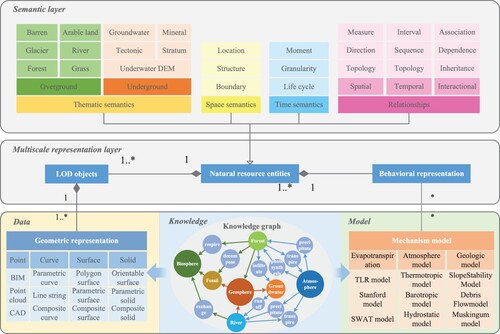
In this study, the integrated data-model-knowledge representation for natural resources was adopted in order to better reveal the 3D features of spatiotemporal information and to support semantic descriptions of spatial entities and relationships between them. As a result, an information foundation is provided for the unified representation of dynamic multi-granularity natural resource entities. The representation of natural resources is formalized by Ontology. The conceptual model as an intermediate from elements to ontologies is designed to abstract and summarize the characteristics of natural resource entities as well as to describe relationships explicitly. This conceptual model forms semantic-scale-model layers to achieve multi-dimensional semantics with rich levels of detail.
As shown in , the model consists of three layers: semantics, multiscale representation, and data-model-knowledge. In the data-model-knowledge layer, the conceptual model provides a database for representations of natural resource entities, models for relationship calculation, and knowledge for analysis and exploration. In the semantic layer, the classification, time, space, and relationships of natural resource entities are included. This lays the foundation for the exploration of evolutionary regulation in nature. In the multiscale representation layer, we realize the levels of detail and behavioral representation of aboveground and underground natural resource entities with the assistance of the data-model-knowledge layer in both semantic and geometric aspects.
Figure 1. The conceptual model for the unified expression of natural resource entities.
3.1. Multiscale representation layer
Owing to the hierarchy of national and local management unit sizes, natural resource entities present different levels of details in terms of geometric characteristics and semantic information. This tends to be done because people care about different types of information at different scales. Different management levels and applications usually require models with different granularities and modalities that reflect the essential features of things, while isolating details and mechanisms that do not play a significant role in the application. Based on this, establishing a reasonable hierarchical multi-scale representation framework of natural resource information is necessary for the visualization, analysis, and integrated management of natural resource entities. For this study, the hierarchy structure was proposed to satisfy distinct application scopes by providing geometrical, topological, and semantic representation in three different hierarchies (Hierarchies 1–3) from the 2D horizontal level to the 3D vertical level. The characteristics of each hierarchical structure and the advisable contents of the level-of-detail (LOD) representations and semantic information are illustrated in .
Figure 2. Description of hierarchical levels of details and semantic information.
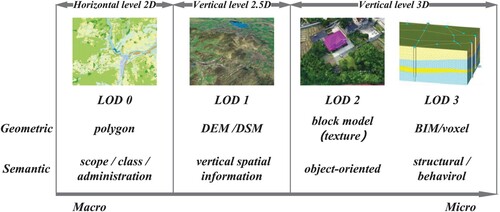
Hierarchy 1 provides a 2D representation of parcels and was adopted to ensure an accurate partition and reveal the pattern on the horizontal level. Hierarchy 1 is composed of LOD 0 representations which are used for the landscape of provinces or states, commonly to determine the detailed horizontal distribution of category information within a specific area. This hierarchy also includes attribute information of each parcel, such as administration and ownership. It is applicable for a large area while entities underground and indoor are difficult to express effectively in this hierarchy.
Hierarchy 2 provides a primary vertical description of the 2.5D terrain surface. This hierarchy is composed of LOD 1 representations used for the landscape of cities or districts. Natural resources under the ground, such as geology, can be presented through drilling in this hierarchy. The digital elevation model (DEM), digital surface model (DSM), and superimposed digital orthophoto map (DOM) mainly build a digital terrain landscape model that visually expresses continuous terrain undulations or a virtual reality scene that can measure ground elevation. So it shows the topography of mountains, rivers, and other landforms, as well as the distribution and form of cities, villages, and towns from the perspective of high altitude, which is the main mode of informatization construction in large regions at the provincial and municipal levels. In terms of its semantic layer, Hierarchy 2 provides vertical spatial information in order to assist in the research of ore bodies, water simulation, disaster prediction, urban planning, cadastral management, and other aspects that require accurate space semantics such as location, distance, and spatial relationships at the vertical level. Various 2D thematic map information including geological survey information can be superimposed on the scene.
Hierarchy 3 not only provides a vertical description of the 3D space but also realizes the object-oriented modeling of natural resource entities. This was adopted because a 3D partition of aboveground or underground natural resource entities with different categories or attributes can solve the problem of mutual overlaps between entities in the 2D projection as well as satisfy the management requirements of the 3D space level. In LOD 2, natural resources are regarded as independent objects, and natural resource entities are depicted independently such as mountains, lakes, trees, or residential buildings, as represented in a multimodal manner as monolithic 3D photogrammetry models, point cloud models or 2.5D vector block models, which are also endowed with more detailed semantic information. In terms of spatial, temporal, or relationship analysis of natural resource entities, object-oriented models contain more detailed semantic information, such as the accurate location, life cycle, topology, and association relationships between entities. For LOD 3, finer-detailed models which focus on the 3D structure of entities like BIM, Voxel, 3D Boundary Representation (B-Rep), etc. are provided for specific and important natural resource entities, such as geologic bodies and reservoir facilities. At this level, not only are the vertical description of a 3D object expressed, but also its interior and structural description. Moreover, the behaviors of natural resource entities are included. The behaviors refer to dynamic changes and events occurring between different natural resource entities or the entity itself. This can be a spontaneous action, such as interactions in nature. It can also be a passive change or event caused by human activities, such as the construction of transportation. Accordingly, Hierarchy 3 achieves object-oriented and behavioral expression of important facilities from a microscale and interior perspective in the scope of urban and rural scenes, terrain, and features of a certain region.
3.2. Semantic layer
The semantic layer mainly describes the semantic information of the natural resource entities, introducing the space and time semantics, and inherent attributes, such as classifications and properties. Due to the complexity of processes and mechanisms of changes and evolution, it is necessary to intuitively express the relationships between natural resource entities, so that the layer can associate the required useful data and directly support the integrated management of natural resources.
3.2.1. Attribute semantics
Attribute semantics () mainly include the attribute feature information of natural resource entities. Equation (Equation1
(1)
(1) ) provides a detailed definition of attribute semantics as follows. Here, any feature (
) is thought to possess attributes composed of non-spatial and non-temporal attributes of k (
) dimensions.
shares attribute semantics, including the classification, property, and administration of natural resource entities:
(1)
(1) Due to the hierarchy of the management of natural resources, the process of classification shows hierarchical characteristics. This is because, at different hierarchy levels, people are concerned about the different granularities of classification. As shown in , a classification hierarchy oriented to the management's multi-level requirement was built.
Figure 3. Classification hierarchy of natural resource entities.
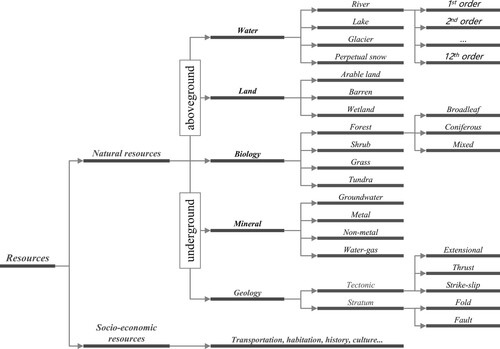
In the rough hierarchy, we synthetically divided natural resource entities in the land areas into aboveground and underground parts based on 3D distribution laws. Broad land management, which involves natural resource entities but does not concern their specific classification, merely distinguishes natural resource entities from other geographic elements such as socio-economic elements (transportation, habitation, history, and culture). Therefore, natural resource entities on the ground are mainly classified into water, land, biology, and meteorology, while those under the ground are classified into mineral and geology according to professional standards. Meteorological resources were outside the scope of this study.
For natural resource management, each class of natural resource elements must be refined. Considering the morphological characteristics and spatial distribution of water resources, water resources were divided into rivers, lakes, glaciers, and perpetual snow. Arable land, barren land, and wetlands were also included in land resources. As for biology, this study only focused on plant resources, which consist of forest, shrub, grass, and tundra. The mineral resources included metals, nonmetals, and water gases, including geothermal resources, with reference to the Detailed Rules for the Implementation of the Mineral Resources Law of China. Groundwater differs from other types of water resources because of the particularity of its distribution and its importance to the ecological environment; therefore, it is listed separately in the class of minerals. Geology is also significant for natural resource management, and its elements include tectonics and strata.
When management and application are focused on a specific kind of natural resource, the preliminary classification mentioned above is insufficient. Therefore, it is necessary to further divide each class into more specific categories according to their respective professional standards. Taking rivers as an example, a plethora of information can be obtained about rivers, including their length, depth, speed, direction, ecosystem, and flow (Tadaki, Brierley, and Cullum Citation2014). To measure and record the characteristics of rivers and other waterways around the world, scientists have developed several classification systems including topography (Lane et al. Citation2017), biotic status (Belletti et al. Citation2017), degree of whitewater (Laranjeiras, Nicolas Naka, and Cohn-Haft Citation2019), and the Strahler stream order (Strahler Citation1957). Of these choices, this study adopted the Strahler stream order to further classify rivers, as shown in . Besides those of rivers, forests, tectonics, and strata, further divisions of other classes were not listed in the classification hierarchy of natural resource entities for this study.
3.2.2. Space semantics
Natural resource entities inherently show 3D characteristics in terms of form, distribution, and management focus. This means that natural resource entities, including their components, feature 3D forms and structures that require facades and sections to express and calculate. Moreover, many natural resource entities that are situated aboveground, on the surface, and in the subsurface overlap within a 2D area. From the perspective of management, natural resources are the property of individuals, associations, collectives, or governments. Therefore, management activities, such as monitoring, planning, and regulating the sustainable development of natural resources, tend to involve the explicit expression of geo-information. It is, therefore, necessary to explore methods of generating practical 3D expressions and establish a hierarchical description of 3D entities with a deep consideration of different needs according to data precision and user requirements.
Space semantics () are mainly responsible for the modeling, expression, storage, and management of spatial geometric information. Equation (Equation2
(2)
(2) ) provides a detailed definition of space semantics as follows. Any feature (
) is thought to possess attributes composed of spatial and non-temporal attributes in n dimensions (
).
shares the semantics, including the location, boundary, and internal structure of natural resource entities:
(2)
(2)
3.2.3. Time semantics
Considering the typical dynamic characteristics of natural resource entities, time semantics must be thoroughly considered. Based on natural resource entity objects, temporal information can be obtained and managed quickly and conveniently. Dynamic changes and events are directly associated with any given natural resource entity itself, and different evolution stages of the same natural resource entity are directly associated with the attribute of ‘object ID '. The life cycle of each natural resource entity can be regarded as the union of multiple entities in different evolutionary phases, each of which has two valid timestamps: start time and end time. By tracing the causal chain of events of each entity, it is relatively simple to reconstruct the life state of each entity, as well as analyze and predict the overall dynamic change law of all natural resource entities.
The time semantic () is mainly responsible for modeling, expression, storage, and management of temporal information. Equation (Equation3
(3)
(3) ) provides a detailed definition of time semantics as follows. Any feature (
) is thought to possess attributes composed of non-spatial and temporal attributes of
dimensions.
shares the semantics, including moment, life cycle, and time granularity, to describe the status and behaviors of natural resource entities during their lifespan:
(3)
(3)
3.2.4. Relationship semantics
After more than 10 years of research on space, time, and attributes, there are mature modeling and expression methods for these semantic types, yet the study of interactional relationships has been relatively sparse. This is problematic, because natural resources are distributed both aboveground and underground, involving rivers, forests, lakes, grasses, and other entities, with multiple relationships between entities and complicated interactions among them. Relationships help to organize the information of natural resource data as well as realize the linkage between such data in order to complete the visualization, logical query, and complex analysis of natural resource entities. Therefore, to meet the requirements of unified expression, business collaboration, and accurate governance of natural resources between different management departments, the data characteristics and mutual relationships of natural resource entities need to be comprehensively explored. The modeling and expression of these explicit or implicit relationships have become more important than the data themselves. This concept is fundamental to not only promoting the development of a descriptive component for diagnostic and predictive analyses, but also identifying the key means to realize the perception of the overall distribution condition and diagnosis decision of natural resources. Therefore, the proposed model of this study incorporates four readily-existing elementary relationships: temporal, spatial, semantic, and, more importantly, interactional relationships. To describe these, the next sections take natural resource entities A and B as an example.
3.2.4.1. Spatial relationships
A spatial relationship () specifies how one natural resource entity is located in space in relation to a reference natural resource entity, which is divided into measure, direction, and topology according to traditional GIS.
This paper considers 3D natural resource entities as research objects and discusses the spatial relationships between points, curves, surfaces, and solid objects. Furthermore, this paper discusses spatial relationships in 3D space that are more accurate and easier to identify between entities. At the 2D horizontal level, connections, adjacencies, and inclusions exist between natural resources such as rivers, lakes, forests, and farmlands, as shown in (a). From the 3D vertical aspect, overlap and intersection appear between entities such as minerals, strata, rivers, and groundwater, ranging at the levels from aboveground to underground, as shown in (b). Therefore, the spatial relationships must be considered in more detail.
Figure 4. The different presentations of natural resource spatial relationships between the 2D and 3D aspects. (a) Spatial relationships from the 2D horizontal aspect and (b) spatial relationships from the 3D vertical aspect.
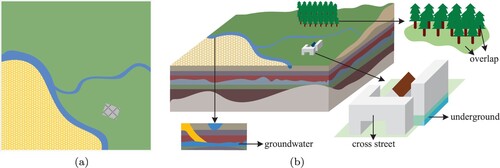
Topology refers to the connection and adjacency between objects regardless of specific positions. Topological relationships may exist in point-point, point-curve, point-surface, point-solid, curve-curve, curve-surface, curve-solid, surface-surface, surface-solid, and solid-solid. Measure specifies how far is the object away from the reference object which is meaningful to analyze spatial dependence and spatial auto-correlation between natural resource entities. Direction describes the relative orientation relationships between one object and another, and represents a spatial sequence relationship between two spatial objects.
3.2.4.2. Temporal relationships
A temporal relationship () mainly describes the interval, sequence, and topology of natural resource entities. Interval describes the time span between two time-nodes, such as the time period between
and
. Sequence defines the order of events during the evolution of natural resource entities. Topology compares the intersecting relationship between two time periods.
3.2.4.3. Semantic relationships
A semantic relationship () mainly includes inheritance, dependence, and association. This type of relationship generally focuses on the logical relationship between natural resource entities. Inheritance refers to the existence of inheritance relationships among the same class of natural resource entities, and entities belonging to the subclass can inherit the properties and methods of the parent class or redefine and append them. A relationship also exists between entities under different development stages, during which some properties are retained. Dependence mainly consists of entities that are bound by certain characteristics of another entity, such as forests and rivers, or derived from another entity, such as soil and rocks. Association describes the effect or constraint conducted on some entities by the others. Semantic relationships can use the associative navigability feature to access entities of one class to entities of another class or to access entities of the same class within their own associations and help organize the information of natural resource data and realize the linkage between them.
3.2.4.4. Interactional relationships
An interactional relationship () is mainly used to describe the interaction between natural resource entities and to reveal the mutual feedback mechanism between the entities, including causality, clustering, and symbiosis. For example, the relationships between forest growth and altitude, slope, slope direction of mountains, and thickness of soil are interactional. Other examples include the relationships between morphology and river erosion, scour, and deposition; forest and water conservation; farmland irrigation and rivers; and impacts of human activities such as reservoir construction, tunnel digging, and underground engineering on geological structures and vegetation growing environments.
3.3. Data-knowledge-model layer
In the data-knowledge-model layer, the model provides a foundation for the integrated management of natural resource entities from a 2D horizontal level to a 3D vertical level by means of absolute georeferenced 3D coordinates for size, shape, and position. In addition, this layer organizes and manages spatiotemporal big data efficiently through mechanism models (Wilson and Bergen Citation1979), knowledge graphs (Wang et al. Citation2017), and intelligent algorithms to meet the requirements of different tasks, such as scene semantic modeling, behavior description, intelligent recommendation, and simulation analysis on the basis of the knowledge graphs and mechanism models.
3.3.1. Data
In this section, the storage of geometric data, classification, property, and administration information of natural resources are described. Regarding geometric representation, with reference to the CityGML model, the proposed model is designed to maintain consistency with the standard ISO 19107(2019) (ISO 19107:2019 Citation2019) and make full use of 3D database management. The 3D coordinates of every point that constitute the entity boundaries can be imported and managed as a boundary representation (Ledoux Citation2018). shows four basic geometric elements: point, curve, surface, and solid. Every basic geometric element can be generalized into more specific geometric types. To represent complicated and elaborate 3D models that have more spatial characteristics than position, shape, and orientation, the point object includes a point cloud, BIM, and CAD model. Important facility entities in natural resource management, such as hydrological nodes, monitoring points, and critical hydraulic engineering along with the surrounding area, can be expressed by BIM and CAD in the finest level of detailed information concerning elements such as equipment, structure, usage, architectural design, and so on. The curve object can be generalized into a line string, parametric curve, or composite curve, which can consist of new complicated objects. The curve object represents the linear characteristics of the 3D entity, such as the centerline of rivers or tectonic lines. The surface object comprises different types of surface entities, such as polygon, parametric, orientable, and composite surfaces. The composite surface is made up of simple surface objects connected topologically along their boundaries. The solid object consists of four types: a simple, parametric, orientable, and composite solid. The composite solid is topologically formed from multiple solids connected by their shared parts, which can represent natural resource entities such as lakes, reservoirs, and geologic bodies.
3.3.2. Model
The model generally refers to a mechanism model that is mathematically accurate based on the internal mechanism of an object, a production process, or the transfer mechanism of a material flow (Wilson and Bergen Citation1979). It is the mathematical model of an object or process based on equations such as mass balance, energy balance, momentum balance, phase balance, or physical property equations, as well as chemical reaction laws, basic circuit laws, and so on. In the field of natural resources, such a model can be referred to as evapotranspiration, atmosphere, or geologic models. This is the instantiation description of interactional relationships. Such models support the calculation of interactional relationships as well as qualitative and quantitative descriptions of natural resource behaviors and evolution.
3.3.3. Knowledge
The knowledge base is designed to efficiently organize and manage the spatiotemporal data, thereby laying the foundation for behavior description, intelligent recommendation, and simulation analysis. A knowledge graph is a concrete form of knowledge representing a unified description of entities and relations from the ontological level. An entity can be a natural resource entity, model, or event. The relationships between natural resource entities are vital to the construction of knowledge graphs for the expression and management of natural resources.
3.3.3.1. Calculation of spatial relationships
The calculation of spatial relationships () can be performed using spatial analysis algorithms. Assuming that REL is an operator for mapping and calculating, the following equation shows the relation between them:
(4)
(4) When the reference object is much larger than the object to be located, the latter is often represented by a point, while a reference object is often represented by a bounding box. Therefore, an axis-aligned minimum bounding box (AABB) was introduced to reduce the misjudgment resulting from the loose boundary. The axis-aligned minimum bounding box for a given point set is its minimum bounding box, subject to the constraint that the edges of the box are parallel to the Cartesian coordinate axes. The axis-aligned minimal bounding boxes were used to define a simple descriptor of their shape. Thus, the center point of the bounding box can be calculated and used as the approximate location of an object in question.
Topology. To simplify the judgement, 3D natural resource objects are represented by their own axis-aligned minimal bounding box, so that it only needs to discuss the topology between points, curves, surfaces, and simple solids. The Dimensionally Extended 9-Intersection model (DE-9IM) (Chen et al. Citation2001; Shen, Chen, and Liu Citation2018) was introduced to describe the topology relationship between natural resource entities. The DE-9IM describes the relationship between the interior boundary
and exterior
of objects A and B to represent the topology relationship between them. The intersection of I, B, and E of the two objects consists of a 3 × 3 matrix, as shown in the following equation:
(5)
(5) Direction. We use a spatial vector to represent the directional relationship between two natural resource entities (Li and Liu Citation2015). The spatial vector can be calculated from the bounding box center point of two 3D entity objects, as shown in . Assuming that natural resource entity A is the reference object, entity B is the object to be located. Taking A as a common point, a local Cartesian coordinate system is built for a 3D space that consists of an ordered triplet of lines (the axes) that pass through the common point (the origin)
. The center point of natural resource entity B is
,
, that is,
can be used to represent the direction relationship between entities A and B.
Figure 5. A 3D Cartesian coordinate system, with origin A and axis lines X, Y and Z, oriented as shown by the arrows.
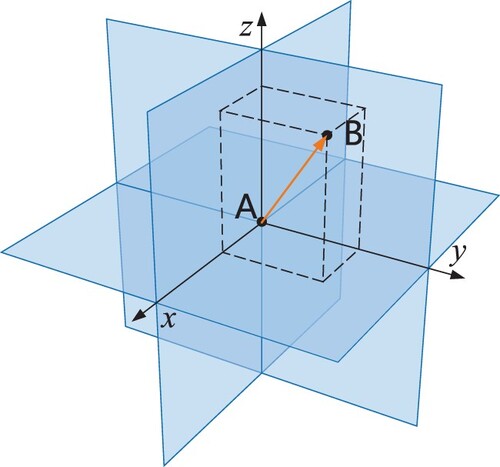
In this situation, each have a possible value set, {
}. Thus, the direction of B according to A has 27 cases by permutation:
. These cases are classified into four kinds, that is, entity B may locate (1) at the origin, (2) on the axis, (3) in the coordinate hyperplane defined by each pair of axes, or (4) in the octant divided by hyperplanes.
Measure. In Euclidean space R3, the distance between two points is usually given by the Euclidean distance (2-norm distance). For a point and a point
, the 2-norm distance is defined as
(6)
(6)
3.3.3.2. Calculation of temporal relationships
The calculation of temporal relationships () can be performed using temporal analysis algorithms. Assuming that REL is an operator for mapping and calculating, the following equation shows the relationship between them:
(7)
(7) The topology relationship of time between A and B can also be calculated using a
matrix similar to the DE-9IM. Based on Allen's (Citation1983) period logical model, the operation can distinguish 13 types of temporal topology relationships that are jointly exhaustive and pairwise disjointed, or JEPD. The types are equal, before, meets, overlaps, during, starts, finishes, after, met, overlapped, contain, start, and finish.
3.3.3.3. Calculation of semantic relationships
Semantic relationships () were calculated using logical operations. This was based on either the classification hierarchy or the evolution stage existing in generalization, realization, association, aggregation, composition, or dependency among natural resource entities such as relationships in a unified modeling language (UML). The following equation defines the relationships between them:
(8)
(8)
3.3.3.4. Calculation of interactional relationships
The calculation of interactional relationships ()) was relatively complicated as follows. The relationship itself reveals a composite process of changes, behavior, and evolution, which is the interaction result of space-time-attribute and spatial-temporal-semantic relationships of natural resource entities. The mechanism models were necessary for the calculation of
, and in some cases, the mechanism model had to be combined. The following equation shows the relationship between the two:
(9)
(9)
4. Logical model of natural resource entities
In recent decades, great progress has been made in the research of GIS representation models for geographic spatiotemporal objects. In the dimension of geometric expression, data storage formats such as SHP, BIM, and CAD have become widely used. In the dimension of time expression, models such as space-time cubes, base states with amendment models, and object-oriented spatiotemporal data models have emerged, which greatly broaden the use scenarios of GIS in human-machine-object ternary space. Against the background of the integrated management of natural resources, this section presents an extensible logical expression that integrates the past decade of GISers' work in temporal, spatial, and attribute expression models. At the same time, being oriented both to problems of independent expression and management of the natural resources as well as to achieving an overall picture of the management problem, this section introduces the interactional relationship structure which constitutes the logical model of natural resources.
4.1. Logical expression of integrated data-model-knowledge
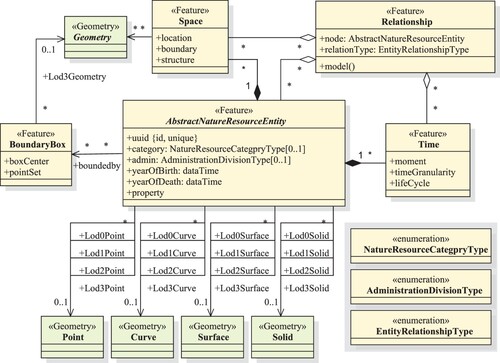
The refined management of natural resources and the demand for global diagnosis, analysis, and decision-making have put forward higher requirements for the logical storage and representation method of natural resource data. Furthermore, it has become necessary to strengthen the query ability of intersections and parallel between time, space, attributes, and relationships of data objects. However, the ability of the current GIS system to manage, storage, and analysis is dispersed, and the logical storage structure of most mainstream systems is designed to store and manage the time, space, and attributes of data objects in the data layer itself. This results in the data layer having the capability to range between time, space, and attribute information queries. However, this also requires that specific spatiotemporal analysis and diagnosis need to load data from the data layer to the application layer, as well as extract interactional relationships between objects in order to conduct a deeper analysis and process decision-making. In particular, when making global diagnostic decisions on natural resource entities, almost all data need to be traversed and extracted. This mechanism is undoubtedly unable to satisfy deep diagnostic and predictive applications, such as the perception of the overall distribution condition of natural resources and the exploration of implicit knowledge and regularity of nature, which have high requirements for performance and delayed response. Therefore, in order to improve the diagnostic decision-making ability concerning natural resource issues, the ability to construct and mine the interactional relationship in the application layer should be transferred into the data layer and time, space, attribute, and relationship feature classes. Through efficient collaboration among these classes, the ability of management, diagnosis, and decision-making in the natural resource application layer can be improved. The logical model of natural resource entities based on this framework is shown in .
Figure 6. UML diagram of natural resource entity logical model.
4.2. Structure of the spatiotemporal relationship graph
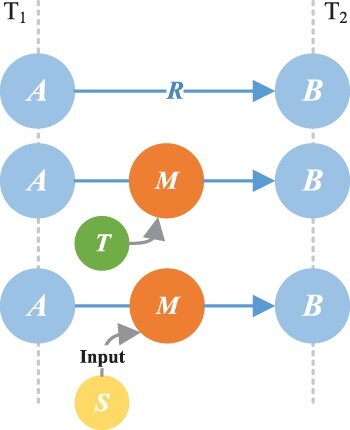
To realize the efficient expression and management of the relationships among natural resource entities, this study modeled and expressed the relationships based on the prototype of the knowledge graph. A knowledge graph is a type of graph data structure that explicitly expresses the evolution process and structural relationships of knowledge resources and their carriers by nodes and relational edges. In order to efficiently express both the static and dynamic relationships among the same type of entities, as well as the relationships across different types of entities, this study proposes a spatiotemporal relationship graph based on a resource description framework (RDF) triple as a unit part of the knowledge graph, which can support spatiotemporal query and higher order inference. The detailed structure is shown in .
Figure 7. Spatiotemporal relationship graph based on an RDF triple; designed to support spatiotemporal query and higher order inference. (a) The structure of the spatiotemporal relationship graph and (b) UML diagram of the spatiotemporal relationship based on RDF.
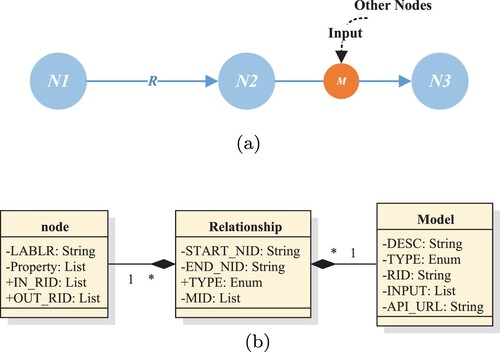
For this, the most basic triple of the spatiotemporal relationship graph is expressed as . The node is referred to as
, which represents the natural resource entity research object of this study. In this way, not only can the entity have detailed attribute descriptions, but it can also have grouping tags. The tags are similar to the concept of layers in traditional 2D-based GIS management, and they can be used to aggregate nodes of the same type. The relationship is expressed as
to represent the specific relationship structure between nodes, which contains the start and end nodes of the relationship as well as the type of relationship. Based on these conditions, it can be concluded that the most basic unit of the relationship knowledge graph can be expressed as
. As shown in , this simple structure can directly represent the static relationships between two nodes, such as
, depending on
. However, if it is required to express the dynamic and complex change and interaction process between objects, the structure cannot be expressed by a simple relationship. Therefore, this study incorporates the concept of the model into the relationship structure as
, where m refers to models. As shown in , the concrete structure of the model can be expressed as
. The model has the type, specific input parameter node, and service access address. By introducing the input parameter into the model calculation service, the dynamic and complex changes and interaction processes between objects can be simulated and calculated. The model here is a collective call for processes or algorithms that describe the input and output parameters along with the function of the model itself. The function realization of the model is through an interface that can be a remote computing and analysis interface on the Internet. In this way, the model can be a combination of multiple groups of models when the complex interaction and change relationship between objects must be expressed.
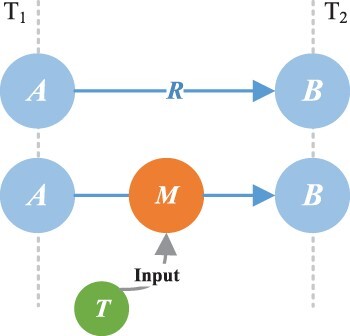
In order to realize the expression of spatiotemporal phenomena evolution or interactions related to the time semantics between natural resource entities, this paper introduces time node based on the knowledge graph of relationships that already contain entity nodes, relation edges, and computational analysis models. The time node can also be treated as the input parameter of the models, so the structure of the spatiotemporal relationship graph is improved as . By adding a time node to the structure, the structure can now describe the process in which entity A at
turns into entity B at
after a period, as shown in . This is similar to the snapshot, increment, and other expressions methods in the spatiotemporal data model in which discrete changes of the entity's state are represented by discrete time nodes. With this input node, entity A corresponding to different entity B at different times can be expressed as well as changes in entity A over time.
Figure 8. Schematic diagram of the structure of the spatiotemporal relationship graph with the time node added.
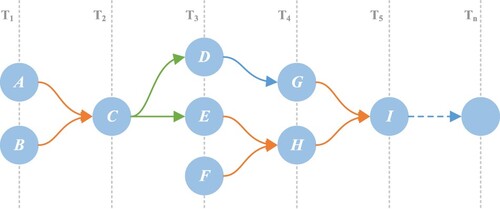
Through the introduction of the expression method of discrete and continuous time changes, the relationship between changes in natural resource entities can be expressed more efficiently. As shown in , in the time interval , natural resource entities A and B combine and evolve into the new entity C. Entity C then splits into entities D and E at
. Simultaneously, a new natural resource entity, F, emerges. Entity D evolves into entities G and E, and entity F is combined into entity H in the time interval
. Finally, entities H and G enter the new natural resource entity I. In the series of evolution and relationship changes of natural resource entities, the introduced time nodes clearly express the continuous and discrete changes occurring alternately along with the interactions between them.
Figure 9. Schematic expression of the continuous and discrete changes between nature resource entities.
Adding space nodes based on the above explanation, the basic structure of the spatiotemporal relationship graph is improved as . The spatiotemporal representation ability of the knowledge graph is further enhanced for relationships between natural resource entities in the spatial dimension or for calculations of the accessibility among natural resource entities. shows a schematic diagram of the spatiotemporal relationship graph with the added time and space nodes.
Figure 10. Schematic diagram of the structure of the spatiotemporal relationship graph with the space and time node added.
4.3. Spatiotemporal query pattern based on the knowledge graph
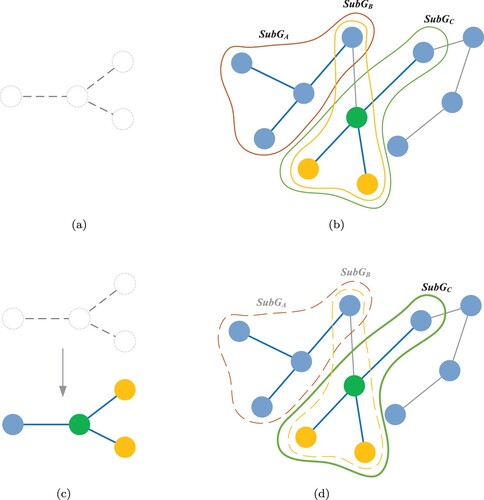
The pattern is an abstract representation of the interactions between natural resources that are stored and managed with integrated data-model-knowledge. According to this concept, any kind of relationship between a group of natural resources and their associated resource objects can be abstracted into a type of relationship pattern. By bringing this pattern into a knowledge graph for mining and matching, a variety of possible result sets matching this pattern can be obtained. In Section 4.2, the expression cases of spatiotemporal relationship changes of natural resource entities based on RDF, including those with extended time and space nodes, can all be regarded as one specific relationship pattern. This type of pattern incorporates structural and semantic information between the entities. If natural resource groups that have similar spatiotemporal relationship characteristics are the mining target in the knowledge graph, the model only needs to be simplified to preserve the structure and semantics required to be matched, such that the conception and mining analysis of natural resources as a whole can be conducted in the knowledge graph. This process is referred to as pattern matching. Pattern matching is classified as structure matching and semantic matching, considering nodes and edges. Structure-based matching is used to query whether there is a subgraph structure in the knowledge graph that is identical to the target structure. This query pattern only focuses on the connection structure between nodes, rather than on the semantic characteristics of data nodes and relationship edges. As shown in , there are three eligible subgraphs in the knowledge graph through structural matching. However, another query pattern that considers the semantics of nodes and edges is to add filtering of the node types, attributes, and relationship types based on structural matching in order to realize the accurate matching of both structure and semantics. Only one subgraph
satisfies the semantics of the three subgraphs described above.
Figure 11. The comparison of two query patterns. (a) The target structure. (b) Eligible matching result through structural matching. (c) The target structure considering the semantics of nodes and edges and (d) The accurate matching result of both structural and semantic matching.
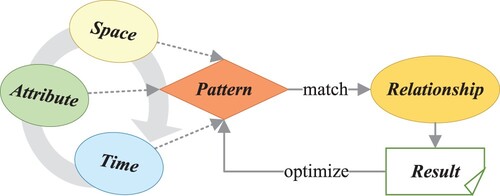
In the global mining and analysis of natural resource relationships, the pattern of phenomena or laws to be queried is fuzzy and uncertain. Therefore, efficient synergy between the relationship, space, time, and attributes is required. The specific synergy process can be summarized into the following three segments, as shown in . First, according to the conditions of the target in the time semantics and space semantics, the spatiotemporal scope of the natural resource entity is queried and the time node and space location node of the target object are extracted at the same time. This results in the formation of the spatiotemporal pattern structure of the target to be queried and the narrowing of the scope of the pattern matching result. Second, according to the attribute description of the query scenario task, the attribute semantic information of entity nodes and relationship edges from attributes are extracted, and the information constraint is assigned to the spatiotemporal pattern structure mentioned above, such that the semantic pattern structure of the target is constructed and the resulting data are further filtered. Finally, the semantic pattern structure is introduced into the knowledge graph for match searching and the qualified query result is obtained. The result also needs further discrimination and diagnosis in order to optimize the query pattern, regenerate the semantic pattern structure, and substitute it into a knowledge graph for an iterative query.
Figure 12. The synergy query process between the relationship, space, time, and attribute semantics.
5. Typical use cases of data-model-knowledge representation for natural resource entities
To evaluate the proposed model for the unified expression of natural resources and to show the potential of integrated management of semantic, geometric, and hierarchical levels of details of natural resource data with multiple sources, the model introduced above was adopted in typical use cases for the integrated management and unified planning of natural resources. For this, we display a scene integrating mountains, rivers, forests, arable lands, lakes, grasses, and human settlements from a 3D perspective. The semantic and geometric information of all natural resources is organized as an entity, and the interactional relationships are intuitively expressed in the form of graphs.
5.1. Multi-scale representation
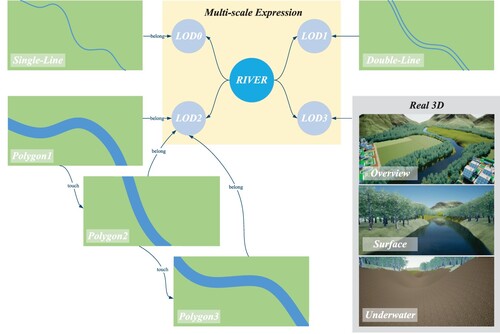
Taking water resources as an example, we present the meticulous levels of detail and rich semantic associations of the water surface, water body, underwater topography, and surrounding environment. This illustrates the practicability and effectiveness of the model.
First, we chose a river entity at a certain scale. According to the scale, the relationships constructed between natural resource entities and their LOD objects help choose corresponding data. From two different visual perspectives, shows a typical review of the integrated representation of a river entity, which includes multi-level representations as follows. (1) 2D horizontal level: the river is shown as a single line in LOD 0; shown as a double line in LOD 1, which indicates the scope, category, and regions flowing through. In LOD 2, the entire river is divided into multiple river reaches, which are connected successively according to the topological relationships. (2) 2.5D vertical level: One river reach is selected, shown as a DSM containing improved vertical spatial information. (3) 3D vertical level: The expression of the river is object-oriented, and further structural information, such as the water surface, water body, and underwater terrain, are calculated and stored.
Figure 13. Representation of the river entity at multiple scales.
5.2. Case 1: Integrated management of natural resources
When it comes to the integrated management of natural resources, we consider the formation and interaction between disasters such as landslides, barrier lakes, and floods as examples. The integrated data-model-knowledge representation model is capable of integrating the description of disasters as well as relevant natural resource data through the knowledge graph. Moreover, mechanism models assist in determining the inherent and implicit relationships during the process of the formation and interaction.
As shown in , a scenario is depicted featuring a river, forests covering mountains, a human settlement situated along the river in the valley, a highway crossing the mountain and river features, a piece of cultivated land on the ground surface, and a geological fault under the ground in the original scene. The relationships between these entities are also presented.
Figure 14. Visualized scene of natural resource entities and disasters along with knowledge graph update process.
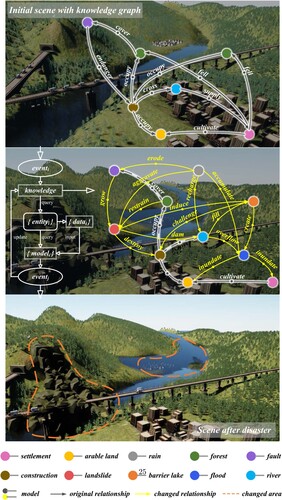
When the event happens, signals are received by the knowledge graph, and then spatiotemporal query pattern is triggered which consists of complex semantic associations and link computations. Entity nodes at multiple levels are activated and combined into a complex semantic framework for further queries, which is output to the data layer through mapping relationships and mechanism model layer. And the corresponding nodes at the data layer are activated and updated as input of models. With the effect of the data-model-knowledge, we apply higher level patterns for prediction or analysis of events, and the output results become the input of the knowledge graph for an update. When multiple entity nodes are output to the data layer, the activated data nodes are connected through patterns and relationships to finally form a complete data chain, thus updating the spatiotemporal relationships between natural resource entities.
In the scenario, when raining heavily, the rain eroded the fault, both of which increased the potential of the landslide. When a landslide occurred, it damaged the river and destroyed the highway. Thus, a barrier lake was formed. When the barrier lake broke, the land was flooded, which inundated the human settlement and cultivated land. According to these actions, the interactional relationships between these natural resource entities and events were constructed through the knowledge graph and the through mechanism models. We found that the relationships between the human settlement and the forests had an effect on landslides and the local geological structures were ignored in constructing highways and tunnels, highlighting that certain relationships were responsible for a series of disaster occurrences.
5.3. Case 2: unified territorial spatial planning
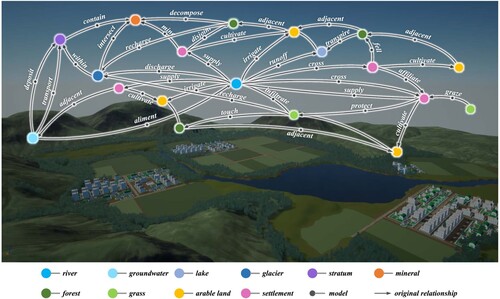
As with the disaster process, by querying the relationships with the river entity through the knowledge graph, we can identify other natural resource entities such as forests, grasses, lakes, arable land, and human settlements that are closely related to this river entity on a certain scale. Not only the spatial topology but also the interactional relationships can be mined and calculated through mechanism models. The visual display module queries specific spatial data at the data-knowledge-model layer through the identification of entities and displays the natural resource entities within the corresponding scope in a linkage manner. As shown in , the interactional relationships between natural resource entities are more intuitively expressed through a visual display.
Figure 15. Visualization of natural resources surrounding the river and interactional relationships.
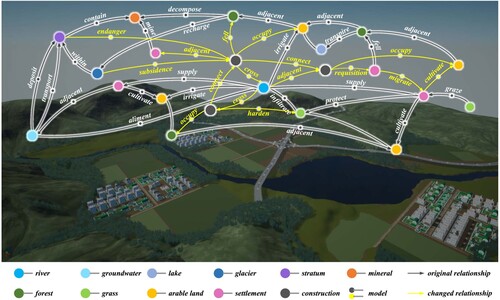
Assuming that a national highway is planned to be built through this region, the route selection and the impacts on the surrounding objects have to be integrally and thoroughly calculated and evaluated in advance. The integrated data-model-knowledge representation model provides the knowledge base of calculations and evaluations. The complicated interactional relationships can be decomposed by multiple relationships and the calculations of them can be achieved by the composition of the mechanism models.
The visualization module intuitively shows the impact of highway construction on the natural resource entities surrounding the human settlements of the region which helps the unified territorial spatial planning. The interactional relationships which are changed by the highway construction are quickly mined and updated through the knowledge graph and mechanism models. These are depicted in . The visualization module lays a foundation for the efficient, accurate, and transparent perception of the complex distribution and mutual associations of the natural resources, both aboveground and underground.
Figure 16. Changes of interactional relationships between natural resources due to human construction; relationships that changed during construction are colored in yellow.
6. Conclusion
In this paper, an integrated data-model-knowledge representation for natural resource entities is proposed, consisting of attributes, time, and space, based on an in-depth analysis of the characteristics of natural resources. Importantly, the proposed model identifies the general structure of spatiotemporal relationships between natural resources which incorporate mechanism models to indicate implicit knowledge and depict the laws of natural and geographical phenomena. The proposed model provides a logical structure for using graph databases which adopts the structure of a spatiotemporal relationship graph for the explicit expression of interactional relationships in order to fill the gap between the conceptual and physical representation. The model also incorporates a spatiotemporal query pattern with structural and semantic restrict based on a knowledge graph in order to optimize the matching results.
The model inherits object-oriented modeling's advantages and graph-based representation's practical benefits. Data-model-knowledge representation is based on the ability of object-oriented models to explicitly represent entity object structure, extend comprehensive semantic expression, and model complex objects. The model adopts elementary 3D geometry and improves the geometric-semantic multiscale representation hierarchy with the consideration of natural resource characteristics and applications. In the meanwhile, knowledge graph with mechanism models incorporated is provided to strengthen the explicit expression of causality, interaction and evolution relationships between natural resource entities, to facilitate pattern-matching queries, and to break through the limitation of data-centered descriptive analysis. Typical use cases illustrate the potential of developing data-model-knowledge linkage representation and management for data manipulation, knowledge graph update, and spatiotemporal queries, which could help to discover implicit geographic knowledge and reveal the evolutionary mechanisms of natural resource entities.
Further work should not be limited to more sufficient performance experiments on the model, but also should explore at a comprehensive, fundamental and conceptual layer of the model to improve the model's applicability. On the basis of integrated data-model-knowledge representation for natural resource entities, a unified, high-precision and refined spatiotemporal reference framework for the whole area is bound to build up to realize accurate mapping of the digital twin from macro to micro, from outdoor to indoor, and from aboveground to underground for the mechanism law behavior portrayal through multiple levels of details of real 3D models so that we can look forward to its compatibility and application in other fields like VR.
Acknowledgments
We appreciate the detailed suggestions and constructive comments from the editor and anonymous reviewers.
Data availability statement
The data that support the findings of this study are openly available in Zenodo at https://doi.org/10.5281/zenodo.5715940, https://doi.org/10.5281/zenodo.6016580.
Disclosure statement
No potential conflict of interest is reported by the author(s).
Additional information
Funding
References
- Ahmed, Zahoor, Muhammad Mansoor Asghar, Muhammad Nasir Malik, and Kishwar Nawaz. 2020. “Moving Towards a Sustainable Environment: The Dynamic Linkage Between Natural Resources, Human Capital, Urbanization, Economic Growth, and Ecological Footprint in China.” Resources Policy 67: 101677.
- Allen, James F. 1983. “Maintaining Knowledge About Temporal Intervals.” Communications of the ACM 26 (11): 832–843.
- Angles, Renzo, and Claudio Gutierrez. 2008. “Survey of Graph Database Models.” ACM Computing Surveys (CSUR) 40 (1): 1–39.
- Armstrong, Marc P. 1988. “Temporality in Spatial Databases.“GIS/LIS 88 Proceedings: Accessing the World: Third Annual International Conference, Exhibits and Workshops on Geographic Information Systems: 880–889. San Antonio, Texas.
- Bach, Benjamin, Pierre Dragicevic, Daniel Archambault, Christophe Hurter, and Sheelagh Carpendale. 2017. “A Descriptive Framework for Temporal Data Visualizations Based on Generalized Space-Time Cubes.” Computer Graphics Forum 36: 36–61.
- Bak, Peter R. G., and Andrew J. B. Mill. 2020. Three Dimensional Applications in Geographical Information Systems, 155–182. London: CRC Press.
- Bassiri, Anahid, Mohammad R. Malek, Ali A. Alesheikh, and Pouria Amirian. 2009. “Temporal relationships between rough time interval. International Conference on Computational Science and Its Applications. 543–552. Berlin, Heidelberg.
- Belletti, Barbara, Massimo Rinaldi, Martina Bussettini, Francesco Comiti, Angela M. Gurnell, Luca Mao, Laura Nardi, and Paolo Vezza. 2017. “Characterising Physical Habitats and Fluvial Hydromorphology: A New System for the Survey and Classification of River Geomorphic Units.” Geomorphology 283 (2): 143–157.
- Bishr, Yaser. 1998. “Overcoming the Semantic and Other Barriers to GIS Interoperability.” International Journal of Geographical Information Science 12 (4): 299–314.
- Chang, Shi-Kuo, Qing-Yun Shi, and Cheng-Wen Yan. 1987. “Iconic Indexing by 2-D Strings.” IEEE Transactions on Pattern Analysis and Machine Intelligence (3): 413–428.
- Chen, Jun, Chengming Li, Zhilin Li, and Christopher Gold. 2001. “A Voronoi-based 9-intersection Model for Spatial Relations.” International Journal of Geographical Information Science 15 (3): 201–220.
- Cova, Thomas J., and Michael F. Goodchild. 2002. “Extending Geographical Representation to Include Fields of Spatial Objects.” International Journal of Geographical Information Science 16 (6): 509–532.
- Deng, Min, Wentao Yang, Qiliang Liu, Rui Jin, Feng Xu, and Yunfei Zhang. 2017. “Heterogeneous Space-Time Artificial Neural Networks for Space-Time Series Prediction.” Transactions in GIS 22 (1): 183–201. doi:10.1111/%2Ftgis.12302.
- Egenhofer, Max J., and Robert D. Franzosa. 1991. “Point-set Topological Spatial Relations.” International Journal of Geographical Information System 5 (2): 161–174.
- Fan, Runyu, Lizhe Wang, Jining Yan, Weijing Song, Yingqian Zhu, and Xiaodao Chen. 2020. “Deep Learning-Based Named Entity Recognition and Knowledge Graph Construction for Geological Hazards.” ISPRS International Journal of Geo-Information 9 (1): 102. https://www.mdpi.com/2220-9964/9/1/15.
- Feng, Bin, Qing Zhu, Mingwei Liu, Yun Li, Junxiao Zhang, Xiao Fu, Yan Zhou, et al. 2018. “An Efficient Graph-based Spatio-temporal Indexing Method for Task-oriented Multi-modal Scene Data Organization.” ISPRS International Journal of Geo-Information 7 (9): 371.
- Goodchild, Michael F., May Yuan, and Thomas J. Cova. 2007. “Towards a General Theory of Geographic Representation in GIS.” International Journal of Geographical Information Science 21 (3): 239–260.
- Gröger, Gerhard, Thomas H. Kolbe, Claus Nagel, and Karl-Heinz Häfele. 2012. OGC City Geography Markup Language (CityGML) Encoding Standard. 2nd ed. Arlington, VA, USA: Open Geospatial Consortium.
- Höhne, Karl Heinz, Michael Bomans, Andreas Pommert, Martin Riemer, Carsten Schiers, Ulf Tiede, and Gunnar Wiebecke. 1990. “3D Visualization of Tomographic Volume Data Using the Generalized Voxel Model.” The Visual Computer 6 (1): 28–36.
- Huang, Weiming, and Lars Harrie. 2020. “Towards Knowledge-based Geovisualisation Using Semantic Web Technologies: A Knowledge Representation Approach Coupling Ontologies and Rules.” International Journal of Digital Earth 13 (9): 976–997.
- Huang, Yi, May Yuan, Yehua Sheng, Xiangqiang Min, and Yuwei Cao. 2019. “Using Geographic Ontologies and Geo-characterization to Represent Geographic Scenarios.” ISPRS International Journal of Geo-Information 8 (12). https://www.mdpi.com/2220-9964/8/12/566.
- ISO 19107:2019. 2019. Geographic Information – Spatial Schema. Standard. Geneva: International Organization for Standardization.
- Jamei, Elmira, Michael Mortimer, Mehdi Seyedmahmoudian, Ben Horan, and Alex Stojcevski. 2017. “Investigating the Role of Virtual Reality in Planning for Sustainable Smart Cities.” Sustainability 9 (11): 2006. https://www.mdpi.com/2071-1050/9/11/2006.
- Jiang, Dingfu. 2020. “The Construction of Smart City Information System Based on the Internet of Things and Cloud Computing.” Computer Communications 150 (1): 158–166.
- Jochen Renz, and Bernhard Nebel. 2007. “Qualitative spatial reasoning using constraint calculi.” In Handbook of spatial logics, 161–215. Dordrecht: Springer.
- Keil, Julian, Dennis Edler, Thomas Schmitt, and Frank Dickmann. 2021. “Creating Immersive Virtual Environments Based on Open Geospatial Data and Game Engines.” KN-Journal of Cartography and Geographic Information 71 (1): 53–65.
- Kolbe, Thomas H., Gerhard Gröger, and Lutz Plümer. 2005. CityGML: Interoperable Access to 3D City Models, 883–899. Berlin: Springer Berlin Heidelberg. doi:10.1007/3-540-27468-5_63.
- Kraak, Menno-Jan. 2003. “The Space-Time Cube Revisited From a Geovisualization Perspective." Proceedings of the 21st International Cartographic Conference, 1988-1996. Durban, South Africa.
- Kühne, Olaf, Dennis Edler, and Corinna Jenal. 2021. “A Multi-perspective View on Immersive Virtual Environments (IVEs).” ISPRS International Journal of Geo-Information 10 (8). https://www.mdpi.com/2220-9964/10/8/518.
- Lane, Belize A., Gregory B. Pasternack, Helen E. Dahlke, and Samuel Sandoval-Solis. 2017. “The Role of Topographic Variability in River Channel Classification.” Progress in Physical Geography 41 (5): 570–600.
- Langran, Gail, and Nicholas R. Chrisman. 1988. “A Framework for Temporal Geographic Information.” Cartographica: The International Journal for Geographic Information and Geovisualization 25 (3): 1–14.
- Laranjeiras, Thiago Orsi, Luciano Nicolas Naka, and Mario Cohn-Haft. 2019. “Using River Color to Predict Amazonian Floodplain Forest Avifaunas in the World's Largest Blackwater River Basin.” Biotropica 51 (3): 330–341.
- Ledoux, Hugo. 2018. “val3dity: Validation of 3D GIS Primitives According to the International Standards.” Open Geospatial Data, Software and Standards 3 (1): 1–12.
- Leung, Yee, Yu Zhou, Ka-Yu Lam, Tung Fung, Kwan-Yau Cheung, Taehong Kim, and Hanmin Jung. 2019. “Integration of Air Pollution Data Collected by Mobile Sensors and Ground-based Stations to Derive a Spatiotemporal Air Pollution Profile of a City.” International Journal of Geographical Information Science 33 (11): 2218–2240. doi:10.1080/13658816.2019.1633468.
- Li, Songnian, Suzana Dragicevic, Francesc Antón Castro, Monika Sester, Stephan Winter, Arzu Coltekin, Christopher Pettit, et al. 2016. “Geospatial Big Data Handling Theory and Methods: A Review and Research Challenges.” ISPRS Journal of Photogrammetry and Remote Sensing 115 (4): 119–133.
- Li, Sanjiang, and Weiming Liu. 2015. “Cardinal Directions: A Comparison of Direction Relation Matrix and Objects Interaction Matrix.” International Journal of Geographical Information Science 29 (2): 194–216.
- Liu, Yansui, and Yang Zhou. 2021. “Territory Spatial Planning and National Governance System in China.” Land Use Policy 102 (5): 105288.
- Lü, Guonian, Michael Batty, Josef Strobl, Hui Lin, A-Xing Zhu, and Min Chen. 2019. “Reflections and Speculations on the Progress in Geographic Information Systems (GIS): A Geographic Perspective.” International Journal of Geographical Information Science 33 (2): 346–367.
- Lü, Guonian, Min Chen, Linwang Yuan, Liangchen Zhou, Yongning Wen, Mingguan Wu, Bin Hu, Zhaoyuan Yu, Songshan Yue, and Yehua Sheng. 2018. “Geographic Scenario: A Possible Foundation for Further Development of Virtual Geographic Environments.” International Journal of Digital Earth 11 (4): 356–368.
- Mennis, Jeremy L., Donna J. Peuquet, and Liujian Qian. 2000. “A Conceptual Framework for Incorporating Cognitive Principles into Geographical Database Representation.” International Journal of Geographical Information Science 14 (6): 501–520.
- Molenaar, M. 1990. “A Formal Data Structure for Three-Dimensional Vector Maps. Proc. EGIS'90 Amsterdam Vol. 2 (1990) 770–781. Ook: Proc. Commission III ISPRS, Wuhan, PR China (1990) 535–550. Ook: Proc. 4th Int. Symp. Spatial data handling, Zürich, Switzerland Vol. 2. 830–843.
- Nan, Liu, Liu Renyi, Zhu Guangliang, and Xie Jiong. 2006. “A Spatial-temporal System for Dynamic Cadastral Management.” Journal of Environmental Management 78 (4): 373–381.
- Pei, Tao, Ci Song, Sihui Guo, Hua Shu, Yaxi Liu, Yunyan Du, Ting Ma, and Chenghu Zhou. 2020. “Big Geodata Mining: Objective, Connotations and Research Issues.” Journal of Geographical Sciences 30 (2): 251–266.
- Perrin, Laurent, Nathalie Beauvais, and Marta Puppo. 2001. “Procedural Landscape Modeling with Geographic Information: The IMAGIS Approach.” Landscape and Urban Planning 54 (1–4): 33–47.
- Peuquet, Donna J., and Niu Duan. 1995. “An Event-Based Spatiotemporal Data Model (ESTDM) for Temporal Analysis of Geographical Data.” International Journal of Geographical Information Systems 9 (1): 7–24.
- Randell, David A., Zhan Cui, and Anthony G. Cohn. 1992. “A Spatial Logic Based on Regions and Connection.” KR 92: 165–176.
- Rosen, Roland, Jan Fischer, and Stefan Boschert. 2019. “Next Generation Digital Twin: An Ecosystem for Mechatronic Systems?” IFAC-PapersOnLine 52 (15): 265–270.
- Shen, Jingwei, Min Chen, and Xintao Liu. 2018. “Classification of Topological Relations Between Spatial Objects in Two-dimensional Space Within the Dimensionally Extended 9-intersection Model.” Transactions in GIS 22 (2): 514–541.
- Strahler, Arthur N. 1957. “Quantitative Analysis of Watershed Geomorphology.” Eos, Transactions American Geophysical Union 38 (6): 913–920.
- Tadaki, Marc, Gary Brierley, and Carola Cullum. 2014. “River Classification: Theory, Practice, Politics.” Wiley Interdisciplinary Reviews: Water 1 (4): 349–367.
- Thellbro, Camilla, Therese Bjärstig, and Katarina Eckerberg. 2018. “Drivers for Public–Private Partnerships in Sustainable Natural Resource Management – Lessons from the Swedish Mountain Region.” Sustainability 10 (11): 3914.
- Wang, Chengbin, Xiaogang Ma, Jianguo Chen, and Jingwen Chen. 2018. “Information Extraction and Knowledge Graph Construction from Geoscience Literature.” Computers & Geosciences 112 (5): 112–120. https://www.sciencedirect.com/science/article/pii/S0098300417309020.
- Wang, Quan, Zhendong Mao, Bin Wang, and Li Guo. 2017. “Knowledge Graph Embedding: A Survey of Approaches and Applications.” IEEE Transactions on Knowledge and Data Engineering 29 (12): 2724–2743.
- Wen, Yongning, Min Chen, Songshan Yue, Peibei Zheng, Guoqiang Peng, and Guonian Lu. 2017. “A Model-service Deployment Strategy for Collaboratively Sharing Geo-analysis Models in an Open Web Environment.” International Journal of Digital Earth 10 (4): 405–425.
- Wilcox, David J., Matthew C. Harwell, and Robert J. Orth. 2000. “Modeling Dynamic Polygon Objects in Space and Time: A New Graph-Based Technique.” Cartography and Geographic Information Science 27 (2): 153–164.
- Wilson, Hugh R., and James R. Bergen. 1979. “A Four Mechanism Model for Threshold Spatial Vision.” Vision Research 19 (1): 19–32.
- Wu, Lixin. 2004. “Topological Relations Embodied in a Generalized Tri-prism (GTP) Model for a 3D Geoscience Modeling System.” Computers & Geosciences 30 (4): 405–418.
- Xue, Cunjin, Chengbin Wu, Jingyi Liu, and Fenzhen Su. 2019. “A Novel Process-Oriented Graph Storage for Dynamic Geographic Phenomena.” ISPRS International Journal of Geo-Information 8 (2): 100. https://www.mdpi.com/2220-9964/8/2/100.
- Yao, Zhihang, Claus Nagel, Felix Kunde, György Hudra, Philipp Willkomm, Andreas Donaubauer, Thomas Adolphi, and Thomas H. Kolbe. 2018. “3DCityDB-a 3D Geodatabase Solution for the Management, Analysis, and Visualization of Semantic 3D City Models Based on CityGML.” Open Geospatial Data, Software and Standards 3 (1): 1–26.
- Zhang, Yunhao, Jun Zhu, Qing Zhu, Yakun Xie, Weilian Li, Lin Fu, Junxiao Zhang, and Jianmei Tan. 2020. “The Construction of Personalized Virtual Landslide Disaster Environments Based on Knowledge Graphs and Deep Neural Networks.” International Journal of Digital Earth 13 (12): 1637–1655.
- Zhu, Junxiang, Xiangyu Wang, Peng Wang, Zhiyou Wu, and Mi Jeong Kim. 2019. “Integration of BIM and GIS: Geometry from IFC to Shapefile Using Open-Source Technology.” Automation in Construction 102 (3): 105–119.
- Zhu, Qing, Junxiao Zhang, Yulin Ding, Mingwei Liu, Yun Li, Bin Feng, Shuangxi Miao, et al. 2019. “Semantics-Constrained Advantageous Information Selection of Multimodal Spatiotemporal Data for Landslide Disaster Assessment.” ISPRS International Journal of Geo-Information 8 (2): 68.
- Zlatanova, Siyka, Alias Rahman, and Morakot Pilouk. 2002. “3D GIS: Current Status and Perspectives.” International Archives of Photogrammetry Remote Sensing and Spatial Information Sciences 34 (4): 66–71.