
 ?Mathematical formulae have been encoded as MathML and are displayed in this HTML version using MathJax in order to improve their display. Uncheck the box to turn MathJax off. This feature requires Javascript. Click on a formula to zoom.
ABSTRACT
Cloud computing facilities can provide crucial computing support for processing the time series of satellite data and exploiting their spatio-temporal information content. However, dedicated efforts are still required to develop workflows, executable on cloud-based platforms, for ingesting the satellite data, performing the targeted processes, and generating the desired products. In this study, an operational workflow is proposed, based on monthly Evaporative Stress Index (ESI) anomaly, and implemented in cloud-based online Virtual Earth Laboratory (VLab) platform, as a demonstration, to monitor European agricultural water stress. To this end, daily time-series of actual and reference evapotranspiration (ETa and ET0), from the Spinning Enhanced Visible and Infrared Imager (SEVIRI) sensor, were used to execute the proposed workflow successfully on VLab. The execution of the workflow resulted in obtaining one decade (2011–2020) of European monthly agricultural water stress maps at 0.04˚ spatial resolution and corresponding stress reports for each country. To support open science, all the workflow outputs are stored in GeoServer, documented in GeoNetwork, and made available through MapStore. This enables creating a dashboard for better visualization of the results for end-users. The results from this study demonstrate the capability of VLab platform for water stress detection from time series of SEVIRI-ET data.
1. Introduction
High-performance computing (HPC) facilities are required to ingest, process, utilize and unlock the full capacity of heterogeneous and big data efficiently. Cloud computing, as an HPC, can deliver scalable and on-demand access to a pool of computing resources (Li et al. Citation2020; Mell and Grance Citation2011; Yang et al. Citation2011). Making use of cloud-based platforms can open up new avenues and aid applications in computational hydrology, especially at larger scales. Thus, designing various showcases where public cloud-based platforms are employed to execute a scientific workflow for tackling water resources challenges is a crucial step that can further speed the development of Digital Earth.
Among major water resources challenges, drought is one of the deadliest (Hillier Citation2012) and costliest (Cook et al. Citation2007; Ding, Hayes, and Widhalm Citation2011). Agricultural drought (i.e. soil moisture deficit), compared to other drought types, has the most direct and immediate impacts (Mishra and Singh Citation2010). It has adverse effects on ecosystem properties (Bayat, van der Tol, and Verhoef Citation2020; Bayat, Van der Tol, and Verhoef Citation2016), functioning (Bayat, Van der Tol, and Verhoef Citation2018), and crop yield (Lidon and Cebola Citation2012). For instance, it is reported as one of the most critical factors driving crop productivity loss at the global scale and reducing the average yields of major crops by more than 50% (Buchanan, Gruissem, and Jones Citation2015; Wang, Vinocur, and Altman Citation2003). Therefore water stress monitoring, i.e. tracking the stress severity, location, and impacts (Wilhite and Buchanan-Smith Citation2005) is of utmost importance in order to take effective water, land, and crop management actions. Moreover, the need for quantifying the level of water stress in different sectors is also highlighted by the United Nations Sustainable Development Goals (SDGs) in indicator 6.4.2 (United Nations Citation2015). To address the objectives of international agreements such as SDGs and the Paris agreement on the climate, the European Commission supported the ERA-PLANET Horizon 2020 project ‘The European Network for Observing our Changing Planet’, especially the GEOEssential strand, where Earth Observation (EO) is employed for monitoring resource efficiency utilization, environmental management purposes and assessing the progress made towards achieving SDGs. Thus, satellite remote sensing of agricultural water stress levels is also a relevant contribution to quantify SDGs status.
With an increasing network of EO satellites, it is possible to get access to free and open access data that can provide regular, reliable, and timely information through space and time for practical water stress assessment (Anderson et al. Citation2016). Various EO data sets, in the form of satellite-derived Essential Climate Variable (ECV) products (Bayat et al. Citation2021; Lehmann et al. Citation2020a), have been employed to quantify agricultural water stress. For instance, precipitation as plant water supply indicator (Gao et al. Citation2018; Lu et al. Citation2018; Toté et al. Citation2015; Zambrano et al. Citation2017; Zhao et al. Citation2018; Zhong et al. Citation2019), soil moisture as plant water availability indicator (Ford and Quiring Citation2019; Gu et al. Citation2021; Martínez-Fernández et al. Citation2016; Nicolai-Shaw et al. Citation2017; Padhee et al. Citation2017; Tavakol et al. Citation2021; Vroege et al. Citation2021; Zhu et al. Citation2019), land surface temperature as plant water demand indicator (Cammalleri and Vogt Citation2015; Hu et al. Citation2019, Citation2020; Karnieli et al. Citation2010; Mustafa, Abd El-Hamid, and Tarawally Citation2021; Orhan, Ekercin, and Dadaser-Celik Citation2014; Qin, Li, and Gao Citation2006; Wan, Wang, and Li Citation2004; M. Yang et al. Citation2021; Zhao et al. Citation2021), evapotranspiration as plant actual water use indicator (Anderson and Kustas Citation2008; Anderson et al. Citation2016; Szewczak et al. Citation2020; Y. Yang et al Citation2021; Zhan et al. Citation2021), and vegetation indices as plant progress and vegetation health indicator (Bokusheva et al. Citation2016; Chang et al. Citation2021, Citation2017; Jamshidi, Zand-Parsa, and Niyogi Citation2021; Jiang et al. Citation2021; Lawal et al. Citation2021; Singh, Roy, and Kogan Citation2003) have been utilized for water stress detection globally.
Among widely-used satellite ECVs, evapotranspiration (ET) is a proper proxy for quantifying water stress levels and investigating its effects on terrestrial ecosystems. It influences land surface water availability and integrates environmental factors such as meteorological conditions and soil moisture (Sepulcre-Canto et al. Citation2014). ET is considered as a very useful ECV that carries valuable information regarding water stress impacts due to the fact that reduction of plant transpiration, as a result of leaf stomatal closure, is expected to occur before usually visible symptoms appear in the plant growth rate (Hsiao Citation1973).
The ET derived from the Spinning Enhanced Visible and Infrared Imager (SEVIRI) sensor onboard the Meteosat Second Generation (MSG) satellites, located at 0-degree longitude, is an advanced satellite product being characterized by the high temporal (30 min), moderate spatial resolution (3 km at nadir) and considerable coverage (Europe, Africa and the eastern part of South America) making it a suitable candidate for systematic water stress monitoring.
There are two relevant SEVIRI derived ET data products distributed by the EUMETSAT Satellite Application Facility on Land Surface Analysis (LSA SAF) (https://landsaf.ipma.pt/en/data/; last access: 23 February 2022); (i) SEVIRI – actual ET (hereafter called SEVIRI-ETa) that accounts for the water evaporated from the soil surface, vegetation canopy and water bodies, and (ii) SEVIRI – reference ET (hereafter called SEVIRI-ET0) that accounts for the (local) atmospheric demand and corresponds to the ET from a hypothetical well-watered green grass having 12 cm height and 0.23 albedo under the given down-welling short-wave radiation (Allen et al. Citation1998). These data sets are being provided in near real-time through the LSA SAF operational system.
Several studies have used SEVIRI-derived ET products for drought monitoring, water management, and quality assessment purposes (Ghilain, Arboleda, and Gellens-Meulenberghs Citation2011; Hu, Jia, and Menenti Citation2015; Petropoulos et al. Citation2016, Citation2015; Sepulcre-Canto et al. Citation2014; Trigo et al. Citation2018). Nonetheless, the full potential of SEVIRI-derived ET products, particularly recent publications, for water stress detection remained unexplored. For instance, Sepulcre-Canto et al. (Citation2014) assessed the potential of SEVIRI-ETa, besides other climate and vegetation variables, for drought analysis. They normalized SEVIRI-ETa by ET0 products of the European Centre for Medium-Range Weather Forecasts (ECMWF) interim reanalysis (SEVIRI-ETa/ECMWF-ET0) to compensate for the atmospheric demand during two drought episodes of spring/summer 2007 (in the Carpathian region) and 2011 (in the European continent). Their results demonstrated that significant potential exists in normalized SEVIRI-ETa products for capturing the soil moisture variability and, therefore, identifying ecosystem drought compared to other vegetation and climate-related drought indices. In their study, Sepulcre-Canto et al. (Citation2014), (i) implemented all the algorithms, and performed the analyses locally, which may not be discoverable and accessible as input for further ecosystem analysis by potential external users, (ii) did not utilize LSA SAF distributed SEVIRI-ET0 products in the normalization process, (iii) mainly focused on drought detection at two short episodes (i.e. spring/summer 2007 and 2011), and therefore due to the lack of long term records, they could not characterize ‘normal’ conditions, for a robust calculation of anomalies.
To fill the above-mentioned gaps, this study aims to make use of multi-cloud and web-services technologies to implement an operational workflow to quantify water stress in Europe from a recently published time series of SEVIRI-ETa and SEVIRI-ET0 data. Therefore, the main focus is to implement, execute and analyze the advantages and drawbacks of the workflow in an online Virtual Earth Laboratory (VLab) (Santoro, Mazzetti, and Nativi Citation2020) platform, utilizing Amazon Web Services, as a demonstration, to quantify one-decade (2011–2020) of monthly spatio-temporal water stress variations for the entire European continent. Moreover, to encourage open science, we published the methodology, and all produced results through GitHub (for the workflow code), GeoServer (for the workflow outputs), and GeoNetwork (for documentation of GeoServer layers), enabling it to create a dashboard for better visualization and utilization of results for end-users and (policy) decision-makers.
2. Data
One decade (2011–2020) of daily SEVIRI-ETa and SEVIRI-ET0 data was selected for this study (). These time-series data are published by LSA SAF and identified initially as DMET LSA-312 and METREF LSA-303 products, respectively. All SEVIRI data used in this analysis were stored in standard Hierarchical Data Format (HDF) files obtained from the LSA SAF repository (https://landsaf.ipma.pt; last access: 23 February 2022). As summarized in , SEVIRI-ETa data covered the Europe area for the period 1 January 2011–10 November 2015, while it covered the whole MSG disk (i.e. Europe, Africa, and the eastern part of South America) for the rest of the period (11 November 2015–31 December 2020). However, SEVIRI-ET0 data covered the full disk region for the entire period (1 January 2011–31 December 2020).
Table 1. SEVIRI ET satellite observations utilized in this study and their main characteristics.
In total, 7261 images (i.e. 3627 SEVIRI-ETa and 3634 SEVIRI-ET0) were selected for this study. Basic pre-processing was performed in R software program to re-project the images from the original native geostationary projection to the Geographical Coordinate System of World Geodetic System 1984 (GCS WGS 1984), re-sampling the images to 0.04° spatial resolution and masking all images with MSG disk coverage based on selected extent (−10° to 34° longitude, 33° to 73° latitude) for the European continent.
3. Methods
In this study, a simple water stress detection workflow was implemented in an online VLab utilizing Amazon Web Services to monitor one decade (2011–2020) of spatio-temporal water stress variations for the entire European continent. The proposed water stress workflow is based on the classification of monthly ESI anomalies. Moreover, the utilized resources and the key results have been stored, documented, and made available through online platforms. Detailed information about the methods is provided in the following sections.
3.1. Evaporative Stress Index (ESI) anomaly and water stress classes
The ESI is computed at the monthly time step from the SEVIRI-ETa and SEVIRI-ET0 (Equations (1–4)). Normalizing by SEVIRI-ET0 can reduce the effects of atmospheric demand and insolation load (Anderson et al. Citation2016) and, therefore, detect soil moisture deficit effects that are directly linked to agricultural water stress. In this study, all the monthly composited ESI were transferred into standardized anomalies by considering ‘normal’ mean condition and temporal standard deviation over the baseline period (2011–2020) described in EquationEquation (4)(4)
(4) .
(1)
(1)
(2)
(2)
(3)
(3)
(4)
(4) where ETa is SEVIRI-ETa [mm day−1], ET0 is SEVIRI-ET0 [mm day−1],
is the (mean) composite of ETa for month m, year y, and i,j grid location,
is the ETa value on day n, and nc is the number of days during a month. Similarly,
is the (mean) composite of ET0 for month m, year y, and i,j grid location,
is the ET0 value on day n, and nc is the number of days during a month. The
is the (mean) composite of ESI for month m, year y, and i,j grid location and finally,
is the standardized anomalies at pixel i,j for month m and year y. The second term in the numerator of EquationEquation (4)
(4)
(4) defines the ‘normal’ field, averaged over all years ny, and the denominator is the standard deviation.
In order to classify the ESI anomaly values, a standard normal distribution (i.e. with a mean of zero and standard deviation of one) was assumed for the data, similar to (Santos et al. Citation2019), in which negative ESI values indicate more severe stress conditions and vice versa ().
Table 2. Classification of drought severity based on ESI value.
3.2. Workflow implementation in VLab
Our workflow for calculating monthly ESI anomalies and water stress maps has been implemented in VLab (https://vlab.geodab.eu; last access: 23 February 2022). The VLab (Santoro, Mazzetti, and Nativi Citation2020), inspired by the GEO Model Web vision (Nativi, Mazzetti, and Geller Citation2013; Santoro, Nativi, and Mazzetti Citation2016), is developed to facilitate scientific workflows implementation for supporting knowledge generation and evidence-based decision-making. VLab enables: (i) web-based access to heterogeneous resources (e.g. data) from various systems. This can significantly facilitate the use of extensive satellite data and in-situ measurements, (ii) efficient connection of data and models by means of scientific workflows, (iii) execution of workflows, written in different programming languages, in a cloud platform with easy access to data repository and knowledge generation for the end-users, and (iv) publication of workflow outputs and results. VLab functionalities are all available through Web Application Programming Interfaces (APIs), making it possible for the end-users to develop their own applications. When a model is published on VLab, the framework can trigger its execution on a variety of cloud platforms, allowing to seamlessly move the code to the cloud platform where the required input data is hosted. Several tests were executed on different cloud platforms including the European Open Science Cloud (EOSC), the commercial Amazon Web Services (AWS) cloud and most Copernicus DIAS platforms (Creodias, ONDA, Sobloo).
Scientific models are developed in many different programming environments (e.g. Python, Java, R, MATLAB, etc.). In order to support multiple programming languages and environments without imposing constraints on model providers (as much as possible), VLab relies on containerization (or container-based virtualization) technology. This ensures not only that the utilized language is supported, but also that all the required libraries are available for model execution. To this aim, model developers are required to provide a set of VLab convention files which provide the following information, used by VLab for executing the model:
Model execution environment, including:
o Docker image to be used to run the model;
o Computational resources required to execute the model (i.e. memory and/or CPU);
o The command to execute to trigger the model execution;
Source code files required by the model; VLab will copy all required files to the execution environment;
Input/output description: information about where (i.e. in which folder) the model expects to find its input(s) and where it stores the output(s) of the computation.
The water stress detection workflow in VLab takes as inputs daily time series of SEVIRI-ETa, SEVIRI-ET0, and a border of Europe (as a shapefile). In the workflow, VLab calculates monthly SEVIRI-ETa and SEVIRI-ET0, long-term ‘normal’ and monthly ESI based on Equations (1–4). Thus, the script calculates ESI monthly anomalies, water stress maps, and also national levels stress reports based on the fraction of each stress class in total land area as the most important workflow outputs ().
Figure 1. Monthly water stress workflow implemented in VLab.
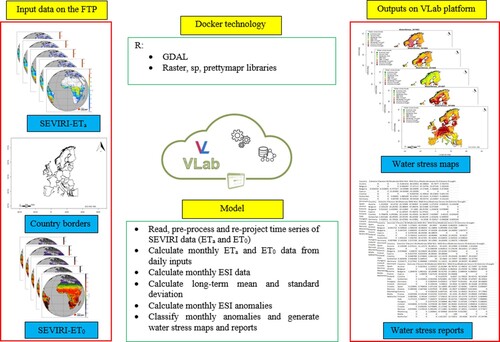
The monthly water stress levels workflow is implemented as R script in the Docker image that is used by VLab platform with further workflow launch. The workflow is available via GitHub (https://github.com/bagherbayat/Monthly_Water_Stress_Levels.git; last access: 23 February 2022). A VLab-user can find our workflow in the list of available workflows in the platform and select it for execution. To this end, the user should provide three input URLs to access SEVIRI-ETa (https://zenodo.org/record/6239078/files/ETa.zip?download=1; last access: 23 February 2022), SEVIRI-ET0 (https://zenodo.org/record/6239078/files/ET0.zip?download=1; last access: 23 February 2022) and country borders as a shapefile (https://zenodo.org/record/6239078/files/EU_Border.zip?download=1; last access: 23 February 2022). The needed inputs files are stored in the Zenodo repository (https://doi.org/10.5281/zenodo.6239078; last access: 23 February 2022) and can be freely accessed by any user.
3.3. VLab-generated results visualization and representation
All time series of outputs from VLab workflow execution are made available using GeoServer (http://geoserver.org; last access: 23 February 2022). GeoServer is an open-source web server explicitly developed to publish geospatial data under widely accepted standards (e.g. Web Map Service [WMS], Web Coverage Service [WCS]) advanced by the Open Geospatial Consortium (OGC) (Giuliani et al. Citation2020b, Citation2013). It provides the users with the possibility to access, share, and integrate data and results in an interoperable and standardized way (Giuliani et al. Citation2020b).
To better enable the end-users to visualize and explore our workflow outputs in a comprehensive manner, the results are organized in a dashboard environment. Dashboards are useful tools that can facilitate end-user interactions with simple to complex data and information (Van Ginkel et al. Citation2018) and can potentially support decision-makers and help practitioners to better explore and understand an issue (Fegraus et al. Citation2012).
We selected MapStore (http://mapstore.geo-solutions.it; last access: 23 February 2022) to create a dashboard for our case due to the fact that it is an open-source web-based application providing a secure environment to share maps, mashups, and dashboards following OGC standards. Common standard geoportal functionalities such as map visualization, data discovery, and geospatial analysis are provided in MapStore, allowing the end-users to make queries over the data and integrate various data sets into a single map (Giuliani et al. Citation2020b). Moreover, it allows creating dashboards by means of several widgets (e.g. maps, charts, tables, and text boxes).
4. Results
4.1. The outputs of water stress workflow in VLab
The monthly water stress levels model implemented in VLab is shown in . Three outputs generated from model execution in VLab by the end-users; (1) one-decade (2011–2020) maps of monthly water stress levels as vector (JPG format) files, (2) maps of water stress levels as raster (GeoTiff format) files, and (3) text reports (tables) containing the percentage of the land area exposed to various water stress conditions at the national level. Representative examples of water stress maps and text reports are presented in this section.
4.1.1. Water stress levels maps
The spatio-temporal variations of agricultural water stress levels at monthly time steps are quantified for one decade (2011–2020) across the European continent at 0.04˚ resolution. The spatio-temporal variations of agricultural water stress for July 2011–July 2020 are shown as a representative example in .
Figure 2. Representative time series maps of water stress levels generated in VLab for the month of July across Europe in 2011 (a), 2012 (b), 2013 (c), 2014 (d), 2015 (e), 2016 (f), 2017 (g), 2018 (h), 2019 (i) and 2020 (j).
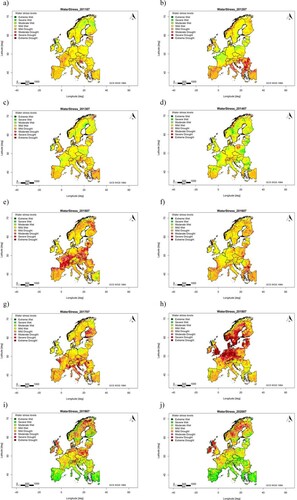
The results demonstrated that mild conditions (both mild wet and mild drought) were dominant stress classes in July 2011 ((a)) and July 2012 ((b)) at the whole continent level. However, moderate, and severe drought conditions considerably increased, especially in the Southeast part of Europe, in July 2012 compared to July 2011. The first moderate and severe water stress conditions observed in southern Europe in July 2012 ((b)). In general, water stress levels in July 2013 ((c)) and July 2014 ((d)) were comparable to water stress levels in July 2011 ((a)). Mild wet and mild drought stress classes were the dominant ones in the European continental scale in July 2013 ((c)). In July 2014, mild conditions (i.e. mild wet, moderate wet, severe, and extreme wet) occurred more frequently than dry ones. The water stress map of July 2015 ((e)) clearly showed pronounced water stress in central and Northern Europe, including mild, moderate, severe, and extreme drought conditions. In July 2016, more water stress conditions were observed in southern Europe ((f)) compared to July 2015. Further, in July 2017 ((g)), mild drought and extreme wet conditions were the largest and smallest water stress types, respectively in Europe.
The results demonstrated that July 2018 ((h)) was the driest month among all other months under investigation. This can clearly be seen from the corresponding map of water stress classes in July 2018 in Europe. In July 2019 ((i)), the distribution of water stress classes changed in such a way that about two-thirds of the area was exposed to wet conditions. In July 2020 ((j)), although there were some drought conditions in Northern and Western Europe, wet classes were dominant considering the whole area.
4.1.2. Water stress levels reports
One representative example of text reports (tables) is presented in , to provide an overview of the third model output generated in VLab. This table presents the percentage of land exposed to different water stress levels at the national level (i.e. the fraction of each stress class in the country). The table shows that, for instance, 45%, 24.85%, 16.19%, and 11.14% of the total land in Germany experienced extreme, severe, moderate, and mild drought conditions in July 2018, respectively. However, only 2.31% of the total land was exposed to wet conditions (i.e. mild wet 1.87%, moderate wet 0.30%, severe wet 0.13%, and extreme wet 0.01%). The results demonstrated that in July 2018 Germany was drier compared to, for instance, July 2020, since the corresponding stress report in July 2020 showed that only 38.11% of the total land in Germany experienced dry conditions (i.e. 0.06%, 1.14%, 8.86% and 28.04% as extreme, severe, moderate and mild drought conditions, respectively) (results not shown). However, about 61.88% of the total land was categorized as wet conditions (i.e. mild wet 36.78%, moderate wet 13.82%, severe wet 9.21%, and extreme wet 2.05%).
Table 3. A representative example (July 2018) of text report (table) output file at the national level generated from the monthly water stress model executed in VLab platform.
4.2. Visualization and representation of the workflow results
All water stress maps and text reports are made available for end-users not only as separate raster layers and shapefile reports in GeoServer (http://geoessential.unepgrid.ch/geoserver; last access: 23 February 2022) and documented in the metadata catalog of the GeoNetwork (https://geoessential.unepgrid.ch/geonetwork/; last access: 23 February 2022), but also as time series representation in MapStore (https://geoessential.unepgrid.ch/mapstore; last access: 23 February 2022). The main outputs of the developed monthly water stress workflow are integrated into a dashboard, as the visual front-end, facilitating a straightforward and comprehensive one-(web)page document enabling quick visualization and analysis of water stress conditions in Europe (). The created dashboard from the monthly water stress outputs of VLab enables spatio-temporal exploration of water stress maps as well as informative indicators at national levels.
Figure 3. Created a dashboard (a snapshot) for monthly water stress levels at the European scale. For more information, the reader is referred to the interactive dashboard at (https://geoessential.unepgrid.ch/mapstore/#/dashboard/105/; last access: 23 February 2022).
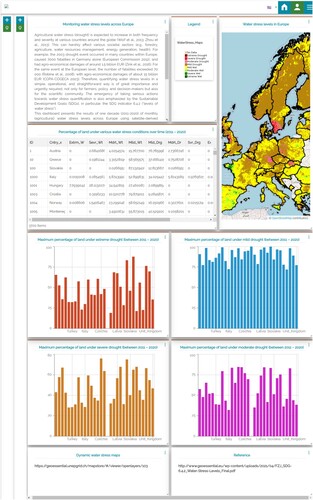
In the dashboard, the water stress map, graphs, and tables are synchronized and dynamically updated according to the user selected zoom level. The visualization is only available for the area (e.g. countries) that are visible in the zoom level window. Some basic information, in the form of text, is provided in the dashboard to highlight the workflow model, its key inputs, and the main outputs to inform the end-users. Moreover, a table is created for the dashboard to summarize the percentage of the land exposed to different water stress classes at the national level. This mimics, in fact, the text reports generated in VLab. One example of such text reports is shown and described in . Four bar charts are designed in the dashboard to better visualize the maximum percentage of land under four different classes of drought (i.e. extreme, severe, moderate, and mild droughts) over the selected decade (2011–2020) ().
5. Discussion
As a cloud-based VLab demonstration, a water stress detection workflow has been implemented to generate one decade (2011–2020) of monthly water stress maps from SEVIRI ET data. The water stress maps and reports generated by the workflow execution are based on the remotely-sensed ESI anomalies as an indicator of agricultural drought. The ESI has widely been utilized to detect water stress mainly due to its effective parametrization for considering not only the surface water supply (e.g. soil and crop water content) but also the atmospheric demand (e.g. air temperature, wind speed, and solar radiation). The ESI has demonstrated, for instance, in the United States, the potential to provide valuable information in the early stages of deteriorating crop moisture status in comparison to drought indices derived from vegetation indices and precipitation (Anderson et al. Citation2013, Citation2011; Otkin et al. Citation2014, Citation2013). Studies in Europe have further shown the capability of remotely-sensed ESI in providing additional information compared to vegetation, precipitation, and temperature-related stress indices (Sepulcre-Canto et al. Citation2014).
Employing EO (i.e. SEVIRI data) to detect agricultural water stress levels at continental scale (i.e. Europe) by means of cloud computation techniques (i.e. Amazon Web Services) through the VLab platform is, to the best of the authors’ knowledge, the first attempt toward systematic monitoring of SDG 6.4.2 (i.e. water stress level) in the agricultural sector. The implemented monthly water stress levels workflow in VLab was mainly a proof-of-concept. The first results obtained from the water stress workflow indicate how one can chain various pre-processing, processing, and post-processing in a simple model to quantify spatio-temporal variations of water stress levels from satellite data with fully open access and a transparent approach. The VLab platform has previously been employed in a few studies, and its capacity unlocked successfully for addressing other SDGs using EO data. For example, a workflow has been developed and ported into VLab to generate knowledge about land degradation (SDG 15.3.1) at national, continental, and global scales (Giuliani et al. Citation2020b, Citation2020a). Furthermore, three more workflows were developed and executed in VLab in order to quantify the ratio of forest area to total land area (SDG 15.1.1), the ratio of degraded land to total land area (SDG 15.3.1), and the ratio of productive and sustainable agricultural area to total agricultural area (SDG 2.4.1) over the territory of Ukraine (Kussul et al. Citation2020). VLab has further been utilized to execute three simple workflows related to food, water, and energy systems and discussed the possibility of feeding the outputs into food, water, and energy nexus model framework, including several widely-used models (McCallum et al. Citation2019).
In this study, the first version of the monthly water stress workflow implementation in VLab was successful, demonstrated not only benefits to the application developers, scientific researchers, and (policy) decision-makers but also showed limitations and needs for further improvements to consolidate the approach.
With respect to the VLab water stress workflow benefits, it has proven: (1) the possibility to run the model at desired geographical scales (i.e. scalability), (2) the potential to feed the model with other data sources at different spatial and temporal resolutions and processing infrastructure (i.e. flexibility), (3) the ability to produce the results by the VLab users (i.e. reproducibility) since all resources and models are fully open access and transparent, and (4) the opportunity to gain detailed knowledge about water stress compared to routine and traditional statistics (i.e. exhaustivity). This can facilitate the effective use of EO data sources for better monitoring of water stress variations. An additional benefit is that the proposed workflow can move easily toward the long-term water stress monitoring system in Europe using SEVIRI operational data products. Indeed, currently, the water stress levels are captured only for one decade (2011–2020); however, this period can be extended as soon as the SEVIRI data products are released and available for being ingested by the workflow. More importantly, the implemented workflow can pave the way for supporting (policy) decision-makers to gain the required knowledge. The outputs of the proposed water stress levels workflow are spatio-temporal maps of water stress and text reports of stress. Although the quantitative interpretation of the maps might need time and some more profound knowledge, the text reports can provide a very quick and valuable overview of water stress at desired administrative levels over time which is interesting for (policy) decision-makers’ work. This is significant since it can efficiently embed science into the decision-making process and help to solve a real-world problem. Moreover, the outputs of our workflow implementation might also contribute to the European Drought Observatory (EDO) (https://edo.jrc.ec.europa.eu; last access: 23 February 2022) by providing supplementary ESI anomalies information (e.g. maps and reports). In EDO, the drought status is being regularly quantified mainly based on precipitation indicator [i.e. standardized precipitation index (SPI)], soil moisture [i.e. soil moisture anomaly (SMA)], vegetation condition [i.e. the fraction of absorbed photosynthetically active radiation (FAPAR)], low-flow river index (i.e. LFI), temperature [i.e. heat and cold wave index (HCWI)] and combined drought indicators [i.e. anomalies of precipitation, soil moisture, and satellite-measured vegetation condition]. Therefore, water stress maps based on ESI anomalies can be a complementary data set in EDO, and their combination with available EDO drought indicators can be useful, for instance, to effectively manage agricultural irrigation systems for severe water stress prevention.
There is room for improvement in the implemented VLab water stress workflow since the current version was developed as a proof-of-concept and the first demonstration. The current workflow uses ET inputs from SEVIRI geostationary satellite; however, in practice, it would also be beneficial to extend the workflow in such a way to create the possibility of making use of more complex models, making it possible to retrieve ET from other satellite sensors (e.g. Landsat and Sentinel-2, -3) and quantify the water stress levels at higher spatial resolutions for smaller regions. This is significant and can help, for instance, farmers to find out fields under water stress. Moreover, the proposed approach can be adopted to quantify other types of water stress (e.g. meteorological, agricultural and hydrological droughts) by using appropriate data sources and possibly different models in the VLab platform. This is of primary importance since it can assist in obtaining a synoptic overview of different water stress conditions considering a range of droughts in the desired area and ultimately serve as an operational early-warning system. Another improvement possibility lies in the evaluation of the final water stress maps. Although limited validation has been performed to directly assess the quality of all the input data of the workflow (i.e. time series of SEVIRI-ETa and -ET0) by the LSA SAF, the evaluation of the model output is mostly restricted to visual interpretation and comparison in the time series to identify the spatial variation of water stress levels. When possible, the water stress maps and reports could also be compared with other authoritative water stress maps and local statistics at the national level, respectively.
Probably one way to better manage water stress conditions is to improve water resource management capacities at the national level to quantify water stress at the total land and support monitoring mechanisms. The implemented workflow can contribute to such management capacity development efforts since, in the current version, the water stress text reports are provided at the national level beside the maps which are available for each European country. This management strategy can not only ensure national ownership but also keep the flexibility for countries to utilize the supplementary national data (Giuliani et al. Citation2020b).
As mentioned before, this study is the first VLab demonstration for quantifying water stress levels in Europe using SEVIRI observations, and therefore, the main focus was mainly placed on the implementation of the workflow in VLab. Further, to provide the reader with an overview of the VLab outputs, we briefly described a few representative results from the workflow. However, as an implication of the implemented workflow and its outputs, there is a potential to analyze the whole time-series of the generated stress maps and discuss their spatio-temporal variations across Europe during the last decade. For instance, it is expected to gain knowledge by a detailed analysis of various ecosystems’ responses to water stress, so that we can identify a general trend in the response of vegetated ecosystems to drought using the time series of SEVIRI-ESI-based monthly water stress values and anomalies. This is currently under investigation by the authors.
The proposed approach in this study enhances reproducible science since the user has open access not only to the required resources (inputs), algorithms (the model script), and the execution platform (VLab) but also to the generated results (maps and reports) of the workflow stored on selected platforms (GeoServer and MapStore) and visualized in a dashboard. Through the dashboard as the visual front-end, the user can gain knowledge about European agricultural water stress by visual analysis of the maps, text reports (table), and the bar charts in the dashboard. All this knowledge is exposed through widely-used interfaces such as OGC standards providing data discovery, access, and use in an efficient manner. This is in line with the FAIR (Findable, Accessible, Interoperable, Reusable) data principles (Stall et al. Citation2019; Wilkinson et al. Citation2016). The dashboard demonstrates that EO, if linked properly with relevant tools and services, can assist in filling the gap between science and society ((policy) decision-makers) (Lehmann et al. Citation2020b).
VLab platform also has its own advantages and limitations with respect to workflows implementation. Among the key advantages, VLab (i) allows data and models sharing, (ii) provides the users with flexibility about the model resource utilization, (iii) enables reproducibility in support of open science, (iv) provides the possibility of replicability and reusability of scientific processes and model comparison. However, VLab might not be the best option, for instance, in two extreme cases: either when very complex simulation models (e.g. weather forecasts) or very light models (e.g. simple index from a satellite image) are desired for the implementation purposes. In the first case (i.e. complex models) dedicated computing resources are required for the sake of high performances, while, in the second case (i.e. light models) there is no need for cloud resources, and the model can be executed on-the-fly in a browser. Moreover, there are still significant organizational challenges to move VLab to a pre-operational and multi-organizational context. For more information about the VLab capabilities and characteristics, the reader is referred to Santoro, Mazzetti, and Nativi (Citation2020).
6. Conclusions
In this study, a water stress detection workflow has been implemented and executed on the cloud-based online VLab platform to quantify monthly water stress from daily SEVIRI-ETa and SEVIRI-ET0 data for the last decade (2011–2020). The water stress workflow is proposed based on ESI anomalies that classifies various water stress levels. Executing the workflow in VLab produces not only the spatio-temporal variations of water stress in Europe for the last decade (i.e. 2011–2020) but also reports the percentage of land in each country exposed to various water stress levels. For better visualization and utilization of the workflow outputs for end-users and (policy) decision-makers, all the water stress maps and reports are stored in GeoServer, documented in GeoNetwork, and made available through MapStore, enabling it to create a dashboard. This suggests that VLab as a model execution and orchestration engine along with MapStore and dashboard as a visualization tool can simply, but effectively, be employed to embed science into the decision-making process. Moreover, this water stress workflow implementation in VLab has demonstrated that it is feasible, from the technical point of view, to implement a scalable and flexible approach to assist in monitoring monthly water stress levels at a continental scale using satellite observations.
Acknowledgements
The authors would like to thank Dr. Roberto Salzano from Institute of Atmospheric Pollution Research at National Research Council of Italy – (CNR) and Dr. Thomas Poméon from (formerly) Forschungszentrum Jülich GmbH and (currently) Deutsche Telekom IT GmbH Germany, for thier fruitful discussions and valuable support in the course of this study.
Data availability statement
All the needed inputs data that support the findings of this study are published and openly available through Zenodo repository (https://doi.org/10.5281/zenodo.6239078; last access: 23 February 2022). Moreover, the complete data is available and can be accessed through the EUMETSAT Satellite Application Facility on Land Surface Analysis (LSA SAF) database (https://landsaf.ipma.pt/en/data/; last access: 23 February 2022).
Disclosure statement
No potential conflict of interest was reported by the author(s).
Additional information
Funding
References
- Allen, R. G., L. S. Pereira, D. Raes, and M. Smith. 1998. “Crop Evapotranspiration: Guidelines for Computing Crop Requirements.” Irrigation and Drainage Paper No. 56, FAO 300. doi:10.1016/j.eja.2010.12.001.
- Anderson, M. C., C. Hain, J. Otkin, X. Zhan, K. Mo, M. Svoboda, B. Wardlow, and A. Pimstein. 2013. “An Intercomparison of Drought Indicators Based on Thermal Remote Sensing and NLDAS-2 Simulations with US Drought Monitor Classifications.” Journal of Hydrometeorology 14: 1035–1056.
- Anderson, M. C., C. Hain, B. Wardlow, A. Pimstein, J. R. Mecikalski, and W. P. Kustas. 2011. “Evaluation of Drought Indices Based on Thermal Remote Sensing of Evapotranspiration Over the Continental United States.” Journal of Climate 24: 2025–2044. doi:10.1175/2010JCLI3812.1.
- Anderson, M., and W. Kustas. 2008. “Thermal Remote Sensing of Drought and Evapotranspiration.” Eos, Transactions, American Geophysical Union 89: 233–234.
- Anderson, M. C., C. A. Zolin, P. C. Sentelhas, C. R. Hain, K. Semmens, M. Tugrul Yilmaz, F. Gao, J. A. Otkin, and R. Tetrault. 2016. “The Evaporative Stress Index as an Indicator of Agricultural Drought in Brazil: An Assessment Based on Crop Yield Impacts.” Remote Sensing of Environment 174: 82–99. doi:10.1016/j.rse.2015.11.034.
- Bayat, B., F. Camacho, J. Nickeson, M. Cosh, J. Bolten, H. Vereecken, and C. Montzka. 2021. “Toward Operational Validation Systems for Global Satellite-Based Terrestrial Essential Climate Variables.” International Journal of Applied Earth Observation and Geoinformation 95: 102240. doi:10.1016/j.jag.2020.102240.
- Bayat, B., C. Van der Tol, and W. Verhoef. 2016. “Remote Sensing of Grass Response to Drought Stress Using Spectroscopic Techniques and Canopy Reflectance Model Inversion.” Remote Sensing 8: 557. doi:10.3390/rs8070557.
- Bayat, B., C. Van der Tol, and W. Verhoef. 2018. “Integrating Satellite Optical and Thermal Infrared Observations for Improving Daily Ecosystem Functioning Estimations During a Drought Episode.” Remote Sensing of Environment 209: 375–394. doi:10.1016/j.rse.2018.02.027.
- Bayat, B., C. van der Tol, and W. Verhoef. 2020. “Retrieval of Land Surface Properties from an Annual Time Series of Landsat TOA Radiances During a Drought Episode Using Coupled Radiative Transfer Models.” Remote Sensing of Environment 238. doi:10.1016/j.rse.2018.09.030.
- Bokusheva, R., F. Kogan, I. Vitkovskaya, S. Conradt, and M. Batyrbayeva. 2016. “Satellite-based Vegetation Health Indices as a Criteria for Insuring Against Drought-Related Yield Losses.” Agricultural and Forest Meteorology 220: 200–206.
- Buchanan, B. B., W. Gruissem, and R. L. Jones. 2015. Biochemistry and Molecular Biology of Plants. Hoboken, NJ: John Wiley & Sons.
- Cammalleri, C., and J. Vogt. 2015. “On the Role of Land Surface Temperature as Proxy of Soil Moisture Status for Drought Monitoring in Europe.” Remote Sensing 7: 16849–16864.
- Chang, S., H. Chen, B. Wu, E. Nasanbat, N. Yan, and B. Davdai. 2021. “A Practical Satellite-Derived Vegetation Drought Index for Arid and Semi-Arid Grassland Drought Monitoring.” Remote Sensing 13: 414.
- Chang, S., B. Wu, N. Yan, B. Davdai, and E. Nasanbat. 2017. “Suitability Assessment of Satellite-Derived Drought Indices for Mongolian Grassland.” Remote Sensing 9: 650.
- Cook, E. R., R. Seager, M. A. Cane, and D. W. Stahle. 2007. “North American Drought: Reconstructions, Causes, and Consequences.” Earth-Science Rev 81: 93–134.
- Ding, Y., M. J. Hayes, and M. Widhalm. 2011. “Measuring Economic Impacts of Drought: A Review and Discussion.” Disaster Prevention and Management 20 (4): 434–446. doi:10.1108/09653561111161752.
- Fegraus, E. H., I. Zaslavsky, T. Whitenack, J. Dempewolf, J. A. Ahumada, K. Lin, and S. J. Andelman. 2012. “Interdisciplinary Decision Support Dashboard: A new Framework for a Tanzanian Agricultural and Ecosystem Service Monitoring System Pilot.” IEEE Journal of Selected Topics in Applied Earth Observations and Remote Sensing 5: 1700–1708.
- Ford, T. W., and S. M. Quiring. 2019. “Comparison of Contemporary in Situ, Model, and Satellite Remote Sensing Soil Moisture with a Focus on Drought Monitoring.” Water Resources Research 55: 1565–1582.
- Gao, F., Y. Zhang, X. Ren, Y. Yao, Z. Hao, and W. Cai. 2018. “Evaluation of CHIRPS and its Application for Drought Monitoring Over the Haihe River Basin, China.” Natural Hazards 92: 155–172.
- Ghilain, N., A. Arboleda, and F. Gellens-Meulenberghs. 2011. “Evapotranspiration Modelling at Large Scale Using Near-Real Time MSG SEVIRI Derived Data.” Hydrology and Earth System Sciences 15: 771–786. doi:10.5194/hess-15-771-2011.
- Giuliani, G., B. Chatenoux, A. Benvenuti, P. Lacroix, M. Santoro, and P. Mazzetti. 2020a. “Monitoring Land Degradation at National Level Using Satellite Earth Observation Time-Series Data to Support SDG15–Exploring the Potential of Data Cube.” Big Earth Data 4: 3–22. doi:10.1080/20964471.2020.1711633.
- Giuliani, G., P. Mazzetti, M. Santoro, S. Nativi, J. Van Bemmelen, G. Colangeli, and A. Lehmann. 2020b. “Knowledge Generation Using Satellite Earth Observations to Support Sustainable Development Goals (SDG): A Use Case on Land Degradation.” International Journal of Applied Earth Observation and Geoinformation 88: 102068. doi:10.1016/j.jag.2020.102068.
- Giuliani, G., N. Ray, S. Schwarzer, A. De Bono, P. Peduzzi, H. Dao, J. Van Woerden, R. Witt, M. Beniston, and A. Lehmann. 2013. “Sharing Environmental Data Through GEOSS.” In Emerging Methods and Multidisciplinary Applications in Geospatial Research, edited by D. P. Albert and G. R. Dobbs, 266–281. Hershey, PA: IGI Global.
- Gu, X., S. Jamshidi, H. Sun, and D. Niyogi. 2021. “Identifying Multivariate Controls of Soil Moisture Variations Using Multiple Wavelet Coherence in the U.S. Midwest.” Journal of Hydrology 602: 126755. doi:10.1016/j.jhydrol.2021.126755.
- Hillier, D. 2012. A Dangerous Delay: The Cost of Late Response to Early Warnings in the 2011 Drought in the Horn of Africa. Oxford: Oxfam.
- Hsiao, T. C. 1973. “Plant Responses to Water Stress.” Annual Review of Plant Physiology 24: 519–570.
- Hu, G., L. Jia, and M. Menenti. 2015. “Comparison of MOD16 and LSA-SAF MSG Evapotranspiration Products Over Europe for 2011.” Remote Sensing of Environment 156: 510–526. doi:10.1016/j.rse.2014.10.017.
- Hu, X., H. Ren, K. Tansey, Y. Zheng, D. Ghent, X. Liu, and L. Yan. 2019. “Agricultural Drought Monitoring Using European Space Agency Sentinel 3A Land Surface Temperature and Normalized Difference Vegetation Index Imageries.” Agricultural and Forest Meteorology 279: 107707.
- Hu, T., L. J. Renzullo, A. I. J. M. van Dijk, J. He, S. Tian, Z. Xu, J. Zhou, T. Liu, and Q. Liu. 2020. “Monitoring Agricultural Drought in Australia Using MTSAT-2 Land Surface Temperature Retrievals.” Remote Sensing of Environment 236: 111419.
- Jamshidi, S., S. Zand-Parsa, and D. Niyogi. 2021. “Assessing Crop Water Stress Index of Citrus Using in-Situ Measurements, Landsat, and Sentinel-2 Data.” International Journal of Remote Sensing 42: 1893–1916.
- Jiang, R., J. Liang, Y. Zhao, H. Wang, J. Xie, X. Lu, and F. Li. 2021. “Assessment of Vegetation Growth and Drought Conditions Using Satellite-Based Vegetation Health Indices in Jing-Jin-Ji Region of China.” Scientific Reports 11: 1–18. doi:10.1038/s41598-021-93328-z.
- Karnieli, A., N. Agam, R. T. Pinker, M. Anderson, M. L. Imhoff, G. G. Gutman, N. Panov, and A. Goldberg. 2010. “Use of NDVI and Land Surface Temperature for Drought Assessment: Merits and Limitations.” Journal of Climate 23: 618–633.
- Kussul, N., M. Lavreniuk, A. Kolotii, S. Skakun, O. Rakoid, and L. Shumilo. 2020. “A Workflow for Sustainable Development Goals Indicators Assessment Based on High-Resolution Satellite Data.” International Journal of Digital Earth, doi:10.1080/17538947.2019.1610807.
- Lawal, S., B. Hewitson, T. S. Egbebiyi, and A. Adesuyi. 2021. “On the Suitability of Using Vegetation Indices to Monitor the Response of Africa’s Terrestrial Ecoregions to Drought.” Science of the Total Environment 792: 148282. doi:10.1016/j.scitotenv.2021.148282.
- Lehmann, A., J. Masò, S. Nativi, and G. Giuliani. 2020a. “Towards Integrated Essential Variables for Sustainability.” International Journal of Digital Earth 13: 158–165. doi:10.1080/17538947.2019.1636490.
- Lehmann, A., S. Nativi, P. Mazzetti, J. Maso, I. Serral, D. Spengler, A. Niamir, et al. 2020b. “GEOEssential–Mainstreaming Workflows from Data Sources to Environment Policy Indicators with Essential Variables.” International Journal of Digital Earth 13: 322–338. doi:10.1080/17538947.2019.1585977.
- Li, Y., M. Yu, M. Xu, J. Yang, D. Sha, Q. Liu, and C. Yang. 2020. Manual of Digital Earth. Singapore: Springer. doi:10.1007/978-981-32-9915-3.
- Lidon, Z. Z., and F. Cebola. 2012. “An Overview on Drought Induced Changes in Plant Growth, Water Relations and Photosynthesis.” Emirates Journal of Food and Agriculture 24: 57–72.
- Lu, J., L. Jia, M. Menenti, Y. Yan, C. Zheng, and J. Zhou. 2018. “Performance of the Standardized Precipitation Index Based on the TMPA and CMORPH Precipitation Products for Drought Monitoring in China.” IEEE Journal of Selected Topics in Applied Earth Observations and Remote Sensing 11: 1387–1396.
- Martínez-Fernández, J., A. González-Zamora, N. Sánchez, A. Gumuzzio, and C. M. Herrero-Jiménez. 2016. “Satellite Soil Moisture for Agricultural Drought Monitoring: Assessment of the SMOS Derived Soil Water Deficit Index.” Remote Sensing of Environment 177: 277–286. doi:10.1016/j.rse.2016.02.064.
- McCallum, I., C. Montzka, B. Bayat, S. Kollet, A. Kolotii, N. Kussul, M. Lavreniuk, et al. 2019. “Developing Food, Water and Energy Nexus Workflows.” International Journal of Digital Earth 1–10. doi:10.1080/17538947.2019.1626921.
- Mell, P., and T. Grance. 2011. The NIST-National Institute of Standars and Technology- Definition of Cloud Computing. Special Publication 800-145.
- Mishra, A. K., and V. P. Singh. 2010. “A Review of Drought Concepts.” Journal of Hydrology 391: 202–216.
- Mustafa, E. K., H. T. Abd El-Hamid, and M. Tarawally. 2021. “Spatial and Temporal Monitoring of Drought Based on Land Surface Temperature, Freetown City, Sierra Leone, West Africa.” Arabian Journal of Geosciences 14, doi:10.1007/s12517-021-07187-z.
- Nativi, S., P. Mazzetti, and G. N. Geller. 2013. “Environmental Model Access and Interoperability: The GEO Model Web Initiative.” Environmental Modelling & Software 39: 214–228.
- Nicolai-Shaw, N., J. Zscheischler, M. Hirschi, L. Gudmundsson, and S. I. Seneviratne. 2017. “A Drought Event Composite Analysis Using Satellite Remote-Sensing Based Soil Moisture.” Remote Sensing of Environment 203: 216–225.
- Orhan, O., S. Ekercin, and F. Dadaser-Celik. 2014. “Use of Landsat Land Surface Temperature and Vegetation Indices for Monitoring Drought in the Salt Lake Basin Area, Turkey.” Scientific World Journal 2014: 142939. doi:10.1155/2014/142939.
- Otkin, J. A., M. C. Anderson, C. Hain, I. E. Mladenova, J. B. Basara, and M. Svoboda. 2013. “Examining Rapid Onset Drought Development Using the Thermal Infrared–Based Evaporative Stress Index.” Journal of Hydrometeorology 14: 1057–1074.
- Otkin, J. A., M. C. Anderson, C. Hain, and M. Svoboda. 2014. “Examining the Relationship Between Drought Development and Rapid Changes in the Evaporative Stress Index.” Journal of Hydrometeorology 15: 938–956.
- Padhee, S. K., B. R. Nikam, S. Dutta, and S. P. Aggarwal. 2017. “Using Satellite-Based Soil Moisture to Detect and Monitor Spatiotemporal Traces of Agricultural Drought Over Bundelkhand Region of India.” GIScience & Remote Sensing 54: 144–166.
- Petropoulos, G. P., G. Ireland, A. Cass, and P. K. Srivastava. 2015. “Performance Assessment of the SEVIRI Evapotranspiration Operational Product: Results Over Diverse Mediterranean Ecosystems.” Ieee Sensors Journal 15: 3412–3423. doi:10.1109/JSEN.2015.2390031.
- Petropoulos, G. P., G. Ireland, S. Lamine, H. M. Griffiths, N. Ghilain, V. Anagnostopoulos, M. R. North, P. K. Srivastava, and H. Georgopoulou. 2016. “Operational Evapotranspiration Estimates from SEVIRI in Support of Sustainable Water Management.” International Journal of Applied Earth Observation and Geoinformation 49: 175–187. doi:10.1016/j.jag.2016.02.006.
- Qin, Z., W. Li, M. Gao, and H Zhang. 2006. Remote Sensing for Agriculture, Ecosystems, and Hydrology Viii 297–304. doi:10.1117/12.689307.
- Santoro, M., P. Mazzetti, and S. Nativi. 2020. “The VLab Framework: An Orchestrator Component to Support Data to Knowledge Transition.” Remote Sensing 12: 1795.
- Santoro, M., S. Nativi, and P. Mazzetti. 2016. “Contributing to the GEO Model Web Implementation: A Brokering Service for Business Processes.” Environmental Modelling & Software 84: 18–34.
- Santos, C. A. G., R. M. Brasil Neto, R. M. da Silva, and D. C. dos Santos. 2019. “Innovative Approach for Geospatial Drought Severity Classification: A Case Study of Paraíba State, Brazil.” Stochastic Environmental Research and Risk Assessment 33 (32): 545–562. doi:10.1007/s00477-018-1619-9.
- Sepulcre-Canto, G., J. Vogt, A. Arboleda, and T. Antofie. 2014. “Assessment of the EUMETSAT LSA-SAF Evapotranspiration Product for Drought Monitoring in Europe.” International Journal of Applied Earth Observation and Geoinformation 30: 190–202.
- Singh, R. P., S. Roy, and F. Kogan. 2003. “Vegetation and Temperature Condition Indices from NOAA AVHRR Data for Drought Monitoring Over India.” International Journal of Remote Sensing 24: 4393–4402.
- Stall, S., L. Yarmey, J. Cutcher-Gershenfeld, B. Hanson, K. Lehnert, B. Nosek, M. Parsons, E. Robinson, and L. Wyborn. 2019. “Make Scientific Data FAIR.” Nature 570 (June): 27–29.
- Szewczak, K., H. Łoś, R. Pudełko, A. Doroszewski, Ł Gluba, M. Łukowski, A. Rafalska-Przysucha, J. Słomiński, and B. Usowicz. 2020. “Agricultural Drought Monitoring by MODIS Potential Evapotranspiration Remote Sensing Data Application.” Remote Sensing 12. doi:10.3390/rs12203411.
- Tavakol, A., K. R. McDonough, V. Rahmani, S. L. Hutchinson, and J. M. S. Hutchinson. 2021. “The Soil Moisture Data Bank: The Ground-Based, Model-Based, and Satellite-Based Soil Moisture Data.” Remote Sensing Applications: Society and Environment 24: 100649. doi:10.1016/j.rsase.2021.100649.
- Toté, C., D. Patricio, H. Boogaard, R. der Wijngaart, E. Tarnavsky, and C. Funk. 2015. “Evaluation of Satellite Rainfall Estimates for Drought and Flood Monitoring in Mozambique.” Remote Sensing 7: 1758–1776.
- Trigo, I. F., H. de Bruin, F. Beyrich, F. C. Bosveld, P. Gavilán, J. Groh, and R. López-Urrea. 2018. “Validation of Reference Evapotranspiration from Meteosat Second Generation (MSG) Observations.” Agricultural and Forest Meteorology 259: 271–285. doi:10.1016/j.agrformet.2018.05.008.
- United Nations. 2015. Transforming Our World: The 2030 Agenda for Sustainable Development. New York: United Nations.
- Van Ginkel, K. C. H., A. Y. Hoekstra, J. Buurman, and R. J. Hogeboom. 2018. “Urban Water Security Dashboard: Systems Approach to Characterizing the Water Security of Cities.” Journal of Water Resources Planning and Management 144: 4018075.
- Vroege, W., J. Bucheli, T. Dalhaus, M. Hirschi, and R. Finger. 2021. “Insuring Crops from Space: The Potential of Satellite-Retrieved Soil Moisture to Reduce Farmers’ Drought Risk Exposure.” European Review of Agricultural Economics 48: 266–314. doi:10.1093/erae/jbab010.
- Wan, Z., P. Wang, and X. Li. 2004. “Using MODIS Land Surface Temperature and Normalized Difference Vegetation Index Products for Monitoring Drought in the Southern Great Plains, USA.” International Journal of Remote Sensing 25: 61–72.
- Wang, W., B. Vinocur, and A. Altman. 2003. “Plant Responses to Drought, Salinity and Extreme Temperatures: Towards Genetic Engineering for Stress Tolerance.” Planta 218: 1–14.
- Wilhite, D. A., and M. Buchanan-Smith. 2005. Drought and Water Crises: Science, Technology, and Management Issues. Vol. 3, 1–29. Boca Raton, FL: CRC Press.
- Wilkinson, M. D., M. Dumontier, I. J. Aalbersberg, G. Appleton, M. Axton, A. Baak, N. Blomberg, et al. 2016. “The FAIR Guiding Principles for Scientific Data Management and Stewardship.” Scientific Data 3: 1–9.
- Yang, Y., M. C. Anderson, F. Gao, J. D. Wood, L. Gu, and C. Hain. 2021. “Studying Drought-Induced Forest Mortality Using High Spatiotemporal Resolution Evapotranspiration Data from Thermal Satellite Imaging.” Remote Sensing of Environment 265: 112640. doi:10.1016/j.rse.2021.112640.
- Yang, C., M. Goodchild, Q. Huang, D. Nebert, R. Raskin, Y. Xu, M. Bambacus, and D. Fay. 2011. “Spatial Cloud Computing: How Can the Geospatial Sciences use and Help Shape Cloud Computing?” International Journal of Digital Earth 4: 305–329.
- Yang, M., W. Zhao, Q. Zhan, and D. Xiong. 2021. “Spatiotemporal Patterns of Land Surface Temperature Change in the Tibetan Plateau Based on MODIS/Terra Daily Product from 2000 to 2018.” IEEE Journal of Selected Topics in Applied Earth Observations and Remote Sensing 14: 6501–6514. doi:10.1109/JSTARS.2021.3089851.
- Zambrano, F., B. Wardlow, T. Tadesse, M. Lillo-Saavedra, and O. Lagos. 2017. “Evaluating Satellite-Derived Long-Term Historical Precipitation Datasets for Drought Monitoring in Chile.” Atmospheric Research 186: 26–42.
- Zhan, X., L. Fang, J. Yin, M. Schull, J. Liu, C. Hain, M. Anderson, W. Kustas, and S. Kalluri. 2021. “Remote Sensing of Evapotranspiration for Global Drought Monitoring.” Global Drought and Flood: Monitoring, Prediction, and Adaptation, edited by Huan Wu, Dennis P. Lettenmaier, Qiuhong Tang, and Philip J. Ward, 29–46. Washington, DC: American Geophysical Union (AGU).
- Zhao, Q., Q. Chen, M. Jiao, P. Wu, X. Gao, M. Ma, and Y. Hong. 2018. “The Temporal-Spatial Characteristics of Drought in the Loess Plateau Using the Remote-Sensed TRMM Precipitation Data from 1998 to 2014.” Remote Sensing 10: 838.
- Zhao, X., H. Xia, L. Pan, H. Song, W. Niu, R. Wang, R. Li, X. Bian, Y. Guo, and Y. Qin. 2021. “Drought Monitoring Over Yellow River Basin from 2003–2019 Using Reconstructed MODIS Land Surface Temperature in Google Earth Engine.” Remote Sensing 13, doi:10.3390/rs13183748.
- Zhong, R., X. Chen, C. Lai, Z. Wang, Y. Lian, H. Yu, and X. Wu. 2019. “Drought Monitoring Utility of Satellite-Based Precipitation Products Across Mainland China.” Journal of Hydrology 568: 343–359.
- Zhu, Q., Y. Luo, Y.-P. Xu, Y. Tian, and T. Yang. 2019. “Satellite Soil Moisture for Agricultural Drought Monitoring: Assessment of SMAP-Derived Soil Water Deficit Index in Xiang River Basin, China.” Remote Sensing 11: 362.