
 ?Mathematical formulae have been encoded as MathML and are displayed in this HTML version using MathJax in order to improve their display. Uncheck the box to turn MathJax off. This feature requires Javascript. Click on a formula to zoom.
ABSTRACT
The Covid-19 has presented an unprecedented challenge to public health worldwide. However, residents in different countries showed diverse levels of Covid-19 awareness during the outbreak and suffered from uneven health impacts. This study analyzed the global Twitter data from January 1st to June 30th, 2020, to answer two research questions. What are the linguistic and geographical disparities of public awareness in the Covid-19 outbreak period reflected on social media? Does significant association exist between the changing Covid-19 awareness and the pandemic outbreak? We established a Twitter data mining framework calculating the Ratio index to quantify and track awareness. The lag correlations between awareness and health impacts were examined at global and country levels. Results show that users presenting the highest Covid-19 awareness were mainly those tweeting in the official languages of India and Bangladesh. Asian countries showed more disparities in awareness than European countries, and awareness in Eastern Europe was higher than in central Europe. Finally, the Ratio index had high correlations with global mortality rate, global case fatality ratio, and country-level mortality rate, with 21-31, 35-42, and 13–18 leading days, respectively. This study yields timely insights into social media use in understanding human behaviors for public health research.
1. Introduction
The outbreak of the novel coronavirus, known as Covid-19, has profoundly impacted human society. In 2020, Covid-19 had infected more than 83.48 million people and caused nearly 1.82 million deaths in 191 countries and regions (Dong, Du, and Gardner Citation2020). Since the Covid-19 outbreak, governments worldwide have implemented several measures requiring or suggesting residents to wear masks, keep social distancing, or stay at home to control the spread of the coronavirus. However, residents in different countries showed diverse levels of awareness of Covid-19 and relevant policies during the outbreak, and suffered from uneven health impacts, including unequal infection, fatality, and recovery rates (Gollust et al. Citation2020; McCaffery et al. Citation2020; Hu et al. Citation2020; Saad, Hassan, and Zaffar Citation2020). Whether the changes and disparities in public awareness led to different responding behaviors and thus affected the pandemic’s health impacts is unknown and needs to be investigated.
However, continuous long-term and near-real-time data describing disparities in public awareness and responses cannot be obtained through traditional survey methods, especially during the pandemic. With the development of Web 2.0 and GNSS-enabled portable devices, social media platforms, e.g. Twitter, Facebook, and Instagram have become increasingly popular worldwide for sharing feelings and discussing ‘what’s happening’. Data collected from such platforms provide an emerging channel to observe real-time human responses to different topics and events (Zou et al. Citation2018). During Covid-19, many people’s social lives have shifted from in-person to online to stay connected while maintaining social distancing, and they spent more time sharing their experiences, concerns, and feelings toward topics relevant to Covid-19 on social media (Alqurashi, Alhindi, and Alanazi Citation2020; Chen, Lerman, and Ferrara Citation2020; Lopez, Vasu, and Gallemore Citation2020). As a result, the extensive social media data generated during the pandemic offer an innovative opportunity to observe the public reactions to Covid-19 in near-real-time.
Nevertheless, studying human behaviors at different locations during the pandemic and drawing scientific conclusions from social media data are challenging. First, social media data contain a sheer amount of noisy information irrelevant to Covid-19. It is difficult to accurately collect pandemic-related messages from the big social media database. Second, the age distribution of social media users is biased towards younger people, which is different from the actual population. User behaviors reflected on social media may not represent behaviors of the general population (Sloan et al. Citation2015). Third, many social media platforms support multiple languages, and identifying and analyzing coronavirus-related messages of different languages necessitates advanced natural language processing (NLP) models (Lopez, Vasu, and Gallemore Citation2020). Finally, social media users are unevenly distributed across space, and only a small proportion of the generated data (around 1-2%) contains precise locations (Graham, Hale, and Gaffney Citation2014). Social media data need to be associated with geographic contexts and normalized through preprocessing to enable spatial and temporal analytics.
This study analyzed the global Twitter data, referred to as tweets, from January 1st to June 30th, 2020, when Covid-19 developed from a regional epidemic disease to a pandemic causing a global health crisis. The overarching research questions are: What are the linguistic and geographical disparities in public awareness of the Covid-19 outbreak on social media? Is the changing public awareness on social media significantly associated with the pandemic outbreak? To address the research questions, three objectives are proposed and achieved: (1) to establish a social media data mining framework tracking the public awareness of Covid-19 by languages and regions; (2) to quantify disparities of awareness toward the pandemic at multiple spatial and temporal scales; and (3) to examine the lag correlations between Covid-19 awareness and health impacts globally and regionally. One hypothesis is tested: social media-derived public awareness changes are significantly associated with the pandemic outbreak at both global and regional scales. The results can inform governments to mitigate risks from current and future epidemics through social media data analysis.
2. Background
2.1. Social media data mining for Public Health
Social media data contain abundant attributes, e.g. time, geographical information, contents, and relationships among users, providing a brand-new perspective for understanding human behaviors in spatial, temporal, contextual, and network dimensions. Since the emergence of social media, researcher have applied data collected from such platforms to address multiple health-related issues, e.g. obesity, depression, and insomnia (Choudhury et al. Citation2013; Gore, Diallo, and Padilla Citation2015; McIver et al. Citation2015; Sun et al. Citation2018; Gao et al. Citation2020; Li, Chaudhary, and Zhang Citation2020).
Sun et al. (Citation2018) collected the obesity data from the Gallup Healthways Wellbeing Survey and the U.S. Centers for Disease Control and Prevention (CDC) and 41 million tweets from 110 major cities in the USA during 2012-2013. They proposed an obesity estimation method via monitoring users’ dietary habits, physical activities, emotions, and self-consciousness on Twitter, demonstrating that user activities on online social networks could help evaluate the obesity rate in urban areas. McIver and others (Citation2015) identified a list of insomniacs based on their Twitter messages and investigated their Twitter use behaviors. The results show that insomniacs had fewer followers, expressed lower sentiments, and were less active on social networks compared with other users. Social media data mining also has a great potential in addressing mental health issues. A study finds that integrating social media users’ activities, e.g. social engagement, linguistic styles, networks, and emotions, could characterize and forecast individual-level depression (Choudhury et al. Citation2013).
In addition to the above case studies focusing on specific health diseases, Paul and Dredze (Citation2014) built a topic model called Ailment Topic Aspect Model (ATAM) to automatically discover health-relevant topics on Twitter without human supervision or a priori knowledge. Culotta (Citation2014) created 160 indexes based on Twitter data and performed regression analysis to predict the county-level statistics of 27 types of health conditions (e.g. obesity, teen births, and diabetes) in 100 counties in the United States. The results show that the predictive models incorporating Twitter-derived variables have higher accuracy for surveying county-level health conditions compared to models based on traditional questionnaires.
2.2. Social media and Covid-19
Since the beginning of 2020, researchers from different fields have made enormous efforts to collect and mine social media data during Covid-19 to understand human behaviors during the pandemic and combat it. For instance, several studies collected pandemic-related social media data and shared them through open-source archives (Alqurashi, Alhindi, and Alanazi Citation2020; Chen, Lerman, and Ferrara Citation2020; Lopez, Vasu, and Gallemore Citation2020). Rufai and Bunce (Citation2020) pointed out that Twitter empowered world leaders to exchange Covid-19 information with citizens rapidly. La et al. (Citation2020) analyzed the official Covid-19 news from online newspapers and concluded that immediate policies and supportive public responses are the key epidemic control measures. Sentiment analysis and epidemic-related topics surveillance were essential for understanding social activities during the pandemic (Chen et al. Citation2020; Lwin et al. Citation2020; Nemes and Kiss Citation2020; Zhu et al. Citation2020). Leveraging social media data, worldwide trends of four emotions, fear, anger, sadness, and joy, were examined in Lwin et al. (Citation2020). Their results showed that public feelings shifted strongly from fear to anger from January 28th to April 9th, 2020. Predicting the regional epidemic outbreak from social media activities had also been proved feasible in several investigations (Jahanbin and Rahmanian Citation2020; Li et al. Citation2020; Qin et al. Citation2020). Specifically, Li et al. (Citation2020) found that the Covid-19 discussion peak on social media occurred 10–14 days earlier than the peak of daily incidences in China. Online social networks were effective platforms for disseminating rumors or conspiracy theories (Allington et al. Citation2020; Gruzd and Mai Citation2020; Tasnim, Hossain, and Mazumder Citation2020). Shahsavari et al. (Citation2020) investigated the narrative frameworks of fabricating and broadcasting Covid-19 conspiracies to monitor those messages near real-time.
Although the existing studies generate innovative methods and valuable knowledge in using social media for Covid-19 research, some limitations exist. For example, Covid-19 related social media data analysis across regions is needed to address the inequalities of public awareness and health impacts. Examining the mid-term and long-term Covid-19 social media activities is also critical because Covid-19 is a long-standing epidemic, and short-term analysis is unable to capture how the public perception of Covid-19 changes temporally.
3. Data and methods
3.1. Twitter data
This research collected social media data from Twitter, one of the most popular social media and network platforms with about 340 million users in more than 150 countries. Approximately 500 million tweets were published per day in various languages in 2020, enabling the tracking of global and regional awareness of Covid-19. Since the pandemic outbreak, many Covid-19 Twitter databases became available. For example, Covid-19 tweets dataset from IEEE DataPort (https://ieee-dataport.org/open-access/coronavirus-covid-19-tweets-dataset) provides about 2 billion Covid-19 tweets in English along with their sentiment scores from January 27th, 2020 to February 23rd, 2021 (Lamsal Citation2021). Chen et al. (Citation2020) created a GitHub repository to share a collection of tweet IDs associated with Covid-19. A large-scale COVID-19 Twitter chatter dataset for open scientific research is developed and shared on Zenodo (Banda et al. Citation2021). However, these popular Covid-19 Twitter databases either focus on English tweets or provide tweet IDs alone. Concurrently, the existing Covid-19 datasets lack the background tweets irrelevant to Covid-19, which are critical for normalizing Twitter activities in different countries and languages.
We collected Twitter data from January 1st to June 30th, 2020 from Internet Archive (https://archive.org/), an online free data library that stores around 1 percent of the whole Twitter database, including tweets relevant and irrelevant to Covid-19. Tweets are encoded in JavaScript Object Notation (JSON) format and represented as a list of name-value pairs. shows the Twitter data collection and preprocessing workflow. Five attributes were used in the subsequent analysis, created_at, text, lang, source, and verified representing each tweet’s timestamp, content, language, source such as ‘Twitter for iPhone’, and user’s verified status, respectively.
Figure 1. Workflow of Twitter data collection and preprocessing.
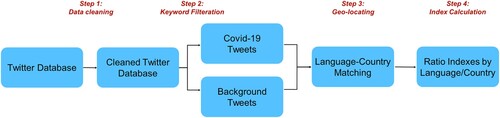
The first step of Twitter data preprocessing is data cleaning. We utilized the ‘source’ attribute in Twitter data to remove tweets posted by bots. Specifically, Li et al. (Citation2021) created a list of sources (e.g. sent from iPhone) to help identify human-generated tweets. We checked the ‘source’ value of each tweet and excluded tweets whose sources were not listed in Li et al. (Citation2021). Tweets from organizational accounts are also irrelevant to public awareness of Covid-19 and should be removed, which can be accomplished by examining the ‘verified’ attribute in Twitter data. ‘Verified’ Twitter users are accounts operated by non-general-public, e.g. governments, news organizations, companies, brands, non-profit organizations, sports and gaming leagues, individuals in those organizations and leagues, activities and organizers, content creators, and other influential individuals. Tweets sent from verified users were removed in the data cleaning step.
The second step is identifying Covid-19-related tweets. We selected seven keywords, i.e. covid, virus, ncov, n95, pandemic, pneumonia, and quarantine, based on an overview of previous literature to search for the Covid-19 relevant tweets (Alqurashi, Alhindi, and Alanazi Citation2020; Chen, Lerman, and Ferrara Citation2020; Qin et al. Citation2020). Considering that Twitter supports multiple languages, we translated the seven keywords into different languages by the Google Translate Application Programming Interface (API) to collect the global Covid-19 discussion on Twitter. A total of 65 distinct languages (including English) were detected from the collected Twitter data, and the Google Translate API supports 61 of them. We manually validated the Google API-translated keywords by searching news using each translated keyword and examining if the returned results were relevant to Covid-19. The manual verification confirmed that using selected keywords and their translations could accurately identify Covid-19-related messages on social media. Any tweet containing at least one of the seven keywords in one of the 61 languages was identified as Covid-19-related. Reposting or quoting Covid-19-related messages on Twitter is a convenient, rapid way to disseminate timely information and express awareness during the pandemic. Therefore, reposted tweets (retweets) and quoted tweets containing Covid-19 keywords were included in Covid-19-related tweets for the subsequent analysis.
The third step is to determine the location where each tweet was sent from. There are three common metadata sources to geo-reference tweets - geotagged location (tweet from), user profile address (user from), and content mentioned place (tweet about). However, each source has its limitations for this study. First, less than 2% of the Twitter data contain the geotagged locations (Zou et al. Citation2018), and the proportion of geotagged Covid-19 tweets could be even less, which makes over 98% of tweets unusable. Due to the low use of precision geotagging and the increasing concern for users’ privacy, Twitter has gradually removed the function of attaching point coordinates to tweets since June 2019. Second, a high percentage of tweets (40% to 60%) can be linked to county-level locations using user profile addresses. However, it requires the use of geocoding services (e.g. Google or OpenStreetMap Geocoding API) for toponym resolution, which is a time-consuming and computationally intensive task when processing a large amount of data and introduces geocoding uncertainty (Zou et al. Citation2019; Wang et al. Citation2021). Further, deriving locations from places mentioned in tweet contents is unreliable because places mentioned in tweet contents do not necessarily reflect the actual locations of Twitter users.
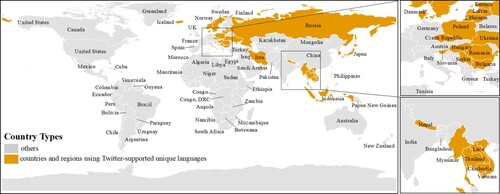
Therefore, this study leveraged an alternative metadata source to associate each tweet with a country or a region: tweet language, which Twitter automatically detected and provided in the collected tweets. Users in each country are more likely to post messages on Twitter using their country’s official/primary language (Mocanu et al. Citation2013; Zola, Cortez, and Carpita Citation2019). Thus, matching the tweet language and the official/primary language of each country could indicate Twitter users’ locations and cultural backgrounds. For instance, a tweet written in Thai is considered sending from Thailand since it is the only country that uses Thai as its official language. Among the 61 selected languages, 29 can be paired to a single country () based on the language-country matching list in . This language-country matching method has been applied in a previous investigation with an overall accuracy of 53% (Zubiaga et al. Citation2017). We validated the language-country matching approach by calculating the accuracy of language-detected countries in geotagged tweets. The results are summarized in section 4.1.
Figure 2. Countries using Twitter-supported unique languages.
Finally, we computed the Ratio index using EquationEquation 1(1)
(1) by languages and at multiple spatial–temporal scales to compare the levels of public awareness to Covid-19 in different linguistic cultures, geographical regions, and pandemic phases (Zou et al. Citation2018). The Ratio index values range from 0 to 1. A small Ratio index value means a low level of public awareness about Covid-19 on Twitter and vice versa.
(1)
(1)
3.2. Covid-19 health impact indicators
We chose three indicators - case fatality ratio, case rate, and mortality rate - to represent Covid-19’s public health impacts. Case fatality ratio is defined as the proportion of people who died from Covid-19 among individuals diagnosed with Covid-19 (EquationEquation 2(2)
(2) ). Case/mortality rates are calculated as the number of confirmed cases/deaths divided by the total population and normalized by 10 million (Equations 3&4). Cumulative data documenting global Covid-19 cases and mortalities from January 22th to June 30th, 2020, were obtained from the publicly available database in the Center for Systems Science and Engineering (CSSE) at Johns Hopkins University (https://coronavirus.jhu.edu/map.html) (Dong, Du, and Gardner Citation2020). The population data were collected from the United Nations’ 2020 mid-year population estimation (http://data.un.org/). The values of case fatality ratio, case rate, and mortality rate range from 0-100%, 0–107, and 0–107 respectively, and the large value of each index means a more severe health impact by Covid-19. These three indicators can be computed or aggregated by different areas (e.g. global, continental, and country) within a defined time period (e.g. daily, monthly, and yearly).
(2)
(2)
(3)
(3)
(4)
(4)
3.3. Methods of analysis
The public awareness was aggregated and evaluated by different languages and at multiple spatial–temporal scales to reveal its linguistic-geographical disparities and examine its relationship with the Covid-19’s health impact indicators. First, we calculated the daily Ratio index of tweets in all languages globally to indicate the general trend of public awareness toward Covid-19 on Twitter. The global seven-day moving average case rate, mortality rate, and daily case fatality ratio were calculated to represent the general trend of health impacts caused by Covid-19 while removing the weekly pattern caused by the weekday/weekend reporting difference. To examine if significant associations and lag effects exist between public awareness and the Covid-19 outbreak worldwide, three types of lag correlations, i.e. Pearson, Spearman, and Kendall rank, between global Ratio index and the three Covid-19 health impact indicators were calculated using Equations 5-9.
(5)
(5)
(6)
(6)
(7)
(7)
(8)
(8)
(9)
(9)
In Equation 5-9, denotes the t days earlier time series of health impact indicators, and
represents the time sequences of the Ratio index.
is the covariance of
and
, calculated according to Equation 6.
and
are the variances of
and
, and their product is calculated utilizing Equation 7. In Equation 8,
are the ranks of
. In Equation 9, for two sets of
and
, if a pair of
and
satisfies
and
, or
and
, the pair is considered concordant. Otherwise, the pair is discordant.
Second, the half-year and the monthly Ratio indexes by language were calculated to show the general differences and temporal variations of Covid-19 awareness among Twitter users with diverse cultural backgrounds. Third, we focused on countries having unique official/primary languages and generated maps of half-year and monthly Ratio indexes by country to reveal the spatial–temporal disparities of Covid-19 awareness. Finally, the lag correlations between the Ratio index and Covid-19 health impact indicators were tested at the country level to examine the associations between public awareness changes and the regional Covid-19 outbreak.
4. Results
This study collected 464,167,385 cleaned tweets out of 488,486,181 original tweets from the Internet Archive database. A total of 9,339,176 (2.01%) out of cleaned tweets were identified as Covid-19-related (). Among all cleaned tweets, 185,377 (0.04%) have geotags, and the amount of geotagged Covid-19 tweets is 4,021 (0.00087%). More than 425 million (92.26%) tweets have language (lang) attribute values and 9,198,820 (1.98%) of them are Covid-19 tweets. Within geotagged tweets, 48,637 can be matched to a single country by language. We compared the agreement of geotag-derived and tweet language inferred country information in the collected tweets to validate the language-country matching method. The overall accuracy is 77%, indicating that this method is reliable to geo-locate tweets for country-level analysis.
Table 1. Summary statistics for the collected tweets.
4.1. Global temporal trends
shows the global temporal patterns of the daily Ratio index and three health impact indicators (i.e. seven-day moving average case rate and mortality rate, and daily case fatality ratio) from January 1st to June 30th, 2020, which reflect the general trend of worldwide public awareness and health impact of Covid-19 during its outbreak. Using the date when the World Health Organization (WHO) announced Covid-19 a pandemic as the breaking point, we defined January 1st to March 11th as the pre-pandemic period and March 12th to June 30th as the pandemic-outbreak period.
Figure 3. Global temporal trends of the Ratio Index and health impact indicators of Covid-19 (seven-day moving average case rate and mortality rate, and daily case fatality ratio).
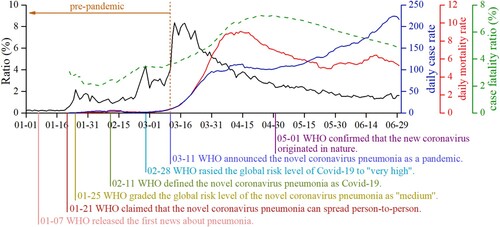
The daily Ratio index (black line) ranged from 0.19% to 8.37%, with an average value of 2.60%. The high values were found during March 12th to 23rd, and the maximum value was on March 18th, a week after entering the pandemic-outbreak period. During January 1st to 20th, very few tweets discussed Covid-19, even though it had been reported to spread in Wuhan, China. Since January 21st, when WHO claimed that the novel coronavirus pneumonia could spread from person to person, the Ratio index followed a fluctuating ascending trend with two peaks in the pre-pandemic period. One peak was on January 25th, when the Covid-19 risk level was upgraded as ‘medium’ by WHO. The other was on February 28th, when WHO raised the Covid-19 risk level to ‘very high’. After March 23rd, the Covid-19 discussion intensity on Twitter dissipated gradually, and the Ratio index lowered to around 2% by the end of June 2020.
The global seven-day moving average case rate (blue line) and mortality rate (red line) also changed over the six months, which ranged from 0.28–224.23 and 0.08–9.05 per ten million population respectively. Their average values were 84.02 and 4.09. Both moving average case rate and mortality rate were low in January and February 2020, when Covid-19 cases were reported in only a few countries. Since the beginning of the pandemic-outbreak period, both indicators started to increase rapidly. The global daily case rate reached around 100 per ten million in late March and through April. The maximum global daily mortality rate was observed on April 14th, 2020, one month after the Twitter-derived public awareness reached the highest. The daily case rate increased gradually and peaked at the end of June, while the daily mortality rate declined progressively in May and stayed at around 6 per ten million in June 2020.
The global case fatality ratio (green line) showed a relatively smoother trend compared to daily case and mortality rate, ranging from 2.04% to 7.22%, with an average value of 4.95%. In late January, the case fatality ratio displayed a downward trend and reached the lowest value on February 5th. Then the case fatality ratio showed an upward trend and reached the maximum value on April 29th, 2020, around 37–48 days after the public awareness reached the highest on Twitter. Finally, the case fatality ratio gradually decreased to 4.87% in May and June.
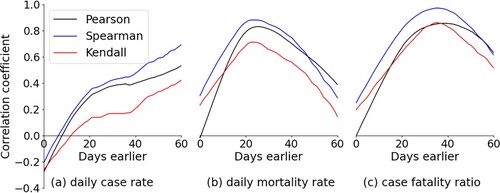
describes the three types of lag correlations (Pearson, Spearman, and Kendall rank) between the global daily Ratio index and the seven-day moving average case rate (a) and mortality rate (b), and case fatality ratio (c). We set the maximum number of leading days to 60. The largest Pearson’s correlation coefficients between the Ratio and the Covid-19 mortality rate and case fatality ratio were 0.83 and 0.86, and the leading days were 25 and 39 days, respectively. The largest Spearman’s correlations were 0.88 and 0.97, while the largest Kendall’s correlations were 0.71 and 0.86, and the leading days were 23 and 35 days, respectively. No turning point (the point where the lag correlation coefficient starts to decline) was detected in the lag correlation between Ratio and case rate, and the maximum correlations were 0.53 (Pearson), 0.69 (Spearman), and 0.42 (Kendall).
Figure 4. Three types of lag correlations between global Ratio index and seven-day moving average case rate (a) and mortality rate (b), and daily case fatality ratio (c).
Three phenomena were observed from the global temporal trends. Initially, public awareness of Covid-19 reflected on Twitter significantly correlated with the daily mortality rate and case fatality ratio. The result is consistent with another analysis exploring the possibility of forecasting the Covid-19 outbreak in China from social media data, which found significant correlations between Sina Weibo (a Chinese social media platform for microblogging) index and confirmed/suspected Covid-19 cases (Li et al. Citation2020). It confirms that social media activities are highly correlated with the global outbreak and progression of infectious diseases like Covid-19. We also found that the global public awareness peak on social media was 21–31 days (correlation > 0.70) and 35–42 days (correlation > 0.85) earlier than the maximum daily mortality rate and case fatality ratio, respectively. The lagged days between global public awareness changes and Covid-19 health impacts are longer than the lag effect estimations in other research. For example, Chunara, Andrews, and Brownstein (Citation2012) concluded that trends in the volume of informal sources related to Haitian Cholera, including the news media reports and Twitter postings, were two weeks earlier than official case data. The difference comes from three reasons. First, Covid-19 is a more destructive epidemic that affects the entire human being and lasts a more extended period than other infectious diseases. Second, the indicators selected to represent Covid-19 health impacts are inconsistent among various investigations. The previous research chose infections to describe the health impact. The detected lag effects were on mortality and case-fatality ratio, whose trends are usually delayed compared with the infection trend. Third, the keywords used for tweet collection in this study are different from other studies. Culotta (Citation2010) and Iso, Wakamiya, and Aramaki (Citation2016) have proved that choosing different keywords to collect disease-related information on social media could result in uneven leading effects.
Furthermore, Twitter users’ awareness in the pre-pandemic period was mainly media-driven. The discussion intensity peaks corresponded with WHO announcements, meaning people tweeted about Covid-19 when official agencies reported it on social media platforms. It demonstrates that providing official updates and reports is an effective approach to enhance public awareness in the pre-pandemic period. Finally, although Covid-19 caused proliferating morbidity and mortality worldwide after becoming a pandemic and mass media and agencies continued to report this event, such social attention and health impacts were not entirely reflected in public discussions of Twitter users globally. The global Ratio index decreased gradually after March 18th, with no significant discussion peaks by the end of June 2020.
4.2. Global linguistic disparities
reveals the proportions of tweets and the Ratio index by language from January 1st to June 30th, 2020, which uncovers the global linguistic disparities of public awareness toward Covid-19. The numbers of background and Covid-19 tweets used to calculate the Ratio index are listed in Appendix . The most frequent tweeting language was English, followed by Japanese, Spanish, Portuguese, and Thai, consisting of 33.59%, 18.22%, 8.53%, 7.72%, and 6.30% tweets. Other common languages consisting of over 2% of global tweets were Arabic, Korean, Indonesian, Turkish, and French.
Figure 5. Proportions of Tweets and Ratio Index by languages.
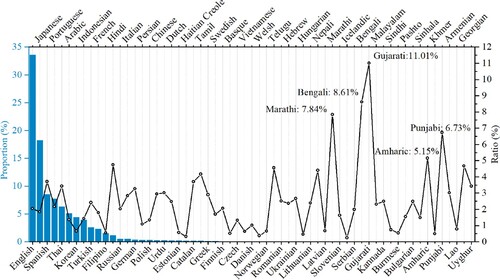
The Ratio index by languages ranged from 0.25% to 11.01%, with an average value of 2.50% and a standard deviation of 2.07%. The highest Ratio index was in Gujarati language tweets. Users tweeting in Bengali, Marathi, Punjabi, and Amharic languages also showed high public awareness with Ratio index values of 8.61%, 7.84%, 6.73%, and 5.15%, respectively. The lowest Ratio index values were found in users tweeting in Icelandic, Haitian Creole, Welsh, Hungarian, and Khmer, and their values were 0.25%. 0.33%, 0.38%, 0.46%, and 0.50%, respectively.
The top four languages presenting the highest public awareness toward Covid-19 on Twitter are Gujarati, Bengali, Marathi, and Punjabi, the official languages in India. Bengali is also the most widely spoken language in Bangladesh. Both India and Bangladesh Governments practiced a nationwide lockdown at the end of March, 2020, and extended the lockdown several times in April and May, resulting in a two-month lockdown. Meanwhile, the new confirmed cases in Bangladesh grew by 1,155% in early April, the highest in Asia. Such societal and health impacts caused by the pandemic aroused public concerns and awareness about Covid-19 in India and Bangladesh, leading to more intense discussions on social media platforms like Twitter.
shows monthly variations of the Ratio index by the 20 most common languages on Twitter, indicating the temporal linguistic disparities of public awareness toward Covid-19. In each subplot, the bold green/blue line represents the monthly Ratio index in each language, while the monthly Ratio indexes in the other 19 languages are gray lines in the background. Numbers on the left top are the highest Ratio value in each language. The maximum monthly Ratio index was found in Hindi in April, and the value was 8.87%, followed by Thai with a value of 8.67% in March. Tweets in Filipino and Korean displayed the lowest maximum monthly Ratio index values of 1.19% and 2.07%.
Figure 6. Monthly trends of the Ratio index by the 20 most popular languages on Twitter.
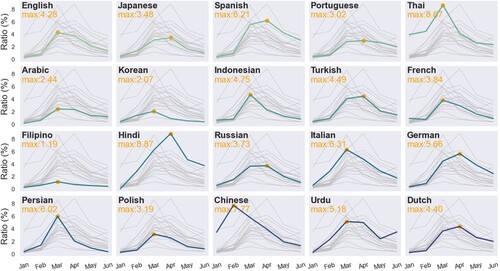
Most users grouped by tweeting languages showed the highest monthly Covid-19 awareness in March and April, except for users tweeting in Chinese which expressed the highest awareness in February 2020 with a value of 7.77%. This phenomenon matched the expectation, as the Covid-19 outbreak was reported first in China in January 2020. The Chinese government quickly responded and issued a series of policies and strategies to prevent the spread of the virus in January and February, such as Wuhan lockdown, isolation measures, and the construction of Fire God Mountain hospital. Although Twitter is not the most popular microblogging platform in China, many Twitter users are Chinese speakers residing in different regions of the world and post messages in Chinese. Our analysis results indicate that the Covid-19 outbreak in China raised the public awareness of Covid-19 among Chinese Twitter users worldwide. As Covid-19 became a pandemic since February 2020, the awareness among users speaking different languages began to increase.
It is worth mentioning that users tweeting in Thai also expressed a high level of Covid-19 awareness in the pre-pandemic period. The following reasons could explain this observation. Thailand was the most popular traveling destination for residents of Wuhan. Thus, people living in Thailand were concerned that the frequent commute between Thailand and Wuhan might spread the virus from the reported outbreak center to Thailand. Meanwhile, Thailand confirmed the first Covid-19 case on January 13th, 2020, making it the first country other than China that had Covid-19 infected patients. Since then, the number of confirmed cases in Thailand grew to 25 on February 4th, more than any country other than China. Further, the government in Thailand was one of the very few governments that issued an early warning of Covid-19 in January 2020. On January 28th, their health minister claimed that the spread of the coronavirus could not be stopped. Both the health impacts caused by the pandemic and the government’s immediate responses stimulated residents to discuss it on social media.
4.3. Country-level spatial-temporal patterns
The 29 countries with unique official/primary languages were included in the country-level spatial–temporal analysis. shows the spatial patterns of the Ratio index at the country level from January 1st to June 30th, 2020. The value range was from 0.25% to 4.40% and the average was 1.66%. In general, Nepal and Thailand from southeastern Asia had the highest Twitter-derived public awareness of Covid-19. The public awareness on Twitter in the eastern part of Europe was also higher than the awareness in other countries. Iceland showed the lowest Ratio index. The Ratio index in the selected Asian countries ranged from 0.50% to 4.40% with a standard deviation of 1.19%, showing a larger disparity than the country-level Ratio index values in Europe (range: 0.25∼3.70%, standard deviation: 0.98%).
Figure 7. Global spatial patterns of the Ratio index at the country level from January 1st to June 30th, 2020.
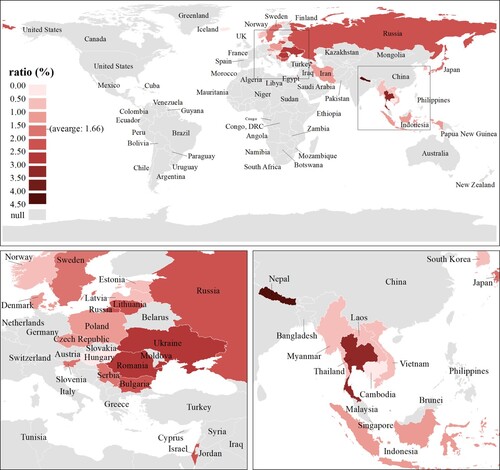
Countries in Europe showed significant geographical discrepancies in Covid-19 awareness. Public awareness in the eastern part of Europe, including Russia, Armenia, Ukraine, Romania, Bulgaria, and Serbia, were generally higher than the awareness of countries in central Europe, including Norway, Denmark, Sweden, Estonia, Latvia, Lithuania, Poland, Czech Republic, Hungary, and Slovenia. The high public awareness on Twitter in the eastern part could be caused by two reasons. First, those countries were particularly vulnerable to the pandemic because their economies depended heavily on Western Europe, which was severely affected by disruptions in international production and transportation due to Covid-19 (European University Institute Citation2022). Second, Covid-19 caused more severe losses of working hours in the eastern part of Europe than in central Europe in 2020, based on the ‘Covid-19 and the world of work’ report (International Labour Organization Citation2020). Therefore, residents in the eastern part of Europe were more concerned about Covid-19 and posted more discussions on social media platforms.
The monthly country-level Ratio index reveals detailed information about how public awareness toward Covid-19 on Twitter changed through different phases of the pandemic (). The monthly Ratio index ranged from 0% to 13.85%. Similar to the observed global and by language patterns, Twitter users in most countries showed the highest awareness in March and April 2020, and expressed low awareness in the pre-pandemic period and in May and June 2020.
Figure 8. Spatial-temporal patterns of the monthly Ratio index at the country-level.
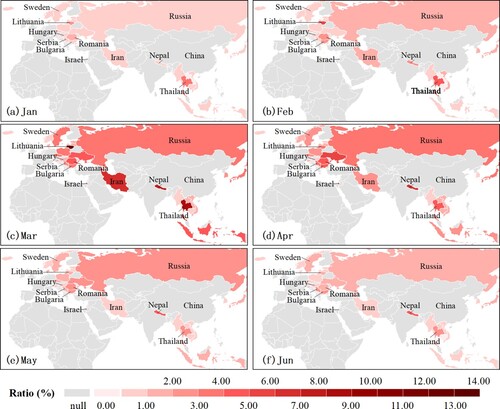
As mentioned in section 4.2, public awareness in Thailand was significantly higher than in other countries in January 2020. Lithuania, Thailand, Bulgaria, Nepal, and Romania showed higher values of monthly Ratio index in February than other countries, with values of 5.25%, 4.49%, 2.47%, 2.40%, and 2.34%, respectively. The highest monthly awareness on Twitter was in Lithuania in March. Although Lithuania had only three confirmed cases by March 12th, the Lithuanian government canceled all public indoor events of more than 100 attendees and closed all educational institutions (i.e. kindergartens, public schools, and universities) and entertainment places (i.e. museums, cinemas, and gyms) since that day. The shutdown had a massive impact on Lithuanians and intensified Covid-19-related discussion on Twitter. Israel presented the fastest growth rate of public awareness from 0.22% in January to 4.41% in April during the pandemic outbreak. The other countries with rapid awareness growth rates were Iran, Serbia, Nepal, Sweden, and Hungary. In May and June 2020, only Nepal maintained a relatively high Covid-19 awareness.
4.4. Covid-19 public awareness and health impacts
summarizes the maximum lag Pearson, Spearman, and Kendall rank correlation coefficients (max r) and corresponding leading days between the daily Ratio index and three health impact indicators (seven-day moving average case rate and daily mortality rate, and daily case fatality ratio) at 29 selected countries within 60 days’ lag effect. The daily mortality rate and case fatality ratio in Vietnam, Cambodia, and Laos were close to zero. Therefore, the lag correlations in the three countries could not be calculated and were labeled as ‘null.’ The ‘nd’ in indicates that a correlation turning point was not detected.
Table 2. Country level statistics of lag correlations between the daily Ratio index and three health impact indicators (seven-day moving average case rate and mortality rate and daily case fatality ratio).
Significant turning points were detected in 22, 20, and 11 countries regarding the lag Pearson correlations between the daily Ratio index and case rate, mortality rate, and case fatality ratio, respectively. The largest Pearson max r between daily Ratio index and the case rate was found in Thailand (0.84) with 9 leading days. The largest Pearson max r between the daily Ratio index and mortality rate and case fatality ratio were 0.89 in Andorra and 0.72 in Sweden with 16-day and 40-day lag effects. Lag Pearson’s correlation coefficients between daily Ratio and case rate, mortality rate, and case fatality ratio were found the least significant in Bulgaria, Myanmar, and Iceland. The largest Spearman max r between daily Ratio index and case rate, mortality rate, and case fatality ratio were 0.83 in Estonia and Andorra, 0.89 in Estonia, and 0.92 in Poland, with 7-day, 21-day, and 52-day lag effects, respectively. The most significant Kendall rank lagged correlations of Ratio and case rate, mortality rate, and case-fatality ratio were observed in Russia (0.81), Estonia (0.74), and Poland (0.76), and lag days were 50, 21, and 51.
The daily Ratio index showed uneven association with case rate, mortality rate, and case fatality ratio (). The average max r between Ratio and mortality rate (Pearson: 0.61, Spearman: 0.70, and Kendall rank: 0.54) was higher than the averaged correlation coefficients between Ratio and case rate (Pearson: 0.53, Spearman: 0.54, and Kendall rank: 0.42) and case fatality ratio (Pearson: 0.43, Spearman: 0.61, and Kendall rank: 0.46). It demonstrates that the Ratio index has an overall higher correlation with mortality rate in different countries during the Covid-19 outbreak. The average leading days between Ratio and mortality rate, case rate, and case fatality ratio were detected as 17.68, 23.45, and 37.00 in Pearson correlation, 13.30, 19.30, and 33.07 in Spearman correlation, and 17.73, 22.27, and 29.93 in Kendall rank correlation.
The correlation coefficients between the daily Ratio index and the three health impact indicators varied from country to country. Using Pearson correlation as an example, the daily Ratio index shows the highest correlation with Covid-19 outbreaks in nine countries, including Japan, Thailand, South Korea, Poland, Estonia, Andorra, Sweden, the Czech Republic, and Israel. The Pearson max r between the Ratio index and at least two health impact indicators exceeded 0.6 in these nine countries. On the contrary, none of the Pearson max r between Ratio and three health impact indicators was greater than 0.5 in Iran, Vietnam, Norway, Hungary, Latvia, Iceland, Myanmar, Bulgaria, and Armenia. No turning points in three types of lag correlations were detected in Nepal. The undesirable correlation is due to few Covid-19 cases in these countries during the time period, which makes outbreak detection difficult, and insufficient Twitter data to evaluate the public awareness levels across time.
5. Discussion
5.1. Significant implications
The completion of this research yields several significant implications. First, this research demonstrates that the language-country matching method could overcome the limitation of insufficient social media data with geotagged locations and efficiently geo-reference big Twitter data for large-scale analysis with an accuracy of 77%. The method works the best for countries with unique official languages, offering a novel and rapid channel observing and comparing social media activities, e.g. public awareness toward different topics or events, among those countries. The generated datasets provide baseline information on Covid-19 awareness globally and by language and country.
Second, this study found that the daily changes of public awareness reflected on Twitter had strong correlations with the daily mortality rate and case fatality ratio. This finding is consistent with prior investigations which applied social media to detect and forecast the outbreak of other infectious diseases, such as influenza (Signorini, Segre, and Polgreen Citation2011; Hassan Zadeh et al. Citation2019) and Cholera (Chunara, Andrews, and Brownstein Citation2012). Therefore, monitoring continuous social media activities could provide valuable information for future outbreaks of Covid-19 and its variants, and inform governments and communities to plan accordingly.
Finally, this study further proved that the associations between social media data and infectious disease outbreaks were distinct in different countries. It is in line with the analysis in Allen et al. (Citation2016), which measured the correlations between Twitter rates and the official reports of influenza-like illness (ILI) in 31 major cities in the United States during the 2013–2014 flu season. Our results confirmed that the spatial variability of disease detection performance based on the social media data needs to be considered and mitigated in future work to assist the regional outbreak prediction of infectious diseases and develop responding strategies.
5.2. Limitations and future research
A few limitations exist in this investigation and necessitate further research. First, the language-country matching method is unable to capture social media activities in countries speaking leading languages of international discourse, such as English and Spanish, or multilingual countries listed in . This limitation can be resolved by incorporating the locations obtained from the geotags (tweet from), users’ profiles (user from), location information in historical tweet contents (tweet about) in future research.
Second, health impact indicators were derived from the cumulative Covid-19 cases and deaths dataset from CSSE. However, these data have inherent limitations due to the under-testing or under-reporting of cases. For example, inadequate diagnostic facilities especially in the initial outbreak stage of the pandemic, and delayed diagnosis could underestimate the case and death numbers. Such uncertainty in original health impact data can subject the association assessment of the Ratio index to unavoidable errors.
Third, many researchers have leveraged multiple big data sources, such as Facebook, Twitter, and Google trends, to track Covid-19 awareness. Data from social media platforms provide more about users’ experience and feeling about the epidemic, while specific keywords analysis from search engines make it possible to distinguish what people want to know about Covid-19, such as infection symptoms or prevention methods. More studies assessing and comparing various aspects of pandemic awareness from multi-sourced big data should be considered.
Furthermore, although this study successfully tracked the spatial–temporal disparities of Covid-19 awareness, other non-pharmacological interventions (NPIs), e.g. social distancing policies and human mobility behaviors, were not considered. Governments in different regions released disparate closure policies, which might affect public awareness and movement and shape the spread of Covid-19. Human mobility also directly influences virus diffusion. Future research should include Covid-19 relevant policies and human mobility to further elucidate the interactions of various NPI factors and reveal their influences on Covid-19 health impacts.
Finally, future investigations could categorize Twitter data by different user groups, such as citizens, celebrities, scientists, health agencies, and governments, and by different pandemic phases, e.g. pre-pandemic preparedness, pandemic-outbreak response, and post-pandemic recovery. Examining the public awareness of the pandemic among diverse social groups in each phase could gain valuable information on how different opinion leaders on social media affect the citizens’ Covid-19 awareness in different countries and communities and how changing public awareness impacts pandemic recovery.
6. Conclusion
This study analyzed the global Twitter data from January 1st to June 30th, 2020, aiming to answer two questions: what are the linguistic and geographical disparities of public awareness to Covid-19 on social media, and does the changing awareness associate with the Covid-19 outbreak? The study established a social media data mining framework, which uses the Twitter-calculated Ratio index to quantify the disparities of pandemic awareness by language at multiple spatial and temporal scales. The lag correlations between the Ratio index and Covid-19 health impact indicators were calculated at the global scale and in selected countries, confirming significant associations and lag effects between public awareness and the Covid-19 outbreak.
There are valuable findings from this research. First, global public awareness of Covid-19 changed over the six months and reached the highest in the middle of March 2020. The major official pandemic-related announcements triggered rising public awareness in the pre-pandemic period. The global public awareness dynamics on Twitter have high correlations with the mortality rate and case fatality ratio by 21–31 and 35–42 days ahead. Second, linguistic and geographical disparities of public awareness existed during the pre-pandemic and pandemic-outbreak periods. Users tweeting in India and Bangladesh’s official or regional languages, e.g. Gujarati, Bengali, Marathi, and Punjabi, had higher public awareness toward Covid-19 due to the impacts caused by the nationwide lockdown in both countries. Users tweeting in Chinese were most concerned about the pandemic in February 2020, while the Covid-19 awareness of users tweeting in other languages was the highest in March and April 2020. Asian countries had greater disparities in Covid-19 awareness than European countries, and Eastern Europe’s public awareness was generally higher than that of central Europe. Third, the Ratio index had the highest correlation with mortality rate with an average of 13–18 leading days at the country level. The association between the Ratio index and Covid-19 health impacts varies from country to country, suggesting that in-depth research on how discrepancies in public awareness, together with diversified socioeconomic conditions, medical resources, and public attitudes in different countries, affect the Covid-19 morbidity and mortality are needed.
The produced dataset describing public awareness of the Covid-19 will offer valuable insights into relevant studies. Researchers can leverage the public Covid-19 awareness to further investigate the consequences of awareness changes on human behaviors, economy, tourism, and Covid-19 health impacts in different countries. For instance, the public awareness can be incorporated with other NPIs, including Covid-19 policies (e.g. policy scores from the Oxford Covid-19 Government Response Tracker (Hale et al. Citation2021)) and human mobility measurements (e.g. SafeGraph Mobility datasets), to explore their interplay. In addition, the developed framework can be used to track long-term Covid-19 awareness by language and country. Advanced time-series statistical models, e.g. vector autoregression (VAR) model, can be applied to reveal the causal relationships between various NPIs (policy, awareness, and behaviors) and their compounding effects on Covid-19 spread.
Acknowledgements
This article is based on work supported by the Texas A&M Institute of Data Science (TAMIDS) under the Data Resource Development Program. The statements, findings, and conclusions are those of the authors and do not necessarily reflect the views of the funding agency.
Data availability statement
The data used in this research were derived from the following resources available in the public domain: Internet Archive (https://archive.org/details/twitterstream?sort=-publicdate), United Nation (http://data.un.org/), and COVID-19 Data Repository by the Center for Systems Science and Engineering (CSSE) at Johns Hopkins University (https://github.com/CSSEGISandData/COVID-19).
Disclosure statement
No potential conflict of interest was reported by the author(s).
Additional information
Funding
References
- Allen, Chris, Ming-Hsiang Tsou, Anoshe Aslam, Anna Nagel, and Jean-Mark Gawron. 2016. “Applying GIS and Machine Learning Methods to Twitter Data for Multiscale Surveillance of Influenza.” PLOS ONE 11 (7): e0157734. doi:10.1371/journal.pone.0157734.
- Allington, Daniel, Bobby Duffy, Simon Wessely, Nayana Dhavan, and James Rubin. 2020. “Health-Protective Behavior, Social Media Usage and Conspiracy Belief During the COVID-19 Public Health Emergency.” Psychological Medicine 51 (June): 1763–1769. doi:10.1017/S003329172000224X.
- Alqurashi, Sarah, Ahmad Alhindi, and Eisa Alanazi. 2020. “Large Arabic Twitter Dataset on COVID-19.” ArXiv:2004.04315 [Cs], April. http://arxiv.org/abs/2004.04315.
- Banda, Juan M., Ramya Tekumalla, Guanyu Wang, Jingyuan Yu, Tuo Liu, Yuning Ding, Ekaterina Artemova, Elena Tutubalina, and Gerarado Chowell. 2021. “A Large-Scale COVID-19 Twitter Chatter Dataset for Open Scientific Research—An International Collaboration.” Epidemiologia 2 (3): 315–324. doi:10.3390/epidemiologia2030024.
- Chen, Emily, Kristina Lerman, and Emilio Ferrara. 2020. “Tracking Social Media Discourse About the COVID-19 Pandemic: Development of a Public Coronavirus Twitter Data Set.” JMIR Public Health and Surveillance 6 (2): e19273. doi:10.2196/19273.
- Chen, Long, Hanjia Lyu, Tongyu Yang, Yu Wang, and Jiebo Luo. 2020. “In the Eyes of the Beholder: Analyzing Social Media Use of Neutral and Controversial Terms for COVID-19.” ArXiv:2004.10225 [Cs], September. http://arxiv.org/abs/2004.10225.
- Choudhury, Munmun De, Michael Gamon, Scott Counts, and Eric Horvitz. 2013. “Predicting Depression via Social Media.” In Seventh International AAAI Conference on Weblogs and Social Media 7 (1): 10.
- Chunara, Rumi, Jason R. Andrews, and John S. Brownstein. 2012. “Social and News Media Enable Estimation of Epidemiological Patterns Early in the 2010 Haitian Cholera Outbreak.” The American Journal of Tropical Medicine and Hygiene 86 (1): 39–45. doi:10.4269/ajtmh.2012.11-0597.
- Culotta, Aron. 2010. “Detecting Influenza Outbreaks by Analyzing Twitter Messages.” ArXiv:1007.4748 [Cs], July. http://arxiv.org/abs/1007.4748.
- Culotta, Aron. 2014. “Estimating County Health Statistics with Twitter.” Proceedings of the SIGCHI Conference on human factors in computing systems, 1335-1344. Toronto Ontario Canada: ACM. doi:10.1145/2556288.2557139.
- Dong, Ensheng, Hongru Du, and Lauren Gardner. 2020. “An Interactive Web-Based Dashboard to Track COVID-19 in Real Time.” The Lancet Infectious Diseases 20 (5): 533–534. doi:10.1016/S1473-3099(20)30120-1.
- “East Central Europe COVID-19 Monitor.” 2022. European University Institute. Accessed April 28. https://www.eui.eu/research-hub?id=east-central-europe-covid-19-monitor.entral Europe COVID-19 Monitor.
- Gao, Junling, Pinpin Zheng, Yingnan Jia, Hao Chen, Yimeng Mao, Suhong Chen, Yi Wang, Hua Fu, and Junming Dai. 2020. “Mental Health Problems and Social Media Exposure During COVID-19 Outbreak.” PLOS ONE 15 (4): e0231924. doi:10.1371/journal.pone.0231924.
- Gollust, Sarah E., Rachel I. Vogel, Alexander Rothman, Marco Yzer, Erika Franklin Fowler, and Rebekah H. Nagler. 2020. “Americans’ Perceptions of Disparities in COVID-19 Mortality: Results from a Nationally-Representative Survey.” Preventive Medicine 141 (December): 106278. doi:10.1016/j.ypmed.2020.106278.
- Gore, Ross Joseph, Saikou Diallo, and Jose Padilla. 2015. “You Are What You Tweet: Connecting the Geographic Variation in America’s Obesity Rate to Twitter Content.” PLOS ONE 10 (9): e0133505. doi:10.1371/journal.pone.0133505.
- Graham, Mark, Scott A Hale, and Devin Gaffney. 2014. “Where in the World Are You? Geolocation and Language Identification in Twitter.” The Professional Geographer 66 (4): 568–578. doi:10.1080/00330124.2014.907699.
- Gruzd, Anatoliy, and Philip Mai. 2020. “Going Viral: How a Single Tweet Spawned a COVID-19 Conspiracy Theory on Twitter.” Big Data & Society 7 (2): 205395172093840. doi:10.1177/2053951720938405.
- Hale, Thomas, Noam Angrist, Rafael Goldszmidt, Beatriz Kira, Anna Petherick, Toby Phillips, Samuel Webster, et al. 2021. “A Global Panel Database of Pandemic Policies (Oxford COVID-19 Government Response Tracker).” Nature Human Behaviour 5 (4): 529–538. doi:10.1038/s41562-021-01079-8.
- Hassan Zadeh, Amir, Hamed M. Zolbanin, Ramesh Sharda, and Dursun Delen. 2019. “Social Media for Nowcasting Flu Activity: Spatio-Temporal Big Data Analysis.” Information Systems Frontiers 21 (4): 743–760. doi:10.1007/s10796-018-9893-0.
- Hu, Dingtao, Xiaoqi Lou, Zhiwei Xu, Nana Meng, Qiaomei Xie, Man Zhang, Yanfeng Zou, Jiatao Liu, Guoping Sun, and Fang Wang. 2020. “More Effective Strategies Are Required to Strengthen Public Awareness of COVID-19: Evidence from Google Trends.” Journal of Global Health 10 (1): 12. doi:10.7189/jogh.10.011003.
- International Labour Organization. 2020. “ILO Monitor: COVID-19 and the World of Work.” Updated estimates and analysis. Int Labour Organ. http://hdl.voced.edu.au/10707/533608.
- Iso, Hayate, Shoko Wakamiya, and Eiji Aramaki. 2016. “Forecasting Word Model: Twitter-Based Influenza Surveillance and Prediction.” Proceedings of COLING 2016, the 26th International Conference on computational linguistics: technical papers, 76-86.
- Jahanbin, Kia, and Vahid Rahmanian. 2020. “Using Twitter and Web News Mining to Predict COVID-19 Outbreak.” Asian Pacific Journal of Tropical Medicine 13 (8): 378. doi:10.4103/1995-7645.279651.
- La, Viet-Phuong, Thanh-Hang Pham, Manh-Toan Ho, Minh-Hoang Nguyen, Khanh-Linh P Nguyen, Thu-Trang Vuong, Hong-Kong T Nguyen, et al. 2020. “Policy Response, Social Media and Science Journalism for the Sustainability of the Public Health System Amid the COVID-19 Outbreak: The Vietnam Lessons.” Sustainability 12 (7): 2931. doi:10.3390/su12072931.
- Lamsal, Rabindra. 2021. “Design and Analysis of a Large-Scale COVID-19 Tweets Dataset.” Applied Intelligence 51 (5): 2790–2804. doi:10.1007/s10489-020-02029-z.
- Li, Diya, Harshita Chaudhary, and Zhe Zhang. 2020. “Modeling Spatiotemporal Pattern of Depressive Symptoms Caused by COVID-19 Using Social Media Data Mining.” International Journal of Environmental Research and Public Health 17 (14): 4988. doi:10.3390/ijerph17144988.
- Li, Cuilian, Li Jia Chen, Xueyu Chen, Mingzhi Zhang, Chi Pui Pang, and Haoyu Chen. 2020. “Retrospective Analysis of the Possibility of Predicting the COVID-19 Outbreak from Internet Searches and Social Media Data, China, 2020.” Eurosurveillance 25 (10), doi:10.2807/1560-7917.ES.2020.25.10.2000199.
- Li, Zhenlong, Xiao Huang, Xinyue Ye, Yuqin Jiang, Yago Martin, Huan Ning, Michael E. Hodgson, and Xiaoming Li. 2021. “Measuring Global Multi-scale Place Connectivity using Geotagged Social Media Data.” Scientific Reports 11 (1): 31. doi:10.1038/s41598-021-94300-7.
- Lopez, Christian E, Malolan Vasu, and Caleb Gallemore. 2020. “Understanding the perception of covid-19 policies by mining a multilanguage twitter dataset.” arXiv preprint arXiv:2003.10359.
- Lwin, May Oo, Jiahui Lu, Anita Sheldenkar, Peter Johannes Schulz, Wonsun Shin, Raj Gupta, and Yinping Yang. 2020. “Global Sentiments Surrounding the COVID-19 Pandemic on Twitter: Analysis of Twitter Trends.” JMIR Public Health and Surveillance 6 (2): e19447. doi:10.2196/19447.
- McCaffery, Kj, Rh Dodd, E. Cvejic, J. Ayre, C. Batcup, Jmj Isautier, T. Copp, et al. 2020. “Disparities in COVID-19 Related Knowledge, Attitudes, Beliefs and Behaviors by Health Literacy.” Public and Global Health, doi:10.1101/2020.06.03.20121814.
- McIver, David J, Jared B Hawkins, Rumi Chunara, Arnaub K Chatterjee, Aman Bhandari, Timothy P Fitzgerald, Sachin H Jain, and John S Brownstein. 2015. “Characterizing Sleep Issues Using Twitter.” Journal of Medical Internet Research 17 (6): e140. doi:10.2196/jmir.4476.
- Mocanu, Delia, Andrea Baronchelli, Nicola Perra, Bruno Gonçalves, Qian Zhang, and Alessandro Vespignani. 2013. “The Twitter of Babel: Mapping World Languages Through Microblogging Platforms.” PLoS ONE 8 (4): e61981. doi:10.1371/journal.pone.0061981.
- Nemes, László, and Attila Kiss. 2020. “Social Media Sentiment Analysis Based on COVID-19.” Journal of Information and Telecommunication 5 (1): 1–15. doi:10.1080/24751839.2020.1790793.
- Paul, Michael J., and Mark Dredze. 2014. “Discovering Health Topics in Social Media Using Topic Models.” PLoS ONE 9 (8): e103408. doi:10.1371/journal.pone.0103408.
- Qin, Lei, Qiang Sun, Yidan Wang, Ke-Fei Wu, Mingchih Chen, Ben-Chang Shia, and Szu-Yuan Wu. 2020. “Prediction of Number of Cases of 2019 Novel Coronavirus (COVID-19) Using Social Media Search Index.” International Journal of Environmental Research and Public Health 17 (7): 2365. doi:10.3390/ijerph17072365.
- Rufai, Sohaib R, and Catey Bunce. 2020. “World Leaders’ Usage of Twitter in Response to the COVID-19 Pandemic: A Content Analysis.” Journal of Public Health 42 (3): 510–516. doi:10.1093/pubmed/fdaa049.
- Saad, Muhammad, Muhammad Hassan, and Fareed Zaffar. 2020. “Towards Characterizing COVID-19 Awareness on Twitter.” ArXiv:2005.08379 [Cs], May. http://arxiv.org/abs/2005.08379.
- Shahsavari, Shadi, Pavan Holur, Timothy R. Tangherlini, and Vwani Roychowdhury. 2020. “Conspiracy in the Time of Corona: Automatic Detection of Covid-19 Conspiracy Theories in Social Media and the News.” ArXiv:2004.13783 [Cs], April. http://arxiv.org/abs/2004.13783.
- Signorini, Alessio, Alberto Maria Segre, and Philip M. Polgreen. 2011. “The Use of Twitter to Track Levels of Disease Activity and Public Concern in the U.S. During the Influenza A H1N1 Pandemic.” PLoS ONE 6 (5): e19467. doi:10.1371/journal.pone.0019467.
- Sloan, Luke, Jeffrey Morgan, Pete Burnap, and Matthew Williams. 2015. “Who Tweets? Deriving the Demographic Characteristics of Age, Occupation and Social Class from Twitter User Meta-Data.” PLOS ONE 10 (3): e0115545. doi:10.1371/journal.pone.0115545.
- Sun, Qindong, Nan Wang, Shancang Li, and Hongyi Zhou. 2018. “Local Spatial Obesity Analysis and Estimation Using Online Social Network Sensors.” Journal of Biomedical Informatics 83 (7): 54–62. doi:10.1016/j.jbi.2018.03.010.
- Tasnim, Samia, Md Mahbub Hossain, and Hoimonty Mazumder. 2020. “Impact of Rumors and Misinformation on COVID-19 in Social Media.” Journal of Preventive Medicine and Public Health 53 (3): 171–174. doi:10.3961/jpmph.20.094.
- Wang, Kejin, Nina S. N. Lam, Lei Zou, and Volodymyr Mihunov. 2021. “Twitter Use in Hurricane Isaac and Its Implications for Disaster Resilience.” ISPRS International Journal of Geo-Information 10 (3): 116. doi:10.3390/ijgi10030116.
- Zhu, Bangren, Xinqi Zheng, Haiyan Liu, Jiayang Li, and Peipei Wang. 2020. “Analysis of Spatiotemporal Characteristics of Big Data on Social Media Sentiment with COVID-19 Epidemic Topics.” Chaos, Solitons & Fractals 140 (November): 110123. doi:10.1016/j.chaos.2020.110123.
- Zola, Paola, Paulo Cortez, and Maurizio Carpita. 2019. “Twitter User Geolocation Using Web Country Noun Searches.” Decision Support Systems 120 (May): 50–59. doi:10.1016/j.dss.2019.03.006.
- Zou, Lei, Nina S. N. Lam, Heng Cai, and Yi Qiang. 2018. “Mining Twitter Data for Improved Understanding of Disaster Resilience.” Annals of the American Association of Geographers 108 (5): 1422–1441. doi:10.1080/24694452.2017.1421897.
- Zou, Lei, Nina S. N. Lam, Shayan Shams, Heng Cai, Michelle A. Meyer, Seungwon Yang, Kisung Lee, Seung-Jong Park, and Margaret A. Reams. 2019. “Social and Geographical Disparities in Twitter Use During Hurricane Harvey.” International Journal of Digital Earth 12 (11): 1300–1318. doi:10.1080/17538947.2018.1545878.
- Zubiaga, Arkaitz, Alex Voss, Rob Procter, Maria Liakata, Bo Wang, and Adam Tsakalidis. 2017. “Towards Real-Time, Country-Level Location Classification of Worldwide Tweets.” ArXiv:1604.07236 [Cs], April. http://arxiv.org/abs/1604.07236.
Appendix
Table A1. Language-country matching list
Table A2. Statistics of Twitter data by language
Table A3. List of countries speaking common languages