
 ?Mathematical formulae have been encoded as MathML and are displayed in this HTML version using MathJax in order to improve their display. Uncheck the box to turn MathJax off. This feature requires Javascript. Click on a formula to zoom.
ABSTRACT
Thousands of satellites and instruments are providing very unique long-term, refined, and diverse perception capabilities for the states and changes of the Earth's surface environment. When leveraging Earth Observation (EO) techniques in SDG monitoring in specific regions, an important prerequisite is to evaluate whether EO could meet user requirements in terms of spatial coverage, temporal frequency and observing variables or objects. It is highly expected to have a quantitative model that can not only represent EO capabilities and observation requirements but also evaluate the potential of EO capability to fulfil these requirements. This paper first describes EO capabilities from the satellite's orbit, operation time, spatial resolution, revisit cycle, accessibility and observation relevance level to variables. Observation requirements and priorities are then derived from SDG indicators. Finally, the potential model is established to match EO capabilities and user requirements. Taking SDG 14.1.1 as an example, this model is capable of returning an ordered list of satellites and instruments for users to refer to. This model meets the gap of evaluating EO potential to fulfil SDG monitoring. It could make full use of the available EO capabilities worldwide to meet SDG indicator monitoring requirements.
1. Introduction
Earth Observation (EO) plays an important role in informed governance, especially for entities without strong data capabilities. The Sustainable Development Goals (SDGs), as adopted by the United Nations (UN) in 2015 (UN Citation2015), are one of the best practices that use data to assist the policy-making process (Nativi et al. Citation2019; Guerry et al. Citation2015). Remote sensing and other observation technologies greatly support some regions to achieve SDGs where data are partly unavailable. The SDG expert group provided a set of indicators by the UN Statistical Commission to make the SDGs measurable. In addition, the International Science Council has identified five priorities for scientifically measuring progress on the SDG: designing a set of practical indicators, developing a monitoring plan for these indicators, evaluating progress towards the goals, improving the construction of observation infrastructure, and standardizing the source and quality of data. These five priorities help scholars and policy makers identify gaps, which is an organic combination of current observation capabilities and future observation plans. Among all EO techniques, including space-based (or remote sensing) observations and surface-based (in-situ) measurements, remote sensing is widely used, especially for global-scale observations, due to its large-scale and long-time span nature. This paper will focus on space-based EO.
Various agencies and scholars have assessed how space-based Earth Observation tools can support SDG monitoring (Lehmann et al. Citation2014). The European Space Agency (ESA), in collaboration with other space agencies, such as the Committee on Earth Observation Satellites (CEOS), published reports of satellites’ support of the SDGs (Paganini et al. Citation2018). The Group on Earth Observation (GEO) also published reports on EO in support of the 2030 Agenda (Anderson et al. Citation2017). The China Academy of Sciences (CAS) published reports annually to assess SDG achievements supported by big Earth data (especially EO data) (Huadong Citation2021a, Citation2021b). The UN launched the Technology Facilitation Mechanism (TFM) (Walsh, Murphy, and Horan Citation2020) for multistakeholder collaboration and synergy among science and technology initiatives. In the hope that TFM could contribute to breakthroughs in calculating Tier II and Tier III indicators, these reports summarized the roles of EO data in support of SDG targets and indicators. In addition, they used several cases to illustrate the data contribution, methods innovation and decision-making practices. However, there is no consensus on how EO data could be utilized to support SDG indicators (Kussul et al. Citation2019; Anderson et al. Citation2017; Estoque Citation2020). With the development of observation technologies and innovations in evaluation methods, it becomes possible to measure and monitor more targets and indicators. The most urgent task of TFM is to achieve a breakthrough in the data and indicator methods of Tier II (conceptually clear but no regular data). Therefore, it is highly expected to have a quantitative model to represent EO capabilities and SDG monitoring requirements, to evaluate the potential of EO capability to fulfil these requirements, and to find the most suitable Earth observation data to the greatest extent possible.
1.1. Essential variables
Since there is no consensus on EO functionality in supporting SDGs and technologies, it is important to directly connect EO capabilities with science or policy targets. Several communities have developed the concept of Essential Variables (EVs) to better describe and quantify Earth Observation requirements (Lehmann et al. Citation2020). EVs are similar to a set of words that represent the Earth system's components, state and development.
EVs can also improve the workflow from raw data to end-user products (Lehmann et al. Citation2020; Masó et al. Citation2020). Many institutions and organizations define policy indicator systems based on EVs to serve policy-making processes. The ConnectinGEO project offers several variable systems of different maturity levels. Its follow-up project, GEOEssential, further developed SBA (Societal Benefits Areas)-related EVs. It aims to derive policy relevant indicators using EVs so that it can identify key gaps in SBAs. Different domains set up their EVs based on science principles. For example, the first EO variable system is from the climate community. The community dedicated to the Global Climate Observing System (GCOS) took the lead in developing the Essential Climate Variables (ECVs) to coordinate climate observations (Bojinski et al. Citation2014). It was developed from the original 50 ECVs to the current 54 ECVs. The rationale of ECVs is to understand Earth’s climate characteristics and attribute climate change's underlying factors (Miranda Espinosa, Giuliani, and Ray Citation2020). The Intergovernmental Oceanographic Commission (IOC) developed the Essential Ocean Variables (EOV) (Note: Only space-based observations are considered here. There is another set of eEOVs mainly derived from in situ observation data, called the ‘subvariable’ or ‘supporting variable’ of EOVs (Constable et al. Citation2016). The GEO Biodiversity Observation Network (GEO BON) has developed the Essential Biodiversity Variable (EBV) (Pettorelli et al. Citation2016).
To facilitate global change studies, the National Aeronautics and Space Administration (NASA) has established the Global Change Master Directory (GCMD) keywords (Aleman Citation2017; Bukhres et al. Citation2000). GCMD is a hierarchical set of controlled Earth Science vocabularies to ensure that Earth science data, services, and variables are described in a consistent manner. It has been actively updated for over 20 years. Thus, this is the most comprehensive keyword system and is not constrained to EO variables. Apart from Earth science keywords, it contains 13 other categories, such as Earth science services, data centres/service provides, projects, instruments/sensors, etc. Because of its completeness, it has been extensively referenced for many EO variables. For example, CEOS maps their Missions, Instruments, Measurements (MIM) keywords, which are designed for key measurements of interest to users of EO satellite data, to GCMD keywords. CEOS, as an intergovernmental organization, sets its mission to coordinate space-based EO resources to make it easier for users to access data. Thus, MIM keywords are used to describe requirements within space-based capabilities (Han et al. Citation2016).
The guiding ideology to build EO requirements for SDGs is starting from EVs rather than based on satellite platforms or observation technologies. This is more in line with the logic of observing natural systems, and at the same time, it can adapt to the development of technology. The design of the observation system will not be limited by the current observation capabilities but will continue to innovate or iterate over time.
1.2. EO's support of SDG goals, targets and indicators
Agencies and organizations such as GEO (Paganini et al. Citation2018), CEOS (Anderson et al. Citation2017) and CAS (Huadong Citation2021a, Citation2021b) publish reports annually about how EO techniques and data can contribute to SDG monitoring. These reports try to clearly understand where EO data currently support SDG goals and indicators and where they may play a role in the future. Although the conclusions of these analyses are generally the same in terms of the goals, indicators, and types of indicators that can be supported by the EO data, there are still differences between agencies. Besides, it implies that the potential capability of EO data is still underestimated for SDG indicator monitoring over years. For example, indicator 11.4.1 is for the total expenditure (public and private) per capita spent on the preservation, protection and conservation of all cultural and natural heritage, by type of heritage (cultural, natural, mixed and World Heritage Centre designation), level of government (national, regional and local/municipal), type of expenditure (operating expenditure/investment) and type of private funding (donations in kind, private nonprofit sector and sponsorship). It was classified as tier III before 2021, where no established methodologies and standards or methodology/standards are being developed or tested. It was not considered ready to be supported by EO data according to GEO's report both in 2017 and 2018. However, CAS produced the Yellow Mountain World Heritage Site Remote Sensing Ecological Index (RSEI) for a 25-year time span dataset in 2019. It helped to quantify 11.4 of ‘Strengthen efforts to protect and safeguard the world’s cultural and natural heritage’. The key is to measure capital investment, especially for natural heritage and mixed heritage. It can be calculated from the investment per unit area of the protected area. This helped indicator 11.4.1 move from tier III to tier II.
The current variations of different frameworks in defining or classifying EO-enabled SDG indicators can partly be attributed to two major reasons. First, the EO techniques will develop with time. Second, no one can perform a comprehensive evaluation of EO’s support for SDGs due to the large size of the EO capability base. Rather, a more systematic and strategic method would make it reproducible and easier to broaden the scope and perform comprehensive assessments.
1.3. The potential of EO data
Although there is no quantified way to evaluate EO potential for SDG indicators, the World Bank (García et al. Citation2016) put forward a framework to determine whether to use EO products for water resource management. They developed a decision tree as guidelines where the entry of the tree defines the nature of the WRM problem. Then, it considers the existing observation networks. Two decisive questions are whether users need to use EO and whether EO potentially provides the required data. Among the four questions, only the existing observation networks are certain, while others to some extent rely on subjective judgment. However, these questions can be quantified.
Under the context of the World Bank's decision tree, the EO potential is determined by the extent to which EO capabilities can meet the requirements of observation tasks. Therefore, it is important to systematically describe EO capabilities. Generally, satellite-derived EO capability can be explained by two factors. One is the satellite platform, which affects the spatiotemporal coverage of the Earth. Only if the satellite flies passing by the region can EO data be returned. Although whether there will be data returned partly depends on the ground segment, satellite coverage of the Earth is an important prerequisite. The other factor is the capabilities of instruments on the satellite that decides what Earth objects to measure. EVs, introduced in the introduction section, is a great and widely recognized way to describe these measurable Earth objects.
This paper aims to develop a reproducible method to evaluate the EO potential for SDG indicators by modelling EO capabilities and user requirements.
2. Methodology
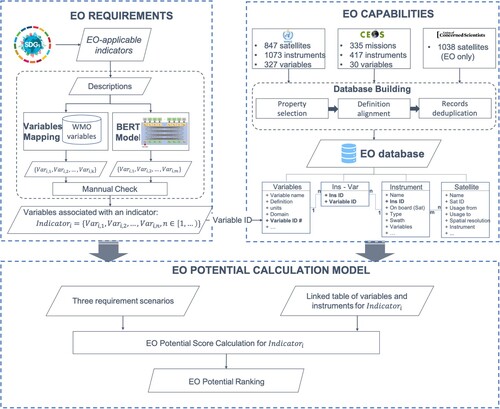
This paper refers to the process of defining a future satellite mission's system architecture (Selva and Crawley Citation2013) and introduces three steps to evaluate the EO potential for SDG indicator monitoring: defining the domain knowledge for EO capabilities, deriving observation requirements for an indicator (observation variables), and calculating the EO potential for an indicator.
2.1. Domain knowledge for EO capabilities
To compute EO capabilities, domain knowledge acts as an important input that is usually more structured and centralized. Generally, satellite-derived EO capabilities are determined by two major components. One is the satellite, and the other is the instrument. Satellites are platforms that carry instruments and significantly affect the spatiotemporal coverage of observations. Some decisive factors include the satellite orbit, altitude, launch date, end of life, revisiting cycle, launch mass and other related parameters. The satellite orbital altitude shows a strong linear relation with the observation spatiotemporal resolution (Reubelt, Sneeuw, and Sharifi Citation2010). A higher altitude provides faster revisit but results in lower spatial resolution. Satellites in lower orbits generally take longer to revisit a place, although they tend to capture higher-resolution data and cost less to launch. Orbital types also make a difference because they set the observation time of the day and impact illumination conditions. Satellites flying on Sun-Synchronous Orbit (SSO) can give a consistent illumination condition for every single observation. The launch mass usually relates to the launch costs. Larger satellites are costly due to their complex structures and comprehensive systems. The launch date and end of life obviously determine the data availability in terms of time.
The instrument, which is also known as a sensor, receives signals reflecting from the Earth. It directly determines the observation objects or variables. Types of instruments on remote sensing satellites include but are not limited to multispectral scanners, infrared scanners, synthetic aperture radars, microwave radiometers, microwave scatterometers, radar altimeters, hyperspectral imagers, etc. The instrument type is associated with the wavelength they can receive. Instruments can also determine the spectral resolution, which represents the number of bands or channels, band interval and wavelength used by the instrument to receive the radiant energy of the target object.
This information is usually published with the satellite mission. Fortunately, some organizations provide databases to accommodate satellite and instrument data. The Union of Concerned Scientists (UCS) provides a satellite database with details on the 4550 satellites currently in operation, including Earth Observation, communication, space science and science development purposes. CEOS, the Committee on Earth Observation Satellites, built a regularly updated database that provides information on missions, satellites, agencies, instruments and measurements. The World Meteorological Organization (WMO) launched the WMO Space Programme to ensure sustained and interoperable satellite observations and promote their applications. They collected details of environmental satellite missions, instruments and other related information. The Observing Systems Capability Analysis and Review Tool (OSCAR) was developed to serve as an interface (Oscar Citation2019). It also provides expert assessments on the relevance of instruments for fulfilling some WMO predefined capabilities. This database contains more than 824 satellites (312 satellites in operation and 323 future missions) and 1051 instruments. There are some other individually operating databases, such as CelesTrak providing satellites and their orbital data, Heavens Above hosted by DLR/GSOC (German Aerospace Center/The German Space Operations Center) and University of Twente's satellite database. Among these data sources, WMO provides the most comprehensive information in terms of satellites, instruments and their relations. Therefore, the WMO’s dataset is considered the EO capability database here.
To better manage, represent and reason about spatial data and to promote knowledge sharing, ontologies are commonly used. NASA launched several ontology models, including SWEET ontologies (DiGiuseppe, Pouchard, and Noy Citation2014; Raskin Citation2010), NExIOM (Bailin, Hodgson, and Keller), Air Traffic Management Ontology (Keller Citation2017) and Metadata catalogue (Haase et al. Citation2018). Rovetto (Rovetto Citation2016b; Rovetto and Kelso Citation2016; Rovetto Citation2017, Citation2016a) developed an astronautical knowledge modelling suite. The suite is designed to provide a set of modular domains or reference ontologies to support space situation awareness (SSA). In information and computer science, an ontology is a formal model or representation of the types of attributes, objects, events, processes, and relationships that constitute a common set in a particular domain of knowledge.
This paper refers to the idea of ontology design. Several important properties are selected as key properties to describe the concept of satellite and instrument (). As a result, 782 satellite instances, and 1010 instrument instances were built with the following properties.
Table 1. Satellite and instrument properties.
2.2. Earth observation requirements
An SDG indicators or other scientific or natural resource management goals usually do not directly indicate the desired EO capability. That is why the World Bank set defining the nature of a problem as the first step of the decision tree. The nature of a problem can be further translated into the observation requirements. They depend on individual regions, countries, and even organizations’ business needs. Instead of listing all observation requirements, the first priority is to link the Earth variables, which can directly associate EO resources with an indicator. Earth variables, as a bridge to connect indicators and EO capabilities, are regarded as a type of EO requirement. It is important to understand the context and relate Earth variables to indicators. Taking indicator 3.9.1 as an example, it aims to calculate the mortality rate attributed to ambient air pollution. Evidence from epidemiological studies has shown that exposure to air pollution is linked to many important diseases (Rajagopalan, Al-Kindi, and Brook Citation2018). Air pollution from various sources could be the most supportive data for this indicator calculation. Major related observation variables from the WMO include aerosol dust concentration, Aerosol Optical Depth, aerosol species total column burden, aerosol volcanic ash, aerosol volcanic ash total column, NO2, N2O and SO2. Once observation variables are sorted out for an indicator, it becomes much easier to relate instruments to this indicator because an instrument's type, channel or other physical features significantly decide observation variables.
This process usually relies heavily on expert knowledge, which requires a solid understanding of the observation task. This knowledge could either be published papers or reports. Fortunately, the abovementioned agencies in Section 1.2 provide their assessment of EO-supported indicators. Most of them illustrate the assessment by case studies but rarely a comprehensive or systematic way to evaluate what variables and EO capabilities could contribute to indicator monitoring.
In this paper, we combined expert knowledge with natural language process (NLP) techniques to mine the related variables of an indicator. Expert knowledge comes from existing reports about how EO supports SDGs. GEO, CEOS and CAS published reports in the past 5 years. They listed which indicators could be supported by EO techniques. compared the differences among the three reports. Because CEOS and GEO shared the same result, they were combined into one data source. CAS illustrated their results using a case-study method, so only a few indicators are listed. However, we can observe that there is no consensus on how EO could support SDGs. For example, in 2017, targets 9.2 and 9.3 were not considered ready to be monitored, but in 2018, they were included. CAS also found that indicator 11.4.1 (about expenditure on the preservation, protection and conservation of all cultural and natural heritage) has the potential to be supported by EO.
Table 2. The number of targets and indicators that could be supported by EO from different reports (differences in targets and indicators are indicated in rackets.).
provides valuable prior knowledge, but it needs to be updated as technology advances and cognition improves. In addition, even large organizations could possibly miss some factors. Thus, this work thoroughly analysed all SDGs in the hope of filtering as many indicators as possible based on past experiences (see the last column of ). This paper not only included all previous indicators but also improved most of them, such as goals 1, 2, 3, 7, 8, 11, 12, 13, and 14. Goal 17 is about global partnership, which is considered ready or clear as others, so it is excluded.
With this prior knowledge, the next step is to determine their associated variables. This paper introduced an NLP-facilitated method. In recent years, pretrained language models (PTMs) have achieved great success on many natural language processing tasks. PTMs learn the rich linguistic knowledge in the text by training on massive unlabelled data, making them capable of transferring to specific tasks in different domains. One application is the zero-shot text classification task. In this paper, our purpose of associating SDG indicators with Earth variables can benefit from the task. Zero-shot models learn a classifier on one set of labels and then make predictions on another set of labels that the classifier has never seen before. Here, we adopt the Bart-Large-MNLI model, which is based on the BART model (Lewis et al. Citation2019) and trained on the MultiNLI dataset (Williams, Nangia, and Bowman Citation2017). The Bart-Large-MNLI model works by constructing a hypothesis of the text to be classified and each candidate label and then calculating the probability that the hypothesis holds. For example, if we want to evaluate whether SDG indicator 2.4.1 (proportion of agricultural area under productive and sustainable agriculture) is related to the variable ‘land cover’, we can construct a hypothesis such as ‘The example can be explained by [land cover] variable’ (words in [ ] can be replaced). In this way, we can obtain the probability of correlation between each variable and a specific indicator.
The BERT method helps to roughly filter out possible variables linked to an indicator. A more specific manual check is applied to the results. The mapping results can be found at https://github.com/THU-EarthInformationScienceLab/EO-supported-SDGs.
2.3. The EO potential for an indicator
Whether EO capabilities can meet the requirement highly depends on the specific demand. The prior demand for these indicators could be totally different. For example, indicator 9.4.1 (carbon dioxide emissions per unit of value added) calculates the ratio between CO2 emissions from fuel combustion and the value added of associated economic activities (Zhang et al. Citation2019). Goal 9.4, a higher level of this indicator, sets the target time in 2030. Thus, this indicator probably attaches great importance to high-frequency data rather than covering a long period (especially the historical period).
This paper defines three possible requirement scenarios:
Requirement 1 (Req 1.) covering a (historical or future) time period as long as possible;
Requirement 2 (Req 2.) retrieving data at a very high frequency;
Requirement 3 (Req 3.) capturing high spatial-resolution data.
Regarding different observation tasks, the priorities of these requirements will change, and a real requirement could probably be an ordered combination of these requirements. Some indicators attach great importance to high revisit frequencies, such as disaster monitoring. Some require high-resolution images such as observations for urban purposes. Therefore, the calculation of the EO potential for an indicator is related not only to variables but also to other instrument parameters, such as revisit cycle, spatial resolution or operational life.
Once the requirement is set, the EO potential can be drawn from the following formulas.
Given a set of instrument instances , while
, each row is an instance of the instrument, and columns are their properties. Some predefined properties mainly affecting user requirements are shown in .
The priority of an instrument's property follows the formula:
Given an observation requirement order , an EO instrument’s potential score for an indicator is calculated by:
The first priority (), the second priority (
) and the third priority (
) are assigned to
,
or
according to user demands. A framework of the process is described in .
Figure 1. The framework for the EO potential model.
3. Results
3.1. Instrument operational life analysis
Based on satellite/instrument databases and the linkage built between indicators and variables, variables and instruments, instruments and satellites, some statistics could be drawn to help understand the current EO support for SDG indicators.
A very intuitive index to show how EO supports SDG indicators is the number of satellites for indicator monitoring over time. describes the change in instrument numbers from 1960 to 2040 for each indicator. A clear trend appears that the instrument number is generally increasing for every indicator, especially after 2000, and reaches a peak in 2022. Data after 2022 are based on the operational life of current instruments and future mission estimations.
Figure 2. Number of instruments for each indicator from 1960 to 2040 (estimated) .
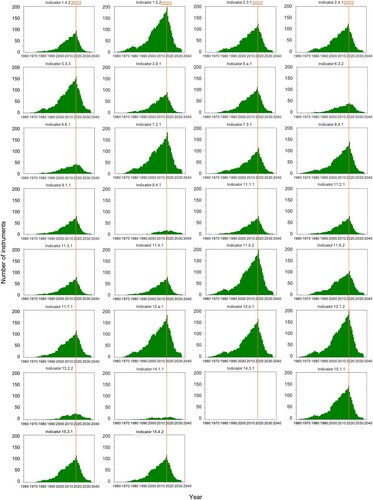
Despite increasing in number, there are significant variances in the absolute number of instruments among different indicators. Indicators 1.5.2, 3.3.3, 7.2.1, 11.5.2, 12.a.1, 12.b.1 and 13.1.2 are considered to receive much attention from the space not only from the instrument number but also in terms of the time span. Rather, indicators 6.3.2, 6.6.1, 9.4.1, 13.2.2, 14.1.1 and 14.3.1 are relatively poor in satellite observations and only have data for the current 30 years.
Indicator 14.3.1, average marine acidity (pH) measured at an agreed suite of representative sampling stations, does not show a large potential for EO with no instrument available to monitor marine pH. Although there is no directly related instrument for pH and the indicator requires measured data from sampling stations, EO can still help in measuring the surface pH value. The remote sensing EO technique has been proven to provide unique advantages for large-scale water body monitoring over longer time series (Kallio Citation2000). However, it is still underutilized. Some studies use ocean colour (OC), sea surface temperature (SST), and sea surface salinity (SSS) parameters to retrieve marine surface pH (Sun, Tang, and Wang Citation2012; Sabia et al. Citation2015; Chawla, Karthikeyan, and Mishra Citation2020).
3.2. Revisit frequency analysis
The revisit frequency is a decisive parameter in Req. 2. A revisit frequency is usually determined by the satellite's orbital altitude, instrument swath and sometimes side-looking capability. Usually, satellites on an SSO has regular revisit periods from half day to several days, while geostationary satellites can usually cover the Earth continiously. counts the fastest revisit time (in days) for each indicator. This shows that any place of the world could be revisited at least once every 20 days for most of indicator monitoring at ideal situations. Some can be up to within a day. For example, indicator 9.4.1 (carbon dioxide emissions per unit of value added), sampling of the day-night cycle or compact sources, such as megacities, is an important requirement (Eldering et al. Citation2017). The GIIRS instrument on FY-4 can revisit up to 30 minutes (Hua et al. Citation2018). However, indicator 1.5.2 of direct economic loss attributed to disasters in relation to global gross domestic product (GDP), which requires frequent observations for various disasters, has yet to be satisfied. The median observation frequency for indicator 1.5.2 is approximately 10 days. This could happen due to diverse types of disasters. Variables related to this indicator include but are not limited to permafrost, wind vector, pH, ocean velocity, ocean temperature, cloud cover, air temperature, and precipitation. According to the statistics (), there are 1132 satellites in total (269 in operation) with 467 instruments, including a high resolution optical imager (34%), moderate resolution optical imager (32%), cross-nadir infrared sounder (11%), SAR (7%) and so on. The size also varies from 0.75 kg to 1500 kg. Among 1132 satellites, there are 6 large satellites (> 1000 kg), 28 medium satellites (500∼1000 kg), 235 small satellites (100∼500 kg), 280 micro satellites (10∼100 kg), 53 nano satellites (1∼10 kg) and 1 pico satellite (0.1∼1 kg).
Figure 3. Boxplot of revisit frequency statistics for each indicator.
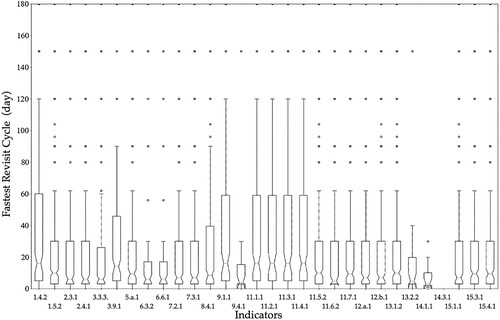
Table 3. Predefined features for the potential model.
Table 4. Instrument type statistics for indicator 1.5.2.
However, the revisit frequency value here can only be applied under the most ideal observation situation where the satellite keeps captured continuously and downlinks all captured data. In real situations, cloud cover could greatly affect image qualities, satellite may be shut down to save energies, data downlink could be interrupted due to limited bandwith.
3.3. Spatial resolution analysis
Spatial resolution is the most important factor for Req. 3. The capability of spatial resolution for each indicator is summarized in . Except for indicator 9.4.1 and indicator 13.2.2, more than half of the instruments for every indicator have a spatial resolution lower than 150 meters (at best).
Figure 4. Boxplot of spatial resolution statistics for each indicator.
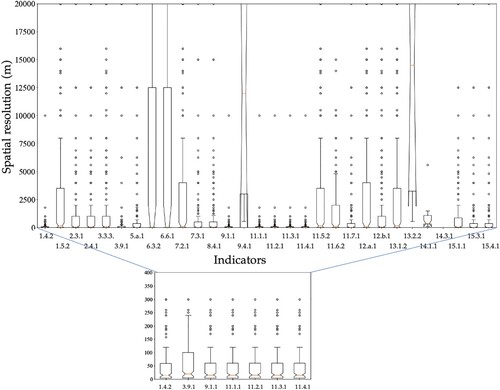
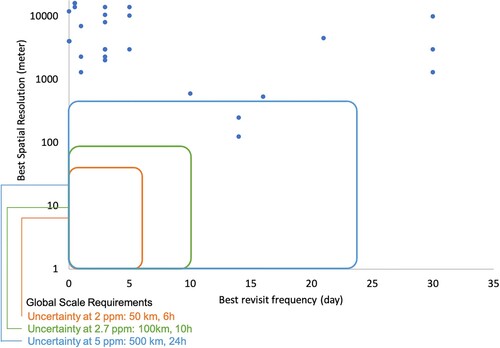
There is usually a trade-off between spatial resolution and temporal resolution. This trade-off is closely related to specific application scenarios. Taking indicator 9.4.1 to monitor CO2 emissions as an example (), the WMO defines the spatiotemporal resolution requirements under different uncertainties, which are shown in as three boxes. The boxes denote the spatiotemporal requirements boundary at 2, 2.7 and 5 ppm uncertainty individually at the global scale. For global monitor purposes, only two instruments fall in the range of the boxes. They could meet the current observation requirements, but both of them are future missions. They are CO2 lidar and CO sensors on the ASCENDS mission planned by NASA. Therefore, the EO for indicator 9.4.1 has great potential to be improved.
Figure 5. Requirements and current EO capabilities for indicator 9.4.1.
4. A use case of SDG indicator 14.1.1
Taking indicator 14.1.1 as an example, it is about (a) the index of coastal eutrophication and (b) plastic debris density. Variables include but are not limited to colour dissolved organic matter, dissolved inorganic carbon, coastlines, ocean chlorophyll concentration, ocean diffuse attenuation coefficient, ocean salinity, ocean subsurface dissolved oxygen concentration, and ocean suspended sediment concentration (Matthews Citation2011). The related instruments for these variables are listed in with their operation time period. The observation dates back to 1978. Currently, 27 instruments in operation with 9 are being launched in the future.
Figure 6. Life span of instruments for indicator 14.1.1.
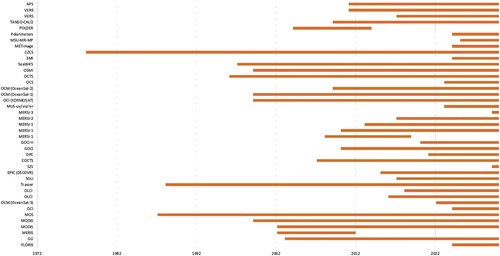
For water-related observations, the visible and near-infrared parts of the electromagnetic spectrum (400 - 1000 nm) are often used (Matthews Citation2011). Ecosystem analysis typically requires higher sampling frequencies to account for system changes that occur on short timescales (days/week). Although airborne platforms usually carry multispectral or hyperspectral spectrometers capable of capturing nearly continuous surface reflectance spectra, space-borne remote sensing can obtain spatiotemporally consistent data and is suitable for frequent monitoring at a relatively low cost, especially for developing countries. Therefore, the observation requirement priorities for this indicator are considered Req. 2, Req. 3 and Req. 1 (). The spatial resolution should be several times larger than the observation target (plastic debris, etc.).
For comparison, the table also provides scenarios with different priority settings. The scenario with no priority assigned (default) is also considered when the three requirements are equally assigned a weight of 1. Because whether the mission’s data are accessible is decisive as a multiplication factor, we indicate the ranking by absolute value but keep the minus sign to indicate the accessibility information. The results give the same top-2 order to MODIS and OLCI because of their good performance in all factors. However, the variance begins from COCTS. Using (2, 3, 1) priorities gives COCTS and VIIRS higher rankings than the default setting due to the very fast revisit time of up to half a day. Another large difference is the MOS, which ranks 8th in the default scenario but only ranks 18th in the (2, 3, 1) parameter setting. MOS has relatively good spatial resolution, but the 14-day revisit cycle does not meet the requirement. There are some instruments, such as MERSI-3, with good revisit time (0.5) and spatial resolution (250 m) ranking lower. This is because MERSI-3 flying on the FY-3 mission has its primary mission objectives for cloud, biomass and sea ice observations.
Table 5. The final potential score of each instrument for indicator 14.1.1.
5. Discussion and conclusion
This paper first leverages the satellite and instrument databases from WMO, CEOS and UCS to build EO capabilities. Then, it uses expert knowledge combined with an NLP-facilitated method to derive Earth Observation variables to connect EO capability with SDG indicators. After connecting EO to SDG indicators, a scenario-based requirement model is built. The EO potential calculation model considering three requirement scenarios is proposed to assess the satisfaction level of an instrument for an indicator. Finally, the paper illustrates the rationale of the model by applying analysis to all EO-related SDG indicators and gives an example to analyse the relationship between EO capability and the ranking results. The method provides a complete workflow using Earth variables as a bridge to connect current EO capabilities and SDG goals.
This model is independent from the SDG framework and has great potential to extend to other indicator frameworks, such as the Climate Change indicator dashboard built by the International Monetary Fund (IMF). The EO capability input is universal for all indicator frameworks, while the derived variables vary highly depending on the indicators. The variable derivation module plays an important role in connecting various indicator frameworks and EO capabilities.
There are some limitations with the current model that could be further improved. First, the EO database here is primarily based on the WMO's satellite and instrument capabilities, while data from CEOS and UCS are used as complements for property values. This database could be enriched by including more satellites and instruments in a more systematic way. Second, the derivation of variables from indicators needs further validation. Expert knowledge plays an important role in the variable derivation process, while further optimization and validation are required for NLP-facilitated technology (such as BERT). Third, this paper defines only three requirement scenarios. Expanding the current representation of the requirements and enhancing the matching model between them and the capabilities is needed to support complex or even fuzzy situations.
The data that support the findings of this study are available in the Department of Economic and Social Affairs, the United Nations at https://unstats.un.org/sdgs/unsdg. These data were derived from the following resources available in the public domain: the World Meteorology Organization observation database from https://space.oscar.wmo.int/; the Committee on Earth Observation Satellites EO Database from http://database.eohandbook.com/; and the Union of Concerned Scientists satellite database from https://www.ucsusa.org/resources/satellite-database.
Acknowledgement
This work was supported by the National Key Research and Development Program of China [grant number 2019YFE0126400].
Disclosure statement
No potential conflict of interest was reported by the author(s).
Additional information
Funding
References
- Aleman, A.. 2017. “Global Change Master Directory (GCMD) Keywords and Their Applications in Earth Science Data Discovery AGU Fall Meeting Abstracts.
- Anderson, Katherine, Barbara Ryan, William Sonntag, Argyro Kavvada, and Lawrence Friedl. 2017. “Earth Observation in Service of the 2030 Agenda for Sustainable Development.” Geo-spatial Information Science 20 (2): 77–96.
- Bojinski, Stephan, Michel Verstraete, Thomas C Peterson, Carolin Richter, Adrian Simmons, and Michael Zemp. 2014. “The Concept of Essential Climate Variables in Support of Climate Research, Applications, and Policy.” Bulletin of the American Meteorological Society 95 (9): 1431–1443.
- Bukhres, O., Z. B. Miled, E. Lynch, L. Olsen, and Z. Tari. 2000. “Effective Standards for Metadata in the GCMD Data Access System.” Proceedings doa'00. International Symposium on distributed objects and applications, 21-23 sept. 2000.
- Chawla, Ila, L. Karthikeyan, and Ashok K Mishra. 2020. “A Review of Remote Sensing Applications for Water Security: Quantity, Quality, and Extremes.” Journal of Hydrology 585: 124826.
- Constable, Andrew J, Daniel P Costa, Oscar Schofield, Louise Newman, Edward R UrbanJr., Elizabeth A Fulton, Jessica Melbourne-Thomas, Tosca Ballerini, Philip W Boyd, and Angelika Brandt. 2016. “Developing Priority Variables (“Ecosystem Essential Ocean Variables” — eEOVs) for Observing Dynamics and Change in Southern Ocean Ecosystems.” Journal of Marine Systems 161: 26–41.
- DiGiuseppe, Nicholas, Line C Pouchard, and Natalya F Noy. 2014. “SWEET Ontology Coverage for Earth System Sciences.” Earth Science Informatics 7 (4): 249–264.
- Eldering, A., P. O. Wennberg, D. Crisp, D. S. Schimel, M. R. Gunson, A. Chatterjee, J. Liu, F. M. Schwandner, Y. Sun, and C. W. O’dell. 2017. “The Orbiting Carbon Observatory-2 Early Science Investigations of Regional Carbon Dioxide Fluxes.” Science 358 (6360).
- Estoque, Ronald C. 2020. “A Review of the Sustainability Concept and the State of SDG Monitoring Using Remote Sensing.” Remote Sensing 12 (11): 1770.
- García, Luis, Diego Rodríguez, Marcus Wijnen, and Inge Pakulski. 2016. Earth Observation for Water Resources Management: Current use and Future Opportunities for the Water Sector. Washington, DC: World Bank Publications.
- Guerry, Anne D, Stephen Polasky, Jane Lubchenco, Rebecca Chaplin-Kramer, Gretchen C Daily, Robert Griffin, Mary Ruckelshaus, Ian J Bateman, Anantha Duraiappah, and Thomas Elmqvist. 2015. “Natural Capital and Ecosystem Services Informing Decisions: From Promise to Practice.” Proceedings of the National Academy of Sciences 112 (24): 7348–7355.
- Haase, Peter, Jonathan D. Tonkin, Stefan Stoll, Benjamin Burkharde, Mark Frenzel, Ilse R. Geijzendorffer, Christoph Haeuser, et al. 2018. “The Next Generation of Site-Based Long-Term Ecological Monitoring: Linking Essential Biodiversity Variables and Ecosystem Integrity.” Science of the Total Environment 613-614: 1376–1384. doi:10.1016/j.scitotenv.2017.08.111.
- Han, Weiguo, Liping Di, Genong Yu, Yuanzheng Shao, and Lingjun Kang. 2016. “Investigating Metrics of Geospatial web Services: The Case of a CEOS Federated Catalog Service for Earth Observation Data.” Computers & Geosciences 92: 1–8.
- Hua, Jianwen, Zhanhu Wang, Juan Duan, Libing Li, Chenjun Zhang, Xiaowei Wu, Qing Fan, Ren Chen, Xiaojie Sun, and Lianwei Zhao. 2018. “Review of Geostationary Interferometric Infrared Sounder.” Chinese Optics Letters 16 (11): 111203.
- Huadong, G. U. O. 2021a. Big Earth Data in Support of the Sustainable Development Goals (2019). Beijing: EDP Sciences.
- Huadong, G. U. O. 2021b. Big Earth Data in Support of the Sustainable Development Goals (2020). The belt and Road: EDP Sciences.
- Kallio, Kari. 2000. “Remote Sensing as a Tool for Monitoring Lake Water Quality.” Hydrological and Limnological Aspects of Lake Monitoring 14: 237.
- Keller, Richard M.. 2017. The NASA Air Traffic Management Ontology: Technical Documentation.”
- Kussul, Nataliia, Mykola Lavreniuk, Andrii Kolotii, Sergii Skakun, Olena Rakoid, and Leonid Shumilo. 2019. “A Workflow for Sustainable Development Goals Indicators Assessment Based on High-Resolution Satellite Data.” International Journal of Digital Earth 13: 309–321.
- Lehmann, Anthony, Gregory Giuliani, Nicolas Ray, Kazi Rahman, Karim C Abbaspour, Stefano Nativi, Massimo Craglia, Douglas Cripe, Philippe Quevauviller, and Martin Beniston. 2014. “Reviewing Innovative Earth Observation Solutions for Filling Science-Policy Gaps in Hydrology.” Journal of Hydrology 518: 267–277.
- Lehmann, Anthony, Joan Masò, Stefano Nativi, and Gregory Giuliani. 2020. Towards Integrated Essential Variables for Sustainability. Vol. 13, 158–165. Taylor & Francis.
- Lehmann, Anthony, Stefano Nativi, Paolo Mazzetti, Joan Maso, Ivette Serral, Daniel Spengler, Aidin Niamir, Ian McCallum, Pierre Lacroix, and Petros Patias. 2020. “GEOEssential – Mainstreaming Workflows from Data Sources to Environment Policy Indicators with Essential Variables.” International Journal of Digital Earth 13 (2): 322–338.
- Lewis, Mike, Yinhan Liu, Naman Goyal, Marjan Ghazvininejad, Abdelrahman Mohamed, Omer Levy, Ves Stoyanov, and Luke Zettlemoyer. 2019. “Bart: Denoising Sequence-to-Sequence pre-Training for Natural Language Generation, Translation, and Comprehension.” arXiv Preprint ArXiv:1910.13461.
- Masó, Joan, Ivette Serral, Cristina Domingo-Marimon, and Alaitz Zabala. 2020. “Earth Observations for Sustainable Development Goals Monitoring Based on Essential Variables and Driver-Pressure-State-Impact-Response Indicators.” International Journal of Digital Earth 13 (2): 217–235.
- Matthews, Mark William. 2011. “A Current Review of Empirical Procedures of Remote Sensing in Inland and Near-Coastal Transitional Waters.” International Journal of Remote Sensing 32 (21): 6855–6899.
- Miranda Espinosa, Maria Teresa, Gregory Giuliani, and Nicolas Ray. 2020. “Reviewing the discoverability and accessibility to data and information products linked to Essential Climate Variables.” International Journal of Digital Earth 13 (2): 236–252.
- Nativi, Stefano, Mattia Santoro, Gregory Giuliani, and Paolo Mazzetti. 2019. “Towards a Knowledge Base to Support Global Change Policy Goals.” International Journal of Digital Earth 13 (2): 188–216.
- Oscar, WMO. 2019. OSCAR Observing Systems Capability Analysis and Review Tool.
- Paganini, M., I. Petiteville, S. Ward, G. Dyke, M. Steventon, J. Harry, and Flora Kerblat. 2018. Satellite Earth Observations in Support of the Sustainable Development Goals.” The CEOS Earth Observation Handbook.
- Pettorelli, Nathalie, Martin Wegmann, Andrew Skidmore, Sander Mücher, Terence P Dawson, Miguel Fernandez, Richard Lucas, Michael E Schaepman, Tiejun Wang, and Brian O'Connor. 2016. “Framing the Concept of Satellite Remote Sensing Essential Biodiversity Variables: Challenges and Future Directions.” Remote Sensing in Ecology and Conservation 2 (3): 122–131.
- Rajagopalan, Sanjay, Sadeer G Al-Kindi, and Robert D Brook. 2018. “Air Pollution and Cardiovascular Disease.” Journal of the American College of Cardiology 72 (17): 2054–2070.
- Raskin, R. G.. 2010. “SWEET 2.1 Ontologies AGU Fall Meeting Abstracts.
- Reubelt, Tilo, Nico Sneeuw, and M. A. Sharifi. 2010. “ Gravity, Geoid and Earth Observation pp 163–170Cite as Future Mission Design Options for Spatio-Temporal Geopotential Recovery Gravity, Geoid and Earth Observation.
- Rovetto, Robert J. 2016a. “An Ontological Architecture for Orbital Debris Data.” Earth Science Informatics 9 (1): 67–82.
- Rovetto, Robert J.. 2016b. “The Orbital Space Environment and Space Situational Awareness Domain Ontology–Towards an International Information System for Space Data Proceedings of the Advanced Maui Optical and Space Surveillance Technologies Conference.Wailea, Maui, Hawaii, 2016.
- Rovetto, Robert J.. 2017. “Ontology for Europe's Space Situational Awareness Program 7th European Conference on Space Debris .
- Rovetto, Robert John, and T. S. Kelso. 2016. “Preliminaries of a Space Situational Awareness Ontology.” arXiv Preprint ArXiv:1606.01924.
- Sabia, Roberto, Diego Fernández-Prieto, Jamie Shutler, Craig Donlon, Peter Land, and Nicolas Reul. 2015. “Remote Sensing of Surface Ocean PH Exploiting sea Surface Salinity Satellite Observations.” 2015 IEEE International Geoscience and Remote sensing Symposium (IGARSS).
- Selva, D., and E. F. Crawley. 2013. “VASSAR: Value Assessment of System Architectures Using Rules.” 2013 IEEE Aerospace conference, 2-9 march 2013.
- Sun, Qingyang, Danling Tang, and Sufen Wang. 2012. “Remote-sensing Observations Relevant to Ocean Acidification.” International Journal of Remote Sensing 33 (23): 7542–7558.
- UN. 2015. Transforming Our World: The 2030 Agenda for Sustainable Development. New York: UN General Assembly.
- Walsh, Patrick Paul, Enda Murphy, and David Horan. 2020. “The Role of Science, Technology and Innovation in the UN 2030 Agenda.” Technological Forecasting and Social Change 154: 119957.
- Williams, Adina, Nikita Nangia, and Samuel R Bowman. 2017. “A Broad-Coverage Challenge Corpus for Sentence Understanding Through Inference.” arXiv Preprint ArXiv:1704.05426.
- Zhang, Zhonghua, Lu Xi, Su Bin, Zhao Yuhuan, Wang Song, Liu Ya, Li Hao, Zhang Yongfeng, Ahmad Ashfaq, and Shi Guang. 2019. “Energy, CO2 Emissions, and Value Added Flows Embodied in the International Trade of the BRICS Group: A Comprehensive Assessment.” Renewable and Sustainable Energy Reviews 116: 109432.