
 ?Mathematical formulae have been encoded as MathML and are displayed in this HTML version using MathJax in order to improve their display. Uncheck the box to turn MathJax off. This feature requires Javascript. Click on a formula to zoom.
Abstract
Urban Functional Zones (UFZs) can be identified by measuring the spatiotemporal patterns of activities that occur within them. Geosocial media data possesses abundant spatial and temporal information for activity mining. Identifying UFZs from geosocial media data aids urban planning, infrastructure, resource allocation, and transportation modernization in the complex urban system. In this work, we proposed an integrated approach by combining the spatiotemporal clustering method with a machine learning classifier. The spatiotemporal clustering method was used to mine the spatiotemporal patterns of activities, of which the distinctive features were extracted as inputs into a machine learning classifier for UFZ identification. The results show that more than 80% of the UFZs can be correctly identified by our proposed method. It reveals that this work serves as a functional groundwork for future studies, facilitating the understanding of urban systems as well as promoting sustainable urban development.
1. Introduction
The success of urban growth and functionality heavily depends on how residents interact with their surroundings; however, the explanation of Urban Functional Zones (UFZs) has varied in previous research. Berry (Citation1968) identified UFZs as the interconnection within areas through the distribution of activities and by flows of commodities between zones. Goddard (Citation1970) defined UFZs by the strong indications of interdependence or internal bonds identified by the activities that generally occur inside. Karlsson et al. (Citation2007) identified the UFZs by measuring the economic activities and intra-regional transportation infrastructure that existed within the region, and the modes of transport of interconnection that existed between regions. Yuan et al. (Citation2015) defined the UFZs as the areas developed to meet specific socioeconomic needs. Overall, the researchers characterize UFZs by their activity characteristics and zoning characteristics. The activity characteristics are used to identify the zone functions, while the zoning characteristics are used to define the zone boundaries. Appropriately identifying UFZs is vital for urban planning, infrastructure, resource allocation, and transportation modernization as cities expand and grow in population, promoting the coupling of the man-land system and the sustainable development of the city.
Social media platforms, such as Twitter, Weibo, Facebook, etc., have turned the general population into producers of data with the advanced development of mobile devices (Li, Wachowicz, and Fan Citation2021; Wen and Li Citation2021). In other words, the simplicity of posting a geolocated social media message anytime and anywhere facilitates the creation of geosocial media data, also termed geotagged social media data. This enables average citizens to produce geographic data in abundance. In addition, the harvesting of geosocial media data has also been made accessible by the developers of social media networks and web applications. The widespread coverage, simplicity of collection, and accessibility to geographic coordinates makes the use of geosocial media data quite advantageous for urban spatiotemporal analysis, as compared with other sources of data (e.g. remotely sensed data, point of interest (POI) data). Specifically, Twitter has provided Application Programming Interfaces (API), allowing users to gather tweets at varying service levels1. For instance, an Academic Research Product Track API provides unbiased data, while an Enterprise API, which is a paid service, allows the collection of tweets about a specific topic. Owing to the abundant spatial and temporal features embedded in tweets, Twitter data has been widely used for spatiotemporal pattern detection (Cheng and Wicks Citation2014; Liu and Long Citation2016; Shi and Pun-Cheng Citation2019; Black and Wachowicz Citation2021; Sha et al. Citation2021), which in turn allows for meaningful observations concerning UFZ identification.
In this work, we identified UFZs from the spatiotemporal perspective by exploring tweeting patterns as a proxy for human movement, taking advantage of geosocial media data and considering the definitions of UFZ based on patterns of activities within zones. First, the study area was partitioned into some spatial units indicating UFZ boundaries by introducing a morphological vector processing (MVP) method. Compared to the official land use map, each spatial unit was annotated with a land use type, which was then used as the ground truth for validating the UFZ identification results. Subsequently, the spatiotemporal patterns of activities occurring in a spatial unit were measured by conducting spatiotemporal clustering analysis using Twitter data, resulting in a set of spatiotemporal clusters. The statistical attributes of those clusters were computed to extract distinctive features, which were further imported to the machine learning-based classifier to identify UFZs. Finally, the classification results were quantitatively evaluated by comparing them with the aforementioned annotation labels.
Section 2 summarizes the related work based on the processing steps involved. Section 3 introduces the overall framework of our proposed method and the specific methods used in each subsection. The UFZ identification results are illustrated and discussed in Section 4. Finally, a few significant conclusions as well as some future work are drawn in Section 5.
2. Related work
As indicated in the previous section, the definition of UFZs differs from study to study. Some studies recognize UFZs through measuring the patterns of activities occurring within the regions, while others define UFZs as the regions involving inter-zonal and intra-zonal communications. Among those studies, zoning plays a critical role in UFZ identification, which mainly focuses on how to partition the urban area into a number of spatial units where diverse socioeconomic activities (e.g. commercial, industrial, and educational activities) take place. As such, UFZs refer to the spatial units where human activities occur and provide the basic units for urban planning, urban management, and resource allocation (Liu et al. Citation2020; Zhang, Du, and Zheng Citation2020).
Taking spatial layouts and urban functions into account, UFZs organize the complex urban system to guarantee interconnection between zones as well as avoid interference among different spatial units, which is key for sustainable urban planning. As such, properly identifying UFZs aids urban development in the long term, providing support for urban studies. The absence of proper UFZ identification may result in a series of urban problems, such as the increase in transportation complexity and construction cost and the decrease in urban sanitation.
Based on the assumption that UFZs can be identified through mining the spatiotemporal patterns of activities that occur within urban zones in this work, we reviewed the relevant studies organized by three aspects, namely data sources, spatial segmentation, activity pattern mining, and UFZ identification and classification, which forms the general process of UFZ identification.
Urban cadastral data and thematic maps were first used for urban functional zone identification (Gu, Chen, and Yang Citation2011). These typically require high labor costs and tend to be less efficient. Remote sensing data has been applied for urban studies for a long time, where urban land cover data was analyzed by retrieving the physical features such as shape, spectrum and texture of the ground objects in the images (Zhang et al. Citation2022; Du et al. Citation2021; Zhang et al. Citation2018). However, the socioeconomic characteristics of urban regions cannot be obtained from those features of remote sensing images. As big data emerges, cell phone data, street view data, trajectory data, social media data, and point of interest (POI) data provide new sights for UFZ studies (Zhang et al. Citation2018; Tu et al. Citation2018; Feng et al. Citation2021). Street view data and POI data are usually used to capture static elements in the urban space, while cell phone data, trajectory data and geosocial media data can be collected in the continuous stream, reflecting urban dynamics and more aligning with the urban updates. Compared with cell phone data and trajectory data, which are usually owned by service providers and are not open to the public, geosocial media data can be accessed through open APIs as indicated at the beginning of this paper. Moreover, among those big data-based UFZ studies, few studies adopted geosocial media data as a single data source, only accounting for 0.98% of all the reviewed literature up to 2021 (Liu et al. Citation2021). To investigate whether this fresh data source is robust for UFZ studies, we conducted an exploratory study by validating the capability and efficiency of geosocial media data for UFZ identification by comparing it with the ground truth.
The spatial segmentation methods mainly include grid-based segmentation, road network-based segmentation, and data-based segmentation (Huang et al. Citation2021). The grid-based segmentation method provides more granular results, as the segmented spatial units are generally smaller than those from other segmentation methods. Grid cell resolution ranges from 30 m per pixel (Meng, Hou, and Xing Citation2017) to 200 m per pixel (Zhan, Ukkusuri, and Zhu Citation2014; Toole et al. Citation2012) or 10 km per pixel (Jongman et al. Citation2015). The road network-based segmentation method mainly includes defining segment boundaries from city-designated transportation zones (García-Palomares et al. Citation2018) or mapped road segments (Hu et al. Citation2016; Liu and Long Citation2016). The data-based segmentation utilizes properties or patterns embedded in the data to segment the study area. For instance, Frias-Martinez and Frias-Martinez (Citation2014) employed the Self-Organizing Map (SOM) neural network to identify artificial points of interest, around which Voronoi polygons were created. Earle et al. (Citation2010) employed a segmentation and clustering process whereby circles of varying radii were drawn around earthquake locations. Since the ground truth data used in this work are road segment-based, we applied the road network-based segmentation method for partitioning the study area into some spatial units to maintain validation consistency.
Mining the spatiotemporal patterns of activities occurring in UFZs often involves spatiotemporal clustering methods, which generally apply probability theories to identify the most probable cluster for each data point (Shi and Pun-Cheng Citation2019). Some spatiotemporal clustering methods are the extension of the conventional clustering methods, such as Kernel Density Estimation (KDE) and Density-Based Spatial Clustering of Applications with Noise (DBSCAN). Wei et al. (Citation2018) regarded spatial attribute and temporal attribute as two dimensions, and estimated space and time kernel density separately to explore the foodscape exposure using GPS trajectories. Lee, Gong, and Li (Citation2017) standardized the data in space and time to integrate them with the same kernel function to explore spatiotemporal clusters of crime events in Akron, Ohio. The ST-DBSCAN method combined with the semantic analysis method was adopted to detect the location, time, and content of local events (Xu, Li, and Huang Citation2020) and traffic events (Xu et al. Citation2022) from Twitter data. Similarly, ST-DBSCAN was used to characterize crisis events from Twitter data during major natural disasters (Kersten and Klan Citation2020). Farnaghi, Ghaemi, and Mansourian (Citation2020) further improved the standard ST-DBSCAN to make it able to handle the dynamic spatiotemporal tweet mining for event extraction. A case study of monitoring the hurricane Florence event evolution in September 2018 showed promising results.
The Space–Time Scan Statistics (STSS) method is a hypothesis testing-based method that has been typically used for spatiotemporal clustering. It was primarily developed to detect and identify significant disease clusters from those that occurred by chance (Kulldorff et al. Citation1998). The statistically significant clusters were identified based on the location and time of reported cases. This method has been expanded beyond epidemiological applications, more recently being applied to social media data. Cheng and Wicks (Citation2014) identified the detected clusters from STSS as representing the helicopter accidents that occurred in an urban area by measuring the spatiotemporal patterns of Twitter data. This well demonstrates that the STSS method provides an effective way to discover the spatiotemporal activity patterns reflected by geosocial media data within a zone, aligning with the above definition of UFZs made by Karlsson et al. (Citation2007) and Yuan, Zheng, and Xie (Citation2012). Compared with the partition clustering methods (e.g. ST-DBSCAN and KDE) which mainly focus on identifying whether data belongs to a cluster or noise by determining the data similarity, the hypothesis testing-based STSS method extracts the clusters with the highest statistical probability in each spatial unit, which are more likely to generate useful features to differentiate UFZs (Shi and Pun-Cheng Citation2019). Moreover, it has been reported that the STSS method gains higher precision in identifying local clusters that have small geographical or population sizes (Linton et al. Citation2014). Finally, to the best of our knowledge, the STSS method, as a viable option, has not been explored in UFZ studies; therefore, we tried the STSS method for spatiotemporal activity mining, which is further used as a distinctive feature for UFZ analysis.
A variety of methods have been used for UFZ identification from the perspective of remote sensing image analysis, human mobility pattern recognition, urban morphology effect, machine learning-based classification, and natural language processing (NLP). Zhang et al. (Citation2018) aggregated the physical features and spatial patterns of ground objects observed in geoscenes to extract UFZs at multiple scales from very-high-resolution (VHR) satellite images. Zhang et al. (Citation2022) introduced deep learning methods and proposed a novel Distance Weight-Graph Attention Model for mining the spatial relationship of urban land cover from remote sensing images to identify multi-scale functional zones. Human mobility patterns represented by when and where people come and leave act as another term that contributes to identifying the function of a region, e.g. residential area and working area. Trajectory data (e.g. taxi trajectories and shared bike trajectories) and POI data have been incorporated to generate effective representations (e.g. co-occurrence of origins and destinations, departure/arrival location and time) for human mobility modeling, aiding urban function understanding with common knowledge (Yuan et al. Citation2015; Yao et al. Citation2018; Du et al. Citation2020). Urban morphology affects land surface temperature, which varies among diverse UFZs (Huang and Wang Citation2019; Gao et al. Citation2020). For instance, it reveals that the residential zone constitutes the largest heat source, whereas the highest land surface temperature is located in the commercial and industrial zones (Huang and Wang Citation2019). This data is further integrated with the three-level urban morphological features (i.e. building, road, and region) and the land surface temperature features extracted from thermal infrared remote sensing data for UFZ classification (Li et al. Citation2022).
With regard to applying classification methods for UFZ identification, (Zhan, Ukkusuri, and Zhu Citation2014) compared the UFZ classification results of unsupervised methods (i.e. K-means clustering) and supervised methods (i.e. Naïve Bayes, Support Vector Machine, and Random Forest), and found that the supervised methods had better performance and were able to adapt to the dynamics or changes within the city. In addition, Jiang et al. (Citation2015) conducted a similar comparison study, where the Random Forest method and Instance-based K-nearest neighbor classification method (also known as IBK, where k = 1) held the highest performance with Kappa coefficient statistics in the range of 75% to 86% depending on the classification scheme. The IBK method with only one nearest neighbor is more susceptible to predictive bias. The Random Forest method overcomes the issue of predictive bias by incorporating an uncorrelated set of decision trees, which are formulated to reduce the smallest mean squared errors. Urban functions correlate with each other in space and time with certain patterns, which is similar to the way that words and sentences are organized in natural language. Thus, several NLP techniques, e.g. tf-idf (Du et al. Citation2020), LDA (Yuan et al. Citation2015), word2vec (Yao et al. Citation2017), have been applied to address the UFZ identification as a language processing problem. POI was commonly used among those studies, where a single POI was regarded as a word and a spatial unit enclosing the POI was regarded as a sentence. The context indicated by words and sentences was investigated to reflect the correlation patterns between POIs and UFZs, assisting UFZ identification and classification. Considering the data source used and integration of spatiotemporal activity pattern effect on UFZs, we adopted the Random Forest method taking the multiple spatiotemporal features extracted by the STSS method as input for UFZ classification.
Based on the review of the relevant studies above, we selected the road network-based segmentation method for spatial segmentation, the STSS method for mining activity patterns from geosocial media data, and the Random Forest method for UFZ classification in this work.
3. Methodology
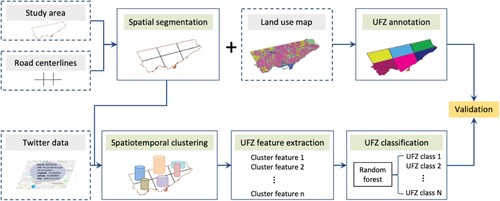
illustrates our framework for identifying UFZs by measuring the spatiotemporal patterns of geosocial media data. The rectangles in grey represent the data input in this work, the rectangles in green represent the processing steps, and the rectangle in yellow represents the performance validation.
Figure 1. The overall process of identifying UFZs by measuring the spatiotemporal patterns of geosocial media data.
3.1 Spatial segmentation and UFZ annotation
The study area was partitioned based on the road network, obtaining spatial units segmented by the road centerlines of all transportation infrastructure within the area. Those centerlines usually include streets, major roads, walkways, highways, rivers, water boundaries, as well as administrative boundaries. The segmentation follows the rules that were outlined in Section 1, i.e. the UFZ boundaries are defined by the existing intra-regional transportation structure (Karlsson et al. Citation2007). The existing transportation network was used to divide the study area into segments, maintaining the internal bonds within functional zones (Goddard Citation1970) in addition to infrastructure representing a flow of commodities used as UFZ boundaries (Berry Citation1968). As such, city infrastructure was separated into two categories based on vehicle traffic volume: (1) inter-zonal infrastructure with high vehicle traffic volume, which was used to create UFZ boundaries, and (2) intra-zonal infrastructure with low vehicle traffic volume. More details are described in .
Table 1. Urban roads and physical features categorized.
The roads with the highest traffic volumes, such as expressways, are often represented by multiple parallel line segments that create redundant polygons. In addition, ramps and other features with short line segments also create small polygons that can be merged with larger neighboring polygons. To reduce the redundant polygons, we further processed the Category 1 infrastructure before segmentation. Morphological image processing (Yuan, Zheng, and Xie Citation2012) has been used as a method for segmentation. Morphological vector processing (MVP) method, adapted from morphological image processing, is proposed in this work to deal with the transportation infrastructure data in vector format, including road dilation, road thinning, and road simplification.
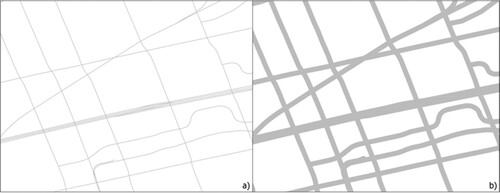
Dilation is a morphological image process whereby breaks and intrusions in an image are eliminated (Goyal Citation2011). Increasing the degree of dilation results in parallel road line segments appearing as a single, thick line with low spatial resolution. This process is replicated as vector processing using buffer analysis by defining a buffer distance. The buffer distance was chosen to be wide enough so that parallel line segments representing the same road would dissolve into each other, but not too much to avoid dissolving line segments from different roads. Any buffer distance that abides by this rule is appropriate. shows the vector-based diluting effect on the Category 1 line segments. In (a), an expressway is represented by several lines, while it was diluted into a single line in (b) after the dissolved buffer operation.
Figure 2. An example showing road dilation.
The thinning process returns the thickened line segments into thin lines with a negligible width, thus reducing the proportion of the study area that is occupied by UFZ boundaries. The goal of the thinning process is to derive the medial axis of the diluted roads. This was achieved by manipulating Thiessen polygons using tools provided by most geographical information systems (GIS) software such as ArcGIS. An interval was set to generate some seeding points along the diluted roads, so that the curvature of each road was captured with an abundance of straight-line segments (see ). By removing the lines that were perpendicular to the medial axis and intersected with the interior polygons, the left lines were used to compose the medial axis of roads ( (a)).
Figure 3. Seeding points along the dilated roads, used to create Thiessen polygons.
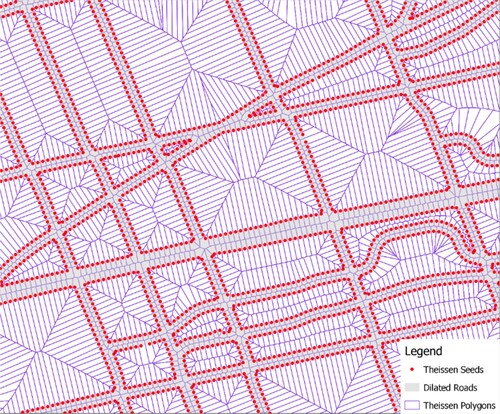
Figure 4. An example showing the diluted road and the medial axis: a) after the thinning process and b) after the simplification process.
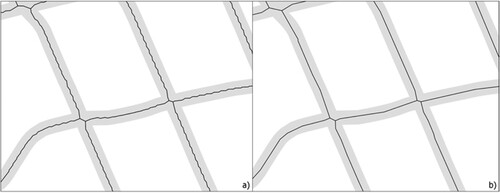
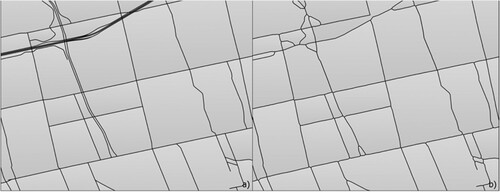
The medial axis line segments derived from the Thiessen polygons were a jagged representation of Category 1 roads. A more representative depiction of the medial axis line segments was achieved through the vector simplification process, specifically using the Douglas-Peucker algorithm (Douglas and Peucker Citation1973). A digital line segment may be represented by several nodes; however, for study area segmentation, lines with fewer nodes were sufficient to divide the study area with lines representing city roads. A single input is required for the Douglas-Peucker algorithm, which defines a threshold tolerance and which is ultimately the degree of simplification. The threshold tolerance value is equal to the minimum distance between two nodes. This algorithm then removes nodes if the distance between the two nodes is less than the threshold tolerance value. shows an example before and after the simplification process, where jagged lines become smooth lines. Finally, the study area was segmented into a set of spatial units enclosed by the simplified road lines by integrating urban road urban transportation infrastructure data with the MVP method. demonstrates the difference in segmentation with and without MVP. A major advantage of the MVP is that the small segments were effectively merged with larger neighboring segments, reducing the redundancy of spatial segmentation.
Figure 5. An example showing the study area segmented: a) without MVP method and b) with MVP method.
To provide ground truth for validating the UFZ classification results in Section 3.5, the function of each segmented spatial unit (i.e. a UFZ) was labeled by referring to the land use type that covers the most area on the land use map (Calegari et al. Citation2015). This is based on the assumption that the areas where various activities occur correlate to the high-level zoning types within the city. For instance, shopping may occur in a commercial zone, whereas one may attend a lecture in an institutional zone.
3.2 Spatiotemporal clustering
Twitter data was collected through the Twitter streaming API, crawling at most 1% of all the real-time tweets that meet user-defined parameters for free (Huang, Fan, and Zipf Citation2017; Morstatter et al. Citation2013). In this work, we obtained Twitter streams by defining a bounding box enclosing the study area. The Twitter data were returned if their tagged coordinates (i.e. longitude and latitude) fell in the bounding box or tagged places (e.g. points of interest) referring to geographical polygons intersected with the bounding box. To conduct the point-based spatiotemporal clustering analysis, those Twitter data tagged with places or representative coordinates were not included in the collected data, leaving only the Twitter data tagged with a pair of geo-coordinates as input.
Based on the definition in Section 1 that a UFZ can be identified by the patterns of activities that occur within them, the Space–Time Scan Statistics (STSS) method, which was primarily developed to detect and identify significant disease clusters from those that occurred by chance (Kulldorff et al. Citation1998), was adopted to explore activity patterns in this work.
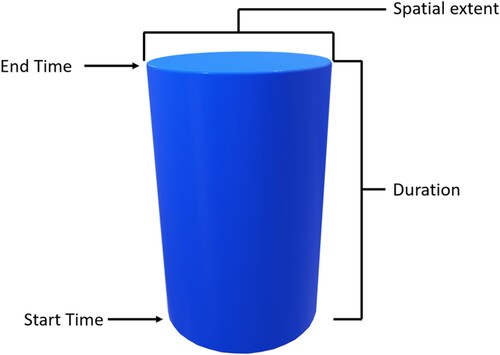
A cylindrical search window of variable base radius and height was passed over the study area and study duration, where the base represents a circular search area, and the height represents the search duration as shown in . The group of cases observed in each cylinder represents a possible cluster. If the number of cases observed inside the cylinder exceeds the calculated expected number of cases, the cylinder is deemed the most likely cluster. In this study, an individual tweet was treated as a case, and the most likely clusters were determined by comparing the expected number of tweets in a cylinder with the observed number of tweets.
Figure 6. An STSS search cylinder that represents a potential cluster.
The estimated number of tweets μzt at location z and at time t is determined as a proportion of the total number of tweets (i.e. C) in the dataset. The marginal distributions of the tweets at location z (denoted by and time t (denoted by
, where czt represents a tweet, were divided by the total number of tweets. The estimated number of tweets is denoted as follows:
(1)
(1) Since a cylinder (A) may contain multiple locations based on the radius and varying heights based on the duration, the estimated number of tweets in a cylinder is the sum of all estimated tweets at z and t inside the cylinder, denoted as follows:
(2)
(2) The observed number of tweets in a cylinder, cA, is assumed to be Poisson distributed. The statistical significance of each cylinder is determined by calculating the Poisson Generalized Likelihood Ratio (PGLR), denoted as follows:
(3)
(3) The cluster A at z and t with the maximum PGLR is considered as a significant ‘event’. In other words, the statistical significance of tweets measured by STSS corresponds to events. Those events indicate the spatiotemporal parameters of activities occurring, which are further used as characteristic features for UFZ identification and classification. In order to overcome the challenge of evaluating the PGLR for an extremely large number of cylinders, a large number of random permutations of radius and height were selected for each location while maintaining the
marginals. As a result, some statistically significant clusters with descriptive attributes (e.g. location, start time, end time and the number of tweets contained) in each spatial unit were obtained, defining the activity patterns that indicate the characteristics of UFZs.
3.3 UFZ feature extraction
Feature extraction aims to extract the representative attributes of the detected spatiotemporal clusters, maximizing the variance among functional zone classes, based on which the classifier in Section 3.4 is trained to identify UFZs. In this work, those features refer to the summary statistics of the spatiotemporal clusters, which consists of the mean, minimum, maximum, first quartile, median (or second quartile), third quartile, interquartile range, and standard deviation of both the original output of STSS algorithm and the derived attributes. The original attributes include but are not limited to Radius (R), start time (ST), end time (ET), and observed number of tweets (OT). outlines the derived attributes and their computation.
Table 2. Derived attributes of spatiotemporal clusters.
3.4 UFZ classification
Before performing data classification, it is important to investigate the distribution of classes in the dataset, to eliminate any precursors to overfitting or under-fitting. This problem is resolved by balancing the classes in the dataset. Several methods have been proposed to overcome this challenge including (1) collecting more data, (2) duplicating underrepresented classes, (3) removing examples of overrepresented classes from the dataset, and (4) adding examples to the underrepresented dataset(More Citation2016). Since the study area is already defined, collecting more data (i.e. adding more spatial units to the study area) is not feasible. Duplication of underrepresented classes makes a classifier more prone to overfitting, as attribute values would have to match the duplicated examples more closely to be correctly labeled as an underrepresented class. In addition, removing examples means that the classifier will be less robust and may incorrectly classify UFZs, which may have outlier attributes. For these reasons, the method of adding additional data points was chosen. This was done by implementing the Synthetic Minority Oversampling Technique (SMOTE) (Chawla et al. Citation2002), which is among the most frequently used oversampling techniques in data science (Mansourifar and Shi Citation2020). For each data point in a minority class, the SMOTE algorithm calculates the distance between the selected point and a nearest neighbor data point. A random value between 0 and 1 is multiplied by the distance and added to the original data point, creating a new, synthetic data point.
After the data resampling was performed by the SMOTE algorithm, the features generated in Section 3.3 were imported into a supervised Random Forest classifier for UFZ classification. A set of annotated spatial units were used for training the classifier, and the UFZ class of the remaining spatial units was subsequently predicted. The exact proportion of the training dataset can be adjusted iteratively if required, based on the accuracy assessment of the classifier. To train the classifier, the Random Forest method incorporates an uncorrelated set of decision trees, each of which recursively evaluates the attributes of each data point to determine the best attribute to split the data into branches, quantified by the smallest mean squared errors. This process is repeated until the data point can be identified as a unique class. The following hyperparameters were available to tune with the Scikit Learn Python module and were used for the classifier:
Maximum depth: None
Minimum samples required to split an internal node: 2
Maximum leaf nodes: None
Minimum samples in a leaf: 2
Number of trees in the random forest: 100
Maximum samples in an individual tree: None
Maximum features provided to a tree: None
Method for sampling data points: bootstrap
Criterion: Gini impurity
3.5 Validation
We compared the UFZ classification results with the annotated ground truth based on the land use map in Section 3.1 to validate the performance of our proposed method. K-fold cross-validation was performed to verify the performance of the classifier. This method divides the training dataset into k smaller datasets. It then divides each small dataset into k subsets again and uses k-1 of those subsets as a training set and the remaining subset as a testing set. A confusion matrix is usually adopted as an effective method to quantitatively reveal the performance of the classification. The true positive (tp), true negative (tn), false positive (fp), and false negative (fn) are the four elements composing the confusion matrix. Metrics such as accuracy, precision, recall, and F1-score, can be calculated for quantitative validation.
The accuracy can be misleading when evaluating an imbalanced dataset. For example, a binary class dataset with a 90%−10% class distribution achieves a prediction accuracy of 90% if all the majority classes making up the 90% of all datasets are correctly predicted. In this case, the prediction accuracy for the majority class would be 100%, while the accuracy for the minority class would be 0%, meaning the accuracy is not an effective metric for results validation regarding the unbalanced dataset. The same principle applies to evaluating multi-class datasets in our work. In order to investigate the effect of the SMOTE resampling method on UFZ classification as well as the performance of classification results, the remaining three metrics, i.e. precision, recall and F1-score, were selected to maintain consistency in this work.
Precision measures the number of true positive predictions divided by the number of all positive predictions, which is also known as the positive predictive value. It is an indicator of the validity of the results. It can be calculated as follows:
(4)
(4) Recall measures the number of true positive predictions divided by the number of true positive predictions and false-negative predictions, which is also known as the sensitivity and is a measure of the completeness of the predicted results. It can be calculated as follows:
(5)
(5) The F1-score is the harmonic mean of the precision and recall and is calculated as follows:
(6)
(6)
4. Results
4.1 Segmented and annotated spatial units
A case study was conducted in Toronto, Canada for this work. Based on the road centerlines collected from the City of Toronto Open Data Portal2, 2,900 spatial units were obtained. A buffer of 30 meters was defined by referring to the average width of Category 1 roads in Toronto to perform the road dilation, followed by the road thinning was conducted in ArcGIS extracting the medial axis of roads represented by jagged lines. If the distance between the neighboring nodes along the jagged lines was less than 10 meters, those nodes were removed for road simplification, turning jagged lines into smooth lines. The threshold value was selected to strike a balance between maintaining the general area of the segments, while smoothing out the irregularities in the road line segments derived from Thiessen polygons during the thinning process. After adopting the above three steps of the MVP process, 1,285 spatial units remained, showing a decrease of 56%, most of which were small redundant segments.
The Toronto land use map was downloaded from the City of Toronto Zoning By-laws3, which defines two-level land use types, including 10 high-level types and 27 low-level types (). Following the principle that the function of each UFZ is represented by the land use type covering the most area of the spatial unit, the functions of UFZs acted as the ground truth for validation are visualized in .
Figure 7. a) A subsection of the segmented study area, b) City of Toronto zoning polygons categorized by the high-level land use types, and c) annotated UFZs with the high-level land use types.
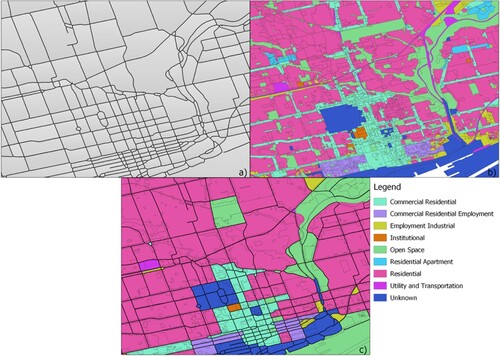
Table 3. Toronto land use types.
4.2 Spatiotemporal clusters
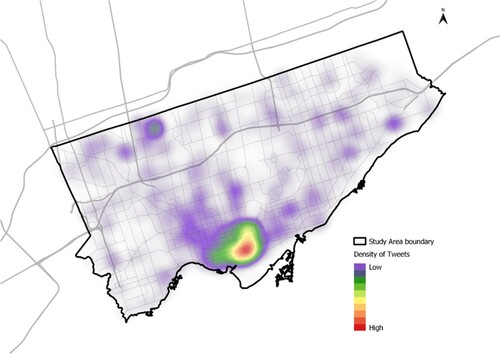
Toronto is a typical modern metropolis, which ranks first and fourth in Canada and North America, respectively, when sorted by population. People commonly share on social media platforms. Twitter data was collected through the Streaming API in May 2014 in Toronto, Canada. There were 76,131 tweets from 13906 unique users. The number of tweets per user ranged from 1 to 3801 tweets throughout the month. There are undoubtedly accounts that automatically generate an abundant amount of tweets, otherwise known as ‘bots’. These bots were not removed for this study as the tweeting patterns from bots are different from humans and can provide patterns unique to certain UFZs. For example, the presence of bots may be more prevalent in commercial areas, thus resulting in tweeting patterns that can identify that UFZ. The spatial distribution of the collected tweets is shown in . The area in red is located downtown, which is the busiest area in Toronto.
Figure 8. Distribution of tweets in Toronto, Canada.
The STSS method was used to generate spatiotemporal clusters using the freely-accessed SATScan software4. To run the software, a parameter file was created, and parameters were set, as shown in . Specifically, the spatial window was limited to 50% of the area of a spatial unit, aligning with the original study that anything larger than 50% of the area would not represent a cluster alarm (Kulldorff et al. Citation1998). It indicates that a cylinder with a radius larger than 50% of the spatial unit is not likely to be a significant or characteristic event for identifying UFZs. The temporal window was limited to 7 days, namely 22.6% of the duration of the dataset (one month), since a characteristic event seldom lasts more than 7 days. This time constraint eliminates possible outlier events that may occur within a UFZ but may not be characteristic of all UFZs with the same function. For example, the Summerlicious and Winterlicous festivals run for several weeks in Toronto, but only occur once a year. These may be detected by the STSS algorithm as significant clusters or ‘events’ and may fall into the ‘commercial’ UFZ class, but these clusters would not be characteristic of all commercial zones. In this case, they would be considered outlier clusters.
Table 4. The parameter settings in the SATScan software.
After running the SATScan software for each spatial unit through Windows batch processing, it returned the relevant attributes of the detected spatiotemporal clusters, including the Twitter IDs included in a cluster, the cluster center denoted as X and Y, the radius, start date, end date, and the probability that the cluster is a significant cluster denoted by P value. The statistical significance was determined at the 0.05 confidence level by default. depicts a two-dimensional representation of detected spatiotemporal clusters within a single zone.
Figure 9. An example of clusters obtained by the STSS algorithm within a single segmented area.
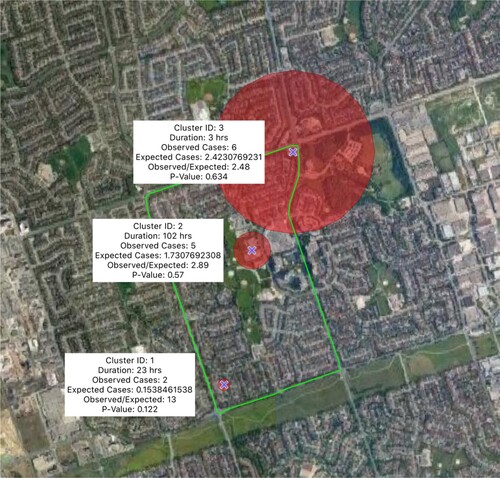
The circles represent the spatial extent of the search area (the base of the cluster cylinder). The third dimension is represented by the corresponding duration of each cluster. The associated text description of each cluster reveals the duration, the number of cases (i.e. tweets), the number of expected cases, the ratio of observed tweets over expected tweets, and the P-value. Note that while all cluster centers must be within the bounds of the segmented area, the spatial coverage of the cluster may extend beyond the segment boundary.
4.3 UFZ classification results
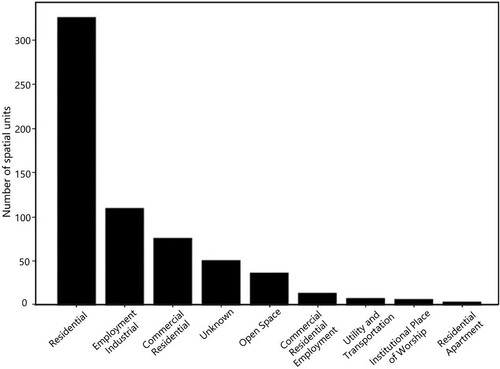
The UFZ features were extracted by integrating the original attributes and the derived attributes of the above-detected spatiotemporal clusters. Before importing those features into the Random Forest classifier for the supervised classification to identify UFZs, we first investigated the distribution of UFZ classes to be predicted by referring to the annotated land use types. reveals the class imbalance – Residential and Employment Industrial are significantly more prevalent across the study area, while Utility and Transportation, Institutional Place of Worship, and Residential Apartment are significantly less. Classes with fewer than 10 examples were not included in the classification, as there is no feasible way to avoid overfitting with such few examples. In addition, the ‘Unknown’ class was excluded from classification, since there is likely no characteristic pattern to be found in this class. All other classes were represented by 20 or more spatial units, which was feasible for classification with resampling based on SMOTE method. The resampling process was implemented through the Python imblearn5 module and was applied to the training dataset.
Figure 10. The distribution of UFZ classes.
The Scikit Learn Python module was used to implement the Random Forest classification in this study6. 70% of the labeled spatial units were used to train the classifier, while the remaining 30% of the spatial units in the study area were used for prediction. The training dataset was chosen to be 70% to produce a robust classifier, which is a typical value that is adopted. The UFZ classification results with and without SMOTE were all validated with the ground truth retrieved from the land use map in Section 4.1 through 10-fold cross-validation. The value of 10 was chosen, since it was empirically tested on various sizes of datasets and was proven not being susceptible to high bias or variance. The confusion matrix of the predicted and true classes is depicted in . In addition, the validation results quantified by precision, recall and F1-score, along with the results of the 10-fold cross validation are illustrated in and respectively. It demonstrates that the UFZ classification results significantly increased by around 60% with SMOTE method applied, which is essential for dealing with the class imbalance problem.
Figure 11. Confusion matrix for classification with SMOTE applied.
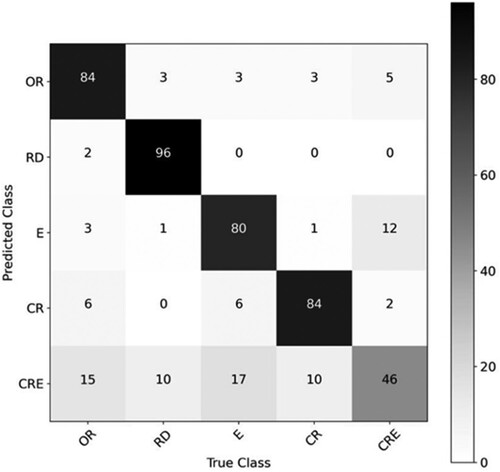
Table 5. UFZ classification results
Table 6. 10-fold cross validation results on the training dataset with SMOTE applied.
5. Discussion and conclusion
This work explores the capability of mining spatiotemporal patterns of the occurring activities from geosocial media data for characterizing UFZs. The study area was segmented based on the transportation infrastructure that complies with the definition of a functional zone that the inter-zonal boundaries represent major roads or a flow of commodities, while local roads represent the internal bonds of the zone segment. The STSS algorithm was applied to retrieve spatiotemporal clusters, representing the spatiotemporal patterns of tweets for each spatial unit. The summary statistics of those spatiotemporal clusters were calculated and used as distinctive features imported into a supervised Random Forest classifier to identify UFZs. The overfitting problem due to class imbalance was addressed through the application of the SMOTE method. By comparing the UFZ classification results with the labels annotated by referring to the official land use map, more than 80% of the UFZs were correctly identified.
The contributions of this work mainly rely on three aspects. First, the capability and efficiency of geosocial media data for UFZ identification are explored, achieving promising results by comparing with the ground truth. Although geosocial media data combined with other types of data (e.g. POI and cell phone data) has been used in a few UFZ studies, adopting it as the single data source for UFZ identification has not been investigated to the best of our knowledge. The case study conducted in Toronto, Canada using Twitter data with promising results proves our exploration in this work is insightful. Second, a general framework for spatial segmentation is proposed using Morphological Vector Processing, developed as an alternative to morphological image processing when vector data is being used. Based on this approach, urban roads were smoothed and simplified, defining boundaries for UFZs. Those redundant segments were removed, and a set of the distinct segments remained, acting as the basic spatial units for urban function analysis. Third, the STSS method is used for creating spatiotemporal clusters, of which the spatiotemporal statistical features are extracted for UFZ classification for the first try. Both the original outputs from STTS and derived attributes were used as input to train the classifier, and the UFZ classification results showed the effectiveness of those features.
Despite the achievements that have been made in this work, there still exist certain aspects that need further improvement. There exist certain bias problems concerning geosocial media data due to the user age and user preference. It is commonly believed that geosocial media sites are much more popular among younger generations, and the information witnessed by those who do not have an account or seldom post may be missed. Taking Twitter as an example, Morstatter et al. (Citation2013) investigated if the data collected through Twitter Streaming API can be used as effective samples for research purposes by conducting comparison experiments with the complete firehouse data. The results revealed that there was no significant difference between them based on statistical analysis, topical analysis, and geographic measures. Furthermore, a potential solution to the bias problem is integrating multiple sources of geosocial media data since the information missing at one site can be captured from other social media sites. In addition, future work could analyze a time series of different geosocial media datasets throughout a whole year, revealing seasonal changes in the UFZs. The outcomes presented in this work, therefore, serve as a functional groundwork for future studies in the field of urban science.
Acknowledgement
This work was supported by the Natural Sciences and Engineering Research Council of Canada [RGPIN-2017-05950], China Scholarship Council [03998521001], Beijing Categorized Development Quota Project [03082722002], and Beijing University of Civil Engineering and Architecture Young Scholars’ Research Ability Improvement Program [X21018]. The authors would like to thank Jinbo Liu and Yang Chen for their assistance in compiling and verifying references and citations. The authors also thank anonymous reviewers for their constructive comments that helped improve the manuscript.
Disclosure statement
No potential conflict of interest was reported by the author(s).
This work was supported by China Scholarship Council: [Grant Number 03998521001]; Natural Sciences and Engineering Research Council of Canada: [Grant Number RGPIN-2017- 05950]; Beijing University of Civil Engineering and Architecture Young Scholars' Research Ability Improvement Program: [Grant Number X21018]; Beijing Categorized Development Quota Project: [Grant Number 03082722002].
References
- Berry, Brian JL. 1968. “Interdependency of Spatial Structure and Spatial Behavior: A General Field Theory Formulation.” Papers of the Regional Science Association 21: 205–227. Springer. doi:10.1007/BF01952730
- Black, Kaine, and Monica Wachowicz. 2021. “Clustering Spatio-Temporal Bi-Partite Graphs for Finding Crowdsourcing Communities in IoMT Networks.” Big Earth Data 5 (1) Taylor & Francis: 24–48. doi:10.1080/20964471.2021.1899578.
- Calegari, Gloria Re, Emanuela Carlino, Diego Peroni, and Irene Celino. 2015. “Extracting Urban Land Use from Linked Open Geospatial Data.” ISPRS International Journal of Geo-Information 4 (4): 2109–2130. doi:10.3390/ijgi4042109
- Chawla, Nitesh V, Kevin W Bowyer, Lawrence O Hall, and W. Philip Kegelmeyer. 2002. “SMOTE: Synthetic Minority Over-Sampling Technique.” Journal of Artificial Intelligence Research 16: 321–357. doi:10.1613/jair.953
- Cheng, Tao, and Thomas Wicks. 2014. “Event Detection Using Twitter: A Spatio-Temporal Approach.” PloS One 9 (6) Public Library of Science San Francisco, USA: e97807. doi:10.1371/journal.pone.0097807
- Douglas, David H, and Thomas K Peucker. 1973. “Algorithms for the Reduction of the Number of Points Required to Represent a Digitized Line or Its Caricature.” Cartographica: The International Journal for Geographic Information and Geovisualization 10 (2) University of Toronto Press: 112–122. doi:10.3138/FM57-6770-U75U-7727
- Du, Shouhang, Shihong Du, Bo Liu, and Xiuyuan Zhang. 2021. “Mapping Large-Scale and Fine-Grained Urban Functional Zones from VHR Images Using a Multi-Scale Semantic Segmentation Network and Object Based Approach.” Remote Sensing of Environment 261 Elsevier: 112480. doi:10.1016/j.rse.2021.112480
- Du, Zhenhong, Xiaoyi Zhang, Wenwen Li, Feng Zhang, and Renyi Liu. 2020. “A Multi-Modal Transportation Data-Driven Approach to Identify Urban Functional Zones: An Exploration Based on Hangzhou City, China.” Transactions in GIS 24 (1) Wiley Online Library: 123–141. doi:10.1111/tgis.12591
- Earle, Paul, Michelle Guy, Richard Buckmaster, Chris Ostrum, Scott Horvath, and Amy Vaughan. 2010. “OMG Earthquake! Can Twitter Improve Earthquake Response?” Seismological Research Letters: Seismological Society of America 81 (2): 246–251.
- Frias-Martinez, Vanessa, and Enrique Frias-Martinez. 2014. “Spectral Clustering for Sensing Urban Land Use Using Twitter Activity.” Engineering Applications of Artificial Intelligence 35: 237–245.
- Farnaghi, Mahdi, Zeinab Ghaemi, and Ali Mansourian. 2020. “Dynamic Spatio-Temporal Tweet Mining for Event Detection: A Case Study of Hurricane Florence.” International Journal of Disaster Risk Science 11 (3) Springer: 378–393. doi:10.1007/s13753-020-00280-z
- Feng, Ying, Zhou Huang, Yaoli Wang, Lin Wan, Yu Liu, Yi Zhang, and Xv Shan. 2021. “An SOE-Based Learning Framework Using Multisource Big Data for Identifying Urban Functional Zones.” IEEE Journal of Selected Topics in Applied Earth Observations and Remote Sensing 14 IEEE: 7336–7348. doi:10.1109/JSTARS.2021.3091848
- Gao, Sihang, Qingming Zhan, Chen Yang, and Huimin Liu. 2020. “The Diversified Impacts of Urban Morphology on Land Surface Temperature among Urban Functional Zones.” International Journal of Environmental Research and Public Health 17 (24). MDPI: 9578. doi:10.3390/ijerph17249578
- García-Palomares, Juan Carlos, María Henar Salas-Olmedo, Borja Moya-Gomez, Ana Condeco-Melhorado, and Javier Gutierrez. 2018. “City Dynamics Through Twitter: Relationships Between Land Use and Spatiotemporal Demographics.” Cities 72. Elsevier: 310–319. doi:10.1016/j.cities.2017.09.007
- Goddard, John Burgess. 1970. “Functional Regions Within the City Centre: A Study by Factor Analysis of Taxi Flows in Central London.” Transactions of the Institute of British Geographers, 161–182. doi:10.2307/621647
- Goyal, Megha. 2011. “Morphological Image Processing.” IJCST 2 (4) Citeseer: 59.
- Gu, Ji-Rong, Xian-Wei Chen, and Hai-Long Yang. 2011. “Spatial Clustering Algorithm on Urban Function Oriented Zone.” Science of Surveying and Mapping 36 (5), Zhongguo Cehui Kexue Yanjiuyan, Bei Taiping Lu 16 Beijing 100039 China.
- Hu, Tengyun, Jun Yang, Xuecao Li, and Peng Gong. 2016. “Mapping Urban Land Use by Using Landsat Images and Open Social Data.” Remote Sensing 8 (2) MDPI: 151. doi:10.3390/rs8020151
- Huang, Wei, Hongchao Fan, and e Alexander Zipf. 2017. “Towards Detecting the Crowd Involved in Social Events.” ISPRS International Journal of Geo-Information 6 (10): 305. doi:10.3390/ijgi6100305.
- Huang, Xin, and Ying Wang. 2019. “Investigating the Effects of 3D Urban Morphology on the Surface Urban Heat Island Effect in Urban Functional Zones by Using High-Resolution Remote Sensing Data: A Case Study of Wuhan, Central China.” ISPRS Journal of Photogrammetry and Remote Sensing 152 Elsevier: 119–131. doi:10.1016/j.isprsjprs.2019.04.010
- Huang, Xiao, Cuizhen Wang, Zhenlong Li, and Huan Ning. 2021. “A 100 m Population Grid in the CONUS by Disaggregating Census Data with Open-Source Microsoft Building Footprints.” Big Earth Data 5 (1) Taylor & Francis: 112–133. doi:10.1080/20964471.2020.1776200.
- Jiang, Shan, Ana Alves, Filipe Rodrigues, Joseph Ferreira Jr, and Francisco C Pereira. 2015. “Mining Point-of-Interest Data from Social Networks for Urban Land Use Classification and Disaggregation.” Computers, Environment and Urban Systems 53 Elsevier: 36–46. doi:10.1016/j.compenvurbsys.2014.12.001
- Jongman, Brenden, Jurjen Wagemaker, Beatriz Revilla Romero, and Erin Coughlan de Perez. 2015. “Early Flood Detection for Rapid Humanitarian Response: Harnessing Near Real-Time Satellite and Twitter Signals.” ISPRS International Journal of Geo-Information 4 (4) MDPI: 2246–2266. doi:10.3390/ijgi4042246
- Karlsson, Charlie, and others. 2007. “Clusters, Functional Regions and Cluster Policies.” JIBS and CESIS Electronic Working Paper Series 84 (3). Citeseer.
- Kersten, Jens, and Friederike Klan. 2020. “What Happens Where During Disasters? A Workflow for the Multifaceted Characterization of Crisis Events Based on Twitter Data.” Journal of Contingencies and Crisis Management 28 (3) Wiley Online Library: 262–280. doi:10.1111/1468-5973.12321
- Kulldorff, Martin, William F Athas, Eric J Feurer, Barry A Miller, and Charles R Key. 1998. “Evaluating Cluster Alarms: A Space-Time Scan Statistic and Brain Cancer in Los Alamos, New Mexico.” American Journal of Public Health 88 (9) American Public Health Association: 1377–1380. doi:10.2105/AJPH.88.9.1377
- Lee, Jay, Junfang Gong, and Shengwen Li. 2017. “Exploring Spatiotemporal Clusters Based on Extended Kernel Estimation Methods.” International Journal of Geographical Information Science 31 (6) Taylor & Francis: 1154–1177.
- Li, Bin, Yefei Liu, Hanfa Xing, Yuan Meng, Guang Yang, Xiaoding Liu, and Yaolong Zhao. 2022. “Integrating Urban Morphology and Land Surface Temperature Characteristics for Urban Functional Area Classification.” Geo-Spatial Information Science. Taylor & Francis, 1–16.
- Li, Songnian, Monica Wachowicz, and Hongchao Fan. 2021. “Analytics of Big Geosocial Media and Crowdsourced Data.” Big Earth Data 5 (1) Taylor & Francis: 1–4. doi:10.1080/20964471.2021.1898780.
- Linton, Sabriya L, Jacky M Jennings, Carl A Latkin, Marisela B Gomez, and Shruti H Mehta. 2014. “Application of Space-Time Scan Statistics to Describe Geographic and Temporal Clustering of Visible Drug Activity.” Journal of Urban Health 91 (5) Springer: 940–956. doi:10.1007/s11524-014-9890-7
- Liu, Baihua, Yingbin Deng, Miao Li, Ji Yang, and Tao Liu. 2021. “Classification Schemes and Identification Methods for Urban Functional Zone: A Review of Recent Papers.” Applied Sciences 11 (21) MDPI: 9968. doi:10.3390/app11219968
- Liu, Xingjian, and Ying Long. 2016. “Automated Identification and Characterization of Parcels with OpenStreetMap and Points of Interest.” Environment and Planning B: Planning and Design 43 (2) SAGE Publications Sage UK: London, England: 341–360. doi:10.1177/0265813515604767
- Liu, Huimin, Yiyuan Xu, Jianbo Tang, Min Deng, Jincai Huang, Wentao Yang, and Fang Wu. 2020. “Recognizing Urban Functional Zones by a Hierarchical Fusion Method Considering Landscape Features and Human Activities.” Transactions in GIS 24 (5) Wiley Online Library: 1359–1381. doi:10.1111/tgis.12642
- Mansourifar, Hadi, and Weidong Shi. 2020. “Deep Synthetic Minority Over-Sampling Technique.” ArXiv Preprint ArXiv:2003.09788.
- Meng, Yuan, Dongyang Hou, and Hanfa Xing. 2017. “Rapid Detection of Land Cover Changes Using Crowdsourced Geographic Information: A Case Study of Beijing, China.” Sustainability 9 (9) MDPI: 1547. doi:10.3390/su9091547
- More, Ajinkya. 2016. “Survey of Resampling Techniques for Improving Classification Performance in Unbalanced Datasets.” ArXiv Preprint ArXiv:1608.06048.
- Morstatter, Fred, Jürgen Pfeffer, Huan Liu, and e Kathleen M. Carley. 2013. “Lecture Notes in Computer Science.” ICWSM, 75–83. doi:10.1007/978-3-319-05579-4_10.
- Sha, Dexuan, Yi Liu, Qian Liu, Yun Li, Yifei Tian, Fayez Beaini, Cheng Zhong, et al. 2021. “A Spatiotemporal Data Collection of Viral Cases for COVID-19 Rapid Response.” Big Earth Data 5 (1) Taylor & Francis: 90–111. doi:10.1080/20964471.2020.1844934.
- Shi, Zhicheng, and Lilian SC Pun-Cheng. 2019. “Spatiotemporal Data Clustering: A Survey of Methods.” ISPRS International Journal of Geo-Information 8 (3) MDPI: 112. doi:10.3390/ijgi8030112
- Toole, Jameson L, Michael Ulm, Marta C González, and Dietmar Bauer. 2012. “Inferring Land Use from Mobile Phone Activity.” In Proceedings of the ACM SIGKDD International Workshop on Urban Computing, 1–8.
- Tu, Wei, Zhongwen Hu, Lefei Li, Jinzhou Cao, Jincheng Jiang, Qiuping Li, and Qingquan Li. 2018. “Portraying Urban Functional Zones by Coupling Remote Sensing Imagery and Human Sensing Data.” Remote Sensing 10 (1) MDPI: 141. doi:10.3390/rs10010141
- Wei, Qiujun, Jiangfeng She, Shuhua Zhang, and Jinsong Ma. 2018. “Using Individual GPS Trajectories to Explore Foodscape Exposure: A Case Study in Beijing Metropolitan Area.” International Journal of Environmental Research and Public Health 15 (3) MDPI: 405. doi:10.3390/ijerph15030405
- Wen, Richard, and Songnian Li. 2021. “A Review of the Use of Geosocial Media Data in Agent-Based Models for Studying Urban Systems.” Big Earth Data 5 (1) Taylor & Francis: 5–23. doi:10.1080/20964471.2020.1810492.
- Xu, Shishuo, Songnian Li, and Wei Huang. 2020. “A Spatial-Temporal-Semantic Approach for Detecting Local Events Using geo-Social Media Data.” Transactions in GIS 24 (1) Wiley Online Library: 142–173. doi:10.1111/tgis.12589
- Xu, Shishuo, Songnian Li, Wei Huang, and Richard Wen. 2022. “Detecting Spatiotemporal Traffic Events Using Geosocial Media Data.” Computers, Environment and Urban Systems 94 Elsevier: 101797. doi:10.1016/j.compenvurbsys.2022.101797
- Yao, Zijun, Yanjie Fu, Bin Liu, Wangsu Hu, and Hui Xiong. 2018. “Representing Urban Functions through Zone Embedding with Human Mobility Patterns.” In Proceedings of the Twenty-Seventh International Joint Conference on Artificial Intelligence (IJCAI-18).
- Yao, Yao, Xia Li, Xiaoping Liu, Penghua Liu, Zhaotang Liang, Jinbao Zhang, and Ke Mai. 2017. “Sensing Spatial Distribution of Urban Land Use by Integrating Points-of-Interest and Google Word2Vec Model.” International Journal of Geographical Information Science 31 (4) Taylor & Francis: 825–848. doi:10.1080/13658816.2016.1244608
- Yuan, Nicholas, Xie Jing, Wang Xing, Xiong Yingzi, and Zheng Hui. 2015. “Discovering Urban Functional Zones Using Latent Activity Trajectories.” IEEE Transactions on Knowledge & Data Engineering.
- Yuan, Jing, Yu Zheng, and Xing Xie. 2012. “Discovering Regions of Different Functions in a City Using Human Mobility and POIs.” In Proceedings of the 18th ACM SIGKDD International Conference on Knowledge Discovery and Data Mining, 186–194.
- Zhan, Xianyuan, Satish V Ukkusuri, and Feng Zhu. 2014. “Inferring Urban Land Use Using Large-Scale Social Media Check-in Data.” Networks and Spatial Economics 14 (3) Springer: 647–667. doi:10.1007/s11067-014-9264-4
- Zhang, Xiuyuan, Shihong Du, Qiao Wang, and Weiqi Zhou. 2018. “Multiscale Geoscene Segmentation for Extracting Urban Functional Zones from VHR Satellite Images.” Remote Sensing 10 (2) MDPI: 281. doi:10.3390/rs10020281
- Zhang, Xiuyuan, Shihong Du, and Zhijia Zheng. 2020. “Heuristic Sample Learning for Complex Urban Scenes: Application to Urban Functional-Zone Mapping with VHR Images and POI Data.” ISPRS Journal of Photogrammetry and Remote Sensing 161 Elsevier: 1–12. doi:10.1016/j.isprsjprs.2020.01.005
- Zhang, Xiaoyi, Wenwen Li, Feng Zhang, Renyi Liu, and Zhenhong Du. 2018. “Identifying Urban Functional Zones Using Public Bicycle Rental Records and Point-of-Interest Data.” ISPRS International Journal of Geo-Information 7 (12): 459. doi:10.3390/ijgi7120459
- Zhang, Kui, Dongping Ming, Shigao Du, Lu Xu, Xiao Ling, Beichen Zeng, and Xianwei Lv. 2022. “Distance Weight-Graph Attention Model-Based High-Resolution Remote Sensing Urban Functional Zone Identification.” IEEE Trans. Geosci. Remote. Sens 60: 1–18.