
 ?Mathematical formulae have been encoded as MathML and are displayed in this HTML version using MathJax in order to improve their display. Uncheck the box to turn MathJax off. This feature requires Javascript. Click on a formula to zoom.
ABSTRACT
Vegetation plays an important role in global or regional environmental change. In this study, the spatial–temporal variations of NDVI and its response to climate in China and its seven sub-regions were investigated based on MODIS NDVI data, ERA5-land precipitation (PRE) and temperature (TEM) data from 2001 to 2020. The inter-annual growth rate of NDVI in China was 0.0021/yr in the past 20 years. The inter-annual growth rates of NDVI in seven sub-regions had significant differences at regional or seasonal scales. The ratio of improved vegetation area to the total studied area reached about 70%. In summer, vegetation degradation was concentrated in East China and Southwest China. The vegetation in Central China and South China improved more obviously in autumn than in the other seasons. The vegetation of Northeast China had a remarkable degradation in autumn and winter, especially in winter. The influence degree of PRE (q = 0.54, P < 0.01) was greater than that of TEM (q = 0.27, P < 0.01) in the control of the spatial distribution of NDVI. The interaction influence degree q of PRE TEM was about 0.71 in the last 20 years. However, the PRE and TEM played different roles in vegetation growth in seven sub-regions.
1. Introduction
Ecological degradation is one of the key issues of global environmental change, which greatly restricts the development of human society and affects the evolution of living things. As an important part of maintaining the normal operation of the terrestrial ecosystem, vegetation plays an important role in global or regional environmental change (Zhu et al. Citation2016; Levine Citation2016; Law et al. Citation2002). With the influences of environmental conditions, the spatial–temporal variations in vegetation have demonstrated significant changes (de Jong et al. Citation2011). The hydrothermal conditions in climatic environment determine the phenology, productivity and distribution pattern of vegetation (Wen et al. Citation2017). At present, the monitoring of long time series, large-scale vegetation and factor analyses causing vegetation change have become a hot research topic (Zhang and Wu Citation2020; Guo et al. Citation2021; Kong et al. Citation2020). The related research work can provide an important reference for regional environmental protection, and social and economic development.
Satellite observations provide a useful and powerful database for evaluating the dynamics of terrestrial vegetation at regional, continental, and global scales because of its global coverage and short revisit interval (Piao et al. Citation2003; Bondeau et al. Citation1999; Fensholt et al. Citation2012; Cao et al. Citation2014; Liu, Su, et al. Citation2015). In the field of remote sensing application, Vegetation indice (VI) has been widely used for qualitative and quantitative evaluations of vegetation cover on a land surface and its growth vitality over wide areas. The Normalized Difference Vegetation Index (NDVI), one of the most commonly used indices, is calculated from satellite imagery in which the satellite's spectrometer or radiometric sensor measures and stores reflectance values for both the red and near-infrared (NIR) bands on two separate channels or images (Crippen Citation1990). Due to its stability, NDVI is successful to be a measure of vegetation to permit meaningful comparisons of seasonal and inter-annual changes in vegetation growth and activity (Huete et al. Citation2002; Olafsson and Rousta Citation2021).
China, a country with a vast territory and the largest population, has paid much attention to the improvement of the quality of ecological environment in recent years (Li et al. Citation2022). China's achievements in ecological improvement are of far-reaching influence on the global. Climate diversity and intensive human activity have caused complex vegetation activity in China (Liu, Li, et al. Citation2015). Some researchers had investigated the variations of NDVI and their driving factors, mainly focused on localized areas (Cao et al. Citation2014; Qi et al. Citation2019; Eckert et al. Citation2015; Pang, Wang, and Yang Citation2017; Li, Wang, et al. Citation2021; Fensholt et al. Citation2009; Fensholt et al. Citation2012; Chuai et al. Citation2013; Gao et al. Citation2022; Hou et al. Citation2015; Rousta et al. Citation2020). Linear fit, residual trend analysis and correlation analysis methods were mostly used in these studies to qualitatively analyze the spatial–temporal changes of NDVI, of course, also used in other studies on a national or global scale (Gao, Jiao, and Wu Citation2019; Fang et al. Citation2004; Liu, Li, et al. Citation2015; Piao et al. Citation2003; Eckert et al. Citation2015; Fensholt and Proud Citation2012; Fensholt et al. Citation2009; Fensholt et al. Citation2012). Some studies focus on the trend analysis of non-stationary NDVI time series through decomposing the time series into different components (Rhif et al. Citation2021; Rhif et al. Citation2022; Abbes et al. Citation2018; Wen et al. Citation2017). At present, the successful and effective applications of the Mann-Kendall test (Kendall Citation1975; Mann Citation1945) and Geodetector (Wang et al. Citation2010; Wang, Zhang, and Fu Citation2016) in earth science provide new ways to investigate the temporal trend of NDVI and spatial heterogeneity of factors, such as the NDVI characteristics in the Hanjiang River Basin (Chen et al. Citation2020) and Loess Plateau (Nie et al. Citation2021; Li, Wang, et al. Citation2021). However, long-term systematic analysis of NDVI over the Chinese regions is still rare, especially in exploring the spatial heterogeneity of the response of vegetation to climate change.
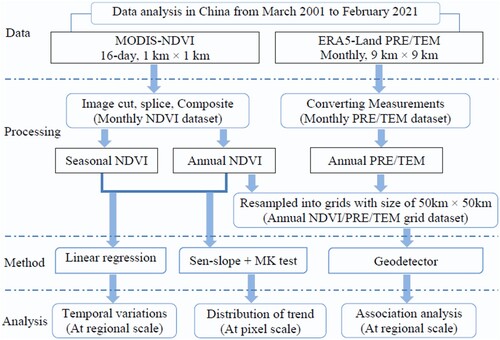
This study concentrated on temporal and spatial variations of NDVI and its responses to temperature (TEM) and precipitation (PRE) based on data from Satellite observations over the past two decades in China. The purposes of this study are (1) to examine the inter-annual growth and seasonal growth of NDVI from 2001 to 2020 in China and its seven sub-regions; (2) to demonstrate the spatial distribution of NDVI trends in the past 20 years; (3) to detect the relationships between the spatial–temporal variations of NDVI and climatic factors. summarizes the research route applied in this study. The detailed descriptions will be elaborated on in the following sections. Our work will contribute to a better understanding of climate-driven vegetation variations, and promoting the implementation and management of ecological reconstruction programs.
Figure 1. A flow chart of the research route applied in this study.
2. Data and methods
2.1. Study area
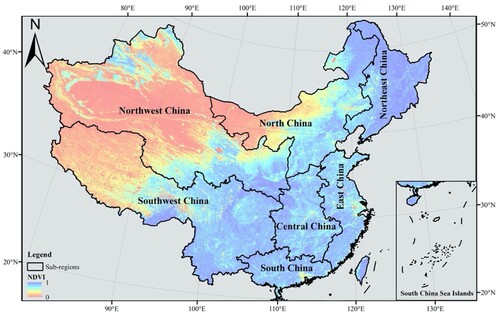
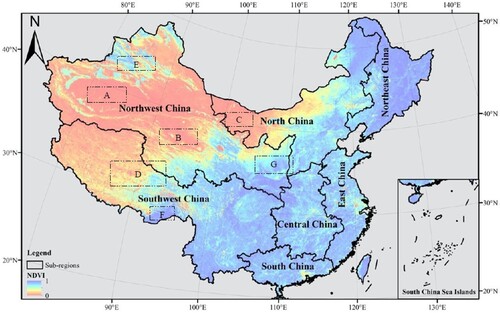
China is located in the east of Asia and on the West Bank of the Pacific Ocean. It has a vast territory with a total land area of about 9.6 million square kilometers, which spans nearly 50 degrees from north to south. Most of Chinese territory is in the temperate zone, and a small part is in the tropical zone, without the frigid zone. As one of the developing countries, China has the largest population in the world. Affected by the monsoon climate, the winter is cold and dry, while the summer is warm and rainy. The PRE is unevenly distributed, mainly concentrated in summer and autumn in most areas and gradually decreased from the southeast coast to the northwest inland. In winter, the TEM decreases from the south to the north, and the TEM difference between the north and the south is obvious. In summer, high TEM is common in most parts of the country except the Qinghai-Tibet Plateau. The rich vegetation resources are formed under diverse climate and natural conditions. Physical geographical regionalization was used in the following analysis. In other words, Chinese region is divided into seven sub-regions (An et al. Citation2015), as shown in . Some works would be performed at a regional scale in this study. The distribution of 20-year averaged NVDI is also presented in the figure and reflected a large regional difference of gradually decreasing from the southeast to the northwest.
Figure 2. Physical geographical regionalization of the study area. From north to south, east to west, the seven sub-regions are Northeast China, North China, Northwest China, East China, Central China, Southwest China, and South China. The pixel color represents the value of the 20-year average NDVI.
2.2. Data sources and data processing
The datasets used in this study consist of NDVI data, PRE and TEM data. NDVI data set series from March 2001 to February 2021 were obtained from Moderate Resolution Imaging Spectroradiometer (MODIS) onboard the Terra satellite from the National Aeronautics and Space Administration (NASA). We used 16-day intervals of NDVI product MOD13A2 with a spatial resolution of 1 km × 1 km (Fensholt et al. Citation2009). MODIS has been in orbit from March 2000 to the present time (Shi et al. Citation2021). Compared with the other NDVI dataset, the MODIS NDVI product is more reliable and suitable for reflecting the long-term vegetation dynamics over a large spatial scale, considering the spatial–temporal resolution, time span and on-orbit status (Zhu et al. Citation2019; Sun et al. Citation2015). The spatial resolution was bilinearly resampled from 250 m to 1 km (Shi et al. Citation2021). Nevertheless, the resolution of 1 km was used in this study instead of 250 m, due to the great data processing burden on the study area of 9.6 million square kilometers. There are 8,126,518 pixel values in each 16-day, 1 km × 1 km NDVI datum.
The MODIS Reprojection Tools (MRT) were used to cut and splice the NDVI bands of MOD13A2. These NDVI datasets were re-projected to the WGS-84 coordinate system using the ArcGIS 10.8 software. Climate year is adopted, that is, started in March of a given year and lasted until the next February over a continuous period from March 2001 to February 2021. The 16-day NDVI datasets were synthesized to the monthly values pixel-by-pixel using the Maximum Value Composite method (Sun et al. Citation2015; Nie et al. Citation2021; Chu et al. Citation2019). The S-G (Savitzky Golay Filter) algorithm was used for monthly NDVI image smoothing and de-noising, reducing the influence of rain and snow atmosphere (Savitzky and Golay Citation1964). The spring period is from March to May (Mar-Apr-May), summer is from June to August (Jun-Jul-Aug), autumn is from September to November (Sept-Oct-Nov) and winter is from December to February (Dec-Jan-Feb). Then seasonal and annual NDVI data were composited by monthly NDVI images at the regional scale and the pixel scale by averaging. The value of NDVI ranges from −1 to 1 (dimensionless), increasing positive NDVI values indicate increasing amounts of green vegetation. NDVI values near zero and decreasing negative values indicate non-vegetated features such as barren surfaces (rock and soil) and water, snow, ice and clouds (Schnur, Xie, and Wang Citation2010; Chuai et al. Citation2013; Olafsson and Rousta Citation2021). Therefore, the pixels with NDVI > 0 in vegetation areas were extracted in this study.
TEM and PRE raster datasets during 2001–2020 were obtained from ECMWF (European Centre for Medium-range Weather Forecasts) ERA5-Land (the land component of the 5th generation of European ReAnalysis) products (Joaquín et al. Citation2021), monthly averaged 2 m TEM and total PRE were adopted with spatial resolution of 9 km × 9 km. 2 m TEM refers to the dew point TEM 2 m high on the earth surface with the unit of Kelvin, which was converted into Celsius () in this study. Total PRE measured in m was converted to mm.
In addition, the NDVI and PRE/TEM data were resampled into a grid dataset of 50 km × 50 km for the subsequent detection of their relationships.
2.3. Methods
2.3.1. Linear regression analysis
The linear regression analysis method was applied to detect the temporal variations (inter-annual growth/seasonal growth) of NDVI from 2001 to 2020 at the regional scale, and the ordinary least squares method was employed to determine the parameters in the regression model (Nie et al. Citation2021; Hou et al. Citation2015). The linear regression equation is expressed as follows.
(1)
(1) where
denotes the average NDVI of the i-th year in the year series. The time span in this study is 2001–2020, so n equals to 20. a and b are the intercept and slope of the linear regression equation, respectively;
expresses the error term. b represents the inter-annual growth rate of the NDVI in the study period. The vegetation displays an increasing/ decreasing trend when the value of b is greater/lesser than zero (Gao et al. Citation2022; Sun et al. Citation2015). As one of the significance test methods for linear regression, the Pearson correlation coefficient (
) is derived to determine the significance of the NDVI linear trend. Since the sample size is less than 30 (n < 30), the unbiased correlation coefficient is more convincing for correlation analysis, as denoted as
.
(2)
(2) where
is the Pearson correlation coefficient and n is the size of the year series. When
, the linear trend has passed the significance test with 95% confidence intervals (
).
2.3.2. Theil-Sen Median and Mann-Kendall test
Theil-Sen Median trend analysis and the Mann–Kendall test were combined to investigate the trend characteristic of NDVI in the study period (Cao et al. Citation2014). Theil-Sen Median method is a robust trend calculation method of non-parametric statistics, which is also known as Sen-slope estimation. This method is insensitive to measurement error and outlier data and has high computational efficiency, widely used in the long-time series trend analysis of meteorology and hydrology (Zhang et al. Citation2015; Li, Wang, et al. Citation2021; Ali et al. Citation2019). The Sen-slope is defined as follows.
(3)
(3) where
means the trend of NDVI (increase or decrease),
means the median value,
and
represent the years,
is the NDVI value of the year
. n is the size of the year series.
Mann-Kendall (MK for short) is a non-parametric test method, which does not require samples to follow a certain distribution compared with other parameter test methods. Sen-slope value is calculated first, and then the MK method is used to determine the trend significance. The test statistic is defined as follows.
is a sign function.
(4)
(4)
(5)
(5) The statistic
is approximately normally distributed with the variance as follows.
(6)
(6) The standardized test statistic Z is computed by
(7)
(7) The statistic Z follows the standard normal distribution with a mean of zero and a variance of one. The critical value is 1.96 at the significance level
, that is, if
the trend has passed the significance test with confidence intervals of 95%.
2.3.3. Geodetector
Geodetector (geographical detector) is a spatial variance analysis tool to assess the relative importance of different components controlling a geographic phenomenon, which is intrinsically immune to collinearity (Wang et al. Citation2010; Chen et al. Citation2022; Fang et al. Citation2021). This method has been successfully applied to determine controlling factors in many geoscience fields (http://www.geodetector.cn/). The Geodetector is classified into four types, namely Factor_detector, Interaction_detector, Risk_detector and Ecological_detector. In this study, Factor_detector, Interaction_detector and Risk_detector are used to reveal the response of vegetation to climate from multiple perspectives.
Factor_detector can detect the spatial differentiation of Y (NDVI) and the influence degree of Y changes caused by influence factor X (PRE, TEM), measured by
statistic value, is determined by the local and global variances (Wang et al. Citation2010). The formulae are as follows.
Interaction_detector was used to evaluate the interaction of different factors (PRE and TEM). The aim is to determine whether the interaction of two factors could enhance or weaken the influence on the dependent variable. Specifically, overlaying the individual factor strata
Risk_detector is used to detect the suitable climate conditions in favor of vegetation growth. Risk_detector is based on the
3. Results
3.1. Temporal variations from 2001 to 2020
3.1.1. Inter-annual variation
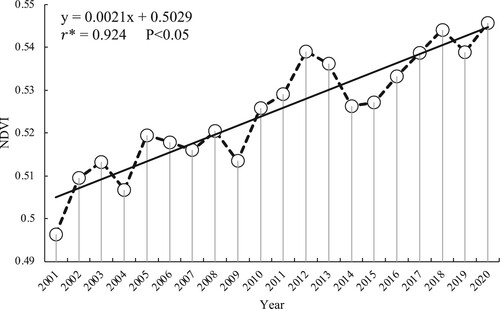
The inter-annual variations of NDVI were investigated by linear regression analysis in China and its seven sub-regions during 2001–2020. The slope of the fitted line was expressed as an inter-annual growth rate. The time series of the annual averaged NDVI over China is shown in . The fluctuation range of NDVI was 0.49 ∼ 0.55 in the study period. The inter-annual growth rate was 0.0021/yr and is 0.924, greater than the critical value of 0.444 indicating a significantly increasing (
). In the last 20 years, the average NDVI was about 0.525, the minimum value was about 0.496 in 2001, and the maximum value was about 0.546 in 2020.
Figure 3. Time series of annual averaged NDVI over China. The line represents the linear fit of NDVI over the time series from 2001 to 2020. The text on the upper-left labels the regression equation and unbiased correlation coefficients.
shows the variations of NDVI in seven sub-regions of China. From 2001 to 2020, there was a significant difference in these time series of annual averaged NDVI ((a)). Seven sub-regions could be divided into three clear groups according to the serial interval of NDVI. The first group of NDVI kept a high value (0.7 ∼ 0.9) during the study period ((b)), including Northeast China, Central China, East China and South China. The second group of NDVI was moderate (0.4 ∼ 0.6), including North China and Southwest China ((c). The third group of NDVI maintained a low scope (0.2∼0.3), located in Northwest China ((d)). From 2001 to 2020, the NDVI trends of seven sub-regions were different but approximately similar to each other, demonstrating the consistent growth.
Figure 4. (a) Time series of annual averaged NDVI in seven sub-regions, which can be divided into three groups. (b) The first group includes Northeast China, South China, Central China and East China. (c) The second group includes Southwest China and North China. (d) The third group includes Northwest China. The line represents the linear fit of NDVI over the time series from 2001 to 2020.
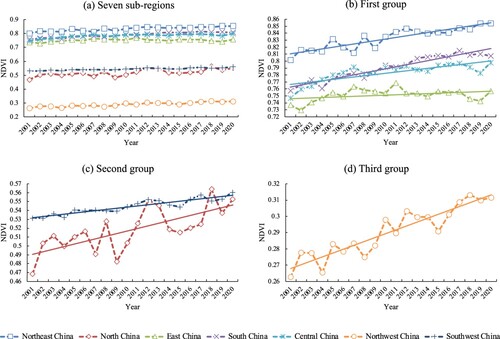
As shown in , the inter-annual growth rates of Northeast China, North China, South China and Northwest China were all greater than 0.0024/yr. Although the NDVI in Northwest China remained in a low range, it still showed an obvious increase. The inter-annual growth rates of Central China and Southwest China were 0.0018/yr and 0.0013/yr, respectively, indicating a certain growth. The NDVI in East China was in a higher range, but the inter-annual growth rate was only 0.0006/yr, and was only 0.378, having not passed the significance test with 95% confidence intervals. Hence, the growth of NDVI in East China was inconspicuous, which may be related to the development of urbanization in East China.
Table 1. The regression equation and unbiased correlation coefficient of inter-annual NDVI evolution in seven sub-regions.
3.1.2. Seasonal variation
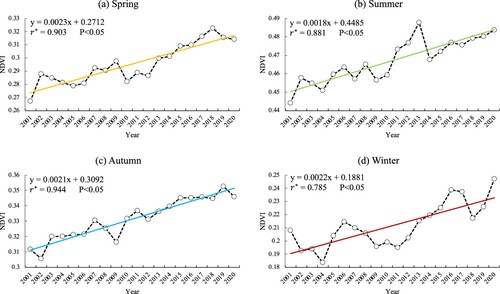
Significant seasonal differences were presented in the vegetation dynamics. The NDVI time series of four seasons over China all showed obvious increases from 2001 to 2020 (). In spring, the NDVI fluctuated between 0.26 and 0.33, and the inter-annual growth rate was 0.0023/yr. The mean value of 20-year NDVI was 0.295, the minimum value was 0.267 in 2001 and the maximum value was 0.322 in 2018. The mean value of summer NDVI was the largest (0.467) among the four seasons, with a fluctuation range of 0.44∼0.48, and the inter-annual growth rate was 0.0018/yr. The rapid growth of summer NDVI appeared in the period of 2009–2013, the maximum value of NDVI was 0.488 in 2013, and the minimum value was 0.444 in 2001. In autumn, the mean value of NDVI was 0.331, with a range of 0.30∼0.36 and an inter-annual growth rate of 0.0021/yr. The minimum value of autumn NDVI was 0.306 in 2002 and the maximum value was 0.353 in 2019. The time series of 20-year NDVI fluctuated sharply in winter, and the inter-annual growth rate was 0.0022/yr, with a minimum value of 0.183 in 2004 and a maximum value of 0.247 in 2020, showing a non-sustainable growth trend.
Figure 5. Time series of seasonal averaged NDVI in (a) Spring, (b) Summer, (c) Autumn and (d) Winter. The line represents the linear fit of NDVI over the time series from 2001 to 2020. The text on the upper left labels the regression equation and unbiased correlation coefficients.
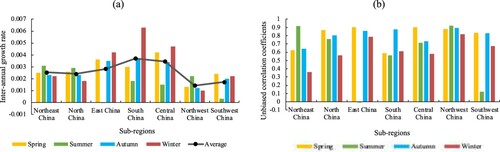
Seasonal differences were also presented in seven sub-regions. displays that the NDVI values in seven sub-regions of China increased except the NDVI of East China in summer ((a)). The inter-annual growth rates of Northeast China, North China and Northwest China in summer were higher than those in other seasons. However, the NDVI growths of East China, South China and Central China were more significant in winter, but the growth of Southwest China was more significant in spring, indicating the spatial heterogeneity of growth trend in seven sub-regions at seasonal scale. The summer growth was not significant in Southwest China, even with a slight decrease in East China ((b)). In terms of the averaged inter-annual growth rate of four seasons, the growth rates of South China, Central China and East China were in the top three, while the growth rates of Northwest China and Southwest China were slightly smaller than those of North China and Northeast China. On the whole, the averaged inter-annual growth rates of seven sub-regions showed a decreasing trend from south to north and from east to west.
Figure 6. Inter-annual growth rates and inter-annual correlations of NDVI during 2001–2020 at regional and seasonal scales. (a) Inter-annual growth rates of seven sub-regions in four seasons, the black dot represented the averaged inter-annual growth rate of four seasons for each sub-region. (b) Unbiased correlation coefficients between NDVI series and Year series of seven sub-regions in four seasons were used to determine the trend significantly.
3.2. Spatial distribution of NDVI trend
Sen-slope estimation and MK test were carried out over China pixel-by-pixel during the study period, and the analysis results were used to determine the growth trend of vegetation. When is greater than 0, the vegetation shows an improving trend, when
is less than 0, the vegetation shows a worsening trend. The Z statistic of the MK test illustrates the significance of improvement or degradation. By synthesizing
and Z, the trends were divided into five trend levels (Wang et al. Citation2022; Cao et al. Citation2014): Severe degradation (SNDVI < −0.0005, Z < −1.96), Slight degradation (SNDVI < −0.0005, −1.96 ≤ Z ≤ 1.96), Stable (−0.0005 ≤ SNDVI ≤ 0.0005, −1.96 ≤ Z ≤ 1.96), Slight improvement (SNDVI > 0.0005, −1.96 ≤ Z ≤ 1.96) and Significant improvement (SNDVI > 0.0005, Z > 1.96). The spatial distribution of 20-year NDVI trend over China is shown in . Meanwhile, shows the area statistics of different vegetation trends in China and seven sub-regions.
Figure 7. Spatial distribution of the 20-year NDVI trend over China. Five trend levels were displayed with different colors.
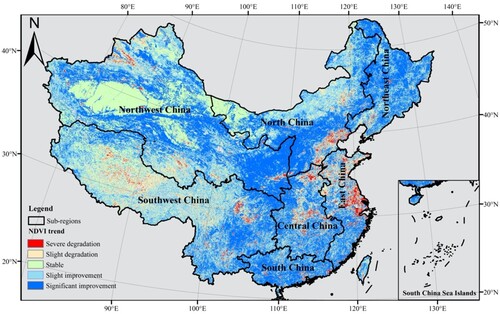
Table 2. Area Statistics of five trend levels in China and seven sub-regions. A stands for the area (unit: ) and P stands for percentage (unit: %).
The vegetation in most of China has improved significantly in the past 20 years (). Combined with , it can be found that the areas of slight improvement and significant improvement of vegetation in China took up 29.66% and 39.93%, respectively, with an improvement percentage of nearly 70%, which is much higher than the degraded area (about 11.6%), indicating a good growth trend. In terms of regional statistics, the improved vegetation areas were mainly distributed in Northwest China, Southwest China and North China, which accounted for 20.87%, 14.29% and 13.15% of the total area, respectively. The vegetation degradation (Slight degradation and Severe degradation) was obvious in Southwest China, Northwest China, East China and North China accounting for 3.83%, 2.17%, 1.79% and 1.74%, respectively. Certainly, the percentage of vegetation degradation was smaller than that of vegetation improvement within the same sub-region. Stable areas concentrated in the Taklimakan desert in Northwest China and Ala Shan Desert in North China, with a very low NDVI value ().
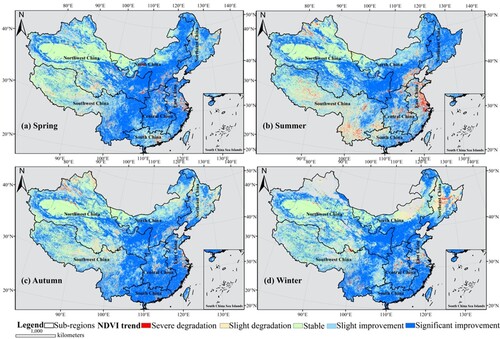
Furthermore, four seasonal components of NDVI were extracted from the original monthly dataset from 2001 to 2020. Sen-slope estimation and MK test were carried out at a seasonal scale. The growth trends of NDVI during 2001∼2020 in spring, summer, autumn and winter are displayed in . In summer, vegetation degradation areas were concentrated in East China and Southwest China. The vegetation severe degradation area in East China accounts for 2.3% of China's total area in summer, much higher than that in other seasons. The land use change caused by urbanization had a destructive effect on vegetation in East China and its surrounding areas (Yuan et al. Citation2019; Zheng et al. Citation2021; Haas and Ban Citation2014). The degradation percentage of Southwest China in summer was 6.6% and it was probably affected by natural disasters caused by heavy summer rains. Compared with other seasons, the vegetation in Central China and South China improved obviously in autumn. As the main grain-producing area in China, the crop-growing season of Northeast China lasts from April to October under cold weather. The vegetation in autumn and winter had an obvious degrading trend, especially in winter.
Figure 8. Spatial distribution of the 20-year seasonal NDVI trend over China. (a) Spring, (b) Summer, (c) Autumn and (d) Winter. Unvegetated areas were mostly ice-snow-covered, cloud-sheltered areas or water areas.
3.3. Association between NDVI and climatic factors
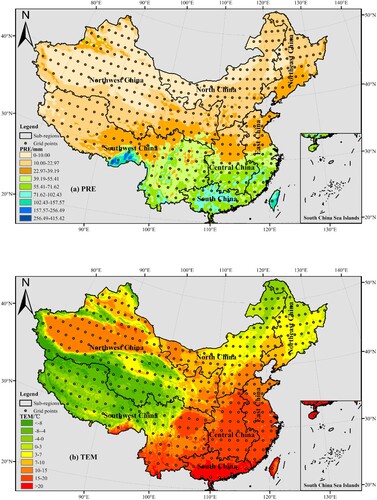
Climate plays an important role in vegetation dynamics; PRE and TEM are often taken as the key factors. Geodetector is adopted to explore the spatial–temporal differences and relationships between NDVI and PRE/TEM. The distributions of 20-year averaged PRE/TEM with spatial resolution of 9 km × 9 km are shown in . The entire north-western inland area had sparse PRE throughout the year. The TEM distribution was very uneven due to the Geological and topographical conditions. The grid dataset of 50 km × 50 km mentioned in Section 2.2 was used for the input of the Geodetector. The points in (N = 427) are located at the central positions of the grids of 50 km × 50 km. The mean of all pixel values in a grid was computed as the value of the grid point. Specifically, each grid point corresponds to three values, namely NDVI, PRE and TEM, where NDVI is a dependent variable, PRE and TEM are independent variables, and the output is influence degree, represented as value. The interval of PRE/TEM was divided into nine partitions according to natural breaks (Jenks) (Slocum Citation1999).
Figure 9. Distribution of 20-year average PRE (a) and TEM (b) over China. The points are located at the central positions of the grids with a spatial resolution of 50 km × 50 km.
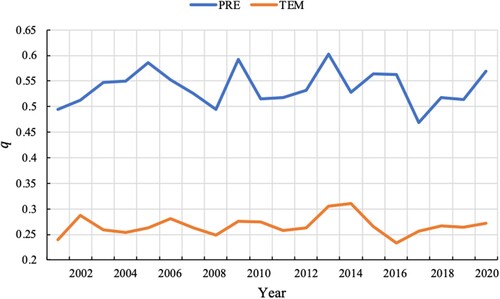
The influence degree was obtained by Factor_detector and reflected the quantitative relationship between NDVI and PRE/TEM for each year. The
series of 20 years is displayed in . The
value of PRE was in the range of 0.46 ∼ 0.61, with a mean of 0.54 and passed the significance test (P < 0.01). The
of TEM was in the range of 0.23 ∼ 0.32, with a mean of 0.27 and passed the significance test (P < 0.01). The
value of PRE was apparently higher than the
value of TEM. Therefore, it can be found that PRE was the main influencing factor and TEM was the secondary one in the control of spatial distribution of NDVI. The large fluctuation of
value indicated that vegetation was affected by many other influencing factors besides climate in 20 years.
Figure 10. The influence degree of PRE/TEM acting on NDVI over China from 2001 to 2020.
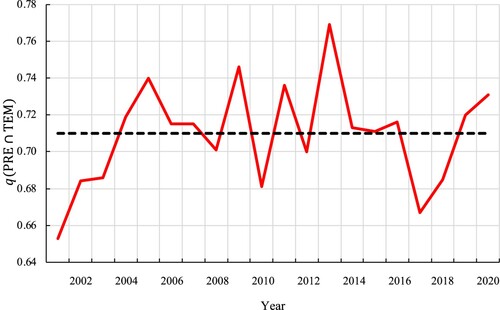
Interaction_detector was used to determine the combined effects of PRE and TEM on NDVI. The interaction influence degree from 2001 to 2020 is shown in . The mean of
values of the combined effects of PRE and TEM on NDVI (denoted by PRE
TEM) was about 0.71 in the last 20 years.
Figure 11. The interaction influenced degree of PRE
TEM in China from 2001 to 2020. The black dotted line represents the mean value of
.
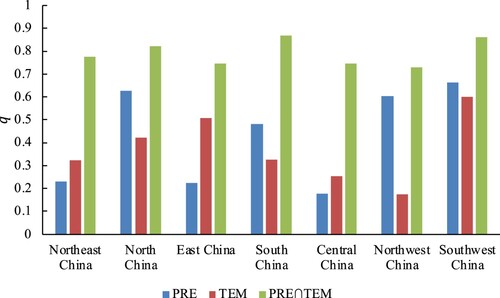
In the meantime, Factor_detector and Interaction_detector were carried out in each sub-region for comparison of influence differences. The influence degree of seven sub-regions is demonstrated in , the values were the 20-year average
. In Northeast China, East China and Central China, TEM became the main influencing factor on NDVI change, while in North China, South China and Northwest China, PRE was the main influencing factor. The
value of PRE in Northwest China (0.604) was much higher than that of TEM (0.174). The
values of TEM and PRE in Southwest China slightly different from each other, that is, 0.663 and 0.599, respectively. PRE and TEM played different roles in seven sub-regions under different geographic and geomorphic conditions. Moreover, the
value of PRE
TEM in seven sub-regions was all above 0.72, indicating that the response of vegetation to climate was controlled by the interaction of PRE and TEM.
Figure 12. The 20-year averaged values of PRE, TEM and PRE
TEM in seven sub-regions.
Risk_detector was adopted to explore the suitable PRE/TEM of vegetation growth. The detector analysis was based on the partitions of PRE and TEM, as displayed in . A few grid points were located in partitions of 157.57 ∼ 256.49 mm and 256.49 ∼ 415.42 mm, as shown in (a), so the two partitions were ignored and PRE was divided into seven partitions labeled as 1 ∼ 7. There were nine TEM partitions, as shown in (b), labeled as 1 ∼ 9. The detector results of PRE and TEM are listed in . (a and c) lists the mean values of NDVI in each PRE/TEM partition. (b and d) shows the statistics of whether a significant difference of NDVI existed in two of the PRE/TEM partitions, with ‘Y’ meaing Significant, and ‘N’ meaning Non-significant. As seen from (a), sorted by NDVI from largest to smallest, the corresponding PRE partition sequence of 7 > 5 > 6 > 4 > 3 > 2 > 1 indicated that there was a weak positive correlation between NDVI and precipitation, the mean value of NDVI was the largest (0.85) in the 7th partition (102.43 ∼ 157.57 mm). At the same time, (b) shows that there was a significant difference between partition 7 and the other PRE partitions, which indicates that the most suitable PRE for vegetation growth is 102.43 ∼ 157.57 mm. Similarly, the order of TEM partition sequence was 9 > 8 > 4 > 3 > 7 > 5 > 6 > 2 > 1. The mean value of NDVI was the largest (0.79) in the 9th TEM partition (> 20°C) ((c)). Furthermore, there was a significant difference between TEM partition 9 and the other TEM partitions ((d)), indicating better vegetation growth when TEM was above 20°C.
Table 3. The Risk_detector results of PRE and TEM.
4. Discussion
On the basis of the above quantitative analysis, the results were further discussed according to the distributions of 20-year average NDVI, PRE and TEM. Several representative areas were indicated by rectangular boxes in for a better graphic description based on . The NDVI of the whole study area gradually decreased from the southeast to the northwest in the last 20 years (), and its distribution was consistent with that of PRE (). The quantitative analysis of Factor_detector also verified that PRE had a greater influence on vegetation growth than TEM ().
Figure 13. Several representative areas were indicated by rectangular boxes based on .
NDVI area was mainly located in Tarim Basin (Region A), Qaidam Basin (Region B) and Alexa Plateau (Region C). Tarim Basin belongs to a warm and dry climate, basically in Gobi and Taklimakan deserts with an annual average TEM of 9 ∼ 11°C (Abbas et al. Citation2021). The study in the Tarim River Basin indicated that the vegetation coverage of the growing season was positively correlated with surface TEM and rain, although the latter had a better correlation coefficient (Jiang et al. Citation2022). Qaidam Basin is characterized by a plateau continental climate, with dry and cold winters and arid and windy summers. The growing season is from May to October. The mean annual TEM is 4.5°C, and the mean TEM in the growing season can reach 12°C (Han et al. Citation2021). The Alxa Plateau is in a dry non-monsoon area, and the Qinghai-Tibet Plateau in its south blocks the humid airstream from the Indian Ocean, following unusually a dry and hot climate (Wang et al. Citation2022). The drought activity on account of less PRE and evapotranspiration of higher air TEM in Tarim Basin, Qaidam Basin and Alxa Plateau, results in very sparse vegetation on the surface (Yang et al. Citation2022; Jiang et al. Citation2018; Jin et al. Citation2021). Take the Taklamakan Desert as an example, a moderate negative correlation is displayed between the TEM and the NDVI under drought conditions (Abbas et al. Citation2021). However, in recent years, the climate transition from warm-dry to warm-humid with TEM increasing and more PRE in Qaidam Basin under global warming, we can also find that the vegetation in Qaidam Basin has been continuously improved, as shown in . An increased PRE was generally followed by an increase in the vegetation coverage in dry lands (Guo et al. Citation2021; Shi et al. Citation2021; Gao et al. Citation2022; Song et al. Citation2021; Han et al. Citation2021). In the Qinghai-Tibet Plateau (Region D), vegetation species and coverage decreased from southeast to northwest (Zhang, Fang, and Liu Citation2022). The Kunlun Mountain area in the northwest of the Plateau was the typical area of low vegetation caused by drought and low TEM and showed continuous degradation (). Existing studies had presented consistent conclusions with ours (Pang, Wang, and Yang Citation2017). The reduction in vegetation in recent years may be attributable to permafrost degradation caused by climate warming and increasing anthropogenic activity (Yang et al. Citation2010; Chen et al. Citation2013; Chen et al. Citation2014; Xu, Wang, and Zhang Citation2016).
Tianshan Mountain (Region E) is a special region in the northwest of the study area. There is a dense primeval forest distributed in the northern piedmont of the Tianshan Mountains that benefited from low TEM, high PRE and small evapotranspiration. While in the southern piedmont, the vegetable is mostly flat grasslands with a climate of high TEM, low PRE and high evapotranspiration (Liu, Yan, and Jiang Citation2021; Zheng et al. Citation2021). But there has been an obvious trend of degeneration in recent 20 years (). Li et al. suggested that soil moisture deficit played a greater role in the recent browning of vegetation on Tianshan Mountain (Li, Chen, et al. Citation2021). The southeast valley of the Qinghai-Tibet Plateau (Region F), also known as the Brahmaputra Valley, has abundant vegetation with a climate of abundant PRE and an annual average TEM of 20°C, affected by the warm and humid southwest monsoon over the Indian Ocean. Climate change was the most crucial driver of vegetation change in this area, and human disturbance was responsible for abrupt changes in vegetation (Liu, Liu, et al. Citation2021). In addition, studies on Loess Plateau (Region G) vegetation indicated that drought was the primary climate factor for the vegetation decreasing in the Loess Plateau, human activities have contributed more to the improvement and degradation of vegetation (Zheng et al. Citation2021) and the spatial pattern of the cumulative afforestation driven by the Grain for Green Project matched quite well with the NDVI change trend (Shi et al. Citation2021; Zhao et al. Citation2019).
The PRE-induced change of NDVI is mainly determined by the water use efficiency of vegetation. Climate warming may exacerbate evapotranspiration and reduce soil moisture, limiting vegetation growth in the case of limited PRE (Rousta et al. Citation2022; Zhao et al. Citation2022). The increase of TEM can improve photosynthetic efficiency and prolong vegetation growth season, thus promoting vegetation growth (Gao et al. Citation2022; Dragoni et al. Citation2011). The above analysis reconfirmed that the response of vegetation to climate was dominated by the interaction of PRE and TEM ().
5. Conclusion
Based on MODIS NDVI data, ERA5-land PRE and TEM data from 2001 to 2020, this study presented the spatial–temporal variations of NDVI and its response to PRE/TEM in China and its seven sub-regions. The following conclusions could be drawn based on the above analysis.
The inter-annual variations of NDVI were investigated by linear regression analysis at the regional scale. The 20-year averaged NDVI over China was about 0.525 and the inter-annual growth rate of NDVI was 0.0021/yr in the 20 years. Seven sub-regions could be divided into three clear groups according to the serial intervals of NDVI: the NDVIs of Northeast China, Central China, East China and South China were in the high range (0.7 ∼ 0.9), the NDVIs of North China and Southwest China were in medium levels (0.4 ∼ 0.6), and the NDVI of Northwest China was the lowest (0.2 ∼ 0.3). The inter-annual growth rates of Northeast China, North China, South China and Northwest China were all greater than 0.0024/yr. The inter-annual growth in East China was the lowest. The inter-annual growth rates of NDVI in China at a seasonal scale were Spring (0.0023/yr) > Winter (0.0022/yr) > Autumn (0.0021/yr) > Summer (0.0018/yr).
The spatial distribution of vegetation growth trend was analyzed with Sen-slope estimation and MK test at pixel scale. The improved area of vegetation accounted for nearly 70% of the total study area and was much higher than the degraded area (about 11.6%), showing a good growth trend. The analysis with seasonal scale indicated that vegetation degradation was concentrated in East China and Southwest China in summer. Among all seasons, the vegetation in Central China and South China improved the most obviously in autumn. The vegetation of Northeast China had a remarkable degradation in autumn and winter, especially in winter.
The association between NDVI and climatic factors was explored by Geodetector at the regional scale. The result of Factor_detector reflected the influence degree of PRE (q = 0.54, P < 0.01) was greater than that of TEM (q = 0.27, P < 0.01) in the control of the spatial distribution of NDVI over China. The interaction influence degree q of PRE
Acknowledgments
The authors are grateful to NASA for providing the Terra MODIS NDVI dataset (http://earthdata.nasa.gov), and the ECMWF for providing the ERA5-Land dataset (https://www.ecmwf.int/en/forecasts/datasets/browse-reanalysis-datasets).
Disclosure statement
No potential conflict of interest was reported by the author(s).
Data availability statement
The data that support the findings of this study are openly available in ‘figshare’ at https://doi.org/10.6084/m9.figshare.19556506.
Additional information
Funding
References
- Abbas, A., L. L. Jin, Q. He, B. Lu, J. Q. Yao, Z. J. Li, and A. Salam. 2021. “Temporal and Spatial Variations of the Air Temperature in the Taklamakan Desert and Surrounding Areas.” Theoretical and Applied Climatology 144 (3-4): 873–884. doi:10.1007/s00704-020-03501-z.
- Abbes, Ali Ben, Oumayma Bounouh, Imed Riadh Farah, Rogier de Jong, and Beatriz Martínez. 2018. “Comparative Study of Three Satellite Image Time-Series Decomposition Methods for Vegetation Change Detection.” European Journal of Remote Sensing 51 (1): 607–615. doi:10.1080/22797254.2018.1465360.
- Ali, Rawshan, Alban Kuriqi, Shadan Abubaker, and Ozgur Kisi. 2019. “Long-Term Trends and Seasonality Detection of the Observed Flow in Yangtze River Using Mann-Kendall and Sen’s Innovative Trend Method.” Water 11 (9), doi:10.3390/w11091855.
- An, Y., W. Gao, Z. Gao, C. Liu, and R. Shi. 2015. “Trend Analysis for Evaluating the Consistency of Terra MODIS and SPOT VGT NDVI Time Series Products in China.” Frontiers of Earth Science 9 (1): 125–136. doi:10.1007/s11707-014-0428-9.
- Bondeau, A., D. W. Kicklighter, J. Kaduk, and E. Participants O. F. ThE Potsdam NpP Model Intercomparison Th. 1999. “Comparing Global Models of Terrestrial Net Primary Productivity (NPP): Importance of Vegetation Structure on Seasonal NPP Estimates.” Global Change Biology 5 (S1): 35–45. doi:10.1046/j.1365-2486.1999.00005.
- Cao, Ran, Weiguo Jiang, Lihua Yuan, Wenjie Wang, Zhongliang Lv, and Chen Zheng. 2014. “Inter-Annual Variations in Vegetation and Their Response to Climatic Factors in the Upper Catchments of the Yellow River from 2000 to 2010.” Journal of Geographical Sciences 24 (6): 963–979. doi:10.1007/s11442-014-1131-1.
- Chen, Jie, Tonghua Wu, Defu Zou, Lin Liu, Xiaodong Wu, Wenyu Gong, Xiaofan Zhu, et al. 2022. “Magnitudes and Patterns of Large-Scale Permafrost Ground Deformation Revealed by Sentinel-1 InSAR on the Central Qinghai-Tibet Plateau.” Remote Sensing of Environment 268: Article 112778. doi:10.1016/j.rse.2021.112778.
- Chen, Ting, Jun Xia, Lei Zou, and Si Hong. 2020. “Quantifying the Influences of Natural Factors and Human Activities on NDVI Changes in the Hanjiang River Basin, China.” Remote Sensing 12 (3780): 1–21. doi:10.3390/rs12223780.
- Chen, Baoxiong, Xianzhou Zhang, Jian Tao, Jianshuang Wu, Jingsheng Wang, Peili Shi, Yangjian Zhang, and Chengqun Yu. 2014. “The Impact of Climate Change and Anthropogenic Activities on Alpine Grassland Over the Qinghai-Tibet Plateau.” Agricultural and Forest Meteorology 189-190: 11–18. doi:10.1016/j.agrformet.2014.01.002.
- Chen, H., Q. A. Zhu, C. H. Peng, N. Wu, Y. F. Wang, X. Q. Fang, Y. H. Gao, et al. 2013. “The Impacts of Climate Change and Human Activities on Biogeochemical Cycles on the Qinghai-Tibetan Plateau.” Global Change Biology 19 (10): 2940–2955. doi:10.1111/gcb.12277.
- Chu, Hongshuai, Sergey Venevsky, Chao Wu, and Menghui Wang. 2019. “NDVI-based Vegetation Dynamics and its Response to Climate Changes at Amur-Heilongjiang River Basin from 1982 to 2015.” Science of the Total Environment 650: 2051–2062. doi:10.1016/j.scitotenv.2018.09.115.
- Chuai, X. W., X. J. Huang, W. J. Wang, and G. Bao. 2013. “NDVI, Temperature and Precipitation Changes and their Relationships with Different Vegetation Types During 1998–2007 in Inner Mongolia, China.” International Journal of Climatology 33 (7): 1696–1706. doi:10.1002/joc.3543.
- Crippen, Robert E. 1990. “Calculating the Vegetation Index Faster.” Remote Sensing of Environment 34 (1): 71–73. doi:10.1016/0034-4257(90)90085-Z.
- de Jong, Rogier, Sytze de Bruin, Allard de Wit, Michael E. Schaepman, and David L. Dent. 2011. “Analysis of Monotonic Greening and Browning Trends from Global NDVI Time-Series.” Remote Sensing of Environment 115 (2): 692–702. doi:10.1016/j.rse.2010.10.011.
- Dragoni, D., H. P. Schmid, C. A. Wayson, H. Potter, C. S. B. Grimmond, and J. C. Randolph. 2011. “Evidence of Increased Net Ecosystem Productivity Associated with a Longer Vegetated Season in a Deciduous Forest in South-Central Indiana, USA.” Global Change Biology 17 (2): 886–897. doi:10.1111/j.1365-2486.2010.02281.x.
- Eckert, Sandra, Fabia Hüsler, Hanspeter Liniger, and Elias Hodel. 2015. “Trend Analysis of MODIS NDVI Time Series for Detecting Land Degradation and Regeneration in Mongolia.” Journal of Arid Environments 113: 16–28. doi:10.1016/j.jaridenv.2014.09.001.
- Fang, J. Y., S. L. PIAO, J. S. HE, and W. H. MA. 2004. “Increasing Terrestrial Vegetation Activity in China, 1982—1999.” Science in China(Series C:Life Sciences) 47 (3): 229–240. doi:10.1360/03yc0068.
- Fang, Lulu, Lunche Wang, Wanxu Chen, Jia Sun, Qian Cao, Shaoqiang Wang, and Lizhe Wang. 2021. “Identifying the Impacts of Natural and Human Factors on Ecosystem Service in the Yangtze and Yellow River Basins.” Journal of Cleaner Production 314: 127995. doi:10.1016/j.jclepro.2021.127995.
- Fensholt, R., T. Langanke, K. Rasmussen, A. Reenberg, S. Prince, C. Tucker, R. J. Scholes, et al. 2012. “Greenness in Semi-Arid Areas Across the Globe 1981-2007.” Remote Sensing of Environment 121: 144–158. doi:10.1016/j.rse.2012.01.017.
- Fensholt, R., and S. R. Proud. 2012. “Evaluation of Earth Observation Based Global Long Term Vegetation Trends - Comparing GIMMS and MODIS Global NDVI Time Series.” Remote Sensing of Environment 119: 131–147. doi:10.1016/j.rse.2011.12.015.
- Fensholt, R., K. Rasmussen, T. T. Nielsen, and C. Mbow. 2009. “Evaluation of Earth Observation Based Long Term Vegetation Trends - Intercomparing NDVI Time Series Trend Analysis Consistency of Sahel from AVHRR GIMMS, Terra MODIS and SPOT VGT Data.” Remote Sensing of Environment 113 (9): 1886–1898. doi:10.1016/j.rse.2009.04.004.
- Gao, Jiangbo, Kewei, Jiao, and Shaohong, Wu. 2019. “Investigating the Spatially Heterogeneous Relationships Between Climate Factors and NDVI in China During 1982 to 2013.” Journal of Geographical Sciences 29 (10): 1597–1609. doi:10.1007/s11442-019-1682-2.
- Gao, Wande, Ce Zheng, Xiuhua Liu, Yudong Lu, Yunfei Chen, Yan Wei, and Yandong Ma. 2022. “NDVI-based Vegetation Dynamics and Their Responses to Climate Change and Human Activities from 1982 to 2020: A Case Study in the Mu Us Sandy Land, China.” Ecological Indicators 137: 108745. doi:10.1016/j.ecolind.2022.108745.
- Guo, Enliang, Yongfang Wang, Cailin Wang, Zhongyi Sun, Yulong Bao, Naren Mandula, Buren Jirigala, Yuhai Bao, and He Li. 2021. “NDVI Indicates Long-Term Dynamics of Vegetation and Its Driving Forces from Climatic and Anthropogenic Factors in Mongolian Plateau.” Remote Sensing 13 (4): 688. doi:10.3390/rs13040688.
- Haas, J., and Y. Ban. 2014. “Urban Growth and Environmental Impacts in Jing-Jin-Ji, the Yangtze, River Delta and the Pearl River Delta - ScienceDirect.” International Journal of Applied Earth Observation and Geoinformation 30 (1): 42–55. doi:10.1016/j.jag.2013.12.012.
- Han, Jinjun, Jianping Wang, Liang Chen, Jiangyun Xiang, Zhiyong Ling, Qingkuan Li, and Erlong Wang. 2021. “Driving Factors of Desertification in Qaidam Basin, China: An 18-Year Analysis Using the Geographic Detector Model.” Ecological Indicators 124: 107404. doi:10.1016/j.ecolind.2021.107404.
- Hou, Wenjuan, Jiangbo Gao, Shaohong Wu, and Erfu Dai. 2015. “Interannual Variations in Growing-Season NDVI and Its Correlation with Climate Variables in the Southwestern Karst Region of China.” Remote Sensing 7 (9), doi:10.3390/rs70911105.
- Huete, A., K. Didan, T. Miura, E. P. Rodriguez, X. Gao, and L. G. Ferreira. 2002. “Overview of the Radiometric and Biophysical Performance of the MODIS Vegetation Indices.” Remote Sensing of Environment 83 (1-2): 195–213. doi:10.1016/S0034-4257(02)00096-2.
- Jiang, Y. L., R. H. Wang, Q. Peng, X. Q. Wu, H. S. Ning, and C. Li. 2018. “The Relationship Between Drought Activity and Vegetation Cover in Northwest China from 1982 to 2013.” NATURAL HAZARDS 92: 145–163. doi:10.1007/s11069-018-3282-3.
- Jiang, Ning, Qinqin Zhang, SiCong Zhang, Xiaomeng Zhao, and Hong Cheng. 2022. “Spatial and Temporal Evolutions of Vegetation Coverage in the Tarim River Basin and Their Responses to Phenology.” CATENA 217: 106489. doi:10.1016/j.catena.2022.106489.
- Jin, Haoyu, Xiaohong Chen, Yuming Wang, Ruida Zhong, Tongtiegang Zhao, Zhiyong Liu, and Xinjun Tu. 2021. “Spatio-temporal Distribution of NDVI and its Influencing Factors in China.” Journal of Hydrology 603: 127129. doi:10.1016/j.jhydrol.2021.127129.
- Joaquín, Muoz-Sabater, Emanuel Dutra, Agustí-Panareda Anna, Albergel Clément, Gabriele Arduini, Gianpaolo Balsamo, Souhail Boussetta, et al. 2021. “ERA5-Land: A State-of-the-Art Global Reanalysis Dataset for Land Applications.” Earth System Science Data 13 (9): 4349–4383. doi:10.5194/essd-13-4349-2021.
- Kendall, M.G. 1975. Rank Correlation Methods 4th ed.. London: Charles Griffin.
- Kong, Dongxian, Chiyuan Miao, Jingwen Wu, Haiyan Zheng, and Sihong Wu. 2020. “Time lag of Vegetation Growth on the Loess Plateau in Response to Climate Factors: Estimation, Distribution, and Influence.” Science of the Total Environment 744: 140726. doi:10.1016/j.scitotenv.2020.140726.
- Law, B. E., E. Falge, L. Gu, D. D. Baldocchi, P. Bakwin, P. Berbigier, K. Davis, et al. 2002. “Environmental Controls Over Carbon Dioxide and Water Vapor Exchange of Terrestrial Vegetation.” Agricultural and Forest Meteorology 113 (1): 97–120. doi:10.1016/S0168-1923(02)00104-1.
- Levine, Jonathan M. 2016. “Ecology: A Trail Map for Trait-based Studies.” Nature 529 (7585): 163–164. doi:10.1038/nature16862.
- Li, Yupeng, Yaning Chen, Fan Sun, and Zhi Li. 2021. “Recent Vegetation Browning and its Drivers on Tianshan Mountain, Central Asia.” Ecological Indicators 129: 107912. doi:10.1016/j.ecolind.2021.107912.
- Li, P., J. Wang, M. Liu, Z. Xue, A. Bagherzadeh, and M. Liu. 2021. “Spatio-Temporal Variation Characteristics of NDVI and its Response to Climate on the Loess Plateau from 1985 to 2015.” CATENA 203: 105331. doi:10.1016/j.catena.2021.105331.
- Li, Ying, Shuhui Zhang, Jingting Han, Yi Zhao, Quan Han, Liyun Wu, Xin Wang, Ziyi Qiu, Tongqian Zou, and Cheng Fan. 2022. “A Study of the Temporal and Spatial Variations in the Suitability of the Environment in Chinese Cities for Tourism and in Strategies for Optimizing the Environment.” International Journal of Digital Earth 15 (1): 527–552. doi:10.1080/17538947.2022.2041117.
- Liu, Ya, Yan Li, Shuangcheng Li, and Safa Motesharrei. 2015. “Spatial and Temporal Patterns of Global NDVI Trends: Correlations with Climate and Human Factors.” Remote Sensing 7: 13233–13250. doi:10.3390/rs71013233.
- Liu, Qionghuan, Linshan Liu, Yili Zhang, Zhaofeng Wang, Jianshuang Wu, Lanhui Li, Shicheng Li, and Basanta Paudel. 2021. “Identification of Impact Factors for Differentiated Patterns of NDVI Change in the Headwater Source Region of Brahmaputra and Indus, Southwestern Tibetan Plateau.” Ecological Indicators 125: 107604. doi:10.1016/j.ecolind.2021.107604.
- Liu, S. L., X. K. Su, S. K. Dong, F. Y. Cheng, H. D. Zhao, X. Y. Wu, X. Zhang, and J. R. Li. 2015. “Modeling Aboveground Biomass of an Alpine Desert Grassland with SPOT-VGT NDVI.” GISCIENCE & REMOTE SENSING 52 (6): 680–699. doi:10.1080/15481603.2015.1080143.
- Liu, Chao, Xiaoyue Yan, and Fengqing Jiang. 2021. “Desert Vegetation Responses to the Temporal Distribution Patterns of Precipitation Across the Northern Xinjiang, China.” CATENA 206: 105544. doi:10.1016/j.catena.2021.105544.
- Mann, H. B. 1945. “Nonparametric Tests Against Trend.” Econometrica 13 (3): 245–259. doi:10.2307/1907187.
- Nie, Tong, Guotao Dong, Xiaohui Jiang, and Yuxin Lei. 2021. “Spatio-Temporal Changes and Driving Forces of Vegetation Coverage on the Loess Plateau of Northern Shaanxi.” Remote Sensing 13: 613. doi:10.3390/rs13040613.
- Olafsson, Haraldur, and Iman Rousta. 2021. “Influence of Atmospheric Patterns and North Atlantic Oscillation (NAO) on Vegetation Dynamics in Iceland Using Remote Sensing.” European Journal of Remote Sensing 54 (1): 351–363. doi:10.1080/22797254.2021.1931462.
- Pang, Guojin, Xuejia Wang, and Meixue Yang. 2017. “Using the NDVI to Identify Variations in, and Responses of, Vegetation to Climate Change on the Tibetan Plateau from 1982 to 2012.” Quaternary International 444: 87–96. doi:10.1016/j.quaint.2016.08.038.
- Piao, S. L., J. Y. Fang, L. M. Zhou, Q. H. Guo, M. Henderson, W. Ji, Y. Li, and S. Tao. 2003. “Interannual Variations of Monthly and Seasonal Normalized Difference Vegetation Index (NDVI) in China from 1982 to 1999.” Journal of Geophysical Research Atmospheres 108 (D14): 4401. doi:10.1029/2002JD002848.
- Qi, X., J. Jia, H. Liu, and Z. Lin. 2019. “Relative Importance of Climate Change and Human Activities for Vegetation Changes on China's Silk Road Economic Belt Over Multiple Timescales – ScienceDirect.” CATENA 180: 224–237. doi:10.1016/j.catena.2019.04.027.
- Rhif, Manel, Ali Ben Abbes, Beatriz Martinez, Rogier de Jong, Yanfange Sang, and Imed Riadh Farah. 2022. “Detection of Trend and Seasonal Changes in Non-stationary Remote Sensing Data: Case Study of Tunisia Vegetation Dynamics.” Ecological Informatics 69: 101596. doi:10.1016/j.ecoinf.2022.101596.
- Rhif, Manel, Ali Ben Abbes, Beatriz Martinez, and Imed Riadh Farah. 2021. “An Improved Trend Vegetation Analysis for Non-stationary NDVI Time Series Based on Wavelet Transform.” Environmental Science and Pollution Research 28: 46603–46613. doi:10.1007/s11356-020-10867-0.
- Rousta, I., M. Moniruzzaman, H. Olafsson, H. Zhang, P. Baranowski, P. Tkaczyk, H. Lipinska, A. Kepkowicz, and J. Krzyszczak. 2022. “Investigation of the Vegetation Coverage Dynamics and its Relation to Atmospheric Patterns in Kabul River Basin in Afghanistan.” Pure and Applied Geophysics, 2022-05-21. doi:10.1007/s00024-022-03044-6.
- Rousta, Iman, Haraldur Olafsson, Md Moniruzzaman, Jonas Ard, Hao Zhang, Terence Darlington Mushore, Shifa Shahin, and Saiful Azim. 2020. “The 2000–2017 Drought Risk Assessment of the Western and Southwestern Basins in Iran.” Modeling Earth Systems and Environment 6: 1201–1221. doi:10.1007/s40808-020-00751-8.
- Savitzky, Abraham, and Mje Golay. 1964. “Smoothing and Differentiation of Data by Simplified Least Squares Procedures.” Analytical Chemistry 36 (8): 1627–1639. doi:10.1021/ac60214a047.
- Schnur, M. T., H. Xie, and X. Wang. 2010. “Estimating Root Zone Soil Moisture at Distant Sites Using MODIS NDVI and EVI in a Semi-Arid Region of Southwestern USA.” Ecological Informatics 5: 400–409. doi:10.1016/j.ecoinf.2010.05.001.
- Shi, Shangyu, Jingjie Yu, Fei Wang, Ping Wang, Yichi Zhang, and Kai Jin. 2021. “Quantitative Contributions of Climate Change and Human Activities to Vegetation Changes Over Multiple Time Scales on the Loess Plateau.” Science of the Total Environment 755: 142419. doi:10.1016/j.scitotenv.2020.142419.
- Slocum, T. A. 1999. Thematic Cartography and Visualization. Upper Saddle River, NJ: Pearson Prentice Hall.
- Song, G., J. T. Huang, B. H. Ning, J. W. Wang, and L. Zeng. 2021. “Effects of Groundwater Level on Vegetation in the Arid Area of Western China.” China Geology 3: 527–535. doi:10.31035/cg2021062.
- Sun, Y., Y. Yang, Z. Li, and Z. Wang. 2015. “The Relative Roles of Climate Variations and Human Activities in Vegetation Change in North China.” Physics & Chemistry of the Earth 87-88: 67–78. doi:10.1016/j.pce.2015.09.017.
- Wang, J., X. Li, G. Christakos, Y. Liao, T. Zhang, X. Gu, and X. Zheng. 2010. “Geographical Detectors-Based Health Risk Assessment and its Application in the Neural Tube Defects Study of the Heshun Region, China.” International Journal of Geographical Information Science 24 (1): 107–127. doi:10.1080/13658810802443457.
- Wang, Sinan, Ruiping Li, Yingjie Wu, and Shuixia Zhao. 2022. “Vegetation Dynamics and Their Response to Hydrothermal Conditions in Inner Mongolia, China.” Global Ecology and Conservation 34: e02034. doi:10.1016/j.gecco.2022.e02034.
- Wang, Yichen, ChenGuang Liu, Qiyuan Wang, Quande Qin, Honghao Ren, and Junji Cao. 2021. “Impacts of Natural and Socioeconomic Factors on PM2.5 from 2014 to 2017 - ScienceDirect.” Journal of Environmental Management 284: 112071. doi:10.1016/j.jenvman.2021.112071.
- Wang, J., T. Zhang, and B. Fu. 2016. “A Measure of Spatial Stratified Heterogeneity.” Ecological Indicators 67: 250–256. doi:10.1016/j.ecolind.2016.02.052.
- Wen, Zhaofei, Shengjun Wu, Jilong Chen, and Mingquan Lue. 2017. “NDVI Indicated Long-Term Interannual Changes in Vegetation Activities and Their Responses to Climatic and Anthropogenic Factors in the Three Gorges Reservoir Region, China.” Science of the Total Environment 574: 947–959. doi:10.1016/j.scitotenv.2016.09.049.
- Xu, Hao-jie, Xin-ping Wang, and Xiao-xiao Zhang. 2016. “Alpine Grasslands Response to Climatic Factors and Anthropogenic Activities on the Tibetan Plateau from 2000 to 2012.” Ecological Engineering 92: 251–259. doi:10.1016/j.ecoleng.2016.04.005.
- Yang, Linshan, Qi Feng, Meng Zhu, Liuming Wang, Mohammad Reza Alizadeh, Jan F. Adamowski, Xiaohu Wen, and Zhenliang Yin. 2022. “Variation in Actual Evapotranspiration and its Ties to Climate Change and Vegetation Dynamics in Northwest China.” Journal of Hydrology 607: 127533. doi:10.1016/j.jhydrol.2022.127533.
- Yang, Meixue, Frederick E. Nelson, Nikolay I. Shiklomanov, Donglin Guo, and Guoning Wan. 2010. “Permafrost Degradation and its Environmental Effects on the Tibetan Plateau: A Review of Recent Research.” Earth-Science Reviews 103 (1): 31–44. doi:10.1016/j.earscirev.2010.07.002.
- Yuan, Jia, Youpeng Xu, Jie Xiang, Lei Wu, and Danqing Wang. 2019. “Spatiotemporal Variation of Vegetation Coverage and its Associated Influence Factor Analysis in the Yangtze River Delta, Eastern China.” Environmental Science and Pollution Research 26 (32): 32866–32879. doi:10.1007/s11356-019-06378-2.
- Zhang, Ju, Shibo Fang, and Hanhu Liu. 2022. “Estimation of Alpine Grassland Above-Ground Biomass and its Response to Climate on the Qinghai-Tibet Plateau During 2001 to 2019.” Global Ecology and Conservation 35: e02065. doi:10.1016/j.gecco.2022.e02065.
- Zhang, Qiang, Tianyao Qi, Jianfeng Li, Vijay P. Singh, and Zongzhi Wang. 2015. “Spatiotemporal Variations of Pan Evaporation in China During 1960-2005: Changing Patterns and Causes.” International Journal of Climatology 35: 903–912. doi:10.1002/joc.4025.
- Zhang, Mengman, and Xiuqin Wu. 2020. “The Rebound Effects of Recent Vegetation Restoration Projects in Mu Us Sandy Land of China.” Ecological Indicators 113: 106228. doi:10.1016/j.ecolind.2020.106228.
- Zhao, Fubo, Shuai Ma, Yiping Wu, Linjing Qiu, Wenke Wang, Yanqing Lian, Ji Chen, and Bellie Sivakumar. 2022. “The Role of Climate Change and Vegetation Greening on Evapotranspiration Variation in the Yellow River Basin, China.” Agricultural and Forest Meteorology 316: 108842. doi:10.1016/j.agrformet.2022.108842.
- Zhao, A. Z., A. B. Zhang, J. H. Liu, L. L. Feng, and Y. L. Zhao. 2019. “Assessing the Effects of Drought and “Grain for Green” Program on Vegetation Dynamics in China's Loess Plateau from 2000 to 2014.” CATENA 175: 446–455. doi:10.1016/j.catena.2019.01.013.
- Zheng, Kaiyuan, Linshan Tan, Yanwei Sun, Yanjuan Wu, Zheng Duan, Yu Xu, and Chao Gao. 2021. “Impacts of Climate Change and Anthropogenic Activities on Vegetation Change: Evidence from Typical Areas in China.” Ecological Indicators 126: 107648. doi:10.1016/j.ecolind.2021.107648.
- Zhu, Xian, Hong S. He, Shuoxin Zhang, William D. Dijak, and Yuanyuan Fu. 2019. “Interactive Effects of Climatic Factors on Seasonal Vegetation Dynamics in the Central Loess Plateau, China.” Forests 10 (12): 1071. doi:10.3390/f10121071.
- Zhu, Zaichun, Shilong Piao, Ranga B. Myneni, Mengtian Huang, Zhenzhong Zeng, Josep G. Canadell, Philippe Ciais, Stephen Sitch, Pierre Friedlingstein, and Almut Arneth. 2016. “Greening of the Earth and its Drivers.” Nature Climate Change, doi:10.1038/nclimate3004.