
 ?Mathematical formulae have been encoded as MathML and are displayed in this HTML version using MathJax in order to improve their display. Uncheck the box to turn MathJax off. This feature requires Javascript. Click on a formula to zoom.
ABSTRACT
The objective of disaster scenes is to share location-based risk information to a large audience in an effective and intuitive way. However, current studies on three-dimensional (3D) representation for dam-break floods have the following limitations: (1) they are lacking a reasonable logic to organize the whole process of dam-break floods, (2) they present information in a way that cannot be easily understood by laypersons. Geospatial storytelling helps to create exciting experiences and to explain complex relationships of geospatial phenomena. This article proposes a three-dimensional virtual representation method for the whole process of dam-break floods from a geospatial storytelling perspective. The creation of a storyline and a storytelling-oriented representation of dam-break floods are discussed in detail. Finally, a prototype system based on WebGL is developed to conduct an experiment analysis. The results of the experiment show that the proposed method can effectively support 3D representation of the spatiotemporal process of dam-break floods. Furthermore, the statistical results indicate that the storytelling is useful for assisting participants in understanding the occurrence and development of dam-break floods, and is applicable to the popularization of disaster science for the general public.
1. Introduction
The occurrence and development of disaster events are not independent of each other, and the successive disasters are linked in time and space (Ding et al. Citation2015; Shi et al. Citation2020). For example, strong earthquakes can not only cause damage to the structures but also generate some secondary geological disasters in mountainous areas (Bergman et al. Citation2014; Y. Zhang et al. Citation2020). As a typical secondary disaster, the dam-break flood is a geographical process induced by earthquakes, rainstorms, and landslides. It is characterized by sudden occurrence, rapid expansion, high velocity, and severe destruction, which poses a great threat to human lives and property for downstream areas (Y. Li et al. Citation2013; Xu, Yang, and Zhou Citation2017; Wang et al. Citation2021).
It is clear that structural measures (e.g. slope stabilization, flood control dams, etc.) are the most direct ways to mitigate flood hazards, but they are costly and over-reliance on them tends to give the public illusion that they are safe and secure (Meyer, Priest, and Kuhlicke Citation2012; Islam and Ryan Citation2015; Vidmar et al. Citation2019), leading to reduced risk awareness and reluctance to evacuate, which is known as the ‘optimistic bias’ and ‘safe illusion’ (Spittal et al. Citation2005; Day Citation2011; Evans et al. Citation2014). Optimistic bias is the belief that people always believe that negative events are less likely to happen to them than to others (W. Li et al. “An augmented representation method” Citation2021), while the safe illusion is that people are protected by levees or dams are more likely to ignore risks (Kundzewicz et al. Citation2018).
Non-structural mitigation measures are measures not involving physical construction, which use knowledge and practice to reduce flood risks (Islam and Ryan Citation2015). As an important component of non-structural mitigation measures, agent-based modeling (ABM) is becoming increasingly popular to address flood-related risk challenges in recent years, which has been applied in flood hydrological modeling, loss assessment, and risk management (Zhuo and Han Citation2020; Anshuka et al. Citation2022; Koo et al. Citation2020). However, most studies have focused on improving the accuracy of hydrological modeling or risk assessment at the technical and algorithmic levels, while neglecting people's awareness of and response to flood risk. From the author's perspective, the results of flood simulation and loss assessment are not only for decision making but also as an important medium of communication between the population at risk (PAR), stakeholders, and authorities (Bilali et al. Citation2022). In this context, knowledge communication related to floods plays a vital role in the aspect of increasing people's risk awareness (W. Li et al. “An augmented representation method” Citation2021; Zhuo and Han Citation2020). Moreover, as a complex geographical phenomenon, dam-break floods have strong spatio-temporal characteristics, and location-based risk communication plays a decisive role in helping the public understand their occurrence and development (Dransch, Rotzoll, and Poser Citation2010).
Disaster knowledge communication is a process of encoding and decoding disaster hazard or risk information. Professionals organize dam-break flood information by coding, and the public decodes to gain mitigation knowledge. However, with traditional media (e.g. cartoon brochures, books, newspapers, etc.) it is difficult to visualize flood hazard information vividly (W. Li et al. “An augmented representation method” Citation2021). Visual representations of animation or video not only enhance reading and perception, but also increase people's understanding of the dynamic process of disasters. Therefore, the combination of video and location-based risk communication can be an important medium for disaster science education.
Geographic information system (GIS) has been a useful tool for mapping flood risks and emergency management in most parts of the world, and many studies have proved that flood hazard/risk maps are efficient and valuable in disaster knowledge communication (Gaillard and Pangilinan Citation2010; Meyer, Priest, and Kuhlicke Citation2012; Ntajal et al. Citation2017; Z. Li et al. Citation2018; Henstra, Minano, and Thistlethwaite Citation2019). In 1998, US Vice-President AI Gore proposed a vision of ‘Digital Earth’ as a multi-resolution, three-dimensional (3D) representation of the planet, the global features of digital earth offer potential for environmental applications such as climate change, disaster management, air quality management, sustainable development (Craglia et al. Citation2012; Goodchild et al. Citation2012; C. Zhang et al. Citation2015). In terms of disaster management, digital earth allows the planning of collective rescue or mitigation measures after natural disasters and improved understanding of the interactions between human artificial spaces and natural environments (Craglia et al. Citation2012; Fu et al. Citation2021). As a core component of digital earth, 3D scenes provide a more intuitive option for understanding dam-break floods, it supports vividly display the details of flood information from an all-around perspective, which leaps forward in risk knowledge communication (Lai et al. Citation2011; Liao et al. Citation2017; Macchione et al. Citation2019; Chen and Lin Citation2018; W. Li et al. “A Rapid 3D Reproduction System” Citation2021). However, the current studies on dam-break flood maps or 3D representations have the following limitations that need to be addressed (Hagemeier-Klose and Wagner Citation2009; Meyer, Priest, and Kuhlicke Citation2012; Macchione et al. Citation2019): (1) They lack a reasonable logic structure to organize the whole process of dam-break floods; (2) They present the information in a way that cannot be easily understood by laypersons.
In this context, this article proposes a three-dimensional virtual representation method for dam-break floods from a geospatial storytelling perspective. The authors attempt to combine geospatial storytelling with 3D visualization to present dam-break floods. The creation of storylines and storytelling-oriented representations of dam-break floods are discussed in detail. We aim to tell people a dam-break flood story rather than providing a professional 3D scene, thus enhancing the public's understanding and risk perception of dam-break floods at a deeper level. The remainder of this article is organized as follows: Section 2.1 discusses the basic ideas of geospatial storytelling. Section 2.2 provides an overall framework of the proposed method. Sections 2.3 and 2.4 introduce the storyline. Section 2.5 introduces the storytelling-oriented representation and public cognition. Section 3 gives insight into the development of a prototype system and the experiment analysis. Sections 4 and 5 present the discussion and conclusion, respectively.
2. Methodology
2.1. Basic ideas of geospatial storytelling
From the perspective of people's cognition, it is easier to understand and remember information when it is packaged into a well-structured story (Gershon and Page Citation2001; Segel and Heer Citation2010; Paelke and Elias Citation2007; Çöltekin et al. Citation2020). Therefore, integrating the disaster information of dam-break floods to be transmitted into a story is an effective way for knowledge communication. There are many terms for storytelling, such as story maps, fictional cartography, narrative atlas, and geospatial storytelling. They are often not explicitly defined in the literature, but this demonstrates a growing interest in the relationship between maps and narratives (Kwan and Ding Citation2008; Caquard Citation2013; Roth Citation2021). In this article, geospatial storytelling is described as the use of the time-space framework to organize and present information, which tells the public stories about time, places, events in a geospatial context.
2.1.1. Time
Time is a fundamental characteristic of geospatial storytelling, which includes points in time and timelines. Points in time represent the story node of important events. The timeline can also be called the storyline, which can be linear, branched, or cyclic.
2.1.2. Place
Unlike literary narratives, geospatial storytelling combines high-precision maps and narrative structures to tell location-based stories. The place can trigger people's associations with the real geographic world and promote their understanding of specific events.
2.1.3. Event
The event is considered as the theme of geospatial storytelling, and the storyline is formed by linking the cause, process, and consequence of events. Geospatial storytelling is made up of some small events that form the nodes of a storyline.
2.2. Overall research framework
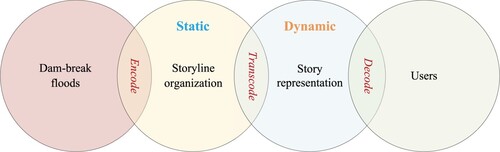
shows the overall research framework based on the geospatial storytelling of this article. We abstract the concepts and relationships of dam-break floods and encode them to form a storyline, whose story nodes are instantiated and transcoded to construct a story scene in 3D. Finally, the user gets knowledge of dam-break floods by decoding, which may trigger deeper thinking about flood risk and disaster awareness.
Figure 1. Overall research framework. It is a static and dynamic visual representation framework for dam-break floods. The static part is a storyline consisting of several story nodes and relationships, the dynamic part is a 3D scene of dam-break floods based on the storyline.
2.3. Storyline of dam-break flood scenes
The geospatial perspective explains ‘what, where, why, when, how’ for a given disaster (Bandrova, Zlatanova, and Konecny Citation2012). Therefore, to present a complete picture of a given disaster from a geospatial perspective, the virtual 3D scene should include the cause, the process, and the consequence of the disaster. The causes of the disaster explain ‘why did this disaster occur?’, the process shows ‘what, where, and when did this disaster occur?’, the consequence reveals ‘how about disaster losses?’. This section summarizes the relevant concepts and relationships in the story of dam-break floods from the above three aspects.
2.3.1. Collection of concepts
2.3.1.1 The cause
In this article, we mainly focus on a specific dam-break flood from barrier lakes formed from landslides, so the cause factors are earthquake, intense rainfall, landslide, and barrier lake, some of which are closely linked to each other (W. Liu et al. Citation2020; X. Li et al. Citation2021). As shown in .
Table 1. The cause factors and their descriptions.
2.3.1.2 The process
The spatio-temporal process enables people to better understand the trend development of dam-break floods, which includes occurrence time, location, arrival time, water depth, flow velocity, etc. As shown in .
Table 2. The process factors and their descriptions.
2.3.1.3 The consequence
The consequence describes the impact of dam-break floods on disaster-bearing bodies, such as affected buildings, affected roads, critical infrastructures, etc. As shown in .
Table 3. The consequence factors and their descriptions.
2.3.2. Collection of relationships
Due to the spatio-temporal nature of dam-break floods, the following three relationships exist between story nodes: semantic relationship, time relationship, and spatial relationship (Du and Gu Citation2016).
2.3.2.1 Semantic relationship
The main semantic relationships that exist in the case of dam-break floods are: (i) Is-a, an object is a subclass of another object; (ii) induce/inducedBy, which means the occurrence of one disaster event may lead to another event; (iii) hasPart/isPartof, a specific object is part of a disaster event; (iv) Amplify, where two disaster events simultaneously lead to the occurrence of another event, as shown in .
Table 4. Description for semantic relationships.
2.3.2.2 Time relationship
Time relationships are used to describe the sequence of events in dam-break floods, including points in time and time periods (Du and Gu Citation2016). We summarize time relationships in : (i) Before, an event occurs before another event; (ii) Meet, an event and another event meet at a point in time, but one event occurs first; (iii) Overlap, an event overlaps with another event for a certain period of time, but one event occurs first; (iv) Contain, the time period of an event contains another event.
Table 5. Description for time relationships.
2.3.2.3 Spatial relationship
All scene objects involved in dam-break floods have typical geographical properties, such as spatial location, spatial topology. Spatial location (e.g. spatial position, orientation) processes the registration of geographic position and orientation between different scene objects. Spatial topology enables the correct expression of the layout. In this article, we adopt three topological relationships proposed in W. Li et al. (Citation2019) to achieve seamless integration of the disaster objects in dam-break floods, which include adjacent, disjoint and overlap. These relationships are mainly used to solve problems such as occlusion, suspension and deep burial of models in the 3D scene.
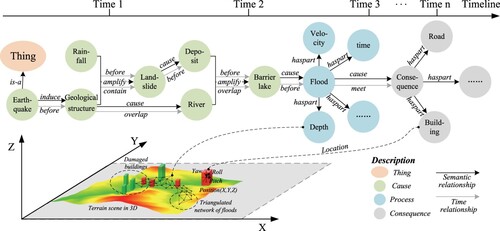
2.4. Time-space storyline
The time-space storyline of dam-break floods is constructed based on the logic of cause, process, and consequence of the disaster (). The start point of the storyline is thing, which is the class that represents the set containing all individuals. The storyline usually includes the following aspects. First, the impacts of historical earthquakes cause the loosening of the geological structure in parts of the disaster area, and the subsequent intense rainfall induces a landslide disaster. Second, the landslide created a large number of deposits block the river channel, and form a barrier lake. Third, when the barrier lake breaks, it creates a fast-flowing and destructive dam-break flood, which causes damage to buildings and roads downstream. Moreover, each node in the storyline has its attribute information, e.g. time, location, etc.
Figure 2. The storyline of dam-break floods.
2.5. Storytelling-oriented representation and public cognition
2.5.1. Node instantiation and representation
The event nodes and their relationships are statically recorded in the storyline. The instantiation of each node is the basis for constructing a story scene in 3D. Therefore, the authors propose the instantiation approach for typical events in dam-break floods.
2.5.1.1 Earthquake
Earthquake is such an extremely complex geographic process that it is difficult to realistically reproduce it in virtual 3D scenes, so a schematic approach is used to instantiate earthquake, as shown in Equation (Equation1(1)
(1) ).
(1)
(1) In the equation, V represents scene viewpoint;
and
represent the position and orientation of the camera in the 3D scene respectively; h, p, and r indicate heading, pitch, and roll; σ is a radian constant; t indicates a time state,
indicates the state of the camera at the previous moment, and
indicates the state of the camera at the current moment. Therefore, varying the heading parameter of the scene camera from
to
moments enables the 3D scene to be shaken and thus used to schematically present earthquakes.
2.5.1.2 Geological structure
Detailed representation of the geological structure is not possible without rock formation data within the mountain. The schematic representation of geological structure can be performed by using polylines and colors. Moreover, different frequencies of flicker can be used to control the showing and hiding of the information enhancement, as shown in Equation (Equation2(2)
(2) ).
(2)
(2) In the equation, t indicates a time state,
and
are two different moments;
and
represent a state at two different moments respectively;
indicates the state maintenance time, which can be used to determine the flicker frequency.
2.5.1.3 Rainfall
Particle systems are an effective approach for simulating realistic rainfall in 3D scenes (Abdillah, Basuki, and Harsono Citation2020). The structure of the particle system for rain includes position, speed, lifetime, texture, emission rate, size, etc. The properties of these particles undergo three processes of ‘generation’, ‘activity’, and ‘death’ over time, thus achieving the dynamic effect of rainfall.
2.5.1.4 Landslide
Landslide representation focuses on the spatiotemporal process from the landslide body to the deposit, which is constrained by the total volume and landslide boundaries (P. Huang et al. Citation2020). The total volume of landslide remains constant during a landslide, as shown in Equation (Equation3(3)
(3) ):
(3)
(3) In the equation,
indicates post-landslide volume,
indicates pre-landslide volume,
indicates landslide body volume,
indicates landslide deposit volume.
2.5.1.5 Barrier lake
Taking a polygon as the bottom surface, and the schematic effect of the barrier lake rise can be achieved by continuously changing the height attribute polygon and then intersecting with the 3D terrain scene.
2.5.1.6 Flood
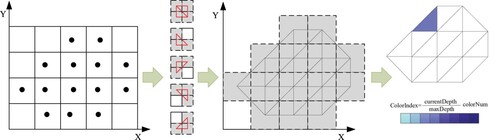
The flood simulation results at each moment include information on water depth, flow velocity, arrival time, etc. We take a cell of four adjacent cells as the basic unit and construct the triangular model by sequentially judging whether the water depth values in the cell are empty (M. Liu et al. Citation2017). Moreover, the water depth value at each moment and the continuous blue ribbon exhibited one-to-one mapping, as shown in .
Figure 3. The instantiation of dam-break flood process.
Finally, we organize these instantiation clips to generate a ‘dam-break flood story’ along the storyline to improve the people's understanding of the cause, process, and consequence of dam-break floods.
2.5.2. Cognitive evaluation of dam-break flood scenes
2.5.2.1 Experiment design and implementation process
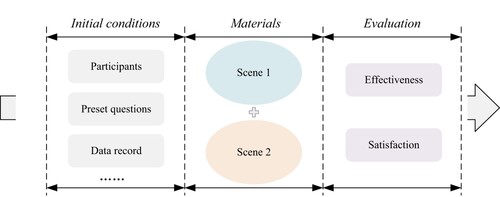
To prove the effectiveness of storytelling in knowledge communication, it is necessary to conduct a cognitive evaluation of dam-break flood scenes. The core idea of cognitive experiment design is shown in . The first step is to set some initial conditions, such as the number of participants, preset questions, etc. The second step is to prepare two comparative experiment materials and divide the participants into two groups to observe the above materials separately, after which they are required to answer the preset questions and record the results. The last step is to evaluate and analyze the above results.
Figure 4. Cognitive evaluation of dam-break flood scenes.
2.5.2.2 Analysis indices
As shown in . The analysis indices mainly include effectiveness and satisfaction. On the one hand, we use answer accuracy (‘true’ or ‘false’) to reflect the effectiveness of disaster information transmission. On the other hand, we use the Likert scale to collect the public direct feedback on effectiveness and satisfaction (a 5-point scale, with 5 being the highest rating, corresponding to ‘1: Not at all’, ‘2: Not much’, ‘3: Normal’, ‘4: Somewhat’, ‘5: Very’). The Likert scale does not require participants to provide simple and specific yes or no answers, which somewhat reduces the subjectivity of the respondents and makes it easier for them to answer the questions.
Table 6. Analysis indices.
3. Experiment analysis
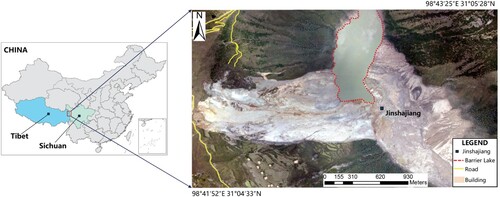
3.1. Study area and data description
In this article, the barrier lake in Baige village (), located at the border of Sichuan and Tibet, was selected as the study area for experiment analysis, as shown in . On October 10, 2018 and November 3, 2018, there were two large-scale landslides in Baige village, the deposits formed by the landslide blocked the mainstream of Jinshajiang River and formed a barrier lake, which posed a great threat to people's lives and properties in downstream. The original data used in this article were pre-disaster remote sensing images with a resolution of 2m and pre-disaster DEM with a resolution of 30 m, which were obtained from LocaSpace Viewer,Footnote1 an open and free 3D digital earth. The post-disaster remote sensing images with a resolution of 0.5 m and post-disaster DEM with a resolution of 2 m were obtained by drones. To improve the quality and effect of 3D representation of dam-break floods, we generated a series of tiles based on the post-disaster DEM (
) and post-disaster remote sensing images (
), loaded them through the terrainProvider interface and the imageryProvider interface respectively. Based on above mentioned data, we further generated thematic data such as buildings, roads and rivers, the time series data of landslide was generated by P. Huang et al. (Citation2020) through spatial interpolation. The time series data of flood process was simulated by Y. Li et al. (Citation2015) and W. Li et al. “A Rapid 3D Reproduction System” (Citation2021). The coordinate system of all data is GCS_WGS_1984.
Figure 5. Study area: the barrier lake in Baige village.
3.2. Prototype system implementation
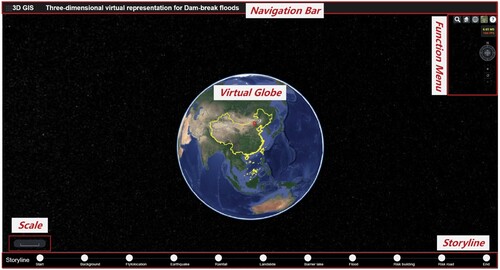
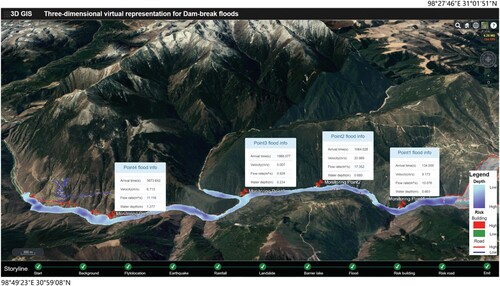
Based on WebGL and 3D visualization technology, we developed a prototype system with B/S architecture, which was used to perform three-dimensional virtual representation of dam-break floods. shows the interface of the system. The server side was built with Apache v2.2.34, the browser was Google Chrome 96.0.4664.110. The interface was designed and built base on HTML5, CSS, JavaScript, and Bootstrap.js v3.3.7. The 3D rendering engine used an open-source library Cesium.js v1.45. Cesium is more like a 3D GIS platform, which supports more GIS data formats. As the dam-break flood is a complex geographical phenomenon, we chose the more GIS-based Cesium platform for the visualization.
Figure 6. Interface of the prototype system. The prototype system consists of five main parts namely Navigation Bar, Function Menu, Scale, Storyline, and Virtual Globe. The Navigation Bar is used to run the system and load data, the Function Menu includes layer management, frame rate monitoring, compass, zoom, etc., the Scale records the zoom scale of the scene, the Storyline presents the progress of dam-break floods, and the Virtual Globe provides a 3D visualization of the whole process of dam-break floods.
The prototype system was run and tested on Lenovo Legion R9000P2021H. The processor was an AMD Ryzen 7 5800H with Radeon Graphics, with 16 GB memory and NVIDIA GeForce RTX 3060 Laptop GPU 6 GB. Besides the thread for data rendering, we opened a new thread using web worker for pre-loading dam-break flood data and storing. The aim is to improve the running smoothness of the system and the visualization efficiency of the dam-break flood. Therefore, the visualization efficiency of dam-break flood scenes can reach 160FPS.
3.3. Three-dimensional virtual representation of dam-break floods
We have organized the events involved in the various phases of the dam-break floods according to the course of the storyline, the status of the node in the storyline will be further updated as the dam-break flood develops, as shown in the bottom part of . The storyline in the prototype system helps users to easily understand the development of the dam-break flood process from a global level.
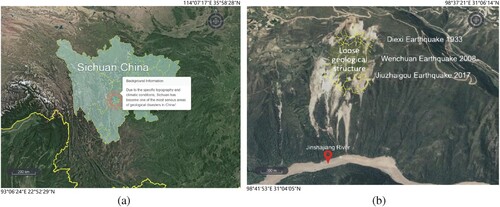
At the local level, the whole process of dam-break floods was represented in a virtual 3D scene. First, we introduced the story background of dam-break floods. For example, due to the specific topography and climatic conditions, Sichuan has become one of the most serious areas of geological disasters in China, the dynamic diffusion symbol schematically expressed the location of earthquakes in Sichuan, as shown in (a). Next, the scene camera flied to Jinshajiang River, the Diexi earthquake, Wenchuan earthquake, and Jiuzhaigou earthquake have continued to affect the geological structure of this area, a prone landslide has been formed under long-term gravity. The shaking of the 3D scene and yellow mesh represent earthquake and geological structure respectively, as shown in (b).
Figure 7. Representation of background, earthquake, and geological structure loose. (a) Background introduction and (b) Geological structure representation.
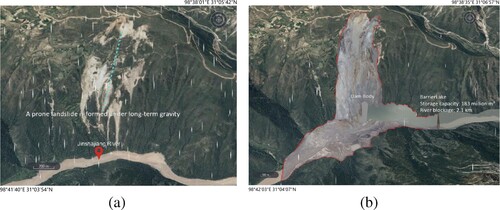
Along with a short-term intense rainfall, a large-scale landslide occurred in Baige village at the border of Sichuan and Tibet on October 10, 2018, as shown in (a). The spatial interpolation results of pre-and post-disaster DEM and post-disaster image was overlaid to show the impact range of landslide deposits. The deposits blocked the mainstream of the Jinshajiang River and formed a barrier lake. The water level in the upper reaches of the river continued to rise and the storage capacity of the barrier lake reached 183 million , as shown in (b). We combined the water level rise animation with text annotation to represent the formation of the barrier lake.
Figure 8. Representation of rainfall, landslide, and barrier lake. (a) The rainfall and landslide direction and (b) The landslide and barrier lake.
When the dam body breaks, the flood advanced sharply downstream. Four monitoring points were used to dynamically show the arrival time, flow velocity, flow rate, and water depth as the flood passes, as shown in . To represent the evolution of dam-break floods realistically, the water depth value was mapped to blue gradient color, which is more in line with the public perception. The darker the color, the greater the water depth. Regarding the representation of affected buildings and roads, the public prefers that they be represented in a simple ‘binary’ way. Therefore, red indicates danger, green and blue indicate safety, the risk degree criteria is beyond the scope of this article, the output of affected buildings and roads were provided and supported by Zhu et al. (Citation2016). To make it easier for readers to understand the whole process of dam-break floods, we have recorded the 3D representation story of dam-break floods into a video and uploaded it to YouTube.Footnote2
Figure 9. The spatiotemporal process representation of dam-break floods.
3.4. Comparative experiment
3.4.1. Experimental materials and procedure
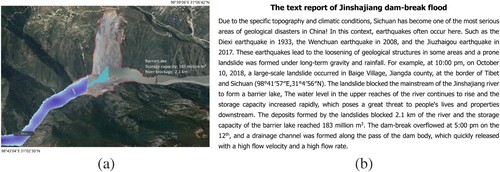
As described in Section 2.5.2, we prepared two comparative experiment materials, one is the storytelling video (85 s), which the screenshot in (a) belongs to. The other one is a text report (206 words) extracted from the recommendation issued by the disaster emergency department of the Sichuan Bureau of Surveying, Mapping, and Geoinformation,Footnote3 as shown in (b). This recommendation documented the entire process of the landslide causes, barrier lake formation, and dam-break flooding, the design of the storyline of dam-break flood scenes also referred to this recommendation. Under the principle of information equivalency, the authors think these two materials are trying to convey roughly the same disaster information, the difference is in the way they are presented.
Figure 10. The comparative materials of cognition experiment. (a) Screenshot of the video and (b) Text report.
Subsequently, the above comparative materials and preset questions were post in Chinese through a free survey site,Footnote4 and 82 participants participated in this comparative experiment, they were randomly assigned to two groups: group A and group B. The 37 participants in group A were asked to read the text report, the 45 participants in group B were asked to watch the storytelling video and then were required to answer the preset questions after watching the selected material (). Some questions were based on the work of H. M. Huang, Rauch, and Liaw (Citation2010), de Araujo Guerra Grangeia et al. (Citation2016), Dong et al. (Citation2020), G. Zhang et al. (Citation2020) and Fu et al. (Citation2021).
Table 7. List of questions.
3.4.2. Result analysis
After receiving participant feedback, the authors first tested the results for normal distribution using the Shapiro–Wilk test, as shown in . The statistical results show that all the p-values are smaller than 0.05, indicating that none of the above data fit the normal distribution.
Table 8. Shapiro–Wilk for normal distribution testTable Footnotea.
The authors adopted mean and standard deviation to analyze participant feedback. The mean reflects the main trends in participant answers, the standard deviation indicates the dispersion of the test results and the stability of the preset questions. Due to the samples did not fit the normal distribution, the Mann–Whitney U test was used to compare differences between group A and group B, u and z indicate statistics, the p-value is the probability, p less than 0.01 is statistically highly significant. As shown in and respectively, the p = 0.001, 0.000, 0.000<0.01 of answer accuracy, effectiveness score, and satisfaction score, indicated that there was a significant difference between group A and group B in all three indices.
Figure 11. The statistics analysis of cognitive experiment. (a) The answer accuracy. (b) The effectiveness score and (c) The satisfaction score.
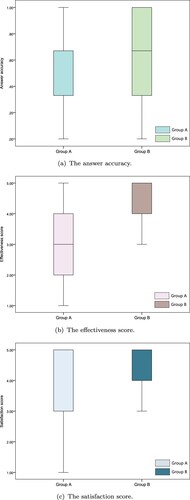
Table 9. Statistical test of the experiment resultsTable Footnotea.
Median (MD) and interquartile range (IQR) were used to reflect the distribution of participant feedback. In , the bold black line and the interval indicate MD and IQR respectively. As shown in (a), the mean accuracy of group B (,
) was significantly higher than that of group A (
,
, p = 0.001<0.01), the MD value of group B was greater than 0.6, the IQR was approximately distributed in the interval (0.4, 1.0), which indicated the storytelling video was more effective in conveying disaster information compared to the text report, but also reflected that the cognitive ability of the storytelling video varies widely among different public, which was related to education level and cognitive style.
As shown in (b), the mean effectiveness score of group B (,
) was significantly higher than that of group A (
,
, p = 0.000<0.01), the MD value of group B was 5.0, the IQR was distributed in the interval (4.0, 5.0), the MD value of group A was 3.0, the IQR was distributed in the interval (2.0, 4.0), which indicated that the majority of the public believes that storytelling videos can greatly and effectively improve their understanding of flood hazards.
As shown in (c), the mean satisfaction score of group B (,
) was also significantly higher than that of group A (
,
, p = 0.000<0.01), the MD value of group B was 5.0, the IQR was distributed in the interval (4.0, 5.0), the MD value of group A was 3.0, the IQR was distributed in the interval (3.0, 5.0). For the storytelling video, the percentages of participants who were very satisfied, satisfied and normal were 62.2%, 33.3% and 4.4% respectively. For the text report, the percentages of participants who were very satisfied, satisfied, normal, dissatisfied and very dissatisfied were 29.7%, 16.2%, 32.4%, 13.5% and 8.1% respectively. Hence, the text report plays a very important role in emergency decision-making, the storytelling videos are more applicable to the popularization of disaster science for the general public.
4. Discussion
Based on our experience gained in geospatial storytelling, 3D representation, and risk communication, we underline the advantages, limitations, and future research directions that are associated with the proposed method in this section.
4.1. Principal findings and potential applications
As a crucial component of disaster management, risk communication has shifted from the pure safety science to an interdisciplinary culture that involves all stakeholders, which aims to communicate relevant information about disasters and help the people at risk be prepared for an emergency (Macchione et al. Citation2019; Dransch, Rotzoll, and Poser Citation2010). In this article, taking dam-break floods as an example, we innovatively propose a new approach to disaster information dissemination and risk communication by combining geospatial storytelling and 3D representation. Geospatial storytelling can effectively express the spatiotemporal relationships in the story, and its use to organize the concepts and relationships involved in the dam-break floods is helpful to people's understanding and perception of dam-break floods from a macro level. Besides, the literature showed that vivid representation of disaster information plays a crucial role in knowledge sharing and risk communication, because vivid information may improve memorability and the construction of mental representations (DiBiase et al. Citation1992; Dransch, Rotzoll, and Poser Citation2010). 3D representation can transform complex 2D simulations into 3D scenes and provide a vivid and immediate understanding of the whole process of dam-break floods (Costabile et al. Citation2021). The combination of the two aims to tell people a dam-break flood story rather than providing a professional 3D scene, thus enhancing public perception and risk communication efficiency.
To the author's knowledge, the principal findings of this article have two potential applications. One application is disaster education for the general public. Pre-disaster education is the focus of disaster education, the story scenes with the advantage of intuitiveness and easy understanding could be used for pre-disaster education to disseminate the knowledge about dam-break floods, thus enhancing people's awareness of floods and strengthening risk perception. One of the characteristics of story scenes is that they can convey location-based disaster information to the public, so they will be one of the best carriers for showing evacuation plans, rescue routes, and temporarily assembling points to the public in during-disaster education. Disasters have not only immediate mental and physical harm, but also have long-term consequences for the public. The story scenes could also provide the affected people with a deeper awareness of dam-break floods and improve their prevention capabilities, and have the potential to make disaster prevention a good habit of life. Another application is for disaster information broadcast. The current way of disaster information broadcast whether on SMS, TV, or Social Media is rely excessively on text, pictures, and videos, this kind of broadcast without geographical location is difficult for the public to understand what really happened. The combination of geospatial storytelling and 3D representation allows the public to observe the whole process of dam-break floods from an all-around perspective.
4.2. Limitations and future research directions
For additional inspiration and information to consider, the limitations of and future research directions of this study are discussed below.
In the creation of the storyline, the authors considered only some of the causes, processes, and consequences of the dam-break floods. However, as described by Gaagai, Boudoukha, and Benaabidate (Citation2020), Gaagai et al. (Citation2022), W. Li et al. (Citation2020), and Psomiadis et al. (Citation2021), the causes and consequences of dam-break floods are more than the factors summarized in this article, but this does not mean other affected elements are not important (e.g. extreme storm, affected land, affected ecology, etc.). Therefore, we are considering more factors related to dam-break floods and further expanding the storyline and enriching the 3D scenes. From the perspective of cartography, it is important to note that too much content in disaster scenes will lead to information overload and insufficient risk perception of users, so how to balance the cognitive efficiency and the information density in 3D scenes is also a research question worthy of our in-depth study.
In the cognitive evaluation, the evaluation method is somewhat single and we need to further design a more reasonable evaluation mechanism under the comprehensiveness and normalization principles, the analytic hierarchy process and fuzzy comprehensive evaluation can be introduced. Moreover, combining eye tracking with virtual reality (VR), augmented reality (AR) and mixed reality (MR) technologies for cognitive evaluation allow for a more in-depth evaluation of user feedback on flood hazards (Chen and Lin Citation2018; G. Zhang et al. Citation2020; Dong et al. Citation2021).
In terms of promotion of the method, we actually addressed a specific dam-break flood from barrier lakes formed from landslides, but the idea of combing geospatial storytelling and 3D representation proposed in this article is widely applicable to other disasters, such as floods in general, earthquakes, and even more complex chains of disasters. Furthermore, this intuitive 3D representation approach with logic also has potential advantages in evacuation simulation and risk assessment (Y. Li et al. Citation2019; Psomiadis et al. Citation2021).
In addition, the authors will try to create a storyline-based visualization of disasters in an automatic manner, a topic worthy of investigation is the automatic generation of the storyline underlying graphs, this would be the subject of future research using Statistical Relational Learning (SRL) following the ideas of Dehbi et al. (Citation2017). Besides, the authors will continue to refine the storytelling system of dam-break floods, with the aim of developing a participatory and interactive 3D application of disasters.
5. Conclusion
The use of storytelling to describe complex geographical processes can improve the efficiency of spatiotemporal information communication and is more in line with public demand (Roth Citation2021). In this article, we proposed a three-dimensional virtual representation method of dam-break floods from a storytelling perspective, which can provide an intuitive and realistic dam-break scene in 3D for the public. We first abstracted the concepts and relationships involved in the whole process of dam-break floods and formed a time-space storyline. Then, each story node was instantiated and a 3D scene of the dam-break flood was constructed using a combination of static and dynamic representation. In addition, a comparative cognition experiment was conducted on the storytelling video and the text report, the results show that the storytelling and 3D representation can effectively organize the causal logic of disaster events and have potential advantages when communicating disaster knowledge to the public.
Acknowledgments
The authors would like to express their gratitude to all participants in the comparative experiment and the editor and anonymous reviewers for their careful reading and constructive suggestions.
Disclosure statement
No potential conflict of interest was reported by the author(s).
Data and code availability statement
The data and codes that support the findings of this study can be found online at https://github.com/vgewilliam/Geospatial-storytelling.git
Additional information
Funding
Notes
References
- Abdillah, D. F., A. Basuki, and T. Harsono. 2020. “Visually Realistic Rain Modeling Optimization for VR Application.” In 2020 International Electronics Symposium (IES), 688–694. IEEE.
- Anshuka, A., F. F. van Ogtrop, D. Sanderson, and S. Z. Leao. 2022. “A Systematic Review of Agent-Based Model for Flood Risk Management and Assessment Using the Odd Protocol.” Natural Hazards 112: 2739–2771.
- Bandrova, T., S. Zlatanova, and M. Konecny. 2012. “Three-Dimensional Maps for Disaster Management.” In ISPRS Annals of the Photogrammetry, Remote Sensing and Spatial Information Sciences, Volume I-2, XXII ISPRS Congress, August–September, 2012, 19–24. International Society for Photogrammetry and Remote Sensing.
- Bergman, N., O. Sholker, J. Roskin, and N. Greenbaum. 2014. “The Nahal Oz Reservoir Dam-Break Flood: Geomorphic Impact on a Small Ephemeral Loess-Channel in the Semi-Arid Negev Desert, Israel.” Geomorphology 210: 83–97.
- Bilali, A. E., I. Taleb, A. Nafii, and A. Taleb. 2022. “A Practical Probabilistic Approach for Simulating Life Loss in an Urban Area Associated with a Dam-Break Flood.” International Journal of Disaster Risk Reduction 76: Article ID 103011.
- Caquard, S. 2013. “Cartography I: Mapping Narrative Cartography.” Progress in Human Geography 37: 135–144.
- Chen, M., and H. Lin. 2018. “Virtual Geographic Environments (VGES): Originating from or Beyond Virtual Reality (VR)?” International Journal of Digital Earth 11: 329–333.
- Çöltekin, A., I. Lochhead, M. Madden, S. Christophe, A. Devaux, C. Pettit, O. Lock, et al. 2020. “Extended Reality in Spatial Sciences: A Review of Research Challenges and Future Directions.” ISPRS International Journal of Geo-Information 9: 439.
- Costabile, P., C. Costanzo, G. De Lorenzo, R. De Santis, N. Penna, and F. Macchione. 2021. “Terrestrial and Airborne Laser Scanning and 2-D Modelling for 3-D Flood Hazard Maps in Urban Areas: New Opportunities and Perspectives.” Environmental Modelling & Software 135: Article ID 104889.
- Craglia, M., K. de Bie, D. Jackson, M. Pesaresi, G. Remetey-Fülöpp, C. Wang, A. Annoni, et al. 2012. “Digital Earth 2020: Towards the Vision for the Next Decade.” International Journal of Digital Earth 5: 4–21.
- Day, J. 2011. “The Importance of Public Perceptions and Vulnerability in a Multidimensional Approach to Flood Risk Management.” PhD thesis, University of Exeter Exeter, UK.
- de Araujo Guerra Grangeia, T., B. de Jorge, D. Franci, T. Martins Santos, M. S. Vellutini Setubal, M. Schweller, and M. A. de Carvalho-Filho. 2016. “Cognitive Load and Self-Determination Theories Applied to E-Learning: Impact on Students' Participation and Academic Performance.” PloS One 11: Article ID e0152462.
- Dehbi, Y., F. Hadiji, G. Gröger, K. Kersting, and L. Plümer. 2017. “Statistical Relational Learning of Grammar Rules for 3D Building Reconstruction.” Transactions in GIS 21: 134–150.
- DiBiase, D., A. M. MacEachren, J. B. Krygier, and C. Reeves. 1992. “Animation and the Role of Map Design in Scientific Visualization.” Cartography and Geographic Information Systems 19: 201–214.
- Ding, Y., Y. Fan, Z. Du, Q. Zhu, W. Wang, S. Liu, and H. Lin. 2015. “An Integrated Geospatial Information Service System for Disaster Management in China.” International Journal of Digital Earth8: 918–945.
- Dong, W., Y. Wu, T. Qin, X. Bian, Y. Zhao, Y. He, Y. Xu, and C. Yu. 2021. “What is the Difference Between Augmented Reality and 2D Navigation Electronic Maps in Pedestrian Wayfinding?” Cartography and Geographic Information Science 48: 225–240.
- Dong, W., T. Yang, H. Liao, and L. Meng. 2020. “How Does Map Use Differ in Virtual Reality and Desktop-Based Environments?” International Journal of Digital Earth 13: 1484–1503.
- Dransch, D., H. Rotzoll, and K. Poser. 2010. “The Contribution of Maps to the Challenges of Risk Communication to the Public.” International Journal of Digital Earth 3: 292–311.
- Du, Z., and J. Gu. 2016. “A Domain Ontology Construction Method of Disaster Chain-Case Study of Rainstorm Flood Disaster Chain.” Geomatics World 23: 7–13.
- Evans, S. Y., M. Todd, I. Baines, T. Hunt, and G. Morrison. 2014. “Communicating Flood Risk Through Three-Dimensional Visualisation.” In Proceedings of the Institution of Civil Engineers-Civil Engineering, 48–55. Thomas Telford Ltd.
- Fu, L., J. Zhu, W. Li, Q. Zhu, B. Xu, Y. Xie, Y. Zhang, et al. 2021. “Tunnel Vision Optimization Method for VR Flood Scenes Based on Gaussian Blur.” International Journal of Digital Earth 14: 821–835.
- Gaagai, A., H. A. Aouissi, A. E. Krauklis, J. Burlakovs, A. Athamena, I. Zekker, A. Boudoukha, L. Benaabidate, and H. Chenchouni. 2022. “Modeling and Risk Analysis of Dam-Break Flooding in a Semi-Arid Montane Watershed: A Case Study of the Yabous Dam, Northeastern Algeria.” Water 14: 767.
- Gaagai, A., A. Boudoukha, and L. Benaabidate. 2020. “Failure Simulation of Babar Dam–Algeria and Its Impact on the Valley Downstream Section.” Journal of Water and Land Development 44: 75–89.
- Gaillard, J. C., and M. L. C. J. D. Pangilinan. 2010. “Participatory Mapping for Raising Disaster Risk Awareness Among the Youth.” Journal of Contingencies and Crisis Management 18: 175–179.
- Gershon, N., and W. Page. 2001. “What Storytelling Can Do for Information Visualization.” Communications of the ACM 44: 31–37.
- Goodchild, M. F., H. Guo, A. Annoni, L. Bian, K. De Bie, F. Campbell, M. Craglia, et al. 2012. “Next-Generation Digital Earth.” Proceedings of the National Academy of Sciences 109: 11088–11094.
- Hagemeier-Klose, M., and K. Wagner. 2009. “Evaluation of Flood Hazard Maps in Print and Web Mapping Services As Information Tools in Flood Risk Communication.” Natural Hazards and Earth System Sciences 9: 563–574.
- Henstra, D., A. Minano, and J. Thistlethwaite. 2019. “Communicating Disaster Risk? An Evaluation of the Availability and Quality of Flood Maps.” Natural Hazards and Earth System Sciences 19: 313–323.
- Huang, H. M., U. Rauch, and S. S. Liaw. 2010. “Investigating Learners' Attitudes Toward Virtual Reality Learning Environments: Based on a Constructivist Approach.” Computers & Education 55: 1171–1182.
- Huang, P., J. Zhu, W. Li, L. Zhou, Q. He, L. Fu, and J. Lu. 2020. “Research on Landslide Dynamic Visualization Method Driven by UAV Remote Sensing Data.” Journal of Catastrophology 35: 230–234.
- Islam, T., and J. Ryan. 2015. Hazard Mitigation in Emergency Management. Waltham: Butterworth–Heinemann.
- Koo, H., T. Iwanaga, B. F. Croke, A. J. Jakeman, J. Yang, H. H. Wang, X. Sun, et al. 2020. “Position Paper: Sensitivity Analysis of Spatially Distributed Environmental Models-a Pragmatic Framework for the Exploration of Uncertainty Sources.” Environmental Modelling & Software 134: Article ID 104857.
- Kundzewicz, Z. W., D. Hegger, P. Matczak, and P. Driessen. 2018. “Flood-risk Reduction: Structural Measures and Diverse Strategies.” Proceedings of the National Academy of Sciences 115: 12321–12325.
- Kwan, M. P., and G. Ding. 2008. “Geo-Narrative: Extending Geographic Information Systems for Narrative Analysis in Qualitative and Mixed-Method Research.” The Professional Geographer 60: 443–465.
- Lai, J. S., W. Y. Chang, Y. C. Chan, S. C. Kang, and Y. C. Tan. 2011. “Development of a 3D Virtual Environment for Improving Public Participation: Case Study–the Yuansantze Flood Diversion Works Project.” Advanced Engineering Informatics 25: 208–223.
- Li, Y., J. Gong, H. Liu, J. Zhu, Y. Song, and J. Liang. 2015. “Real-Time Flood Simulations Using Ca Model Driven by Dynamic Observation Data.” International Journal of Geographical Information Science 29: 523–535.
- Li, Y., J. Gong, J. Zhu, Y. Song, Y. Hu, and L. Ye. 2013. “Spatiotemporal Simulation and Risk Analysis of Dam-Break Flooding Based on Cellular Automata.” International Journal of Geographical Information Science 27: 2043–2059.
- Li, X., C. Guo, Z. Yang, W. Liao, R. Wu, J. Jin, and Y. He. 2021. “Development Characteristics and Formation Mechanism of the Xiongba Giant Ancient Landslide in the Jinshajiang Tectonic Zone.” Geoscience 35: 47.
- Li, Y., B. Hu, D. Zhang, J. Gong, Y. Song, and J. Sun. 2019. “Flood Evacuation Simulations Using Cellular Automata and Multiagent Systems-a Human-Environment Relationship Perspective.” International Journal of Geographical Information Science 33: 2241–2258.
- Li, Z., C. Wang, C. T. Emrich, and D. Guo. 2018. “A Novel Approach to Leveraging Social Media for Rapid Flood Mapping: A Case Study of the 2015 South Carolina Floods.” Cartography and Geographic Information Science 45: 97–110.
- Li, W., J. Zhu, L. Fu, Q. Zhu, Y. Guo, and Y. Gong. 2021. “A Rapid 3D Reproduction System of Dam-Break Floods Constrained by Post-Disaster Information.” Environmental Modelling & Software139: Article ID 104994.
- Li, W., J. Zhu, L. Fu, Q. Zhu, Y. Xie, and Y. Hu. 2021. “An Augmented Representation Method of Debris Flow Scenes to Improve Public Perception.” International Journal of Geographical Information Science 35: 1521–1544.
- Li, W., J. Zhu, Y. Zhang, Y. Cao, Y. Hu, L. Fu, P. Huang, et al. 2019. “A Fusion Visualization Method for Disaster Information Based on Self-Explanatory Symbols and Photorealistic Scene Cooperation.” ISPRS International Journal of Geo-Information 8: 104.
- Li, W., J. Zhu, Y. Zhang, L. Fu, Y. Gong, Y. Hu, and Y. Cao. 2020. “An On-Demand Construction Method of Disaster Scenes for Multilevel Users.” Natural Hazards 101: 409–428.
- Liao, H., W. Dong, C. Peng, and H. Liu. 2017. “Exploring Differences of Visual Attention in Pedestrian Navigation when Using 2D Maps and 3D Geo-Browsers.” Cartography and Geographic Information Science 44: 474–490.
- Liu, W., N. Ju, Z. Zhang, Z. Chen, and S. He. 2020. “Simulating the Process of the Jinshajiang Landslide-Caused Disaster Chain in October 2018.” Bulletin of Engineering Geology and the Environment 79: 2189–2199.
- Liu, M., J. Zhu, Q. Zhu, H. Qi, L. Yin, X. Zhang, B. Feng, et al. 2017. “Optimization of Simulation and Visualization Analysis of Dam-Failure Flood Disaster for Diverse Computing Systems.” International Journal of Geographical Information Science 31: 1891–1906.
- Macchione, F., P. Costabile, C. Costanzo, and R. De Santis. 2019. “Moving to 3-D Flood Hazard Maps for Enhancing Risk Communication.” Environmental Modelling & Software 111: 510–522.
- Meyer, V., S. Priest, and C. Kuhlicke. 2012. “Economic Evaluation of Structural and Non-Structural Flood Risk Management Measures: Examples From the Mulde River.” Natural Hazards 62: 301–324.
- Ntajal, J., B. L. Lamptey, I. B. Mahamadou, and B. K. Nyarko. 2017. “Flood Disaster Risk Mapping in the Lower Mono River Basin in Togo, West Africa.” International Journal of Disaster Risk Reduction23: 93–103.
- Paelke, V., and B. Elias. 2007. “Stories as Route Descriptions.” In International Conference on Spatial Information Theory, 255–267. Springer.
- Psomiadis, E., L. Tomanis, A. Kavvadias, K. X. Soulis, N. Charizopoulos, and S. Michas. 2021. “Potential Dam Breach Analysis and Flood Wave Risk Assessment Using HEC-RAS and Remote Sensing Data: A Multicriteria Approach.” Water 13: 364.
- Roth, R. E. 2021. “Cartographic Design as Visual Storytelling: Synthesis and Review of Map-Based Narratives, Genres, and Tropes.” The Cartographic Journal 58: 83–114.
- Segel, E., and J. Heer. 2010. “Narrative Visualization: Telling Stories with Data.” IEEE Transactions on Visualization and Computer Graphics 16: 1139–1148.
- Shi, P., T. Ye, Y. Wang, T. Zhou, W. Xu, J. Du, J. Wang, et al. 2020. “Disaster Risk Science: A Geographical Perspective and a Research Framework.” International Journal of Disaster Risk Science11: 426–440.
- Spittal, M. J., J. McClure, R. J. Siegert, and F. H. Walkey. 2005. “Optimistic Bias in Relation to Preparedness for Earthquakes.” Australasian Journal of Disaster and Trauma Studies 1: 1–10.
- Vidmar, A., K. Zabret, K. Sapač, P. Pergar, and A. Kryžanowski. 2019. “Development of an Application for Estimating the Benefits of Structural and Non-Structural Measures for Flood Risk Reduction.” In Croatianwaters in Environmental and Nature Protection, Proceedings of the 7th Croatian Water Conference with International Participation, 615–624. Opatija, Croatia.
- Wang, D., Y. Zhou, X. Pei, C. Ouyang, J. Du, and G. Scaringi. 2021. “Dam-Break Dynamics at Huohua Lake Following the 2017 MW 6.5 Jiuzhaigou Earthquake in Sichuan, China.” Engineering Geology 289: Article ID 106145.
- Xu, F.g., X.g. Yang, and J.w. Zhou. 2017. “Dam-Break Flood Risk Assessment and Mitigation Measures for the Hongshiyan Landslide-Dammed Lake Triggered by the 2014 Ludian Earthquake.” Geomatics, Natural Hazards and Risk 8: 803–821.
- Zhang, C., M. Chen, R. Li, Y. Ding, and H. Lin. 2015. “A Virtual Geographic Environment System for Multiscale Air Quality Analysis and Decision Making: A Case Study of SO 2 Concentration Simulation.” Applied Geography 63: 326–336.
- Zhang, G., J. Gong, Y. Li, J. Sun, B. Xu, D. Zhang, J. Zhou, et al. 2020. “An Efficient Flood Dynamic Visualization Approach Based on 3D Printing and Augmented Reality.” International Journal of Digital Earth 13: 1302–1320.
- Zhang, Y., J. Zhu, Q. Zhu, Y. Xie, W. Li, L. Fu, J. Zhang, and J. Tan. 2020. “The Construction of Personalized Virtual Landslide Disaster Environments Based on Knowledge Graphs and Deep Neural Networks.” International Journal of Digital Earth 13: 1637–1655.
- Zhu, J., H. Zhang, X. Yang, L. Yin, Y. Li, Y. Hu, and X. Zhang. 2016. “A Collaborative Virtual Geographic Environment for Emergency Dam-Break Simulation and Risk Analysis.” Journal of Spatial Science 61: 133–155.
- Zhuo, L., and D. Han. 2020. “Agent-Based Modelling and Flood Risk Management: A Compendious Literature Review.” Journal of Hydrology 591: Article ID 125600.