
 ?Mathematical formulae have been encoded as MathML and are displayed in this HTML version using MathJax in order to improve their display. Uncheck the box to turn MathJax off. This feature requires Javascript. Click on a formula to zoom.
ABSTRACT
Numerous news or event pictures are taken and shared on the internet every day that have abundant information worth being mined, but only a small fraction of them are geotagged. The visual content of the news image hints at clues of the geographical location because they are usually taken at the site of the incident, which provides a prerequisite for geo-localization. This paper proposes an automated pipeline based on deep learning for the geo-localization of news pictures in a large-scale urban environment using geotagged street view images as a reference dataset. The approach obtains location information by constructing an attention-based feature extraction network. Then, the image features are aggregated, and the candidate street view image results are retrieved by the selective matching kernel function. Finally, the coordinates of the news images are estimated by the kernel density prediction method. The pipeline is tested in the news pictures in Hong Kong. In the comparison experiments, the proposed pipeline shows stable performance and generalizability in the large-scale urban environment. In addition, the performance analysis of components in the pipeline shows the ability to recognize localization features of partial areas in pictures and the effectiveness of the proposed solution in news picture geo-localization.
1. Introduction
A number of news or event pictures are created today, which have valuable content to be analyzed. Especially with the emergence of social media such as Twitter, Instagram, and Sina Weibo, people are willing to take photos and share the popular events happening around them. The massive relevant content of the event can easily be obtained from the internet, and it is possible to track and analyze current trends or public sentiment (Lin et al. Citation2022). Event pictures can also be used in fake news detection (Song et al. Citation2021), caption generation (Feng and Lapata Citation2013) and content recommendation (Yang, Long, et al. Citation2020). However, only a limited portion (1% to 4%) of messages are geotagged in the case of Twitter (Nizzoli et al. Citation2020). Due to the absence or inaccuracy of location, it is difficult to perform spatial visualization and analysis.
Geo-localization of news or event pictures plays a vital role in analyzing the content of the images, such as quickly detecting and monitoring the location, scope, and number of events. The method of extracting location information has a wide range of applications, including tourism, politics, crime, environment, disaster management, and transport (Lock, Bednarz, and Pettit Citation2021). Further applications usually require a combination of the semantic features reflected in media images or the events described in the news. For example, natural disaster events have been analyzed through information posted on the web (Bhuvana and Arul Aram Citation2019; Zou et al. Citation2019; Skripnikov et al. Citation2021). The local government can respond quickly according to the situation of the incident and issue safety announcements. The analysis results can also be used as a reference for the government to formulate emergency plans. The images with geotags are also used in urban environmental analysis (Cheng et al. Citation2017; Meng et al. Citation2020; Jing et al. Citation2021), such as building audits (Kelly et al. Citation2013; Ning et al. Citation2022), greening analysis (Li Citation2021; Xia, Yabuki, and Fukuda Citation2021), and urban landscape analysis (Li, Ratti, and Seiferling Citation2017; Li et al. Citation2021).
For some reason, it is difficult to obtain accurate locations directly from the event pictures, while it is inefficient to find the image location manually. For security or privacy concerns, users usually send content without geotag information or only a vague semantic location (Shang et al. Citation2022). For example, removing EXIF is an effective way to avoid revealing the image location. However, picture coordinate information may be lost during upload, compression, or copying. The lack of location information creates obstacles to analyzing the content of the images.
Previous methods have been focused primarily on street view image geo-localization and have achieved impressive performance. Most of the work takes clear street view images as query images, where there are obvious visual features, and the images with noisy content have not been widely analyzed in the literature. Furthermore, most media or crowdsourced images are taken with non-professional equipment in complex environments, making it difficult to recognize semantic features. To overcome these problems, this paper proposes an automated pipeline for urban-scale news picture geo-localization, based on deep learning and street view images. A difficult query dataset with the theme of ‘Hong Kong’s Extradition Turmoil’ is collected, in which most of the images have clash content with extreme view changes and some images are taken at night. The geo-localization pipeline includes three steps. First, the CNNs with attention mechanism are utilized to extract high-level features representing location information of local regions in news images. Second, the features extracted from CNNs are aggregated and the similarity function is used to implement the news image retrieval task. Finally, a kernel density prediction (KDP) method is proposed for estimating location, which integrates the similarity ranking and spatial distribution of results.
This paper is structured as follows. Section 2 introduces the related work about the current geo-localization methods. Section 3 describes the study area, datasets, the proposed news picture geo-localization pipeline, and the evaluation metrics in this paper. Section 4 shows the experimental results. The discussion is in Section 5. Finally, Section 6 presents the conclusions.
2. Related work
There are currently three main methods for geo-localization: 2D ground-to-ground image-based, 2D ground-to-satellite image-based and 3D structure-based methods.
The 2D ground-to-ground image-based methods utilize large-scale geo-tagged datasets taken at ground level for geo-localization. The methods (Torii et al. Citation2015; Cheng et al. Citation2018; Ge et al. Citation2020) compare the similarity of visual content in both the query images and dataset images by extracting compact features (Babenko and Lempitsky Citation2015; Tolias, Ronan, and Hervé Citation2015; Kalantidis, Mellina, and Osindero Citation2016; Radenović, Tolias, and Chum Citation2019) or local features (Noh et al. Citation2017; Tian et al. Citation2020; Tolias, Tomas, and Ondřej Citation2020; Yang, Nguyen, et al. Citation2020; Zhi et al. Citation2021). The query images are located by the best similarity result location (Kim, Dunn, and Frahm Citation2017; Liu and Li Citation2019). To retrieve a large-scale dataset, features are aggregated into compact vectors (Sivic and Zisserman Citation2003; Perronnin and Dance Citation2007; Jégou et al. Citation2010) for fast similarity computation.
2D ground-to-satellite image-based methods are transformed into a cross-view image retrieval problem (Toker et al. Citation2021; Shi et al. Citation2022; Wang et al. Citation2022; Zhu et al. Citation2022) in which the high-resolution satellite images are constructed as a reference dataset to query ground-level images. It is possible to solve the geo-localization of areas not supported by ground images because the high-resolution satellite images cover almost the whole earth and are easily accessible, such as Google Earth. However, ground and satellite images have very different visual appearances (Wilson et al. Citation2021). Although recent works (Zheng, Wei, and Yang Citation2020; Wang et al. Citation2022) have used drones to capture the side views of streets and buildings, there are still issues to overcome such as the geometric distortion of the objects and inconsistent orientation between query and reference images.
3D structure-based methods (Sattler et al. Citation2018; Sarlin et al. Citation2021) calculate the 6-DOF pose of the camera in the world coordinate system, which requires a camera to capture 3D data and is often used in augmented reality (Park et al. Citation2022), 3D reconstruction (Tancik et al. Citation2022), and navigation (Bruno et al. Citation2022). In addition, it is also possible to align a 2D query image against a 3D point cloud or model (Lehtola et al. Citation2015) after establishing efficient 2D–3D matches. This method can achieve higher accuracy, but requires additional computation. 3D models are available from LiDAR sensors. 3D reconstruction from street view images (Cheng et al. Citation2018) is also another approach to obtain 3D geo-reference data.
News images are usually taken at the location of the event, and the visual content of the image implies clues of the geographical location, which provides a prerequisite for geo-localization. However, news images have complex content, varying from shooting angles and illumination, in which buildings are usually obscured. In addition, dynamic targets such as vehicles, pedestrians, and billboards in urban scenes can also impact matching. These problems make it difficult to apply 3D structure-based methods to construct 3D models and geo-localization news images. Moreover, the visual content obtained from satellite imagery differs significantly from media images on the internet. Thus, this paper employs a 2D ground-to-ground image-based method to estimate the location where the news pictures were taken by matching the geotagged image, which can extract local location clues from crowdsourced news pictures. Street view images of the city where the incident occurred are used as a reference dataset to match news pictures because the city street view images are densely and widely distributed in the city (Zhang and Liu Citation2021) and have a ground perspective view that is similar to news pictures. The street view images also provide richer clues, such as building textures and street layouts.
3. Materials and methods
3.1. Study area and data
The study area of Hong Kong Island is the political, economic and commercial center of Hong Kong, China. The study area covers approximately 50 km2. The northern island is one of the core urban areas of Hong Kong. There are many landmarks, such as the Central Government Offices, Legislative Council Complex and Golden Bauhinia Square. The main central business districts are also located in this area, such as Central, Admiralty, Wan Chai and Causeway Bay, which have led to Hong Kong becoming the active area for assembly or tourist gatherings.
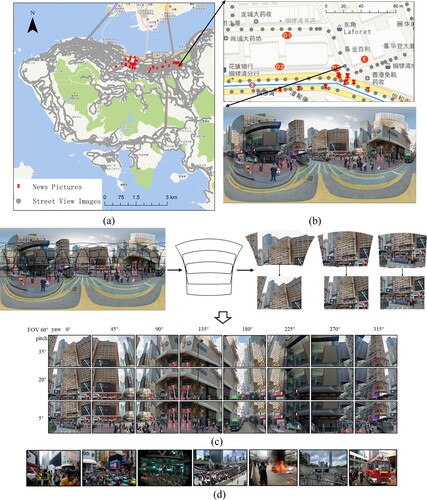
This paper used 833,664 perspective images projected from 34,736 Google Street View equirectangular panoramas of the Hong Kong area as a reference dataset, as shown in (a). Panoramas with a 2:1 aspect ratio are transformed into perspective images by gnomonic projection. (b) displays the local distribution of street view images. These images have longitude and latitude information at intervals of 10–12 m and are evenly distributed on the road. As shown in (c), each 3,332 × 1,666 pixel panorama is split into 24 perspective images of 640 × 480 pixels with 12 yaw directions (45° intervals [0, 45, 90, … , 315°]), 60° horizontal field of view (FOV) and 5°, 20°, 35° pitch directions. The perspective images overlap each other by approximately 80%.
Figure 1. Data and study area. (a) The location distribution of street view images. (b) Street view distribution near the SOGO Department Store and example of street view panorama. (c) The process of generating perspective images from the panorama.
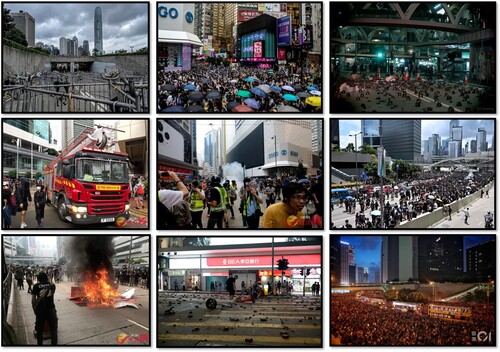
This paper collected 81 news query pictures about ‘Hong Kong’s Extradition Turmoil’ from the internet (Google, Wikipedia, Flickr and news websites), as shown in . These pictures were chosen for this study, and the following strategy was used to sample them. Pictures that are relevant to the topic and contain visual information about the streets were chosen from keywords search results from multiple sources. The pictures about people, indoors and outside of the study area are removed manually. Then, the pictures that can be marked as latitude and longitude are selected further, while the pictures that cannot be recognized as exact locations are ignored. The marked images often contain more or less recognizable visual content, such as landmarks or distinctive street layouts. In the end, a total of 81 images were tagged for the experiment. These images are varied from illumination, perspective and scenes. These images are distributed on the northern island, which is clustered mainly around government buildings, commercial centers, etc. Most query pictures do not have the EXIF or location information, while the context of pictures only mentions an event that occurred in that place. To obtain the exact location of the image, the approximate location range of image capture was confirmed first, from the selection of retrieval results by retrieval of street view images using news pictures SIFT features. Then, the images were manually located using Google Street View Maps as a reference.
Figure 2. Example of query images.
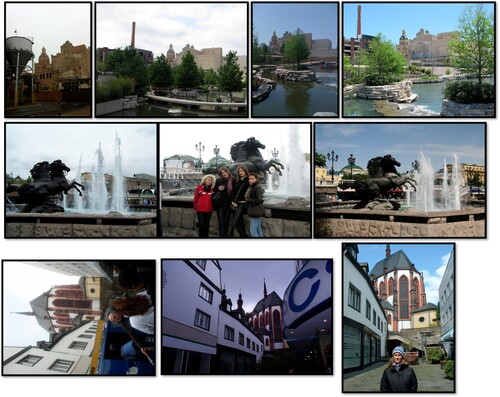
Considering that it is difficult to generate a noise-free training set by street view images with only location information, landmark datasets are used to train networks, which also makes the network robust in large-scale urban environments. On the other hand, the purpose of this paper is geo-localization news or crowdsourced images, and the previous models trained by existing geo-localization datasets are difficult to apply to other regions, particularly in the case of media pictures taken in the complex environments covered in this paper. This paper used a part of the Google Landmarks Dataset (Noh et al. Citation2017) (GLD) to train the network, which has human-made and natural landmark images, as depicted in . To clean the noisy data, an image-retrieval-based method was performed to eliminate abnormal images in each class. GLD was used to train ResNet101 first. Then, the fully connected layer of the network was removed to extract the output of the average pooling layer as image features. The feature clustering center of each class was calculated, and the top N images closest to the centroid were selected and this step was repeated once. Finally, the remaining images are regarded as the benchmark in each class. Cleaned training GLD datasets (a total of 1,500 classes) were constructed using a random selection method.
Figure 3. Google Landmarks Dataset.
3.2. Pipeline architecture
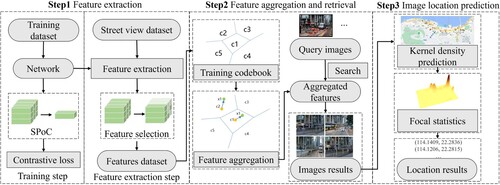
The architecture of pipeline in this paper is shown in . First, the feature extraction network is constructed to extract image features. Second, features are aggregated, and the similarity function is employed to retrieve street view image results. Finally, the KDP method is used to estimate location.
Figure 4. The architecture of pipeline for news picture geo-localization.
3.3. Feature extraction
3.3.1. Network architecture
An end-to-end CNN is built to extract features of the street view images and the news pictures, as shown in . The first part of the network consists of an FCN, which is used to extract dense features from images. In this paper, the FCN is constructed by removing the final pooling and fully connected layers of ResNet101 (He et al. Citation2016). The feature selecting module (HOW module) (Tolias, Tomas, and Ondřej Citation2020), after the FCN, is used to extract and select distinguishing features based on the score of the attention layer, including attention , smoothing
and whitening
. In the training and feature extraction steps, different strategies are used to represent the features for the output of the network.
Figure 5. The network architecture for retrieval in the training and feature extraction steps.
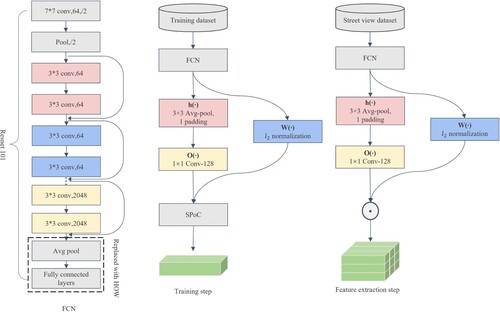
For an input image , the output of FCN is a 3D tensor of activations
, which can also be represented as
of
D-dimensional local dense features. The attention function
is used to weight the local feature
, which is
normalized, and the parameters are fixed. In feature extraction, the first
features with higher scores are extracted, and other weak features are not considered. The smoothing function
tends to align the large activation values of features on multiple channels. The function is applied by
average pooling, and its parameters are fixed without training. The whitening function
is integrated mean subtraction, whitening, and dimensionality reduction (
), which is implemented by an
convolution with bias. The parameters are trained by a set of local features before the training network and fixed in the training step. The convolution kernel of the average pooling layer in the smoothing layer is set to
, and the number of channels in the whitening layer is 128, which means that the
-dimensional features (
) are output.
3.3.2. Training strategies
In this step, the output of the network is aggregated by sum-pooled of convolutional features (SPoC) for efficient training, which is given by:
(1)
(1) where
is the local features, the weight matrix is the attention function
, and
is the corresponding feature after the smoothing and whitening layers. The local features are transformed by SPoC descriptors into an
shape to calculate the loss. The contrastive loss, used to optimize the network parameters, is given by:
(2)
(2) where
is the distance of the feature between samples, and
is a label for whether samples match. The value is 1 if it is the same category and 0 if the opposite. Margin is the threshold value and is set to 0.7.
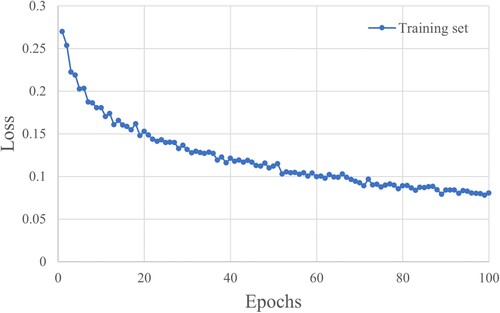
The network trained by the street view dataset has a lack of ability to recognize the location information of images with confusing content, so GLD is used as the training dataset to optimize the network parameters and improve the generalization performance. The aim of the training process is to migrate the model to the task of news picture localization rather than to improve the accuracy of GLD. shows the loss change on the training dataset, and the hyperparameters are set as follows to avoid over-fitting the model. The optimizer is Adam with an initial learning rate of and a weight decay of
. The exponential learning rate decay mode with a value of 0.99 is employed, and the networks are trained for 100 epochs.
Figure 6. Loss of feature extraction network.
Before each epoch of the network optimization, a series of tuples is randomly generated based on the image class labels to feed into the network and calculate the loss, as shown in . Each tuple consists of a query image, a positive sample and several negative samples. The query image is randomly selected as the benchmark of the tuple from the training dataset, and the positive samples are randomly selected from the same labels. The top images that are most similar to the query image are selected from the negative sample pool as negative samples, while the negative sample pool is composed of randomly selected negative samples. To match query images, the images in the negative sample pool are extracted SPoC and sorted according to Euclidean distance.
Figure 7. The tuple input of the network and contrastive loss.
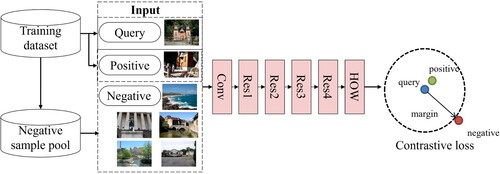
The number of tuples can be appropriately adjusted according to the time for extracting features and mining negative samples, where the range of 2000–5000 is reasonable (Tolias, Tomas, and Ondřej Citation2020; Berton et al. Citation2022). In this paper, a total of 2500 tuple pairs were generated, and 20,000 images were randomly selected before each iteration to extract SPoC as a negative sample pool. Each tuple is generated by selecting the first 5 images from the pool that are most similar to the query image and belong to different classes as negative samples. The batch size of each iteration is 5. Before each iteration, the images in the negative sample pool are randomly selected again to reconstruct the tuple. The network is trained by GLD, which has annotated category labels. In this paper, landmark images under the same class are used as positive samples, and images of different classes are used as negative samples.
3.3.3. Feature extraction
In this step, the images are scaled at different scales and fed into the network to generate multiple features, in which the scale is set to [2.0, 1.414, 1.0, 0.707, 0.5, 0.353, 0.25], and then the dense features of the image are extracted. The first 1000 local features, each with 128 dimensions, are selected according to the ranking of the attention layer values from large to small. Meanwhile, the feature scale, feature location and feature attention values corresponding to the local feature are also recorded. The feature location is calculated by the center pixel of the receptive field of the FCN corresponding to the local feature.
3.4. Feature aggregation and retrieval
3.4.1. Feature aggregation
The feature aggregation method transforms local features into compact vectors for a fast match. VLAD (Arandjelović and Zisserman Citation2013) is implemented for each image to aggregate a feature in the paper. The local features of an image are denoted by
d-dimensional vectors
. The features are quantized by K-means quantizer
into k centroids
, which produces a
matrix by sum residuals. In other words, the local feature of the image is assigned to the centroid that is closest to itself. Then, the sum of the residuals between local features and the corresponding centroid is calculated to obtain an
dimensional vector. The features of
centroids are combined to form a
aggregated feature. The VLAD descriptors can be represented as:
(3)
(3) where
are residuals by the original local feature and K-means centroids. To obtain the
centroids, local features of 1/10 images of the reference dataset are randomly selected for training feature clustering, and the number of centroids is set to 262,144. This paper uses Faiss (Johnson, Douze, and Jégou Citation2019) to implement this training process and generate the feature codebook composed of
centroids to aggregate features of news pictures and street view images of the reference dataset. Since the result of feature retrieval is a feature ranking according to similarity, an inverted index table is constructed for querying the corresponding street view images by features. This paper generated a dictionary of ‘feature’: ‘image’ key-value pairs to build the inverted index file.
3.4.2. Image retrieval
This paper employs the similarity function to measure feature distance. For the aggregated feature between the image and the image
, the similarity function is implemented by aggregated selective match kernel (ASMK) (Tolias, Avrithis, and Jegou Citation2016), which is given by:
(4)
(4)
(5)
(5) where
are VLAD descriptors of image
,
,
, and
is the similarity kernel function between both of the images, in which the matching kernel is implemented on the features of each centroid.
is the dot product of a single vector of each centroid between two images. The similarity function
removes the mismatched features and enhances the impact of similar features by power operations. The nonlinear function
is used to select a positive value, which means that the angle of the descriptors in this centroid is in [0°–90°] and has more similarity in vector space. The normalized aggregated features
are computed offline. For each aggregated feature of news pictures, the similarity function is employed on the street view image features dataset to return the results ranking by scores, and then the street view image results and location are returned according to the inverted index table.
3.5. Image location prediction
For most news picture retrievals, a series of correct results can be returned by retrieval but is not the top 1 result. Some of these results are generated from the same panorama, which are duplicate locations. Other positive retrieval results are spatially close due to the similarity of adjacent street views. If Top 1 in the retrieval result is used as the location of the query image, the above situation will be ignored. Another method is that the similarity values at the same location are summed, and then the top-ranked result is selected as the location of the query image, which cannot consider spatially adjacent correct results. Moreover, the results generated by the interpolation method have a strong dependence on the original points, in which the local maxima of the interpolation plane have a high repetition rate with the retrieval results.
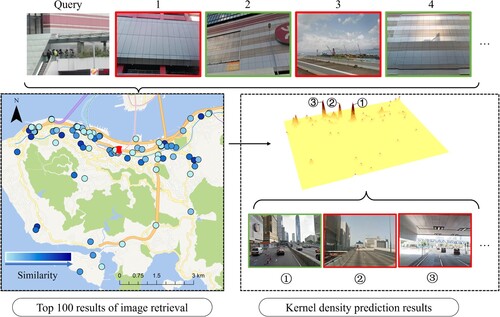
As shown in , the kernel density prediction method, which aims to consider both the spatial location distribution and the similarity value of the retrieval results, is implemented in the paper to estimate the position of the query image from the previous results. The method is based on the assumption that there are correct results in the retrieval method. The KDP method aggregates the spatially adjacent points, given by:
(6)
(6)
where
is the similarity in
coordinates, and
is denoted by the search radius. The Top 100 retrieval results are considered in the location estimation. The query radius
is set to 150 m. The local maxima of the kernel density method are extracted by focal statistics as the location of the query images.
Figure 8. The KDP process of the example image.
3.6. Evaluation metrics
This paper adopts the distance-based method mentioned in the paper (Zheng, Han, and Sun Citation2018) and further defined a ranking-based accuracy to evaluate the prediction location accuracy. Let be the set of all news pictures for prediction. The method being evaluated predicts a location
for picture
. The predicted location
is expected to be as close to the ground-truth location
as possible. The error distance (ED) is denoted as the Euclidean distance between
and
, which is given by:
(7)
(7) where the original coordinate system of the street view images is WGS-1984, and the same is true for the manually located news pictures.
is computed in the Hong Kong 1980 Grid System (EPSG:2326) by coordinate transform. For the distance-based evaluation method, the threshold
of error distance is predefined, which reflects the tolerance for geo-localization errors. If
is less than
, the predicted result
will be considered correct. The distance-based accuracy (
) metric is indicated as the proportion of the correct prediction
, which is given by:
(8)
(8)
The method in this paper predicts a ranking list rather than directly treating the Top 1 result as the only predicted location and ignoring other locations on the list. The ranking list can provide candidate locations for further applications. Thus, ranking-based accuracy within distance
(
) is further defined in this paper. If any
between the ground-truth location and the Top k results
is less than
, these results are regarded as correct.
is given by:
(9)
(9)
4. Results
This paper performed the geo-localization experiment on 81 news pictures with the theme of ‘Hong Kong’s Extradition Turmoil’. First, the feature extraction network is constructed to obtain the local image features with location information. Second, aggregated features are computed, and the similarity function is employed to retrieve street view image results. Finally, the KDP method is used on the top 100 results of the retrieval method to obtain the predicted location. In this paper, the CNNs are constructed by PyTorch, and the experimental results for evaluation were completed on an Ubuntu 20.04 system equipped with an RTX3090 GPU, an INTEL I9-10900 K CPU and 64 GB of RAM.
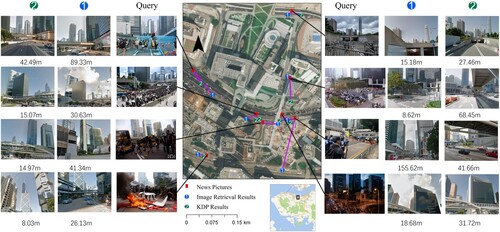
shows the results of the proposed pipeline implemented on the full street view dataset, in which the kernel density radius is set to 150 m. The local maxima of the KDP are sorted and composed into a list
, in which the locations are used to calculate ED. Approximately half of the news pictures return correct results on the Top 1 with 50 m threshold
(
). A total of 22.22% of the image location results are between 50 and 300 m. A total of 27.16% of the results have more than 300 m error. The accuracy improvement of
to
increases as the
increases from 50 m to 300 m.
is 7.4% batter than,
, while
is 24.69% batter than
.
Table 1. Results of the proposed pipeline.
Because the query images are distributed mainly in northern Hong Kong Island, some street view images in this area are selected for the experiment to analyze the performance on different dataset sizes. The subexperimental area includes 6,650 panoramas, as shown in . shows the subexperimental results of the proposed pipeline, where the kernel density radius is set to 150 m. Compared with the results of , the pipeline shows stable performance on the large urban environment. For example, the in (72.84%) is only 0.77% lower than the
in (74.07%).
Figure 9. The subexperimental area and dataset.
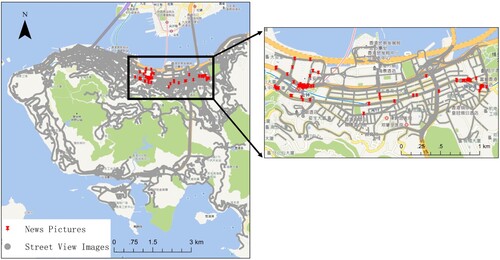
Table 2. The subexperimental results of this paper pipeline.
In addition, the comparison experiment using GFS (Chu et al. Citation2020), used for the geo-localization of street view images, is performed on the subdataset considering that the model takes a longer time for feature extraction on large-scale datasets. shows the subexperimental results of the GFS method. Overall, the pipeline in this paper has significantly improved compared to GFS for. The
improved by 17.29% from 33.33% to 50.62%. The proposed pipeline is slightly higher or equal to the GFS method for
. Moreover, experiments using global descriptor methods, GeM (Radenović, Tolias, and Chum Citation2019) and NetVLAD (Arandjelović et al. Citation2016), are also performed on the subdataset. and show the results of these methods. The performance of global descriptor methods is inferior because they are affected by noisy objects in the image, which prevents the representation of features with location information in the overall descriptor. describes the comparison of the statistics of ED with Top 1 results of the methods. Compared with GFS, the median error is reduced by 82.27 m from 130.04 m to 47.77 m. The average ED and standard deviation ED of this paper’s pipeline are also lower than the average ED and standard deviation ED of the GFS method. As shown in , the improvement of ED is computed for each image of our method and GFS, and the images are reordered according to the residuals, which is given by
(10)
(10) Among these images, for 34.57% of the image
improvement is insufficient (
); for 27.16% of the image
improvement interval is in [0, 50], and 35.80% of the image
has a significant improvement (
). also shows examples of query images for different ED distribution intervals. The
examples contain nighttime or low light images, which also demonstrates that the HOW-KDP is more robust to changes in illumination. In addition, the average and standard deviation of the ED are strongly influenced by extreme values. As shown in , a small portion of images are location failures and have extremely high ED, resulting in a high average and standard deviation of the ED.
Figure 10. The improvement of ED between both methods.
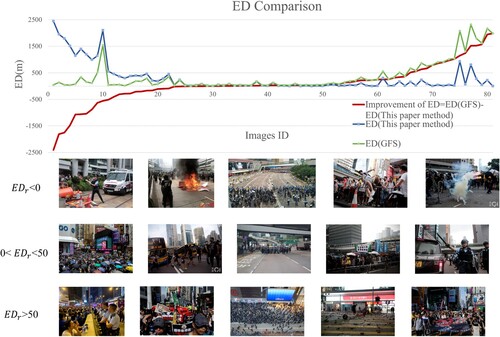
Table 3. The subexperimental results of the GFS method.
Table 4. The subexperimental results of the GeM method.
Table 5. The subexperimental results of the NetVLAD method.
Table 6. The statistics of subexperimental ED results of comparison.
5. Discussion
5.1 The feature extraction network analysis
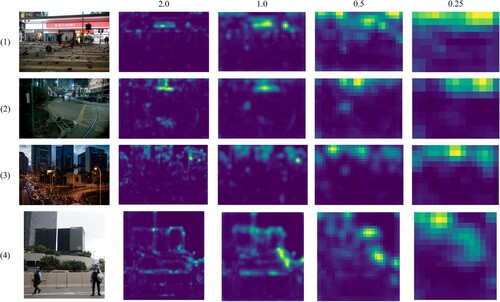
The performance of the network used in this paper was analyzed from two aspects. First, the feature map of the attention layer of the network was visualized, which shows that the network can extract local features of images with location information. shows the results of the attention layer visualization of example news images in the scales of [2.0, 1.0, 0.5, 0.25]. The yellow highlighted part in the image indicates a high attention score. Affected by the shooting perspective, the upper part of the image is more prominent, corresponding to visual content related to buildings, while roads and people distributed mainly in the bottom of the images are less obvious. The larger the scale of the image is, the smaller the image content covered by the extracted image features. Visual information expressed by image features at different scales can complement each other. At the 2.0 scale, the high scoring areas in (1) and (2) correspond to recognizable buildings, and if a building is the main visual content in the image, the network focuses more on the building outline, such as the images of (3) and (4). In feature maps of small-scale images, local features tend to represent larger region content rather than the edges of buildings or a small portion of landmarks.
Figure 11. The example of attention layer visualization of news images on different scales.
Next, the recall capability of the network was analyzed. In image-retrieval-based geo-localization methods, identifying and retrieving positive results is the basis for subsequent localization. Only if positive results can be retrieved can subsequent approaches such as KDP be used to improve recall. shows the results of the retrieval method from Step 2 of Section 3. The coordinates of street view images are regarded directly as the location of the result for computing ED. The locations in the list are sorted according to the similarity values.
is 74.07% to 95.06%, which indicates that most query images return the positive images in the Top 20. To include more positive samples, the KDP method considers street view results within the Top 100.
Table 7. Results of the retrieval method.
5.2. Kernel density prediction analysis
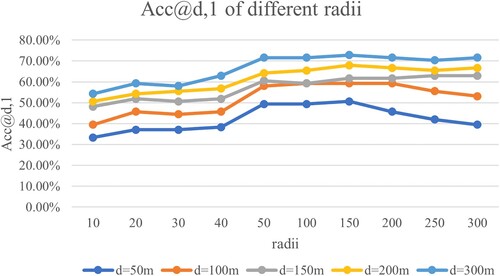
The performance of different query radii in the KDP method is analyzed first. shows the for different kernel density radii with the threshold
taken from 50 m to 300 m, in which the overall trend of the
increases and then decreases with increasing the kernel density radius. The highest
is reached when the radius is taken from 50 m to 200 m. A radius that is too large or too small may impact
. One of the reasons is the characteristics of the street view images. The landmark buildings in the query images may appear in street view images at a range of 100 m or even farther, which leads to the correct retrieval results that are distributed over extended roads. Since the distance between adjacent street view images is 10–12 m, a small radius hardly aggregates adjacent retrieval results in spatial terms.
Figure 12. Results in the different kernel density radii.
Then, this paper analyzes the improvement of the KDP method for ED. Compared with the retrieval method in , the of the KDP method in further improved the threshold
of 50 m to 300 m. In addition, the
of the KDP method improves less with increasing k and is lower or equal to the retrieval method in some k cases. The KDP clusters multiple spatially adjacent images into a single point that is finite in the prediction plane, resulting in insufficient correct candidate points in the ranking list
.
illustrates the top 1 positive result samples of query images, which shows the ED of the retrieval method and the KDP method below the result images. The purpose of the KDP method is to estimate the location, so the Top 1 images are returned by the nearest street view images. The location of the retrieval method is provided by the street view coordinates, so ideally, the minimum value of ED is the distance between the query image and the nearest street view image. However, adjacent street view images with similar scenes are also returned, which can increase the geo-localization error. Thus, the KDP method extracts the spatial focus of the retrieved results as the predicted location. In general, although the ED of the KDP method is larger than the ED of the retrieval method in some cases, the ED of most prediction locations is tolerable.
Figure 13. The Top 1 positive result samples of query images.
5.3. Error distance analysis and pipeline limitations
As shown in , the number of images with is the most concentrated and then gradually decreases until
reaches another increase. The query images with ED < 50 m account for approximately half of the total, with high geo-localization accuracy, and there are 77.78% query images with
. The images with
can be regarded as localization failure, which is caused by retrieval failure in most cases. The example results of also show that the query failed images have less obvious features of buildings in the visual content, or the marching crowd interferes and obscures the scene. Another reason for failure is the different shoot angles. Some of the images were taken from the upper floors of the building or from the side of the building, which is extremely different from the street view images in the reference dataset.
Figure 14. The distribution of KDP Top 1 ED and corresponding image retrieval Top 1 example results.
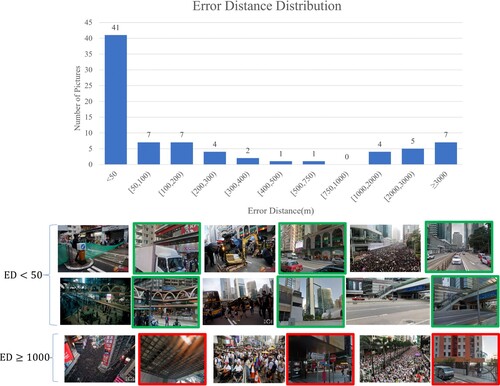
shows that 22.22% of the images failed to localize at (
). These images can be localized by manual recognition of subsequent candidate images or improving the accuracy of the retrieval method in the following work. For example, the robustness of the model to view changes and localization ability can be improved by generating a multiview building training dataset from spatially adjacent street view images.
There are still some limitations in the proposed pipeline. The existing ground-to-ground localization datasets and Hong Kong Street View imagery are not used as the training set. The former datasets have impressive performance in the other regions’ street view datasets, but they do not perform well in other types, i.e. news pictures. The reason for the general performance of the latter dataset may be related to the image quality and the sampling strategy used in the training process. Therefore, the GLD is used for the training network. In the future, the general methods to generate training datasets using the urban landmark categories and street view images of the study area will be studied in the expectation of learning building features in a weakly supervised method. Another approach is to improve the generalizability of the method trained on existing geo-localization datasets to enable it to be applied to other scenarios. Another limitation is that KDP performance relies on the results of image retrieval because this process generates location from the former results. The pipeline can be optimized further and the end-to-end model will also be explored in the future. In addition, considering that the time to extract image features increases proportionally with the number of images, the street view reference dataset will be thinned in future work to reduce the offline time spent on feature extraction.
6. Conclusions
This paper proposes a geo-localization pipeline based on deep learning, which uses street view images as reference datasets to offer geotags to news pictures. The proposed pipeline employs CNNs with HOW modules to extract local image features, which are aggregated into a compact vector by VLAD for fast retrieval. ASMK is used as a similarity function for image matching in news image large-scale retrieval task. Finally, KDP method estimates the location of news pictures. This paper implements the experiment on the news pictures about ‘Hong Kong’s Extradition Turmoil’. In the comparison experiments, the pipeline shows stable performance in the large-scale urban environment and improves the geo-localization accuracy of news pictures under 50 m from 33.33% to 50.62% compared with the previous method (GFS). The median error distance is reduced from 130.04 m to 47.77 m. The average and standard deviation errors are also lower than those of the GFS.
The main work of this paper is the geo-localization of news pictures with complex content in an urban environment. The portability of the model to other types of regions and images will be investigated in the future, especially in the non-landmark street views with similar buildings. Moreover, the application of the method will also be further explored. For example, the urban canyon effect often occurs around urban landmarks or building clusters, which distorts the accuracy of GPS. These areas with weak GPS signals could be improved by the method. For non-landmark street views, the localization results often include a series of similar locations on visual content that can be used to analyze the association or similarity pattern of a city.
Data availability statement
The data that support the findings of this study are available from the corresponding author upon reasonable request.
Disclosure statement
No potential conflict of interest was reported by the author(s).
References
- Arandjelović, Relja, Petr Gronat, Akihiko Torii, Tomas Pajdla, and Josef Sivic. 2016. “NetVLAD: CNN Architecture for Weakly Supervised Place Recognition.” 2016 IEEE Conference on Computer Vision and Pattern Recognition (CVPR), New Orleans, USA, 5297–5307. IEEE. doi:10.1109/CVPR.2016.572.
- Arandjelović, Relja, and Andrew Zisserman. 2013. “All About VLAD.” 2013 IEEE Conference on Computer Vision and Pattern Recognition, 1578–1585. IEEE. doi:10.1109/CVPR.2013.207.
- Babenko, Artem, and Victor Lempitsky. 2015. “Aggregating Deep Convolutional Features for Image Retrieval.” 2015 IEEE International Conference on Computer Vision (ICCV), 1269–1277. IEEE. doi:10.1109/ICCV.2015.150.
- Berton, Gabriele, Riccardo Mereu, Gabriele Trivigno, Carlo Masone, Gabriela Csurka, Torsten Sattler, and Barbara Caputo. 2022. “Deep Visual Geo-Localization Benchmark.” Proceedings of the IEEE/CVF Conference on Computer Vision and Pattern Recognition (CVPR), New Orleans, USA, 5396–5407. IEEE.
- Bhuvana, N., and I. Arul Aram. 2019. “Facebook and Whatsapp as Disaster Management Tools During the Chennai (India) Floods of 2015.” International Journal of Disaster Risk Reduction 39: 101135. doi:10.1016/j.ijdrr.2019.101135.
- Bruno, Arcanjo, Ferrarini Bruno, Milford Michael, McDonald-Maier Klaus D., and Ehsan Shoaib. 2022. “An Efficient and Scalable Collection of Fly-Inspired Voting Units for Visual Place Recognition in Changing Environments.” IEEE Robotics and Automation Letters 7 (2): 2527–2534. doi:10.1109/lra.2022.3140827.
- Cheng, Liang, Sensen Chu, Wenwen Zong, Shuyi Li, Jie Wu, and Manchun Li. 2017. “Use of Tencent Street View Imagery for Visual Perception of Streets.” ISPRS International Journal of Geo-Information 6 (9): 265. doi:10.3390/ijgi6090265.
- Cheng, Liang, Yi Yuan, Nan Xia, Song Chen, Yanming Chen, Kang Yang, Lei Ma, and Manchun Li. 2018. “Crowd-Sourced Pictures Geo-Localization Method Based on Street View Images and 3D Reconstruction.” ISPRS Journal of Photogrammetry and Remote Sensing 141: 72–85. doi:10.1016/j.isprsjprs.2018.04.006.
- Chu, Tianyou, Yumin Chen, Liheng Huang, Zhiqiang Xu, and Huangyuan Tan. 2020. “A Grid Feature-Point Selection Method for Large-Scale Street View Image Retrieval Based on Deep Local Features.” Remote Sensing 12 (23): 3978. doi:10.3390/rs12233978.
- Feng, Yansong, and Mirella Lapata. 2013. “Automatic Caption Generation for News Images.” IEEE Transactions on Pattern Analysis and Machine Intelligence 35 (4): 797–812. doi:10.1109/tpami.2012.118.
- Ge, Yixiao, Haibo Wang, Feng Zhu, Rui Zhao, and Hongsheng Li. 2020. “Self-Supervising Fine-Grained Region Similarities for Large-Scale Image Localization.” In Computer Vision – ECCV 2020, edited by Andrea Vedaldi, Horst Bischof, Thomas Brox, and Jan-Michael Frahm, 369–386. London: Springer. doi:10.1007/978-3-030-58548-8_22.
- He, Kaiming, Xiangyu Zhang, Shaoqing Ren, and Jian Sun. 2016. “Deep Residual Learning for Image Recognition.” 2016 IEEE Conference on Computer Vision and Pattern Recognition (CVPR), 770–778. IEEE. doi:10.1109/CVPR.2016.90.
- Jégou, Hervé, Matthijs Douze, Cordelia Schmid, and Patrick Pérez. 2010. “Aggregating Local Descriptors Into a Compact Image Representation.” 2010 IEEE Computer Society Conference on Computer Vision and Pattern Recognition, 3304–3311. IEEE. doi:10.1109/CVPR.2010.5540039.
- Jing, Fengrui, Lin Liu, Suhong Zhou, Jiangyu Song, Linsen Wang, Hanlin Zhou, Yiwen Wang, and Ruofei Ma. 2021. “Assessing the Impact of Street-View Greenery on Fear of Neighborhood Crime in Guangzhou, China.” International Journal of Environmental Research and Public Health 18 (1): 311. doi:10.3390/ijerph18010311.
- Johnson, Jeff, Matthijs Douze, and Hervé Jégou. 2019. “Billion-Scale Similarity Search with GPUs.” IEEE Transactions on Big Data 7 (3): 535–547. doi:10.1109/tbdata.2019.2921572.
- Kalantidis, Yannis, Clayton Mellina, and Simon Osindero. 2016. “Cross-Dimensional Weighting for Aggregated Deep Convolutional Features.” In Computer Vision – ECCV 2016 Workshops, edited by Gang Hua and Hervé Jégou, 685–701, Amsterdam, The Netherlands. ECCV. doi:10.1007/978-3-319-46604-0_48.
- Kelly, Cheryl M., Jeffrey S. Wilson, Elizabeth A. Baker, Douglas K. Miller, and Mario Schootman. 2013. “Using Google Street View to Audit the Built Environment: Inter-Rater Reliability Results.” Annals of Behavioral Medicine 45 (1): 108–112. doi:10.1007/s12160-012-9419-9.
- Kim, Hyo Jin, Enrique Dunn, and Jan-Michael Frahm. 2017. “Learned Contextual Feature Reweighting for Image Geo-Localization.” 2017 IEEE Conference on Computer Vision and Pattern Recognition (CVPR), 3251–3260. IEEE. doi:10.1109/CVPR.2017.346.
- Lehtola, Ville V., Juho-Pekka Virtanen, Antero Kukko, Harri Kaartinen, and Hannu Hyyppä. 2015. “Localization of Mobile Laser Scanner Using Classical Mechanics.” ISPRS Journal of Photogrammetry and Remote Sensing 99: 25–29. doi:10.1016/j.isprsjprs.2014.10.008.
- Li, Xiaojiang. 2021. “Examining the Spatial Distribution and Temporal Change of the Green View Index in New York City Using Google Street View Images and Deep Learning.” Environment and Planning B: Urban Analytics and City Science 48 (7): 2039–2054. doi:10.1177/2399808320962511.
- Li, Xin, Liang Li, Xiangrong Wang, Qing Lin, Danzi Wu, Yang Dong, and Shuang Han. 2021. “Visual Quality Evaluation Model of an Urban River Landscape Based on Random Forest.” Ecological Indicators 133: 108381. doi:10.1016/j.ecolind.2021.108381.
- Li, Xiaojiang, Carlo Ratti, and Ian Seiferling. 2017. “Mapping Urban Landscapes Along Streets Using Google Street View.” In Advances in Cartography and Giscience, edited by M. P. Peterson, 341–356. doi:10.1007/978-3-319-57336-6_24.
- Lin, Binbin, Lei Zou, Nick Duffield, Ali Mostafavi, Heng Cai, Bing Zhou, Jian Tao, Mingzheng Yang, Debayan Mandal, and Joynal Abedin. 2022. “Revealing the Linguistic and Geographical Disparities of Public Awareness to Covid-19 Outbreak Through Social Media.” International Journal of Digital Earth 15 (1): 868–889. doi:10.1080/17538947.2022.2070677.
- Liu, Liu, and Hongdong Li. 2019. “Lending Orientation to Neural Networks for Cross-View Geo-Localization.” 2019 IEEE/CVF Conference on Computer Vision and Pattern Recognition (CVPR), 5617–5626. IEEE. doi:10.1109/CVPR.2019.00577.
- Lock, Oliver, Tomasz Bednarz, and Christopher Pettit. 2021. “The Visual Analytics of Big, Open Public Transport Data – A Framework and Pipeline for Monitoring System Performance in Greater Sydney.” Big Earth Data 5 (1): 134–159. doi:10.1080/20964471.2020.1758537.
- Meng, Lingchao, Kuo-Hsun Wen, Zhijie Zeng, Richard Brewin, Xiaolei Fan, and Qiong Wu. 2020. “The Impact of Street Space Perception Factors on Elderly Health in High-Density Cities in Macau—Analysis Based on Street View Images and Deep Learning Technology.” Sustainability 12 (5): 1799. doi:10.3390/su12051799.
- Ning, Huan, Zhenlong Li, Xinyue Ye, Shaohua Wang, Wenbo Wang, and Xiao Huang. 2022. “Exploring the Vertical Dimension of Street View Image Based on Deep Learning: A Case Study on Lowest Floor Elevation Estimation.” International Journal of Geographical Information Science 36 (7): 1317–1342. doi:10.1080/13658816.2021.1981334.
- Nizzoli, Leonardo, Marco Avvenuti, Maurizio Tesconi, and Stefano Cresci. 2020. “Geo-Semantic-Parsing: AI-Powered Geoparsing by Traversing Semantic Knowledge Graphs.” Decision Support Systems 136: 113346. doi:10.1016/j.dss.2020.113346.
- Noh, Hyeonwoo, Andre Araujo, Jack Sim, Tobias Weyand, and Bohyung Han. 2017. “Large-Scale Image Retrieval with Attentive Deep Local Features.” 2017 IEEE International Conference on Computer Vision (ICCV), 3476–3485. IEEE. doi:10.1109/ICCV.2017.374.
- Park, Chanho, Hyunwoo Cho, Sangheon Park, Sung-Uk Jung, and Suwon Lee. 2022. “Strategy for Creating AR Applications in Static and Dynamic Environments Using SLAM- and Marker Detector-Based Tracking.” CMES-Computer Modeling in Engineering & Sciences 131 (1): 529–549. doi:10.32604/cmes.2022.019214.
- Perronnin, Florent, and Christopher Dance. 2007. “Fisher Kernels on Visual Vocabularies for Image Categorization.” 2007 IEEE Conference on Computer Vision and Pattern Recognition, 1–8. IEEE. doi:10.1109/CVPR.2007.383266.
- Radenović, Filip, Giorgos Tolias, and Ondřej Chum. 2019. “Fine-Tuning CNN Image Retrieval with No Human Annotation.” IEEE Transactions on Pattern Analysis and Machine Intelligence 41 (7): 1655–1668. IEEE. doi:10.1109/tpami.2018.2846566.
- Sarlin, Paul-Edouard, Ajaykumar Unagar, Mans Larsson, Hugo Germain, Carl Toft, Viktor Larsson, Marc Pollefeys, Vincent Lepetit, Lars Hammarstrand, and Fredrik Kahl. 2021. “Back to the Feature: Learning Robust Camera Localization from Pixels to Pose.” 2021 IEEE/CVF Conference on Computer Vision and Pattern Recognition (CVPR), 3246–3256. IEEE. doi:10.1109/CVPR46437.2021.00326.
- Sattler, Torsten, Will Maddern, Carl Toft, Akihiko Torii, Lars Hammarstrand, Erik Stenborg, Daniel Safari, Masatoshi Okutomi, Marc Pollefeys, and Josef Sivic. 2018. “Benchmarking 6dof Outdoor Visual Localization in Changing Conditions.” 2018 IEEE/CVF Conference on Computer Vision and Pattern Recognition, 8601–8610. IEEE. doi:10.1109/CVPR.2018.00897.
- Shang, Lanyu, Yang Zhang, Christina Youn, and Dong Wang. 2022. “SAT-Geo: A Social Sensing Based Content-Only Approach to Geolocating Abnormal Traffic Events Using Syntax-Based Probabilistic Learning.” Information Processing & Management 59 (2): 16. doi:10.1016/j.ipm.2021.102807.
- Shi, Yujiao, Xin Yu, Liu Liu, Dylan Campbell, Piotr Koniusz, and Hongdong Li. 2022. “Accurate 3-DoF Camera Geo-Localization via Ground-to-Satellite Image Matching.” arXiv preprint arXiv:2203.14148.
- Sivic, Josef, and Andrew Zisserman. 2003. “Video Google: A Text Retrieval Approach to Object Matching in Videos.” Proceedings of the Ninth IEEE International Conference on Computer Vision. Vol. 2, 1470–1477. IEEE. doi:10.1109/ICCV.2003.1238663.
- Skripnikov, A., N. Wagner, J. Shafer, M. Beck, E. Sherwood, and M. Burke. 2021. “Using Localized Twitter Activity to Assess Harmful Algal Bloom Impacts of Karenia Brevis in Florida, USA.” Harmful Algae 110: 102118. doi:10.1016/j.hal.2021.102118.
- Song, Chenguang, Nianwen Ning, Yunlei Zhang, and Bin Wu. 2021. “A Multimodal Fake News Detection Model Based on Crossmodal Attention Residual and Multichannel Convolutional Neural Networks.” Information Processing & Management 58 (1): 102437. doi:10.1016/j.ipm.2020.102437.
- Tancik, Matthew, Vincent Casser, Xinchen Yan, Sabeek Pradhan, Ben Mildenhall, Pratul P. Srinivasan, Jonathan T. Barron, and Henrik Kretzschmar. 2022. “Block-NeRF: Scalable Large Scene Neural View Synthesis.” arXiv preprint arXiv:2202.05263. doi:10.48550/arXiv.2202.05263.
- Tian, Yurun, Vassileios Balntas, Tony Ng, Axel Barroso-Laguna, Yiannis Demiris, and Krystian Mikolajczyk. 2020. “D2D: Keypoint Extraction with Describe to Detect Approach.” arXiv preprint arXiv:2005.13605. doi:10.48550/arXiv.2005.13605.
- Toker, Aysim, Qunjie Zhou, Maxim Maximov, and Laura Leal-Taixe. 2021. “Coming Down to Earth: Satellite-to-Street View Synthesis for Geo-Localization.” 2021 IEEE/CVF Conference on Computer Vision and Pattern Recognition, 6484–6493. IEEE. doi:10.1109/CVPR46437.2021.00642.
- Tolias, Giorgos, Yannis Avrithis, and Hervé Jegou. 2016. “Image Search with Selective Match Kernels: Aggregation Across Single and Multiple Images.” International Journal of Computer Vision 116 (3): 247–261. doi:10.1007/s11263-015-0810-4.
- Tolias, Giorgos, Sicre Ronan, and Jégou Hervé. 2015. “Particular Object Retrieval with Integral Max-Pooling of CNN Activations.” arXiv preprint arXiv:1511.05879. doi:10.48550/arXiv.1511.05879.
- Tolias, Giorgos, Jenicek Tomas, and Chum Ondřej. 2020. “Learning and Aggregating Deep Local Descriptors for Instance-Level Recognition.” Computer Vision – ECCV 2020, edited by Andrea Vedaldi, Horst Bischof, Thomas Brox, and Jan-Michael Frahm, 460–477. ECCV. doi:10.1007/978-3-030-58452-8_27.
- Torii, Akihiko, Josef Sivic, Masatoshi Okutomi, and Tomas Pajdla. 2015. “Visual Place Recognition with Repetitive Structures.” IEEE Transactions on Pattern Analysis and Machine Intelligence 37 (11): 2346–2359. doi:10.1109/tpami.2015.2409868.
- Wang, Tingyu, Zhedong Zheng, Chenggang Yan, Jiyong Zhang, Yaoqi Sun, Bolun Zheng, and Yi Yang. 2022. “Each Part Matters: Local Patterns Facilitate Cross-View Geo-Localization.” IEEE Transactions on Circuits and Systems for Video Technology 32 (2): 867–879. doi:10.1109/tcsvt.2021.3061265.
- Wilson, Daniel, Xiaohan Zhang, Waqas Sultani, and Safwan Wshah. 2021. “Visual and Object Geo-localization: A Comprehensive Survey.” arXiv preprint arXiv:2112.15202. doi:10.48550/arXiv.2112.15202.
- Xia, Yixi, Nobuyoshi Yabuki, and Tomohiro Fukuda. 2021. “Development of a System for Assessing the Quality of Urban Street-Level Greenery Using Street View Images and Deep Learning.” Urban Forestry & Urban Greening 59: 126995. doi:10.1016/j.ufug.2021.126995.
- Yang, Kehua, Shaosong Long, Wei Zhang, Jiqing Yao, and Jing Liu. 2020. “Personalized News Recommendation Based on the Text and Image Integration.” Computers, Materials & Continua 64 (1): 557–570. doi:10.32604/cmc.2020.09907.
- Yang, Tsun-Yi, Duy-Kien Nguyen, Huub Heijnen, and Vassileios Balntas. 2020. “Ur2kid: Unifying Retrieval, Keypoint Detection, and Keypoint Description without Local Correspondence Supervision.” arXiv preprint arXiv: 2001.07252. doi:10.48550/arXiv.2001.07252.
- Zhang, Fan, and Yu Liu. 2021. “Street View Imagery: Methods and Applications Based on Artificial Intelligence.” Journal of Remote Sensing 25 (5): 1043–1054. doi:10.11834/jrs.20219341.
- Zheng, Xin, Jialong Han, and Aixin Sun. 2018. “A Survey of Location Prediction on Twitter.” IEEE Transactions on Knowledge and Data Engineering 30 (9): 1652–1671. doi:10.1109/tkde.2018.2807840.
- Zheng, Zhedong, Yunchao Wei, and Yi Yang. 2020. “University-1652: A Multi-View Multi-Source Benchmark for Drone-Based Geo-Localization.” Proceedings of the 28th ACM International Conference on Multimedia, 1395–1403. ACM. doi:10.1145/3394171.3413896.
- Zhi, Lanyue, Zhifeng Xiao, Yonggang Qiang, and Linjun Qian. 2021. “Street-Level Image Localization Based on Building-Aware Features via Patch-Region Retrieval Under Metropolitan-Scale.” Remote Sensing 13 (23): 4876. doi:10.3390/rs13234876.
- Zhu, Yingying, Bin Sun, Xiufan Lu, and Sen Jia. 2022. “Geographic Semantic Network for Cross-View Image Geo-Localization.” IEEE Transactions on Geoscience and Remote Sensing 60: 1–14. doi:10.1109/tgrs.2021.3121337.
- Zou, Lei, Nina S. N. Lam, Shayan Shams, Heng Cai, Michelle A. Meyer, Seungwon Yang, Kisung Lee, Seung-Jong Park, and Margaret A. Reams. 2019. “Social and Geographical Disparities in Twitter Use During Hurricane Harvey.” International Journal of Digital Earth 12 (11): 1300–1318. doi:10.1080/17538947.2018.1545878.