
 ?Mathematical formulae have been encoded as MathML and are displayed in this HTML version using MathJax in order to improve their display. Uncheck the box to turn MathJax off. This feature requires Javascript. Click on a formula to zoom.
ABSTRACT
To meet the growing demand for socioeconomic development, a large amount of groundwater is extracted from confined aquifers worldwide. The North China Plain has experienced considerable groundwater depletion and subsidence during the past six decades. In this study, we use Sentinel-1A/B SAR images from 2015 to 2020 to map the ground subsidence of the Tianjin–Langfang area. Three subsiding zones centered at Guangyang, Wuqing–Bazhou, and Jinghai are identified with maximum subsidence rates of 98.1, 121.8, and 104.7 mm/yr. Seasonal and long-term signals are separated from time series subsidence and hydraulic measurements using continuous wavelet transform to retrieve aquifer parameters. The long-term subsidence, which fits well with an exponential decaying model, remarkably slows down in our study area. The elastic skeletal storage coefficients range between 0.52×10⁻³ and 9.66×10⁻³. We then retrieve the spatial–temporal variations of total groundwater storage, recoverable groundwater storage, and irreversible groundwater storage. Groundwater storage depletion rates are apparently reducing, which benefits from the operation of the South-to-North Water Transfer Project and local groundwater management practices.
1 Introduction
With socioeconomic development in recent years, land subsidence due to unsustainable exploitation of groundwater has been widely observed in megacities worldwide, e.g. Beijing (Du et al. Citation2018), Tianjin (Tang et al. Citation2021), Jakarta (Chaussard et al. Citation2013), Konya (Orhan Citation2021), Mashhad (Khorrami et al. Citation2020), and Hanoi (Bui et al. Citation2021). As China’s political, economic, and cultural center, the North China Plain (NCP) has a large water demand for the industry, agriculture, and domestic uses. Groundwater accounts for more than 70% of the total water supply in the NCP (Qin Citation2019). Since the 1970s, groundwater has been extracted at high rates, forming a large-scale cone of depression in the region (Guo et al. Citation2020). A hydraulic head with a decline of 40–110 m was observed in cities in the middle east of the NCP during 1984–2014 (Yang et al. Citation2021). The rapid decline of groundwater decreases the pore pressure and increases the effective stress of aquifers, resulting in the deformation of the aquifer skeleton. Consequently, the NCP has become the largest subsidence-affected area with fast subsidence rates (Guo et al. Citation2017; Zhang et al. Citation2014). A maximum cumulative subsidence of 1.1 m was identified in Beijing during 1995–2007 (Zhang et al. Citation2014). Areas covering more than 4000 km2 with a cumulative subsidence >1 m have been identified in the Tianjin plain since 1958 (Wang et al. Citation2010). Various groundwater exploitation restriction and prohibition policies have been issued by the local government (Tang et al. Citation2021; Guo et al. Citation2017), and the middle and east routes of the South-to-North Water Transfer Project (SNWTP) have been put in operation (Dong et al. Citation2021; Ha et al. Citation2020). Groundwater levels have stabilized in many locations (Long et al. Citation2020).
Interferometric Synthetic Aperture Radar (InSAR) is an effective tool for qualifying the spatial–temporal variations of regional deformation with millimeter-level precision (Xiao et al. Citation2022; Jiang, Zhao, and Shi Citation2022; Shi et al. Citation2022). Multitemporal InSAR analysis methods have been utilized to characterize the subsidence of the NCP or major cities in the plain with multiband SAR datasets, e.g. C-band ERS1/2 (Zhang et al. Citation2016), Envisat ASAR (Jiang, Lin, and Zhao Citation2010; Perissin and Wang Citation2011), RADARSAT-2 (Zhou et al. Citation2019; Zhou et al. Citation2016), Sentinel-1 (Dong et al. Citation2021; Shi et al. Citation2020; Tang et al. Citation2021), X-band TerraSAR-X (Luo et al. Citation2014; Qin et al. Citation2017), and L-band ALOS PALSAR (Luo et al. Citation2014; Liu et al. Citation2016) datasets. The measured ground subsidence due to groundwater extraction is related to groundwater storage (GWS) variations and aquifer parameters (Chaussard et al. Citation2014; Hoffmann, Galloway, and Zebker Citation2003). Thus, InSAR-measured subsidence is also used to retrieve fine-scale GWS variations in the NCP together with hydraulic head measurements in the Cangzhou and Beijing Plain (Jiang et al. Citation2018; Zhang et al. Citation2022; Bai et al. Citation2022). Previous studies in the Tianjin–Langfang area are concentrated in ground deformation monitoring (e.g. Luo et al. Citation2014; Liu et al. Citation2016; Zhang et al. Citation2016; Zhou et al. Citation2020; Tang et al. Citation2022) and aquifer parameter estimation (e.g. Zhang et al. Citation2019; Liu et al. Citation2016). In the meantime, regional reductions of GWS depletion have been observed in the NCP (Long et al. Citation2020; Xu et al. Citation2021) from low resolution Gravity Recovery and Climate Experiment (GRACE) measurements after the operation of SWNTP. However, ground displacement patterns and aquifer responses in the plain remain complex. This study aims to analyze the subsidence, aquifer parameters, and fine-scale GWS variations in the Tianjin–Langfang area, which are crucial for sustainable local groundwater management.
In this study, we first map the spatial and temporal subsidence of the Tianjin–Langfang area between February 2015 and September 2020 through Sentinel-1 InSAR analysis. The seasonal and long-term trends of subsidence are separated with continuous wavelet transforms (CWT). Then, the long-term trends are used to estimate the aquifer decaying factors, whereas the seasonal subsidence and hydraulic measurements are utilized to estimate skeletal storability coefficients. Fine-scale GWS variations over the study area are retrieved and analyzed on the basis of InSAR-derived subsidence maps and hydraulic measurements. Finally, we discuss the impact of SNWTP on groundwater variations and ground deformation.
2 Study area and datasets
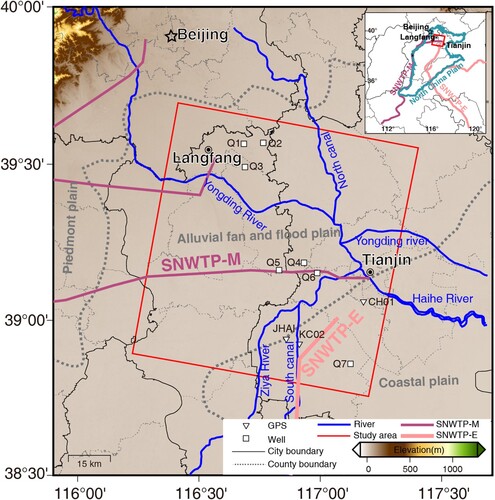
The NCP is an alluvial plain formed mainly by the Yellow, Huaihe, Haihe, and Luanhe rivers. It can be divided into piedmont plain, alluvial fan and flood plain, and coastal plain according to different deposits (Chen et al. Citation1996). The alluvial Quaternary sediments with thickness of 200–600 m are mainly composed of pebbles, gravels, sand, silt, and clay (Guo et al. Citation2015). The aquifer systems in the Quaternary strata in the middle east of the plain include four aquifer groups separated by silt or clay layers (Guo et al. Citation2015). The first and second groups are unconfined or semiconfined aquifers, whereas the third and fourth groups are confined aquifers. The lower boundary depths of the first, second, third, and fourth aquifer groups are 40–60, 120–170, 250–310, and 350–550 m (Zhang et al. Citation2009; Yang et al. Citation2021).
Our study area () is located at the junction of Tianjin and Langfang cities. This area has a long history of deep groundwater exploitation and subsidence. Groundwater cones of depression in the third and fourth aquifer groups were identified in 1973 and 1997 and have further expanded from urban to rural areas since then (Ha et al. Citation2020). The recorded maximum groundwater level declines were ∼60 m during 1980–2015 and ∼30 m during 1997–2015 in the third and fourth aquifer groups, respectively. The subsidence of Tianjin can be traced back to the 1920s (Guo et al. Citation2015) and has gradually become considerable due to excessive groundwater extraction, causing a remarkable land subsidence rate of 15–170 mm/yr (Tang et al. Citation2021; Zhang et al. Citation2019; Zhao et al. Citation2019; Guo and Zhan Citation2020). Recently, the SNWTP has been providing water supplies for residents in Tianjin and Langfang cities (Tang et al. Citation2021). The hydraulic head in the urban areas of Tianjin has been recovering at rates of 1–2 m/yr (Yang et al. Citation2021).
Figure 1. Location of our study area; the inset is the location of NCP and the middle and east routes of the SNWTP. The gray lines are boundaries between different types of plains.
A groundwater cone of depression with an area of 18 km2 was identified in the urban area of Langfang City in 1978 and then expanded considerably due to rapid groundwater withdrawal (Yi et al. Citation2005). The annual extraction rate of groundwater in a deep confined aquifer during 2001–2015 was 0.33 m/yr (Hou and Li Citation2020). The groundwater cone of depression was up to 300 km2 until 2015 (Hou and Li Citation2020). The subsidence rate increased from 5 mm/yr during 1979–1983 (Yi et al. Citation2005) to ∼80 mm/yr during 2001–2015 (Hou and Li Citation2020; He et al. Citation2012).
Our study area has a semiarid and semihumid continental monsoon climate with distinct seasons. The annual rainfall is approximately 500–600 mm, 75% of which is concentrated in summer (Guo et al. Citation2015; Yang et al. Citation2021). However, the annual evaporation is approximately twice the annual rainfall (Yang et al. Citation2021). The Yongding River, South Canal, North Canal, and Ziya River () are tributaries of the Haihe River and are seasonally recharged by rainfall.
We collect a total of 124 Sentinel-1A/B SAR images acquired in descending orbit on path 47 spanning from February 2015 to September 2020. These images are acquired in Terrain Observation with Progressive Scans (TOPS) mode with a spatial resolution of 20 × 5 m. The average incidence angle is ∼33.9°. SAR image acquired on 21 December, 2017 is selected as a reference image. A maximum of three connections with temporal baselines < 120 days for each image are allowed to generate interferograms (Figure S1). Daily precipitation records at station (117.17°, 39.1°) are used to analyze the impact factors. We obtain hydraulic head measurements during April 2019 and September 2020 at seven observation wells (Q1–Q7 in ) of the confined aquifer to analyze the aquifer parameters. Ground deformation measurements at three continuous GPS stations (KC02, CH01, and JHAI) during 2016–2019 are acquired to validate our InSAR deformation results. The raw GPS measurements from these three stations are processed using GAMIT/GLOBK 10.40 software (Herring, King, and Mcclusky Citation2010) with respect to the ITRF 2008 reference frame. We use the ALOS World 3D-30 m (AW3D30) digital elevation model to generate differential interferogram and geocoding.
3 Methodology
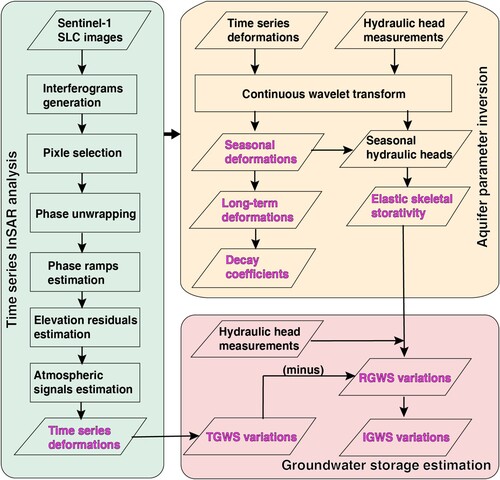
In this section, we first derive the time series deformation from time series InSAR analysis. We then separate the seasonal and long-term deformations from the derived deformations to retrieve the aquifer parameters, which are useful for the GWS variation estimation. The workflow is given in .
Figure 2. Flow chart of our study.
3.1 InSAR data processing
The Doppler centroid frequency considerably varies within each burst of TOPS SAR images; thus, an enhanced spectral diversity method is used to avoid azimuth coregistration errors (Jiang Citation2020; Jiang et al. Citation2017). We use the GAMMA software to coregister and stitch all the bursts into seamless images (Wegmüller et al. Citation2015). The topographic phase is removed using an AW3D30 DEM. Multilook factors of eight in range and two in azimuth are applied with a spatial resolution of approximately 40 m. To improve the signal-to-noise ratios of distributed scatterers with low phase stabilities, an adaptive filter with homogeneous pixels is applied (Jiang et al. Citation2015; Zhao and Jiang Citation2022). Two interferograms superimposed on amplitudes in SAR image coordinates are given as examples in Figure S2.
We initially use a loose amplitude dispersion threshold (<0.6) to include pixel candidates. A temporal coherence threshold (>0.3) is then utilized to exclude noisy candidates for time series analysis (Jiang and Guarnieri Citation2020). Spatial two-dimensional phase unwrapping is performed on the selected pixels. We remove the phase ramps in each interferogram by using a bilinear model. The phase related to elevation residuals in each pixel is estimated and removed by linearly fitting phases and perpendicular baselines. The atmospheric signals on each interferogram are corrected using Generic Atmospheric Correction Online Service for InSAR products (Yu, Li, and Penna Citation2018). The time series deformations are then inverted with singular value decomposition. A previous study indicated that the horizontal deformation of this area is minimal (Tang et al. Citation2021). Thus, we directly project the line-of-sight deformation into the vertical direction through dividing by the cosine of the incidence angle.
3.2 Aquifer parameter inversion
To retrieve the aquifer parameters further, InSAR time series deformations and hydraulic head measurements can be decomposed into seasonal and long-term trend signals. Wavelet transform is a useful tool when dealing with natural nonstationary signals (Torrence and Compo Citation1998). CWT can separate frequency features at different times and frequencies from time series signals (Miller and Shirzaei Citation2015). In this study, we utilize CWT to separate the seasonal components from time series deformations and hydraulic heads. We first remove the linear trend by assuming a constant rate (Jiang et al. Citation2018). Then, time series residuals are decomposed into a series of signals with different time and frequency scales. The short-term signal is reconstructed using signals with time scales between 0.5 and 1 year through inverse filter. The amplitude is half of the difference between the maximum value and the minimum value within a year. The long-term trend is then retrieved by subtracting the short-term seasonal signal from the original time series signals.
The long-term deformation is related to the inelastic compaction of confined aquifer caused by prolonged groundwater decline. The compaction of confined aquifer with low hydraulic conductivity usually takes decades or even hundreds of years to reach the delayed balance with groundwater level. According to hydrodynamic consolidation theory, long-term deformation can be characterized by an exponential function of time (Hu, Lu, and Wang Citation2018).
(1)
(1) where dl(t) is the long-term deformation at time t, M is the magnitude coefficient of aquifer response, and K is the decay coefficient between [−1, 0]. M and K are estimated using least squares method.
The dimensionless elastic skeletal storage coefficient reflects the response of the aquifer or aquitard to the short-term change of the hydraulic head and plays a crucial role in groundwater management. It describes the volume of water stored (or drained) over an aquifer area due to hydraulic head changes without causing inelastic deformation (Miller and Shirzaei Citation2015; Zhang et al. Citation2019). The elastic skeletal storage coefficient (Ske) of an aquifer system can be retrieved using the following equation:
(2)
(2) where Δds and Δhs are the seasonal elastic vertical deformation and hydraulic head change, respectively. Generally, a time lag exists between seasonal vertical deformation and hydraulic head variations, which can be determined by the correlation analysis method (Jiang et al. Citation2018). The estimated constant time lags are used to calibrate the seasonal deformation. In the meantime, linear interpolations of the seasonal deformation are used to obtain deformations that synchronize with the hydraulic head observations. The elastic skeletal water storage coefficient is retrieved by using the least squares method.
3.3 GWS estimation
Total groundwater storage (TGWS) variations are equal to aquifer compaction/expansion in a confined aquifer system (Jiang et al. Citation2018), which can be estimated from the vertical deformations retrieved from InSAR. This assumption is reasonable in our study; the subsidence in Tianjin is mainly contributed by the compaction of the aquifer system below 300 m (Guo et al. Citation2017).
(3)
(3) where ΔV is the TGWS variations, Δdt is the total vertical deformation, and A is the aquifer area. TGWS can be divided into recoverable (ΔVr) and irreversible (ΔVi) GWS.
Recoverable groundwater storage (RGWS) can be restored when the aquifer is recharged. It can be estimated using the elastic water storage coefficient and hydraulic head variations.
(4)
(4) where Δht is the total hydraulic head change. Irreversible groundwater storage (IGWS) can be estimated from the TGWS by removing the RGWS.
4 Results and analysis
4.1 Subsidence and seasonal deformation
The subsidence rate and amplitude of seasonal deformation in our study area from the Sentinel-1 dataset during 2015–2020 are given in (a,b), respectively. The original displacement rate in the line-of-sight directions are given in Figure S3. A total of 6,226,271 measurement points are detected, and the density is ∼798 points/km2. We identify three large subsiding areas centered at Guangyang, Wuqing–Bazhou, and Jinghai in (a). Subsiding areas with rates exceeding 30 mm/yr are outlined with polygons, and the areas are 357.1, 1,470.8, and 317.9 km2, respectively. The distributions of the subsidence area and the seasonal deformation are not identical. Apparent seasonal amplitudes (10–15 mm) are identified in agricultural areas ((b)). Seasonal variations of groundwater due to irrigation and precipitation induce these seasonal deformations (Zhou et al. Citation2020; Tang et al. Citation2022).
Figure 3. Deformation maps and profiles. (a) long-term subsidence rate and (b) amplitude of seasonal deformation during 2015–2020, (b–d) time series subsidence of profiles AA’, BB’, and CC’. The triangle in (a) is the reference point.
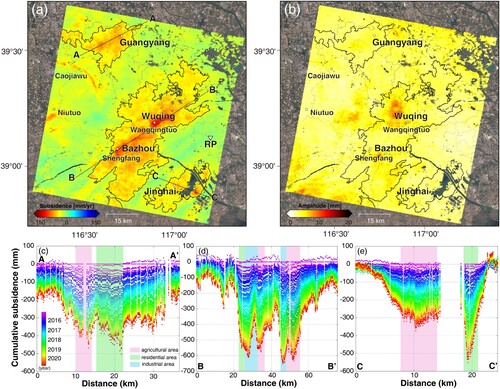
The maximum subsidence rate in Guangyang in Langfang City was 65 mm/yr during 2003–2007 (Ge et al. Citation2008) and increased to 98.1 mm/yr during 2015–2020 ((a)). Although the subsidence rates are close between these two periods, the subsiding area expands from the north to almost the whole urban area of Langfang City. The accumulative subsidence of profile AA’ is given in (c). The groundwater extraction in the urban area of Langfang City has become steady since 2009 (Hou and Li Citation2020) and decreased after the operation of the SNWTP, with the subsidence rate reaching approximately –60 mm/yr. Currently, the subsidence is concentrated in the agricultural area and the newly developed residential area. The cumulative displacement reached 468.1 and 502.3 mm in 2015 and 2020, respectively.
Wuqing in Tianjin City and Bazhou in Langfang City are two important bases of secondary industries. A large amount of deep groundwater extraction resulted in serious ground subsidence, and the maximum rate exceeded 200 mm/yr during 2005–2006 (Zhang, Li, and Xia Citation2008). Two obvious subsidence centers are located in Wangqingtuo town of Wuqing with rates from 90 to 122 mm/yr and Shengfang town of Bazhou with rates ranging from 80 mm/yr to 100 mm/yr. The cumulative subsidence at the Wangqingtuo and Shengfang subsidence centers were 609.5 and 651.7 mm, respectively, during 2015–2020 in profile BB’, as shown in (d).
The subsidence rates are less than 60 mm/yr in most areas of Jinghai, whereas the maximum rate of 104.7 mm/yr is detected in newly constructed residential areas. Profile CC’ in (e) indicates that the maximum cumulative subsidence was 551.1 mm during 2015–2020. Two small-scale subsiding areas are centered in Caojiawu town in Yongqing County and Niutuo town in Gu’an County with subsidence rates of approximately 60 mm/yr. This condition is caused by irrigation-related groundwater extraction.
4.2 Comparison between InSAR and GPS measurements
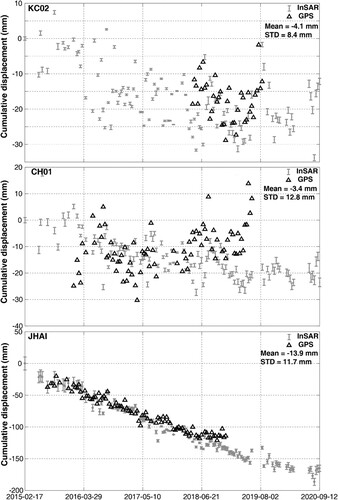
We projected the three-dimensional displacements from GPS into the LOS direction of the Sentinel-1 dataset. InSAR measurements within a 50-m distance from the GPS station were averaged and compared with GPS measurements (). The cumulative LOS deformation at KC02, CH01, and JHAI are −12.2, −23.5, and −165.1 mm, respectively. The measurements agree well between the two techniques, thereby validating the reliability of our InSAR deformation results. The mean and standard deviations of the measurement difference between InSAR and GPS from the same dates at KC02, CH01, and JHAI are less than 14 mm (). The disagreement between InSAR and GNSS deformation time series is probably due to the deformation representations, in which InSAR reflects deformation over a 50-m area, whereas GNSS reflects the local deformation of the GNSS pillar (Bui et al. Citation2021).
Figure 4. Comparison between InSAR and GPS measurements.
4.3 Long-term decaying coefficient
The decaying coefficient K and magnitude coefficient M are given in . The root mean square error (RMSE) of the exponential decaying model is given in Figure S4. The decaying coefficient describes the long-term delayed response of ground subsidence to the change in hydraulic heads. The negative and positive values of M denote the uplift (aquifer recovery) and subsidence (aquifer compaction), respectively, of the ground ((b)). The RMSE values of all the pixels are < 30 mm. In this study, pixels with a magnitude coefficient < 10,000 mm (accounting for 88.4% of the total pixels given in 4b) are analyzed to ensure robustness. A smaller K value means a relatively faster response to the change in hydraulic head and a shorter time for the hydraulic dynamics of the aquifer system to reach equilibrium. Decaying coefficients of −0.5 to −0.15 centered at D1–D5 are apparently lower than those in the rest of the areas in Guangyang and Wuqing–Bazhou, suggesting a faster response to hydraulic head change. The mean decaying coefficient in Jinghai is −0.1 without apparent clustered low values. Decaying coefficients <−0.5 are identified in Yixingbu town (marked by D6) of Tianjin City, indicating high hydraulic conductivity of the aquifer system in this area. Yixingbu town was a subsidence bowl during the 1970s–1990s (Ha et al. Citation2020), and the subsidence rate is 5.4 mm/yr during 2015–2020 ((a)).
Figure 5. Modeled (a) decay coefficient K and (b) magnitude coefficient M from long-term subsidence using the exponential decaying model.
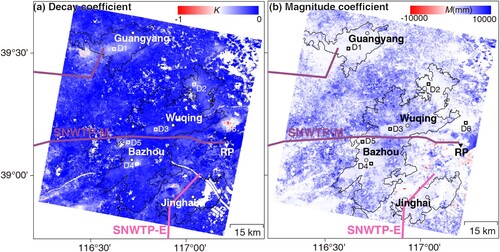
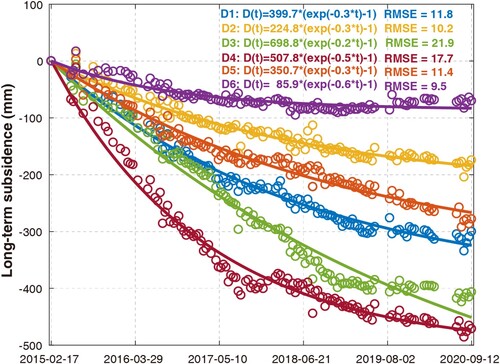
The long-term subsidence of six typical locations marked in and their modeled parameters using the exponential decaying model are given in . The long-term subsidence can be perfectly modeled. The magnitude response of these points ranges from 85.9 mm to 698.9 mm with decay coefficients of −0.6 to −0.2. All the selected points are under decelerating processes. The water consumption in Langfang and Tianjin is being gradually replaced with water transferred from the SNWTP. The reduced extraction or recovery of groundwater results in the deceleration of land subsidence. The time scales of delayed response to long-term hydraulic head change can be roughly estimated from the absolute value of the inverse of decay coefficients (Hu, Lu, and Wang Citation2018). The estimated time scales for D1–D6 are 3.3, 3.2, 5.3, 2.0, 3.8, and 1.6 years. The large RMSE in Figure S4 might be related to abnormal accelerations or linear displacement trends (Hu, Lu, and Wang Citation2018). The RMSE (>20 mm) at D3 and the surrounding area are related to the abrupt change of deformation trend due to the construction of the Wangqingtuo reservoir (WQTR) and will further be discussed in Section 5.1.
Figure 6. Long-term subsidence of D1–D6 marked in and fitted subsidence trends with the exponential decaying model.
4.4 Hydraulic heads and elastic skeletal storage coefficients
Time series of ground subsidence at points Q1–Q7 (marked in ) and their corresponding hydraulic head variations are given in . The hydraulic heads at Q2 and Q7 are decreasing, which is consistent with the subsidence in these two locations. Compaction of the aquifers occurred when the hydraulic heads rapidly dropped; then, ground subsidence occurred. Although the hydraulic heads at Q1, Q3, Q4, and Q6 indicate evident recovery trends during 2017–2020, subsidence continued with decelerating trends. This finding demonstrates that the current hydraulic heads at these locations are lower than the preconsolidation heads (Bai et al. Citation2022). The seasonal deformation and hydraulic heads variations are given in Figure S5. The seasonal variations are clearly presented in all the hydraulic head records with amplitudes of 0.2–1 m, whereas seasonal ground deformations are more insignificant (<10 mm, and Figure S5) than the long-term subsidence. The time lags between seasonal movements and hydraulic variations are calculated through correlation analysis (). Time lags range from 12–204 days with a correlation larger than 0.43. Different time lags are related to the variation of vertical hydraulic conductivities of the aquifer system (Hoffmann, Galloway, and Zebker Citation2003). The time lag at Q6 is only 12 days, thereby suggesting that the infiltration and drainage of aquifers are faster than that in other locations.
Figure 7. Time series subsidence versus hydraulic head changes at points Q1–Q7 in confined aquifer.
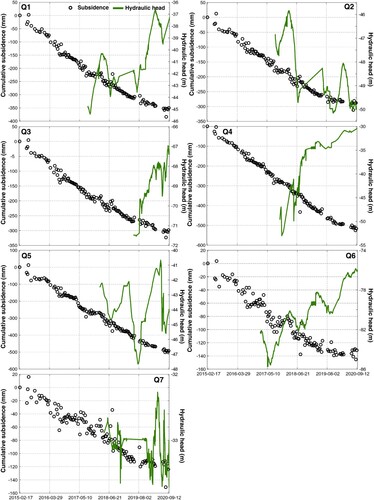
Table 1. Estimated time lags, maximum correlation, and elastic storage coefficient.
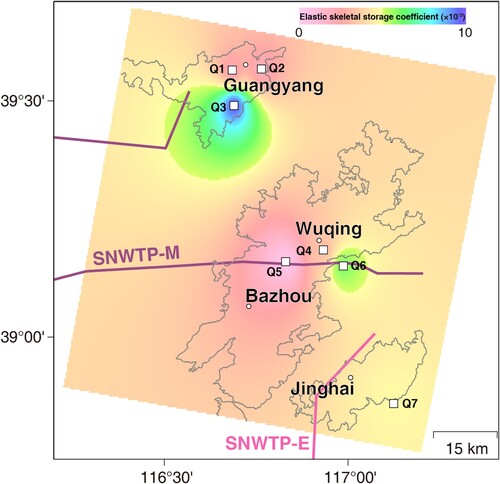
The elastic water storage coefficients at Q1–Q7 are given in . Q1–Q6 are located in the alluvial fan and flood plain, whereas Q7 is located in the coastal plain (). The elastic skeletal storage coefficients at Q1–Q6 ranges from 0.52 × 10⁻³ and 9.66 × 10⁻³, which are consistent with previous values derived from pumping tests, e.g. 1.0 × 10⁻³–8.0 × 10⁻³ (Zhang et al. Citation2009) and 2.0 × 10⁻⁶–4.0 × 10⁻³ (Yang, Meng, and Li Citation2015). The coefficient at Q7 is 4.85 × 10⁻³ in the coastal plain, which agrees with coefficients (2.0 × 10⁻⁴–5.0 × 10⁻³) in Binghai New District in Tianjin (Yang, Meng, and Li Citation2015).
We interpolated the coefficients in with inverse distance weighting () with a resolution of ∼380 m. The smallest elastic water storage (0.52 ± 0.036 × 10⁻³) appears in Bazhou. The elastic water storage coefficient varies remarkably in Guangyang. The aquifers in the south and northeast of the Guangyang subsiding center belong to two different subsystems of the Yongding–Juma confined aquifer system (Chen Citation1999). Different hydrogeological conditions, e.g. water yield property and aquifer thickness, in the subsystems might cause the variations of coefficients. The southern part occupies the largest coefficient, suggesting the largest amount of groundwater exchange to a given hydraulic head change in our study area.
Figure 8. Interpolated elastic skeletal storage coefficient.
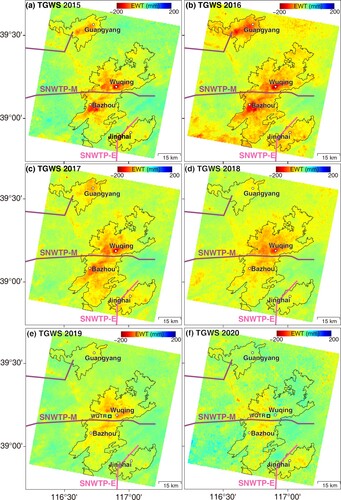
4.5 TGWS variations
Annual cumulative subsidence derived from Sentinel-1 is used to estimate the TGWS variations during 2015–2020 (). The equivalent water thickness (EWT) represents the GWS change in the height of a unit aquifer area. We unify the resolution of TGWS, RGWS, and IGWS to the same resolution of elastic skeletal storage coefficients. The aquifer area can be estimated by the summation of resolution cell areas. To compare the annual results, we convert the subsidence retrieved from February to December 2015 and January to September 2020 into annual accumulative subsidence by applying simple scaling (d/T×365). d and T are the retrieved subsidence and observation days of 2015 and 2020, respectively. The average TGWS depletion rates reached 46.6 mm/yr in 2016 and decreased to 15.8 mm/yr in 2020. Since the operation of the SNWTP middle and east route began, a large amount of water has been transferred to our study area, thereby considerably reducing the consumption of deep groundwater. Subregional groundwater depletion alleviation was observed during 2014–2018 (Zhang et al. Citation2021). The average TGWS depletions are 78.7, 71.4, and 60.9 mm in Guangyang, Wuqing–Bazhou, and Jinghai in 2016, respectively. Since then, the depletion of GWS has decelerated in major subsiding areas (). The EWT in Guangyang reduced to 20.0 mm in 2020 ((f)). The depletions in Wuqing–Bazhou where the SNWTP-M passes through have also been gradually alleviated since 2019 (). In particular, the TGWS depletions around WQTR were 43.7 and 4.8 mm in 2019 and 2020, respectively. The TGWS depletion rate in Jinghai was 35.4 mm/yr during 2017–2020 and is concentrated in the newly developed area east of Jinghai.
Figure 9. (a–f) Annual TGWS depletion variations during 2015–2020.
4.6 Spatial–temporal variations of RGWS and IGWS
With the use of the groundwater hydraulic head and elastic skeletal storage coefficients (), the spatial–temporal variations of RGWS and IGWS during 2018–2020 are given in (a–f). The RGWS depletion rates are 4.4, 2.9, and 3.5 mm/yr during 2018–2020, with remarkable spatial variations. The average RGWS depletion of 5.9 mm occurred in 2018 and gradually recovered to 8.6 and 3.2 mm in 2019 and 2020, respectively, in the Guangyang subsiding area. The recovery of RGWS is related to water resource replacement, which has been gradually conducted since 2019. Wuqing and Bazhou experience different variations of RGWS. The RGWS in Wuqing gradually recovered with rates of 12.9, 3.3, and 5.3 mm/yr during 2018 and 2020. However, the variations of RGWS in Bazhou are insignificant, ranging from 0.5 mm to 4.1 mm during 2018–2020. This condition might be caused by different water management strategies in Langfang and Tianjin. The sparse hydraulic head measurements in Bazhou also cause large uncertainties in the estimated RGWS. The Jinghai subsidence center occupies the smallest RGWS depletions with rates of 3.7, 0.5, and 2.9 mm/yr.
Figure 10. Spatial–temporal variations of annual (a–c) RGWS and (d–f) IGWS.
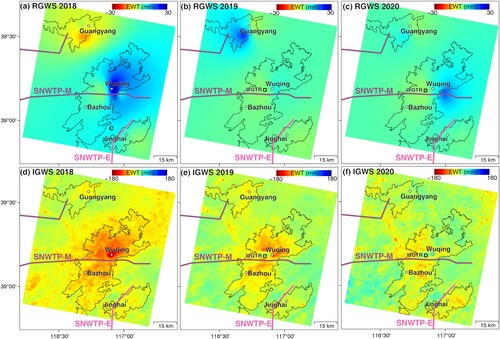
The average IGWS depletion rates are 41.5, 22.6, and 19.3 mm/yr during 2018–2020. Similar to the variations of TGWS, the IGWS depletion is alleviated, which is related to the SWNTP. Moreover, the IGWS depletion ((e,f)) around WQTR was 45.1 mm in 2019 and decreased to 6.4 mm in 2020, suggesting that the IGWS depletion is remarkably reduced.
5 Discussions
5.1 Variations of seasonal deformation
A typical area located at the junction of Langfang and Tianjin is selected to analyze the variations of seasonal deformations. The WQTR was completed at the end of 2018 as a supporting infrastructure for the SNWTP to guarantee stable urban and industrial water supply for Tianjin. The corresponding optical image acquired on 21 October 2021, is given in Figure S6. As observed in Section 4, the depletions of TGWS and IGWS have been considerably reducing since 2019. The impoundment of the WQTR provides sufficient water recharge for the aquifers in the surrounding area. In the meantime, the groundwater consumption at Wangqingtuo and Donggugang is being replaced with the transferred water. The hydraulic heads might rapidly recover close to the preconsolidation heads. Consequently, the compaction of aquifers and ground subsidence are also greatly slowed down (e.g. W1 in Figure 12). Abnormal seasonal deformation (∼13 mm, Figure 12(b)) appears ((f)) in Wangqingtuo town in Tianjin and Donggugang town in Langfang. Seasonal signals are overestimated in this area. Large deviations will occur when the displacement cannot be described by an exponential decaying model (e.g. the large RMSE at D3 in Figure S4) or a linear model, especially for the measurements after August 2019. Inaccurate seasonal signals will be constructed with deviated residuals. However, the abnormal seasonal deformation does not affect the reliability of skeletal storage coefficients because wells Q4 and Q5 are located outside this area. The time series seasonal deformation of W1 reveals that the amplitude was <5 mm before 2019. The period of seasonal deformation at Waingqingtuo town is not constant. The maximum subsidence reaches its maximum in February–October ((b)).
Figure. 11. Annual seasonal deformations of Wangqingtuo and Geyucheng towns.
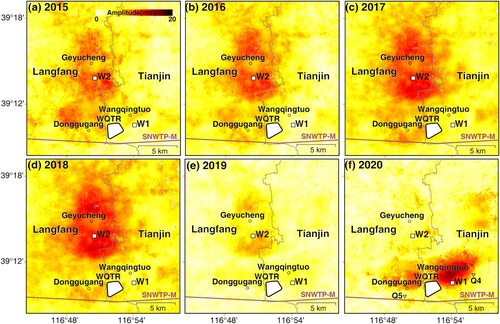
Figure 12. Cumulative subsidence and seasonal deformations of W1 and W2 marked in .
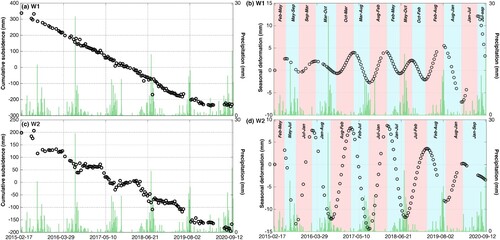
Different from Wangqingtuo town, Geyucheng town in Langfang is an agriculture area with apparent seasonal deformations during 2015–2020 (). The repeating period is about one year (such as W2 in (c,d)). The annual amplitude varies between 10–15 mm, which is related to irrigations and seasonal precipitations. Groundwater pumping for winter and spring irrigations causes the subsidence to increase gradually and reach the maximum during July–August. Then, elastic rebound occurs when the aquifers and aquitards are naturally recharged by rainfall. Since 2019, the water resource used for irrigation has been gradually changed from groundwater to water transferred from SNWTP (Zhang Citation2020). The amplitudes in the agricultural area gradually decrease to ∼5 mm ( and (d)).
5.2 Advantages and limitations
The dense measurement points of InSAR can provide a fine-scale ground subsidence map to detect the potential risks. The short revisit cycles of Sentinel-1 or the future NISAR missions enable us to capture the dynamics of the ground precisely. We can better model the long-term and seasonal deformations with the densely sampled measurements. The deformation map and hydraulic heads enable us to retrieve the decay coefficient, skeletal storage coefficient, and GWS variations, which are important for groundwater management and risk reduction.
We assume that the subsidence is all related to aquifer compaction/expansion in a confined aquifer system. However, urban-induced loading, soft soil compaction (Shi et al. Citation2021), and other causes also contribute to ground subsidence. Thus, overestimation of GWS variations might exist, especially in rapidly developing areas. In the meantime, the spatial patterns are related with geological faults (Hu et al. Citation2019) and aquifer structures, which will be investigated in our future study. We neglect horizontal deformation, which induces uncertainties of the estimated GWS. A more accurate subsidence map can be obtained by a combination of ascending and descending orbit InSAR measurements. The density and distribution of hydraulic measurements limit our estimations of RGWS and IGWS, such as that in the case of Bazhou in our study area. Denser observation well measurements or Gravity Recovery and Climate Experiment Follow-On data can be used to decrease the uncertainty.
6 Conclusions
In this study, we map the spatial–temporal subsidence over the Tianjin–Langfang region through time series Sentinel-1 InSAR analysis during 2015–2020. The measured ground subsidence is validated with GPS measurements. The isolated long-term and seasonal signals enable us to acquire the decaying coefficient and skeletal storage coefficient. The long-term subsidence can be well described by the exponential decaying model, which suggests that the subsidence in our study area is decelerating. Subregional groundwater recovery is confirmed by hydraulic head measurements and GWS variations. As we can infer from the TGWS, RGWS, and IGWS measurements in and , groundwater extraction seems more sustainable in our study area. This condition is related to the reduction of groundwater extraction after a series of groundwater exploration restriction and operation policies for the SNWTP was issued. The impoundment of the WQTR caused the rapid recovery of the hydraulic head and altered the displacement pattern in Donggugang and Wangqingtuo towns. Our results prove that InSAR can provide valuable information on the dynamics of ground subsidence and groundwater variations.
Disclosure statement
No potential conflict of interest was reported by the author(s).
Data availability statement
Copernicus Sentinel-1 data were provided by the European Space Agency through the Alaska Satellite Facility (https://asf.alaska.edu/). The hydraulic head measurements were provided by the China Geological Environment Monitoring Institute through GeoCloud (https://geocloud.cgs.gov.cn/). The precipitation records were downloaded from the National Centers for Environmental Information website (https://www.ncei.noaa.gov/maps-and-geospatial-products).
Additional information
Funding
References
- Bai, Lin, Liming Jiang, Yong Zhao, Zhenhong Li, Guoliang Cao, Chaoying Zhao, Rong Liu, and Hansheng Wang. 2022. “Quantifying the Influence of Long-Term Overexploitation on Deep Groundwater Resources Across Cangzhou in the North China Plain Using InSAR Measurements.” Journal of Hydrology 605: 127368. doi:10.1016/j.jhydrol.2021.127368.
- Bui, Luyen K., Phong V. V. Le, Phuong D. Dao, Nguyen Quoc Long, Hai V. Pham, Hong Ha Tran, and Lei Xie. 2021. “Recent Land Deformation Detected by Sentinel-1A InSAR Data (2016–2020) Over Hanoi, Vietnam, and the Relationship with Groundwater Level Change.” GIScience & Remote Sensing 58 (2): 161–179. doi:10.1080/15481603.2020.1868198.
- Chaussard, Estelle, Falk Amelung, Hasanudin Abidin, and Sang-Hoon Hong. 2013. “Sinking Cities in Indonesia: ALOS PALSAR Detects Rapid Subsidence due to Groundwater and Gas Extraction.” Remote Sensing of Environment 128 (0): 150–161. doi:10.1016/j.rse.2012.10.015.
- Chaussard, E., R. Bürgmann, M. Shirzaei, E. J. Fielding, and B. Baker. 2014. “Predictability of Hydraulic Head Changes and Characterization of Aquifer-System and Fault Properties from InSAR-Derived Ground Deformation.” Journal of Geophysical Research: Solid Earth 119 (8): 6572–6590. doi:10.1002/2014JB011266.
- Chen, Wanghe. 1999. Groundwater in Hebei. Beijing: Seismological Press.
- Chen, Wu, Xu Qinghai, Zhang Xiuqing, and Ma Yonghong. 1996. “Palaeochannels on the North China Plain: Types and Distributions.” Geomorphology 18 (1): 5–14. doi:10.1016/0169-555X(95)00147-W.
- Dong, Jie, Shangjing Lai, Nan Wang, Yian Wang, Lu Zhang, and Mingsheng Liao. 2021. “Multi-scale Deformation Monitoring with Sentinel-1 InSAR Analyses Along the Middle Route of the South-North Water Diversion Project in China.” International Journal of Applied Earth Observation and Geoinformation 100: 102324. doi:10.1016/j.jag.2021.102324.
- Du, Zheyuan, Linlin Ge, Alex Hay-Man Ng, Li Xiaojing, and Liyuan Li. 2018. “Mapping Land Subsidence Over the Eastern Beijing City Using Satellite Radar Interferometry.” International Journal of Digital Earth 11 (5): 504–519. doi:10.1080/17538947.2017.1336651.
- Ge, Daqing, Yan Wang, Xiaofang Guo, Jinghui Fan, and Shengwei Liu. 2008. “Surface Deformation Field Monitoring by Use of Small-Baseline Differential Interferograms Stack.” Geodesy and Geodynamics 28 (2): 61–66.
- Guo, Haipeng, Jinbin Bai, Youquan Zhang, Liya Wang, Jusong Shi, Wenpeng Li, Zuochen Zhang, Yunlong Wang, Juyan Zhu, and Haigang Wang. 2017. “The Evolution Characteristics and Mechanism of the Land Subsidence in Typical Areas of the North China Plain.” Geology in China 46 (6): 1115–1127.
- Guo, Lin, Huili Gong, Jiwei Li, Lin Zhu, Aimin Xue, Lin Liao, Ying Sun, et al. 2020. “Understanding Uneven Land Subsidence in Beijing, China, Using a Novel Combination of Geophysical Prospecting and InSAR.” Geophysical Research Letters 47 (16): e2020GL088676. doi:10.1029/2020GL088676.
- Guo, N., and W. Zhan. 2020. “Research on the Method of Three-Dimensional Surface Displacements of Tianjin Area Based on Combined Multi-Source Measurements.” Journal of Applied Geodesy 14 (1): 83–94.
- Guo, Haipeng, Zuochen Zhang, Guoming Cheng, Wenpeng Li, Tiefeng Li, and Jiu Jimmy Jiao. 2015. “Groundwater-derived Land Subsidence in the North China Plain.” Environmental Earth Sciences 74 (2): 1415–1427. doi:10.1007/s12665-015-4131-2.
- Ha, Da, Gang Zheng, Hugo A. Loáiciga, Wei Guo, Haizuo Zhou, and Jinchun Chai. 2020. “Long-term Groundwater Level Changes and Land Subsidence in Tianjin, China.” Acta Geotechnica 16 (4): 1303–1314. doi:10.1007/s11440-020-01097-2.
- He, Ping, Yangmao Wen, Caijun Xu, and Zhicai Li. 2012. “Volume Change of Groundwater in Langfang Region Derived from Multi-Temporal InSAR.” Geomatics and Information Science of Wuhan University 37 (10): 1181–1185.
- Herring, T., R. King, and S. Mcclusky. 2010. “GAMIT/GLOBK Reference Manuals, Release 10.4.” https://geo.gob.bo/portal/IMG/pdf/intro_gg_1_.pdf.
- Hoffmann, Jörn, Devin L. Galloway, and Howard A. Zebker. 2003. “Inverse Modeling of Interbed Storage Parameters Using Land Subsidence Observations, Antelope Valley, California.” Water Resources Research 39 (2), doi:10.1029/2001WR001252.
- Hou, Junliang, and Hui Li. 2020. “Study on the Response Relationship Between the Groundwater Funnel and the Land Subsidence in Langfang Urban Area.” Science Technology and Engineering 20 (14): 5530–5535.
- Hu, Leyin, Keren Dai, Chengqi Xing, Zhenhong Li, Roberto Tomás, Beth Clark, Xianlin Shi, et al. 2019. “Land Subsidence in Beijing and its Relationship with Geological Faults Revealed by Sentinel-1 InSAR Observations.” International Journal of Applied Earth Observation and Geoinformation 82: 101886. doi:10.1016/j.jag.2019.05.019.
- Hu, Xie, Zhong Lu, and Teng Wang. 2018. “Characterization of Hydrogeological Properties in Salt Lake Valley, Utah, Using InSAR.” Journal of Geophysical Research: Earth Surface 123 (6): 1257–1271. doi:10.1029/2017jf004497.
- Jiang, Mi. 2020. “Sentinel-1 TOPS co-Registration Over low-Coherence Areas and its Application to Velocity Estimation Using the all Pairs Shortest Path Algorithm.” Journal of Geodesy 94 (10): 95. doi:10.1007/s00190-020-01432-1.
- Jiang, L., L. Bai, Y. Zhao, G. Cao, H. Wang, and Q. Sun. 2018. “Combining InSAR and Hydraulic Head Measurements to Estimate Aquifer Parameters and Storage Variations of Confined Aquifer System in Cangzhou, North China Plain.” Water Resources Research 54 (10): 8234–8252. doi:10.1029/2017wr022126.
- Jiang, M., X. Ding, R. F. Hanssen, R. Malhotra, and L. Chang. 2015. “Fast Statistically Homogeneous Pixel Selection for Covariance Matrix Estimation for Multitemporal InSAR.” IEEE Transactions on Geoscience and Remote Sensing 53 (3): 1213–1224. doi:10.1109/TGRS.2014.2336237.
- Jiang, Houjun, Guangcai Feng, Teng Wang, and Roland Bürgmann. 2017. “Toward Full Exploitation of Coherent and Incoherent Information in Sentinel-1 TOPS Data for Retrieving Surface Displacement: Application to the 2016 Kumamoto (Japan) Earthquake.” Geophysical Research Letters 44: 1758– 1767.
- Jiang, M., and A. M. Guarnieri. 2020. “Distributed Scatterer Interferometry With the Refinement of Spatiotemporal Coherence.” IEEE Transactions on Geoscience and Remote Sensing 58 (6): 3977–3987. doi:10.1109/TGRS.2019.2960007.
- Jiang, Liming, Hui Lin, and Qing Zhao. 2010. “Spatial and Temporal Deformation Characteristics of Marine Alluvial Deposits due to Land Reclamation: Implications from InSAR Observation and Geotechnical Estimate.” Earth Surface Processes & Landforms 35 (3): 331–343.
- Jiang, M., X. Zhao, and X. Shi. 2022. “Kinematic Behavior Analysis of the Wadi Landslide from Time-Series Sentinel-1 Data.” IEEE Journal of Selected Topics in Applied Earth Observations and Remote Sensing 15: 127–135. doi:10.1109/JSTARS.2021.3134177.
- Khorrami, Mohammad, Saeed Abrishami, Yasser Maghsoudi, Babak Alizadeh, and Daniele Perissin. 2020. “Extreme Subsidence in a Populated City (Mashhad) Detected by PSInSAR Considering Groundwater Withdrawal and Geotechnical Properties.” Scientific Reports 10 (1): 11357. doi:10.1038/s41598-020-67989-1.
- Liu, Peng, Qingquan Li, Zhenhong Li, Trevor Hoey, Guoxiang Liu, Chisheng Wang, Zhongwen Hu, Zhiwei Zhou, and Andrew Singleton. 2016. “Anatomy of Subsidence in Tianjin from Time Series InSAR.” Remote Sensing 8 (3): 266.
- Long, Di, Wenting Yang, Bridget R. Scanlon, Jianshi Zhao, Dagen Liu, Peter Burek, Yun Pan, Liangzhi You, and Yoshihide Wada. 2020. “South-to-North Water Diversion Stabilizing Beijing’s Groundwater Levels.” Nature Communications 11 (1): 3665. doi:10.1038/s41467-020-17428-6.
- Luo, Q., D. Perissin, H. Lin, Y. Zhang, and W. Wang. 2014. “Subsidence Monitoring of Tianjin Suburbs by TerraSAR-X Persistent Scatterers Interferometry.” IEEE Journal of Selected Topics in Applied Earth Observations and Remote Sensing 7 (5): 1642–1650. doi:10.1109/JSTARS.2013.2271501.
- Luo, Qingli, Daniele Perissin, Yuanzhi Zhang, and Youliang Jia. 2014. “L- and X-Band Multi-Temporal InSAR Analysis of Tianjin Subsidence.” Remote Sensing 6 (9): 7933–7951.
- Miller, Megan Marie, and Manoochehr Shirzaei. 2015. “Spatiotemporal Characterization of Land Subsidence and Uplift in Phoenix Using InSAR Time Series and Wavelet Transforms.” Journal of Geophysical Research: Solid Earth 120 (8): 5822–5842. doi:10.1002/2015JB012017.
- Orhan, Osman. 2021. “Monitoring of Land Subsidence due to Excessive Groundwater Extraction Using Small Baseline Subset Technique in Konya, Turkey.” Environmental Monitoring and Assessment 193 (4): 174. doi:10.1007/s10661-021-08962-x.
- Perissin, D., and Teng Wang. 2011. “Time-Series InSAR Applications Over Urban Areas in China.” IEEE Journal of Selected Topics in Applied Earth Observations and Remote Sensing 4 (1): 92–100. doi:10.1109/JSTARS.2010.2046883.
- Qin, Huanhuan. 2019. “Application of Distributed Hydrological Model in Water Resources Management in the North China Plain.” Yangtze River 50 (11): 99–106.
- Qin, X., M. Liao, L. Zhang, and M. Yang. 2017. “Structural Health and Stability Assessment of High-Speed Railways via Thermal Dilation Mapping With Time-Series InSAR Analysis.” IEEE Journal of Selected Topics in Applied Earth Observations and Remote Sensing 10 (6): 2999–3010. doi:10.1109/JSTARS.2017.2719025.
- Shi, Min, Huili Gong, Mingliang Gao, Beibei Chen, Shunkang Zhang, and Chaofan Zhou. 2020. “Recent Ground Subsidence in the North China Plain, China, Revealed by Sentinel-1A Datasets.” Remote Sensing 12: 21. doi:10.3390/rs12213579.
- Shi, Xuguo, Fujun Niu, Tengteng Qu, Hongwei Zhang, Mi Jiang, Houjun Jiang, Zhengjia Zhang, and Xueying Wang. 2022. “Stability Analysis of Shiwei-Labudalin Highway in Inner Mongolia, Northeastern China Using Sentinel-1 InSAR.” Cold Regions Science and Technology 202: 103647. doi:10.1016/j.coldregions.2022.103647.
- Shi, Xuguo, Shaocheng Zhang, Mi Jiang, Yuanyuan Pei, Tengteng Qu, Jinhu Xu, and Chen Yang. 2021. “Spatial and Temporal Subsidence Characteristics in Wuhan (China), During 2015–2019, Inferred from Sentinel-1 Synthetic Aperture Radar (SAR) Interferometry.” Natural Hazards and Earth Systems Science 21 (8): 2285–2297. doi:10.5194/nhess-21-2285-2021.
- Tang, W., W. Zhan, B. Jin, M. Motagh, and Y. Xu. 2021. “Spatial Variability of Relative Sea-Level Rise in Tianjin, China: Insight from InSAR, GPS, and Tide-Gauge Observations.” IEEE Journal of Selected Topics in Applied Earth Observations and Remote Sensing 14: 2621–2633. doi:10.1109/JSTARS.2021.3054395.
- Tang, Wei, Xiangjun Zhao, Mahdi Motagh, Gang Bi, Jing Li, Mingjie Chen, Hua Chen, and Mingsheng Liao. 2022. “Land Subsidence and Rebound in the Taiyuan Basin, Northern China, in the Context of Inter-Basin Water Transfer and Groundwater Management.” Remote Sensing of Environment 269: 112792. doi:10.1016/j.rse.2021.112792.
- Torrence, C., and G. P. Compo. 1998. “A Practical Guide to Wavelet Analysis.” Bulletin of the American Meteorological Society 79: 1.
- Wang, Jiabing, Beng Li, Baiming Zhang, and Yabin Wang. 2010. “Allowable Groundwater Withdrawal and its Dertermination Basis in Tianjin Plain.” Earth Science Frontiers 17 (6): 221–226.
- Wegmüller, U., C. Werner, T. Strozzi, A. Wiesmann, O. Frey, and M. Santoro. 2015. “Sentinel-1 IWS mode support in the GAMMA software.” In Paper presented at the 2015 IEEE 5th Asia-Pacific Conference on Synthetic Aperture Radar (APSAR), 1–4 Sept. 2015.
- Xiao, Ruya, Mi Jiang, Zhenhong Li, and Xiufeng He. 2022. “New Insights Into the 2020 Sardoba dam Failure in Uzbekistan from Earth Observation.” International Journal of Applied Earth Observation and Geoinformation 107: 102705. doi:10.1016/j.jag.2022.102705.
- Xu, Yi, Huili Gong, Beibei Chen, Qingquan Zhang, and ZhenZhen Li. 2021. “Long-term and Seasonal Variation in Groundwater Storage in the North China Plain Based on GRACE.” International Journal of Applied Earth Observation and Geoinformation 104: 102560. doi:10.1016/j.jag.2021.102560.
- Yang, Huifeng, Wengeng Cao, Chuanshun Zhi, Zeyan Li, Xilin Bao, Yu Ren, Futian Liu, Cunliang Fan, Shufang Wang, and Yabin Wang. 2021. “Evolution of Groundwater Level in the North China Plain in the Past 40 Years and Suggestions on its Overexploitation Treatment.” Geology in China 48 (4): 1142–1155.
- Yang, Jianmin, Fanxian Meng, and Mengyang Li. 2015. “Classification and Parameter Analysis of Aquifers in Tianjin Area.” China Earthquake Engineering Journal 37 (supp. 1): 74–81.
- Yi, Lixin, Jianwei Hou, Zimu Li, and Genming Yao. 2005. “The Land Subsidence Survey of Langfang City, Hebei Province.” The Chinese Journal of Geological Hazard and Control 16 (4): 65–68.
- Yu, Chen, Zhenhong Li, and Nigel T. Penna. 2018. “Interferometric Synthetic Aperture Radar Atmospheric Correction Using a GPS-Based Iterative Tropospheric Decomposition Model.” Remote Sensing of Environment 204: 109–121. doi:10.1016/j.rse.2017.10.038.
- Zhang, Jianping. 2020. ““The Last Kilometer” of Water Diversion for Irrigation in Geyoucheng Town, Anci District.” Accessed 4/01. http://www.lf.gov.cn/Item/96429.aspx.
- Zhang, Xin, Beibei Chen, Huili Gong, Kunchao Lei, Chaofan Zhou, Zhaozhao Lu, and Danni Zhao. 2022. “Inversion of Groundwater Storage Variations Considering Lag Effect in Beijing Plain, from RadarSat-2 with SBAS-InSAR Technology.” Remote Sensing 14 (4): 991.
- Zhang, Chong, Qingyun Duan, Pat J.-F. Yeh, Yun Pan, Huili Gong, Hamid Moradkhani, Wei Gong, et al. 2021. “Sub-regional Groundwater Storage Recovery in North China Plain After the South-to-North Water Diversion Project.” Journal of Hydrology 597: 126156. doi:10.1016/j.jhydrol.2021.126156.
- Zhang, Zhaoji, Yuhong Fei, Zongyu Chen, Zongzhuang Zhao, Zhenhua Xie, Yabin Wang, Jinxiang Miao, et al. 2009. Investigation and Evaluation of Sustainable Utilization of Groundwater in North China Plain. Beijing: Geology Publishing House.
- Zhang, Youquan, Huili Gong, Zhaoqin Gu, Rong Wang, Xiaojuan Li, and Wenji Zhao. 2014. “Characterization of Land Subsidence Induced by Groundwater Withdrawals in the Plain of Beijing City, China.” Hydrogeology Journal 22 (2): 397–409. doi:10.1007/s10040-013-1069-x.
- Zhang, Shiyu, Tao Li, and Ye Xia. 2008. “Study on Urban Area Subsidence Monitoring Based on InSAR Technique.” Geomatics and Information Science of Wuhan University 33 (8): 850–853.
- Zhang, Ziwen, Yijun Liu, Feng Li, Qi Li, and Wujian Ye. 2019. “Land Subsidence Monitoring Based on InSAR and Inversion of Aquifer Parameters.” EURASIP Journal on Wireless Communications and Networking 2019 (1): 291. doi:10.1186/s13638-019-1602-2.
- Zhang, Tengxu, Wen-Bin Shen, Wenhao Wu, Bao Zhang, and Yuanjin Pan. 2019. “Recent Surface Deformation in the Tianjin Area Revealed by Sentinel-1A Data.” Remote Sensing 11 (2), doi:10.3390/rs11020130.
- Zhang, Yonghong, Hong’an Wu, Yonghui Kang, and Chuanguang Zhu. 2016. “Ground Subsidence in the Beijing-Tianjin-Hebei Region from 1992 to 2014 Revealed by Multiple SAR Stacks.” Remote Sensing 8 (8): 675.
- Zhao, Y., and M. Jiang. 2022. “Integration of Optical and SAR Imagery for Dual PolSAR Features Optimization and Land Cover Mapping.” IEEE Journal on Miniaturization for Air and Space Systems, 1. doi:10.1109/JMASS.2022.3195955.
- Zhao, Qian, Bao Zhang, Yibin Yao, Weiwei Wu, Guojie Meng, and Qiang Chen. 2019. “Geodetic and Hydrological Measurements Reveal the Recent Acceleration of Groundwater Depletion in North China Plain.” Journal of Hydrology 575: 1065–1072. doi:10.1016/j.jhydrol.2019.06.016.
- Zhou, Chaofan, Huili Gong, Beibei Chen, Mingliang Gao, Qun Cao, Jin Cao, Li Duan, Junjie Zuo, and Min Shi. 2020. “Land Subsidence Response to Different Land Use Types and Water Resource Utilization in Beijing-Tianjin-Hebei, China.” Remote Sensing 12 (3): 457.
- Zhou, Chaofan, Huili Gong, Beibei Chen, Xiaojuan Li, Jiwei Li, Xu Wang, Mingliang Gao, et al. 2019. “Quantifying the Contribution of Multiple Factors to Land Subsidence in the Beijing Plain, China with Machine Learning Technology.” Geomorphology 335: 48–61. doi:10.1016/j.geomorph.2019.03.017.
- Zhou, Chaofan, Huili Gong, Beibei Chen, Feng Zhu, Guangyao Duan, Mingliang Gao, and Wei Lu. 2016. “Land Subsidence Under Different Land use in the Eastern Beijing Plain, China 2005-2013 Revealed by InSAR Timeseries Analysis.” GIScience & Remote Sensing 53 (6): 671–688. doi:10.1080/15481603.2016.1227297.