
 ?Mathematical formulae have been encoded as MathML and are displayed in this HTML version using MathJax in order to improve their display. Uncheck the box to turn MathJax off. This feature requires Javascript. Click on a formula to zoom.
ABSTRACT
In this study, we sampled the original sediment columns from three points located in the eastern, central, and western areas of Chaohu Lake, and then investigated sediment resuspension under hydraulic disturbances in the laboratory. The results showed that when the hydraulic disturbance is weak and sediment surface shear stress is small (<0.02 N/m²), sediment surface layer moves alone. When the hydraulic disturbance is moderate and sediment surface shear stress is within a threshold (3.7 N/m²), only a small proportion of the surface sediments begins to move. However, when the hydraulic disturbance is further strengthened and sediment surface shear stress is larger than the threshold value, surface sediments move smoothly. By the experimental results, we found that the plankton layer is about 1 mm (1.56% of the maximum content of suspended matter (SSCmax)), which is the major contribution of individual sediment initiation. The new sediment layer is about 19–22 mm (20.9% of the SSCmax), which considerably affects sediment resuspension in shallow lakes. The consolidated layer is about 22 mm below the bed surface, which requires high shear stress and is hard to be transferred to the water column. The quantified experimental observation results are further verified with the theoretical results.
1. Introduction
Hydrodynamic disturbance of large shallow lakes can easily disturb sediment particles (Hu et al. Citation2006; Siev et al. Citation2018; Jalil et al. Citation2019). Many researchers concerned about the resulting suspension of sediment particles and endogenous release of sediment pollutants. Previous results showed that external factors such as wind wave disturbance and velocity change can be directly related to the suspension or internal release of sediment particles (Tammeorg et al. Citation2013; Tang et al. Citation2020). However, they have ignored the randomness and imprecision of sediment suspension. Therefore, these research results obtained through experimental or prototype observations are highly sensitive to external conditions and will change with boundary conditions as well. Some researchers also found that sediment suspension process under dynamic disturbance of the lake was actually a random start-up process under the drag force of the surface sediment (Li et al. Citation2017; Ding et al. Citation2018). The main reason is that there are great differences in vertical consolidation time, viscosity, and stability of lake sediments (Huang and Liu Citation2009; Ding et al. Citation2012; Qi et al. Citation2019). When the vertical structure of sediment on the sediment-water interface changes dramatically, the stability of the sediment on the bed surface changes accordingly, which affects the initiation of sediment on the mud-water interface.
For large shallow lakes, the material composition of the lake bed has obvious stratification in the vertical direction due to the uneven convection and diffusion in lakes (Wu and Hua Citation2014; Li et al. Citation2016). According to the differences in physical state and apparent form, the researchers divided the lake into four layers, namely overlying layer, planktonic layer, new sedimentary layer and consolidated layer (Qin et al. Citation2006; Lin et al. Citation2021). Among them, loose sediment particles or flocs are distributed in the plankton layer, which is in an unstable state. The new sedimentary layer is formed by recent sedimentation of sediments and begins to contact and bond with the consolidated layer. It is in a weakly stable state and sediments in this layer are easy to reenter into the water column due to the disturbance of water flow. The consolidated layer is the layer that has been consolidated for a long time. It has formed a relatively stable viscous structure and its stability is not easy to be damaged (Huang et al. Citation2015; Hoshikawa et al. Citation2019).
Obviously, under hydrodynamic disturbance, sediment activation in lake sediments occurs only between the planktonic layer and the new sediment layer, and the amount of sediment activation or the change degree of sediment surface layer will be different in the transient state (Zhu et al. Citation2006; Zhang, Hu, et al. Citation2021). In order to describe the instantaneous state of sediment initiation, three modes of sediment initiation, namely, individual motion, small motion, and general motion, were introduced to define the change degree of sediment surface during the resuspension of lake sediments (Zhang et al. Citation2006; Zhu et al. Citation2007; Vicente, Cruz-Pizarro, and Rueda Citation2010). The results showed that the sediment particles are in a stationary starting mode when there is no hydraulic disturbance or minimal disturbance in the sediment plankton layer. The sediment particles are in a small amount of dynamic activation mode before the floating layer is completely suspended under small hydraulic disturbance. When the new layer of sediment is suspended again under large hydraulic disturbance, the sediment particles are in the general dynamic starting mode.
In fact, the initial physical process of viscous sediments in lakes can improve the erosivity of viscous sediments by improving the logistic quality of viscous sediments (Zhang and Yu Citation2017), and yield stress is the main factor affecting the erosivity of viscous sediments (Zhang et al. Citation2017). However, the application scope of the critical condition equation of sediment movement and the erosion rate equation may be limited at present (Crowley, Bloomquist, and Robeck Citation2012). In the estuary, the predicted erosion rates of viscous sediments are consistently lower than the measured values. Wave load has a significant impact on the erodibility of silty sediments. In the laboratory simulation, with the increase of wave load magnitude and cycle times, the erodibility of silty sediments increases linearly (Dodaran, Park, and Mardashti Citation2014). Different states of sediment have different failure modes under wave loads, and the erosivity of the same sediment has different sensitivity to wave loads of different magnitudes. Waves can not only enhance sediment re-suspension through excess shear stress, but also liquify soil beds through excess pore pressure accumulation (Ghosehajra et al. Citation2015). In addition, wave loading will fluidize the seabed, and wave action will lead to the inhomogeneity of seabed sediment strength, thus affecting the characteristics of seabed erosion and material transport activities (Ranzi, Le, and Rulli Citation2012).
As stated previously, it is necessary to understand the hydrodynamic characteristics of cohesive sediments at different starting states to characterize their erodibility, which is influenced by many factors, such as water content, bulk density, sediment composition, and shear stress. Under the same hydraulic conditions, different starting states of viscous sediments have different erodibility and sediment transport rates. However, the relationship between hydrodynamic and erosive properties remains unrevealed. In this study, the relationship between yield stress and erodibility of cohesive sediments in hydraulic rotating flow of shallow lakes is clarified by studying the influence of three kinds of sediment initiation processes and bed surface change processes. Based on the experimental results, a hydrodynamic threshold for resuspension of sediments in the Chaohu Lake was proposed.
2. Methods and material
2.1. Sediment samples collection and detection
In this study, Chaohu Lake in eastern China is taken as the research object. It is one of the five famous fresh water lakes in China with typical characteristics of large shallow lakes. It is located in Hefei City, Anhui Province, China, and its longitude and latitude coordinates are 31.60°N, 117.87°E (Shang and Shang Citation2007; Luo and Lu Citation2020). Core sediment samples were collected from Chaohu Lake and numbered as W, C, and E samples. The geographic locations of the three sampling sites and the thickness of the sediment in the core samples are detailed in .
Table 1. Statistics of the core sediment samples collected at the Chaohu Lake.
The main reason for sediment resuspension is related to sediment particle size. Therefore, we tested the vertical particle size of the three samples as well, and the median particle size distribution of sediment particles are shown in .
Figure 1. Vertical distribution of particle size in the three samples.
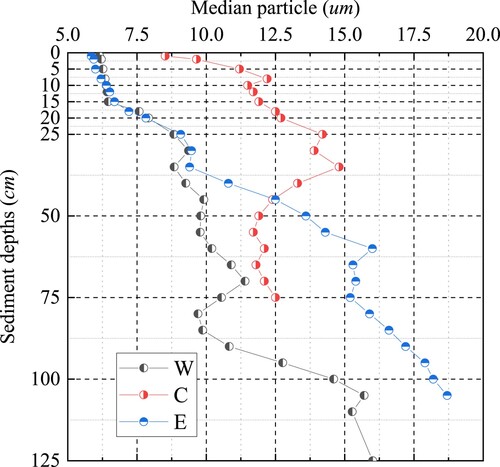
According to , median particle size increased with sediment depth, and the change of grain size in the lower sediment layer was more apparent than that in the upper sediment. This may be mainly related to the stable hydrodynamic conditions in the Chaohu Lake as the stable hydrodynamic conditions are favorable for the deposition of fine sediment. It can be seen that the particle size of the three sediment samples in the surface layer (less than 20 cm) is small. The upper mud column (depth within 20 cm) was selected as the research object in the experiment. The mean median particle size of W, C, and E (depth within 20 cm) were 6.76, 4.08, and 5.12 μm respectively.
2.2. Experimental design
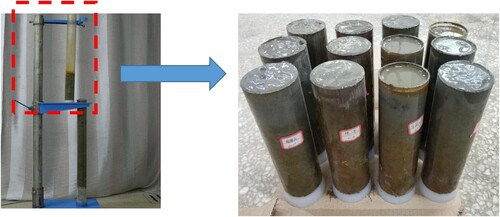
In the experiment, the surface layer of sediment core was selected as the experimental object. Before the experiment, the upper mud column needed for the experiment was intercepted by column core segmentation (depth within 20 cm), and the three groups of sediment samples in the experiment are shown in . Each group of samples has the same specifications (height 20 cm, inner diameter of cylinder 63 mm). After the segmentation of the experimental samples, the samples were sent to the sample storage box for placement, and the particle size, moisture content and dry density of the samples were tested within three days before the experiment.
Figure 2. Sediment surface sample (20 cm) in the experiment.
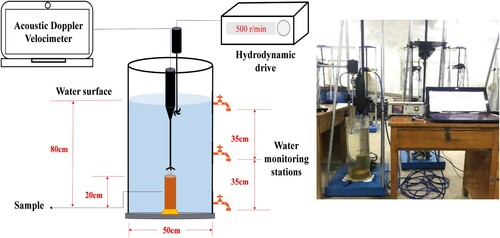
During the experiment, the sample was first put into the back-cover acrylic tube with an inner diameter of 50 cm and a height of 100 cm. The sample is fixed externally with metal blocks so that the sediment sample remains vertical and the upper surface is in contact with the water. The acrylic tube device is then placed into the disturbance system, adding pure water to 80 cm. Placing the acoustic doppler velocimetry (ADV, Vectrino SE-X8660HT) to the sediment sample so that the probe can measure transient flow rates (ux, uy, uz) near sediment surface with a sampling frequency of 100 Hz (Gao et al. Citation2017).
At the beginning of the experiment, the disturbance system was started. The device controls the rotation of the disturbed blades in the cylinder through the motor output fixed speed, and causes the water flow to rotate. The stable output cannot be guaranteed by the external disturbance of the motor, and the hydrodynamic conditions may be different under the same motor speed. Therefore, the sediment surface velocity can only be monitored as the hydrodynamic refinement index in the experiment. After the experiment, the disturbance system controlled the propeller speed and gradually increased the rotor speed to enhance the flow disturbance intensity. In each group, the propeller speed was 0, 500, 1000, 1200, 1400, 1600, 2000, 2200, 2400, 2600, 2800, and 3000 r/min respectively. When the flow state was stable, we began to monitor the three-dimensional velocity of sediment surface with ADV. Each time the speed was increased, the speed was kept stable for 15 min, and the instantaneous flow rate was measured for 5 min after the turbidity of water was stabilized (in the experiment, the sediment was resuspended, but the bed surface would be lowered by a small amount (less than 2 cm), which is small comparing with the ADV probe scale, so the reduction of shear stress is not considered). 10 ml water samples were taken from three different depths, and the water samples were mixed for the determination of suspended sediment concentration (SSC). The specific experimental device is shown in .
Figure 3. Schematic diagram of sediment resuspension test device.
2.3. The calculation method of shear stress
During the experiment, the velocity index of sediment surface can be measured by ADV current meter. However, in order to calculate the shear stress of sediment surface, it is necessary to carry out in-depth treatment through relevant calculation methods. According to formula (1), the pulsating velocity of water near the bottom mud surface can be obtained (Zou, Liu, and Lu Citation2006), where Equations (1) and (2) calculate the turbulent shear stress near the bed surface (Johnson and Cowen Citation2017):
(1)
(1)
(2)
(2) where
are the average velocity (m/s), the actual monitoring takes 5 min for data segment;
are the instantaneous velocity (m/s), and
are the pulsating velocity (m/s) in the x, y, and z directions.
Therefore, turbulent kinetic energy can be calculated by Equation (3):
(3)
(3) where
are the square average value of pulsating velocity (m2/s2), ρ is water density (kg/m3), TKE is turbulent kinetic energy (kg/(s2 m)).
Thus, the shear stress on the sediment surface can be calculated by Equation (4):
(4)
(4) where
is the shear stress (N/m2),
is a constant (0.19) (Pope, Widdows, and Brinsley Citation2006).
Based on the calculation theory, the experimental data are analyzed by FORTRAN programming language, and finally the shear stress monitoring results are obtained.
3. Results
3.1 Vertical distribution of sediment moisture content and density
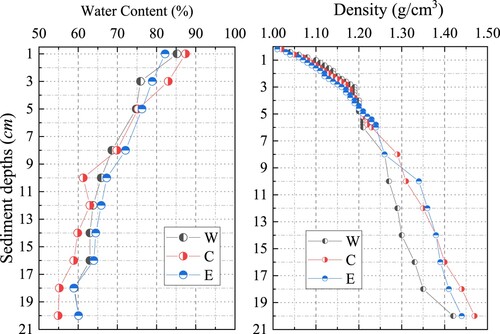
The vertical distribution results of sediment moisture content and density in each experimental sample are shown in . It can be seen from that with the increase of sediment depth, the sediment water content decreases, while the sediment density increases. The water content of the three sediment samples ranged from 55% to 90%, and the average water content of W, C, and E were 65.9%, 62.5% and 63.4%, respectively. The densities of the three sediment samples ranged from 1.00 to 1.50 g/cm3. The average densities of W, C, and E were 1.19, 1.20, and 1.18 g/cm3, respectively.
Figure 4. Vertical distribution of water content and density of the experimental samples.
3.2. Changes in suspended matter content
During the experiment, water samples corresponding to each rotational speed were collected under different rotational speeds. Based on the monitoring results of suspended matter content in the water column, the change of suspended matter content in the water body in different periods can be obtained. The specific monitoring results in the experiment are shown in .
Figure 5. Variation trend of sediment resuspension content with different water disturbance intensity.
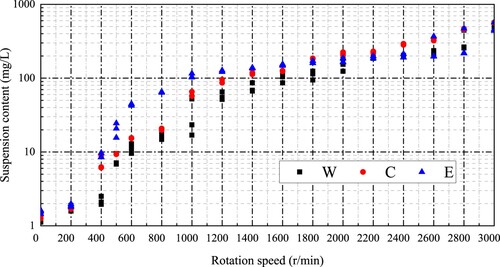
shows that sediment resuspension increases with the rotation speed of the overlying water. This shows an observable rule, that is, when the rotation speed of the overlying water body is within 0–600 r/min, the sediment resuspension content in the water body remains within a small range (except for a few cases, most data are less than 10 mg/L). When the rotation speed is within 600–2200 r/min, the sediment resuspension content increases rapidly, and its concentration increases from 10 to 200 mg/L. When the rotation speed exceeded 2200 r/min, the increase rate of sediment resuspension content decreased, and its concentration remained between 200 and 400 mg/L.
3.3. Changes in shear stress
The flow velocity measured by ADV may have outliers or burrs, so the quality of flow velocity data needs to be controlled and checked before analysis and processing. In this study, the SNR threshold method was used to find outliers in high frequency data measured by ADV (Christensen et al. Citation2018). Extrapolation ( or
), center difference (
) or smoothing were used to replace the outliers according to the situation. After the ADV flow rate value is calculated and processed, the monitoring shear stress required by the experiment can be calculated.
In the experimental setup shown in , the instantaneous flow rates (ux, uy, uz) can be obtained by monitoring the ADV current meter at different rotational speeds. According to the theoretical calculation formula, the shear stress of sediment bed surface under different rotational speeds was obtained in the experiment. The specific results are shown in .
Figure 6. Variation trend of sediment shear stress with different water disturbance intensity.
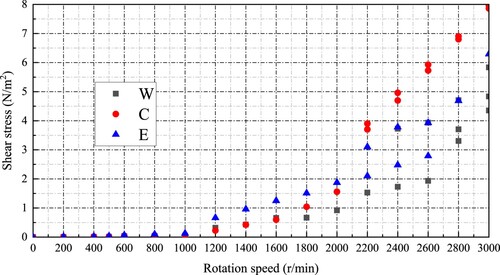
As can be seen from , the surface shear stress of sediment increases with the rotation speed of overlying water. When the rotation speed of overlying water is within 0–1000 r/min, the shear stress of sediment surface is within a very small range (0.5 N/m2). When the rotation speed is within 1000–2200 r/min, the shear stress on the sediment surface increases linearly from 0.5 to 2 N/m2. When the rotation speed exceeds 2200 r/min, the shear stress on the sediment surface increases from 2 to 8 N/m2.
3.4. Relationship between shear stress and suspension amount
In the process of lake water exchange, the hydrodynamic conditions can be changed by diversion and reasonable water distribution, so as to obtain a good flow field and adjust the sediment resuspension process. The research results showed that the flow velocity can change the surface shear stress of sediment, thus changing the physical state of sediment initiation, and the final result is to change the content of suspended matter (Zhang et al. Citation2018).
To sum up, the corresponding values of shear stress on sediment bed surface and sediment concentration after sediment suspension can be obtained through experiments. Therefore, the relationship between the sediment activation concentration (SSC in ) and the shear stress
of the sediment bed surface was obtained in this experimental device, and the specific results are shown in .
Figure 7. Variation trend of sediment shear stress with different water disturbance intensity.
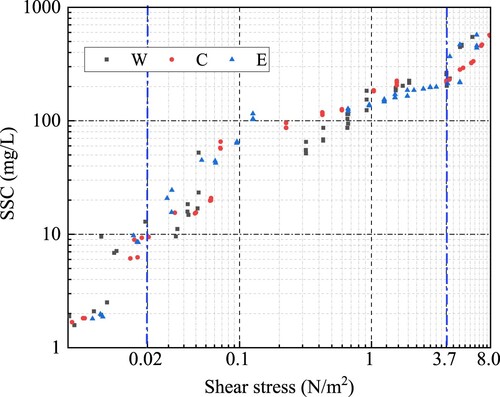
It can be seen from that the concentration of suspended substances increases with the increase of shear stress in general. When < 0.02 N/m2 and the concentration of suspended substances is within 1–10 mg/L, the shear force results in inconspicuous initiation of sediments. When 0.02 N/m2<
<3.7 N/m2, the concentration of suspended substances increases sharply with the increase of shear stress (11–200 mg/L). When
>3.7 N/m2, the concentration of suspended substances remains at a relatively stable and high level (200–400 mg/L).
The results show that, on the one hand, the range of variation of the corresponding shear stress from 0 to the SSCmax is large, even differing by two orders of magnitude. On the other hand, the increase of SSC value shows different regularities in different shear stress ranges, which is closely related to the fine-grained sediment nature of Chaohu Lake bottom sediment and the sharp change of the bed surface nature of mud-water interface.
4. Discussion
4.1. Stratification and entrainment analysis of mud-water interface
4.1.1. Start-up characteristics of cohesive sediment bed surface
Under natural conditions, the sediment initiation process in shallow lakes may differ greatly in a small vertical range, mainly because of the impact of different factors, such as the consolidation time, viscosity and stability of soil mass. Specifically, there are thin layers of floating mud on the surface of the sediment, and with very little interference from flow, the sediment in the floating mud can also be in ‘individual motion mode.’ In a state of ‘small movement,’ the sediment in the upper part of the new layer is activated first. As the shear stress increases, sediment in more areas above the new layer is pushed up, and sediment in the upper layer of the new layer enters a state of ‘general movement.’
Therefore, in this study, the initiation of cohesive sediment in Chaohu Lake can be divided into three grades according to the disturbance intensity: ‘individual motion,’ ‘small motion,’ and ‘general motion.’ The average value of suspended matter concentration in water under three different starting levels of sediment is taken as a representative index. According to the experimental monitoring process, the statistical index results are shown in .
Table 2. Results of start-up test for cohesive sediment bed surface.
It is assumed that when the sediment is in the state of ‘general motion,’ the starting content of suspended matter represents the maximum content (SSCmax). In the process of sediment movement from weak to strong, the ratio of suspended matter content in ‘individual motion’ and ‘small motion’ state to the content (SSCmax) in ‘general motion’ state can be regarded as the probability of sediment initiation. According to the concentration of suspended solids under the other two starting strengths, the starting probabilities of sediment under different starting strengths can be calculated. The specific results obtained are shown in .
Table 3. Starting probability and shear stress of cohesive sediment bed surface.
It can be seen from that, in the process of sediment initiation, when the sediment initiation is at the intensity level of ‘individual movement,’ the sediment initiation proportion is about 1.56%. When the sediment initiation is in the intensity grade of ‘small movement,’ the sediment initiation proportion is about 20.90%. According to the results of previous study (Dou Citation2000), the probability of sediment ‘individual movement’ is less than 2.1%, and the probability of sediment starting under the intensity of ‘small movement’ is less than 15.9%. Thus, it can be seen that the experimental results of this study are close to the previous research results, and the results are reliable.
4.1.2. Quantitative analysis of sediment – water interface stratification and starting
In order to quantitatively describe the three levels of sediment initiation intensity (TSS), the average thickness from sediment initiation to bed surface, was calculated in this study. Only when all the sediment particles of the whole thickness start moving, bed surface sediment is transferring into the general dynamic state. The average starting thickness (TSS) is calculated as follows:
(5)
(5)
(6)
(6) where
is the average starting thickness of surface sediment (mm);
is the initial momentum (mg);
is the average dry density of suspended surface sediment (t/m3). According to the surface sediment moisture content curve in ,
can be calculated;
is the upper surface area of the columnar sample of sediment (m2), A = 3.632*10−3m2. In Equation (6), SSC is suspended matter content (mg/L), which is the average value of suspended solids in water samples in the upper, middle and lower layers of the experimental device; V is water volume, V = 15.7 L.
(7)
(7) where
and
are the densities of sediment particles and water, which are 2.6 and 1.0 t/m3;
is the sediment moisture content. By combining Equation (7) with Equations (6) and (5), we get:
(8)
(8)
Equation (8) is an implicit function, can be obtained by trial-and-error, and the error is within 1*10−2 mm.
is the moisture content of sediment at 0.5
height. The specific calculation results are shown in .
Figure 8. Variation trend of the thickness of sediment suspension with different shear stress.
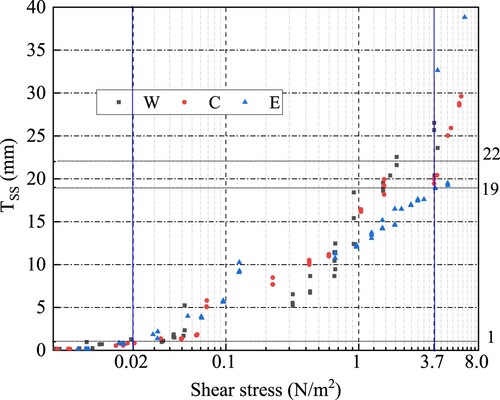
It can be seen from that the critical depths of the new and consolidated layers of W, C, and E are 22, 20, and 19 mm. According to the study of Wang et al. (Citation2013), the decomposition and release of nutrients in sediments are usually concentrated in the thin layer of 0–2 cm at the interface. From the perspective of hydraulic and biological disturbance, generally speaking, the surface lake bed (about 1–10 cm) of shallow lakes is impacted by wind (Qin et al. Citation2003). It can be seen that the results obtained in this experiment are close to those of previous studies, which also shows that the experimental results are reasonable.
4.2. Verification of shear stress during start-up of viscous sediment
For viscous sediment, the cohesive force between sediment particles is an important force affecting the magnitude of the threshold critical shear stress. The cohesive force increases with the decrease of particle size and the increase of consolidation degree. In fact, the best way to estimate the erosivity of cohesive sediments affected by rheological properties in this study is to calculate the scour rate (Zhang, Nielsen, et al. Citation2021). However, it is difficult to accurately monitor the dynamic process of scour depth during sediment initiation, so the sediment initiation stress was chosen for analysis.
Based on the classical equilibrium theory of mechanics, Dou, Dou, and Li (Citation2001) considered the influence of sediment particle bonding on sediment initiation, and the proposed particle size formula has a wide range of adaptability, detailed parameters, and clear physical significance (Reid et al. Citation2016). Therefore, based on the critical shear stress equation proposed by Dou, Dou, and Li (Citation2001) and combined with sediment starting characteristics of Chaohu Lake, this paper studies the parameter variation of viscous sediment starting process and its influence on the shear stress. The equation of sediment starting shear stress is as follows (Dou, Dou, and Li Citation2001):
(9)
(9) where the coefficient k is related to the roughness Δ and shear stress measurement point and the vertical distance y of the bed surface; d is the median particle size, which has been measured before the experiment;
represents the relationship between resistance coefficient and particle shape,
= 10 mm, when d ≤ 0.5 mm,
= 0.5 mm; g is the acceleration of gravity, 9.8 N/s2;
and
are dry bulk density of bed sediment and stable dry bulk density of sediment particles respectively;
is a synthetic bond force parameter; h is the water depth, and the water depth studied in this paper is 50 cm;
is the water thickness parameter of the film,
= 2.31*10−5 cm.
Before calculating the starting shear stress in this study, it is necessary to check the value of clearing coefficient k and comprehensive bond force parameter . The value of coefficient k, combined with the characteristics of Chaohu Lake bottom mud and bed surface starting process, was analyzed in detail in the process of experimental testing of the relationship between shear stress and starting momentum, which could be calculated by the following equation (Dou, Dou, and Li Citation2001):
(10)
(10) where u* is the friction flow rate;
is the average flow rate.
is the pulsating velocity. The calculation method can refer to the following equation (Dou, Dou, and Li Citation2001):
(11)
(11)
In Equation (11), when d ≤ 0.5 mm, Δ is 1.0 mm; in this study, the measuring point of shear stress near the bed surface is 1.5 mm away from the bed surface, then y = 1.5 + TSS (mm).
The value of is related to the physical and chemical properties of the particles. For clay, it is also related to the sedimentary environment and the content of organic matter.
is 1.75 cm3/s2 for general sediment and 17.5 cm3/s2 for cohesive soil. For the sediment of new sedimentary layer and consolidated layer, the viscosity of sediment will increase with the consolidation time (drainage degree) (Yang et al. Citation2016). In this study, the value of viscous sediment
is positively proportional to dry bulk density, as shown in Equation (12):
(12)
(12) Substituting the parameters calculated by Equations (10) and (12) into Equation (9), we can obtain the relationship between shear stress and suspension thickness of the bed surface of the new sedimentary layer at three representative points in Chaohu Lake, as shown in .
Figure 9. Comparison between measured and theoretical values of TSS and τ0.
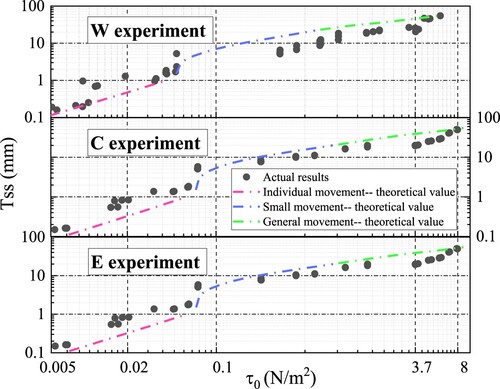
It can be seen from that the theoretical calculation results are in good agreement with the measured values and have the following characteristics: (1) the measured shear stress is about 0.02 N/m2, but the shear stress required by theoretical calculation is greater than this threshold when the sediment is transformed from ‘individual movement’ to ‘small movement’ (Tss = 1mm). The main reason is that the floating layer of the lake is relatively loose, and the water content is high; (2) The measured shear stress is about 3.7 N/m2, but the shear stress required for theoretical calculation is less than this threshold when the sediment is transformed from ‘small movement’ to ‘general movement’ (Tss = 20 mm). The main reason is that the bottom mud in this part is in the transition from the new sedimentary layer to the consolidated layer, and the consolidated layer is generally difficult to be suspended due to its high degree of compaction and low water content.
Overall, it can be seen that the experimental results are close to the theoretical calculation, thus it is feasible to use the experimental method to analyze the sediment initiation in the lake. Theoretically, viscous sediment can be divided into three levels, namely ‘individual movement,’ ‘small movement’ and ‘general movement,’ which can be used as the reference for the movement of lake sediment.
4.3. Mechanism of sediment resuspension affecting water quality
The results of this experiment are based on three movement states of sediment: ‘individual movement,’ ‘small movement’ and ‘general movement,’ combined with molecular diffusion, convective diffusion and particle adsorption–desorption. It can be used to analyze the relationship between the movement state of sediment and the release state of nutrients in sediment (Havens et al. Citation2007; Zhu et al. Citation2008; Welch et al. Citation2017).
In the process of disturbance, when the turbulence of water flow is strong enough to affect the lake bed, a small amount of sediment particles from the plankton layer will be released into the water column. The suspended matter content in the water body will rise slightly, and a small number of particles can often be observed to move. The bed surface changes, and the bed surface is not damaged as a whole. When the lakebed sediment is in ‘individual movement’ mode, the sediment-water material exchange mainly depends on convection and diffusion.
When the flow disturbance intensity exceeds a certain threshold value, the new sediment layer in weakly stable state on the surface of lake bed becomes unstable. The smooth bed surface is damaged greatly, the water flow soon becomes completely turbid, and the suspended matter content in the water column rises rapidly and sharply. The sediment is in ‘small movement’ mode, and the material exchange between sediment and water mainly depends on convective diffusion and adsorption and release.
When flow disturbance or manual intervention is extremely strong, not only the new deposits become unstable, but also the stable state of the consolidated deposits with longer deposition time is disrupted. More sediment will enter the water column and the sediment content in the water will remain high. At this time, the lakebed sediment is in the state of ‘general movement,’ and the adsorption and release of sediment particles and convection and diffusion play a more important role in the sediment-water material exchange. Based on the above analysis, the results are summarized in .
Table 4. Sediment movement and material exchange in the lake.
5. Conclusions
At the mud-water interface, the structure and properties of cohesive sediment lakebed change dramatically vertically, which are affected by sediment particle size, water content, consolidation time and other factors. The dry bulk density, cohesive force and other properties of sediment change greatly, which leads to the stratification of different starting properties on the interface between mud and water, directly affecting the starting process and characteristics of viscous sediment. The experimental results showed that the critical shear stress is about 0.02 N/m2 when the bed surface shear stress reaches a certain threshold. With the increase of sediment depth, the dry bulk density and consolidation degree of sediment also increase, and the corresponding critical shear stress increases rapidly. The maximum critical shear stress for new deposits (19–22 mm) is approximately 3.7 N/m2. The experimental results are verified by theoretical calculation. Therefore, the results of this study can be used to guide the resuspension estimation of sediments in the Chaohu Lake, especially for the nutrient release from sediments under hydrodynamic disturbance.
Availability of data and materials
All data generated or analyzed during this study are included in this manuscript. The data that support the findings of this study are available on request from the corresponding author. The data are not publicly available due to privacy or ethical restrictions.
Disclosure statement
No potential conflict of interest was reported by the author(s).
Additional information
Funding
References
- Christensen, D., J. Brinkkemper, G. Ruessink, and T. Aagaard. 2018. “Field Observations of Turbulence in the Intertidal and Shallow Subtidal Zones.” Continental Shelf Research 170: 21–32.
- Crowley, R., D. Bloomquist, and C. Robeck. 2012. “Description of Erosion Rate Testing Devices and Correlations Between Rock Erosion Rate and Cohesion.” ICSE6, Paris, 48–56.
- Ding, Y., B. Qin, G. Zhu, T. Wu, Y. Wang, and L. Luo. 2012. “Effects of Typhoon Morakot on a Large Shallow Lake Ecosystem, Lake Taihu, China.” Ecohydrology 5 (6): 798–807.
- Ding, W., T. Wu, B. Qin, Y. Lin, and H. Wang. 2018. “Features and Impacts of Currents and Waves on Sediment Resuspension in a Large Shallow Lake in China.” Environmental Science and Pollution Research 25 (36): 36341–36354.
- Dodaran, S., A. Park, and A. Mardashti. 2014. “Experimental Investigation of the Effect of Vibrator Machine for Desilting Sediment in the Pressure Flushing.” Journal of Scientific Research 6 (3): 475–485.
- Dou, G. 2000. “Incipient Motion of Sediment Under Currents.” China Ocean Engineering 4: 391–406.
- Dou, G., X. Dou, and S. Li. 2001. “Incipient Motion of Sediment by Waves.” Science in China (Series E: Technological Sciences) 3: 309–318.
- Gao, X., Y. Li, C. Tang, K. Acharya, W. Du, J. Wang, L. Luo, et al. 2017. “Using ADV for Suspended Sediment Concentration and Settling Velocity Measurements in Large Shallow Lakes.” Environmental Science and Pollution Research 24 (3): 1–10.
- Ghosehajra, M., A. Mccorquodale, G. Mattson, D. Jerolleman, and J. Filostrat. 2015. “Effects of Salinity and Particle Concentration on Sediment Hydrodynamics and Critical Bed-Shear-Stress for Erosion of Fine Grained Sediments Used in Wetland Restoration Projects.” Proceedings of the International Association of Hydrological Sciences 367: 435–441.
- Havens, K. E., K. R. Jin, N. Iricanin, and R. T. James. 2007. “Phosphorus Dynamics at Multiple Time Scales in the Pelagic Zone of a Large Shallow Lake in Florida, USA.” Hydrobiologia 581 (1): 25–42.
- Hoshikawa, K., Y. Fujihara, S. Siev, S. Arai, and C. Yoshimura. 2019. “Characterization of Total Suspended Solid Dynamics in a Large Shallow Lake Using Long-Term Daily Satellite Images.” Hydrological Processes 33 (21): 2745–2758.
- Hu, C., W. Hu, F. Zhang, Z. Hu, X. Li, and Y. Chen. 2006. “Sediment Resuspension in the Lake Taihu, China.” Chinese Science Bulletin 51 (6): 731–737.
- Huang, P., and Z. Liu. 2009. “The Effect of Wave-Reduction Engineering on Sediment Resuspension in a Large, Shallow, Eutrophic Lake (Lake Taihu).” Ecological Engineering 35 (11): 1619–1623.
- Huang, J., Q. Xu, B. Xi, X. Wang, W. Li, G. Gao, L. Luo, et al. 2015. “Impacts of Hydrodynamic Disturbance on Sediment Resuspension, Phosphorus and Phosphatase Release, and Cyanobacterial Growth in Lake Tai.” Environmental Earth Sciences 88: 3945–3954.
- Jalil, A., Y. Li, K. Zhang, X. Gao, W. Wang, H. Khan, B. Pan, S. Ali, and K. Acharya. 2019. “Wind-Induced Hydrodynamic Changes Impact on Sediment Resuspension for Large, Shallow Lake Taihu, China.” International Journal of Sediment Research 34 (03): 18–28.
- Johnson, E., and E. Cowen. 2017. “Estimating Bed Shear Stress from Remotely Measured Surface Turbulent Dissipation Fields in Open Channel Flows.” Water Resources Research 53 (3): 1982–1996.
- Li, Y., A. Jalil, W. Du, X. Gao, J. Wang, L. Luo, H. Li, S. Dai, S. Hashim, and Z. Yu. 2017. “Wind Induced Reverse Flow and Vertical Profile Characteristics in a Semi-Enclosed Bay of Large Shallow Lake Taihu, China.” Ecological Engineering 102: 224–233.
- Li, Y., C. Tang, J. Wang, K. Acharya, and B. Pan. 2016. “Effect of Wave-Current Interactions on Sediment Resuspension in Large Shallow Lake Taihu, China.” Environmental Science and Pollution Research 24 (4): 4029–4039.
- Lin, S., L. Boegman, R. Alipour, D. Bouffard, and Y. Zhao. 2021. “Three-Dimensional Modeling of Sediment Resuspension in a Large Shallow Lake.” Journal of Great Lakes Research 47 (4): 970–984.
- Luo, W., and J. Lu. 2020. “Inhibition of in Situ Coating of Sediment Ceramsite on Sediment Nutrient Release of Eutrophic Lakes.” Environmental Geochemistry and Health 4: 13–27.
- Pope, N., J. Widdows, and M. Brinsley. 2006. “Estimation of Bed Shear Stress Using the Turbulent Kinetic Energy Approach—a Comparison of Annular Flume and Field Data.” Continental Shelf Research 26 (8): 959–970.
- Qi, C., X. G. Xu, K. Shi, L. Zhang, Y. Zhou, H. Lin, et al. 2019. “In Situ Resuspension Rate Monitoring Method in the Littoral Zone with Multi-Ecotypes of a Shallow Wind-Disturbed Lake.” Environmental Science and Pollution Research 26 (8): 7476–7485.
- Qin, B., W. Hu, G. Gao, L. Luo, and L. Zhang. 2003. “Dynamic Mechanism of Sediment Suspension and Conceptual Model of Endogenous Release in Taihu Lake.” Chinese Science Bulletin 17: 1822–1831.
- Qin, B., G. Zhu, L. Luo, G. Gao, and B. Gu. 2006. “Estimation of Internal Nutrient Release in Large Shallow Lake Taihu, China.” Science in China Series D-Earth Sciences 49 (z1): 38–50.
- Ranzi, R., T. Le, and M. Rulli. 2012. “A RUSLE Approach to Model Suspended Sediment Load in the lo River (Vietnam): Effects of Reservoirs and Land use Changes.” Journal of Hydrology 422–423: 17–29.
- Reid, T., D. Vanmensel, I. Droppo, and C. Weisener. 2016. “The Symbiotic Relationship of Sediment and Biofilm Dynamics at the Sediment Water Interface of Oil Sands Industrial Tailings Ponds.” Water Research 100 (1): 337–347.
- Shang, G., and J. Shang. 2007. “Spatial and Temporal Variations of Eutrophication in Western Chaohu Lake.” Environmental Monitoring and Assessment 130 (1-3): 99–109.
- Siev, S., H. Yang, T. Sok, S. Uk, L. Song, D. Kodikara, C. Oeurng, S. Hul, and C. Yoshimura. 2018. “Sediment Dynamics in a Large Shallow Lake Characterized by Seasonal Flood Pulse in Southeast Asia.” Science of the Total Environment 631-632: 597–607.
- Tammeorg, O., J. Niemistoe, T. Moels, R. Laugaste, K. Panksep, and K. Kangur. 2013. “Wind-Induced Sediment Resuspension as a Potential Factor Sustaining Eutrophication in Large and Shallow Lake Peipsi.” Aquatic Sciences 75 (4): 559–570.
- Tang, C., Y. Li, C. He, and K. Acharya. 2020. “Dynamic Behavior of Sediment Resuspension and Nutrients Release in the Shallow and Wind-Exposed Meiliang Bay of Lake Taihu.” Science of the Total Environment 708: 1–10.
- Vicente, I., L. Cruz-Pizarro, and F. J. Rueda. 2010. “Sediment Resuspension in Two Adjacent Shallow Coastal Lakes: Controlling Factors and Consequences on Phosphate Dynamics.” Aquatic Sciences 72 (1): 21–31.
- Wang, Y., G. Zhu, D. Hong, and B. Qin. 2013. “Environmental Characteristics of Sediment-Water Interface of Phytoplankton and Macrophyte Dominated Zones in Lake Taihu.” Journal of Lake Sciences 25 (2): 199–208.
- Welch, E., H. Gibbons, S. Brattebo, and H. Corson-Rikert. 2017. “Distribution of Aluminum and Phosphorus Fractions Following Alum Treatments in a Large Shallow Lake.” Lake and Reservoir Management 33 (2): 198–204.
- Wu, D., and Z. Hua. 2014. “The Effect of Vegetation on Sediment Resuspension and Phosphorus Release Under Hydrodynamic Disturbance in Shallow Lakes.” Ecological Engineering 69: 55–62.
- Yang, Y., Y. Wang, S. Gao, X. Wang, B. Shi, L. Zhou, D. Wang, C. Dai, and G. C. Li. 2016. “Sediment Resuspension in Tidally Dominated Coastal Environments: New Insights Into the Threshold for Initial Movement.” Ocean Dynamics 66 (3): 401–417.
- Zhang, Y., W. Hu, Y. Hu, and Z. Peng. 2021. “Resuspension Traps for the Removal of Nutrients and Algae from the Sediments of Shallow Lakes.” Journal of Soils and Sediments 21 (10): 3451–3465.
- Zhang, S., Y. Jia, Y. Zhang, and H. Shan. 2018. “Influence of Seepage Flows on the Erodibility of Fluidized Silty Sediments: Parameterization and Mechanisms.” Journal of Geophysical Research: Oceans 123 (5): 3307–3321.
- Zhang, S., P. Nielsen, P. Perrochet, and Y. Jia. 2021. “Multiscale Superposition and Decomposition of Field-Measured Suspended Sediment Concentrations: Implications for Extending 1DV Models to Coastal Oceans With Advected Fine Sediments.” Journal of Geophysical Research: Oceans 126 (3): e2020JC016474.
- Zhang, Y., B. Qin, G. Zhu, G. Gao, L. Luo, and W. Chen. 2006. “Effect of Sediment Resuspension on Underwater Light Field in Shallow Lakes in the Middle and Lower Reaches of the Yangtze River: A Case Study in Longgan Lake and Taihu Lake.” Science in China Series D-Earth Sciences 49: 114–125.
- Zhang, M., and G. Yu. 2017. “Critical Conditions of Incipient Motion of Cohesive Sediments.” Water Resources Research 53 (9): 7798–7815.
- Zhang, M., G. Yu, A. Rovere, and R. Ranzi. 2017. “Erodibility of Fluidized Cohesive Sediments in Unidirectional Open Flows.” Ocean Engineering 130: 523–530.
- Zhu, G., W. Fang, G. Gao, and Y. Zhang. 2008. “Variability of Phosphorus Concentration in Large, Shallow and Eutrophic Lake Taihu, China.” Water Environment Research 80(9): 832–839.
- Zhu, G., B. Qin, G. Gao, L. Zhang, L. Luo, and Y. Zhang. 2007. “Effects of Hydrodynamics on Phosphorus Concentrations in Water of Lake Taihu, a Large, Shallow, Eutrophic Lake of China.” Hydrobiologia 581 (1): 53–61.
- Zhu, G., B. Qin, L. Zhang, and L. Luo. 2006. “Geochemical Forms of Phosphorus in Sediments of Three Large, Shallow Lakes of China.” Pedosphere 16 (6): 726–734.
- Zou, L., N. Liu, and X. Lu. 2006. “An Investigation of Pulsating Turbulent Open Channel Flow by Large Eddy Simulation.” Computers & Fluids 35 (1): 74–102.