
 ?Mathematical formulae have been encoded as MathML and are displayed in this HTML version using MathJax in order to improve their display. Uncheck the box to turn MathJax off. This feature requires Javascript. Click on a formula to zoom.
ABSTRACT
Geographic simulation models can be used to explore and better understand the geographical environment. Recent advances in geographic and socio-environmental research have led to a dramatic increase in the number of models used for this purpose. Some model repositories provide opportunities for users to explore and apply models, but few provide a general evaluation method for assessing the applicability and recognition of models. In this study, an academic impact evaluation method for models is proposed. Five indices are designed based on their pertinence. The analytical hierarchy process is used to calculate the index weights, and the academic impacts of models are quantified with the weighted sum method. The time range is controlled to evaluate the life-term and annual academic impacts of the models. Some models that met the evaluation criteria from different domains are then evaluated. The results show that the academic impact of a model can be quantified with the proposed method, and the major research areas that models impact are identified.
1. Introduction
Earth is a complex giant system, and interactions among various living beings and abundant geographical activities, including social and physical processes, are key in shaping it (Qian, Yu, and Dai Citation1993; Goodchild Citation2022). The advance of geospatial information science allows people to acquire big Earth data to understand the current state of the earth system (Claramunt Citation2020; Guo et al. Citation2020). In this context, Gore (Citation1993) envisioned the concept of a Digital Earth, which is the presentation of the Earth using 3D and multiresolution techniques; a large amount of geographic data can be shown in conjunction with the Digital Earth to provide a new perspective for people to better understand Earth and support the development of contemporary and digital geography. One of the ambitious goals in this envisioning is the simulation of social and environmental phenomena, which partly because of the additional challenges (Elsawah et al. Citation2020), is rarely considered in the first-generation digital earth system but is expected to be implemented in the next-generation digital earth system (Goodchild Citation2008, Citation2012). To achieve this goal, the employment of geographic simulation models is necessary. Geographic simulation models are designed as abstract simplifications of geographical phenomena and processes in the real world and possess the ability to reconstruct the past, assess reality and/or forecast the future at different scales (Wood Citation1994; Lü Citation2011; Lin and Chen Citation2015; Umgiesser et al. Citation2021). For example, the Community Earth System Model (CESM) is used to simulate climate futures (Lawrence et al. Citation2019), the Soil and Water Assessment Tool (SWAT) is used to predict, and support decisions for managing, water, sediment, nutrient and pesticide yields in watersheds (Santhi et al. Citation2006), and the Motor Vehicle Emission Simulator (MOVES) estimates emissions from mobile sources from local to national scales (U.S. Environmental Protection Agency Citation2012). Accordingly, geographic simulation models are helpful for the next-generation digital earth system to become a comprehensive platform that integrates spatiotemporal information (Guo, Liu, and Zhu Citation2010; Lü et al. Citation2019; Zhu et al. Citation2021).
With recent advancements in the research on geography and Digital Earth, the number of geographic simulation models has increased rapidly (Chelliah et al. Citation2015). With so many available models, determining how to assess models has become a challenge. The current research on the cognition of geographic simulation models is mainly focused on the completeness of model descriptions and comparisons of the use and impact of models. To efficiently share and explore these models, structured descriptions and surveys of models in web environments are becoming more common (Yue et al. Citation2016; Wen et al. Citation2017; Salas et al. Citation2020; Liu et al. Citation2022). Various geographic simulation resource repositories, such as the Network for Computational Modelling in Social and Ecological Sciences (CoMSES Net) (Janssen et al. Citation2008), Computational Infrastructure for Geodynamics (CIG) (Kellogg Citation2011), The Community Surface Dynamics Modeling System (CSDMS) (Peckham, Hutton, and Norris Citation2013; Tucker et al. Citation2022), HydroShare (Morsy et al. Citation2017), Open Geographic Modeling and Simulation (OpenGMS) (Chen et al. Citation2019, Citation2020) and EPANET model catalogue (Bayer, Ames, and Cleveland Citation2021) have been developed to enhance user discovery, access, and use of geographic simulation models (Wang et al. Citation2018; Zhang et al. Citation2019). When users wish to use models with which they are not familiar, they may need to rely on evaluations, recommendations, or other metrics (e.g. the number of times a model has been downloaded from a repository). In terms of geographic simulation model evaluation, the main approach used currently is to compare the simulation results of a model with measured data or the simulation results of other models, and evaluations of geographic simulation models are based on statistical indices (e.g. CMIP, EMIC, and MSTMIP, among others). Besides, CoMSES Net supports peer review of models. Those that pass peer review are awarded a ‘peer reviewed’ badge and giving a DOI. Recently, CSDMS used citation indices, including the citation count, h-index and m-quotient, to indicate model usage and impact. These citation indices reflect the impact of a specific model by counting the related publications and citations of each paper.
Although research on model descriptions is abundant, research on model evaluation methods must be improved, especially in terms of evaluating model impacts. The method of comparing model outputs is beneficial for determining the accuracy of different models, but it is only applicable to certain models and requires considerable time. In addition, since Garfield proposed the impact factor concept in Citation1955, this metric has been widely used to evaluate the academic impact of journals, papers, researchers, and institutions, among other entities (Garfield Citation1955, Citation1972; Sombatsompop et al. Citation2006; Pan and Fortunato Citation2014; Bai et al. Citation2020), even if it is disputed in the context of the reliability of the source data, the meaning of the rankings, and the misuse in some evaluations of research outputs or researchers (Smeyers and Burbules Citation2011). A quantitative measure of academic impact can also provide users with an alternative guide for model evaluation. Different than journals having a single academic impact source, extracting the impact of geographic simulation models based only on papers seems to be biased. For example, a researcher’s professional achievement depends mainly on the academic impact of their published papers in the past, whereas datasets and software were considered less meaningful research results until recently (Thain, Tannenbaum, and Livny Citation2006; Cagan Citation2003; Chassanoff et al. Citation2018). As important research products, the academic impacts of geographic simulation models should likewise be evaluated from multiple perspectives to support professional evaluation and advancement (Cagan Citation2003). For model developers, measuring their academic impact can provide feedback regarding the research value of the models they establish and provide incentives for continuous optimization and improvement. For model users, particularly interdisciplinary researchers and beginners in a research area, the academic impact of models can provide objective criteria for selecting models in different applications.
A comprehensive academic impact evaluation method for geographic simulation models requires further exploration. First, other dimensions can be used to classify academic impact beyond journal publications, and a more comprehensive evaluation metric can be obtained by considering more indices. Moreover, the time range is important for evaluating academic impact. Models with earlier release dates have had more time to accrue impact than have models released recently. Finally, it is important to measure the academic impacts of models within their relevant research areas to demonstrate the academic impact when assessing models in objective comparisons. Ultimately, by establishing a model citation index, we can continue to meet the original goals of Garfield (Citation1955): ‘evaluate the significance of a particular work and its impact on the literature and thinking of the period.’
In this study, we demonstrate the academic impact of geographic simulation models using multiple indices, which are combined using a weighted sum method that can be used to quantify multiple impacts using an analytical hierarchy process (AHP). The remainder of this paper is structured as follows. In Section 2, the existing impact indices are reviewed. In Section 3, the concept of the evaluation method is introduced. In Section 4, the impact evaluation method is presented in detail. Section 5 provides an example of the implementation of the evaluation method. In Section 6, the evaluation method for the academic impact of geographic simulation models is verified by analysing the results. In Section 7, the methods used and results of this study are discussed, and the conclusions are presented in Section 8.
2. Existing indices
With the continuous expansion and increased depth of various research fields, researchers are increasingly engaged in various types of work; thus, research outputs are increasing rapidly. Faced with high volumes of research outputs, it is difficult to determine the impact of a researcher or their research achievements. To better quantify the impact of research achievements, a variety of indices have been proposed.
Most publications refer to other relevant publications to establish the significance of their research; therefore, the number of citations a publication receives is considered an intuitive and meaningful representation of its impact. Generally, the more citations a publication receives, the higher its impact, even if these citations criticize the published work. However, the impact of publications is not confined to academics, as they can also have an impact on society. To measure the social impact of publications, Priem, Groth, and Taraborelli (Citation2012) proposed Altmetric, which tracks different types of data sources on the internet, including usage, captures, mentions, social media posts, and citations. This is an effective way to measure how much attention a publication receives from society and has been implemented by various tools, including ImpactStory, Altmetric, and Plum Analytics (Konkiel Citation2016).
Based on the impact of publications, journal impacts can also be evaluated. The most well-known journal impact index is the journal impact factor (JIF), which is a measure of the publication citation frequency of a journal based on a two-year period and is part of the journal citation reports produced by Clarivate Analytics. CiteScore evaluates journal impact using a metric similar to the JIF but is based on a three-year period (Teixeira da Silva and Memon Citation2017). Considering that the citation peak for some papers can be late, Clarivate Analytics also developed a five-year impact factor (IF5) that extends the two-year period to five years to reflect the impact of journals more continuously and stably. Regarding the value of a citation, SCImago journal rank (SJR) considers the subject field, quality and reputation of the source journal of a citation. The core of SJR is that all citations are not created equal, which may aid in distinguishing the most valuable achievements (González-Pereira, Guerrero-Bote, and Moya-Anegón Citation2010; Guerrero-Bote and Moya-Anegón Citation2012). Due to the differences in focus and progress in various subject fields, the impact of journals is rarely compared using a common standard. The source-normalized impact per paper (SNIP) uses normalization to adjust differences in citation behaviour among journals in different subject fields (Moed Citation2010; Waltman et al. Citation2013). In addition, other indices are used to evaluate the academic impact of journals from different perspectives. For example, the immediacy index indicates how rapidly papers in a journal are cited, the eigenfactor uses a citation network to measure the impact of journals, and the h5-index evaluates the academic impact of a journal by using the number of papers published and the number of citations that the papers receive in five years.
Although the impact indices of publications and journals are recognized and widely used, the impacts of specific researchers have also been continuously explored. Hirsch (Citation2005) proposed the h-index to evaluate the academic impact of a researcher, which reflects the number of papers (h) published by a scholar that receive at least the same number of citations. This index can be used to evaluate a researcher’s long-term impact; however, the index does not adequately reflect the impact of researchers who have published few publications and received a large number of citations for those publications. Subsequently, to overcome the shortcomings of the h-index, Egghe (Citation2006a, Citation2006b) proposed the g-index, which is an evaluation index based on the cumulative contributions of researchers and yields fairer evaluation results for scholars who publish fewer papers but are cited more frequently. In addition to the g-index, some extensions of the h-index, including the e-index (Zhang Citation2009), the AR-index (Jin et al. Citation2007), the f-index (Katsaros, Akritidis, and Bozanis Citation2009), the x-index (Rodríguez-Navarro Citation2011), the w-index (Wu Citation2010), the V-index (Daud, Yasir, and Muhammad Citation2013), the i10-index (Connor Citation2011), and the h-frac index (Koltun and Hafner Citation2021), have been proposed to improve upon the existing research impact indices.
Some indices can be used to evaluate researcher impact based on a factor in addition to citation statistics. The concept of successful publications was designed considering the number of citations; if the number of citations a publication receives outweighs the number of references it cites, the paper is regarded as a successful paper (Kosmulski Citation2011). The number of successful papers can represent the academic standards of researchers. From the perspective of a scholarly social network, ResearchGate designed its ResearchGate Score to evaluate scholars’ reputations, which are affected by the numbers of publications, questions, answers, and followers on the ResearchGate website. This can help researchers understand their level of recognition within the academic community but requires engagement with the ResearchGate website and has been questioned due to its non-transparency and non-replicability (Kraker, Jordan, and Lex Citation2015; Copiello and Bonifaci Citation2018).
In terms of non-journal article scientific research outputs, including data and software published in other forms, such as online repositories (e.g. World Data System and Zenodo) or as published sources (e.g. Earth-System Science Data and the JOSS Journal), no uniform metric has been developed; therefore, their impacts are difficult to evaluate. Current studies consider usage in various repositories and/or social media mention indicators to represent impact, such as with the DUI (Ingwersen and Chavan Citation2011) and Depsy Software Impact (Singh Chawla Citation2016). However, these metrics can only be used to evaluate specific objects, and it is difficult to apply them to models in other fields.
As important research tools in the field of geographic modelling and simulation, geographic simulation models have a variety of manifestations, including formulas, source codes, and executable programs. Additionally, models can be published in various forms, including within a paper or in an online repository. Therefore, citation formats for citing models are inconsistent. Some publications cite model-related publications, whereas others annotate the URL or DOI of the model repository. Additionally, in some cases, researchers simply refer to the name of the model without providing a reference. It is difficult to measure the impact of geographical models using the number of citations due to these nonstandard citation procedures. The number of model references and the total number of citations are used to calculate the h-index of a model in the CSDMS, which can accurately reflect the academic impact of a model from the perspective of publications. However, a single index can easily be manipulated and may lead to changes in research objectives to match the measurement of the index (Hicks et al. Citation2015). Hence, we posit that to make the evaluation of model impact more objective, additional factors should be considered in addition to formal citations in peer-reviewed publications. These factors include multiple types of index data and their importance, the duration of model availability, and the research field of the model.
3. Conceptual framework of the evaluation method
As the scale of academic data has grown rapidly, new statistical tools have been developed to effectively use and analyse these ‘big data’ (Anderson, Hankin, and Killworth Citation2008; Guo Citation2020). There is also a requirement for pertinent tools to illuminate the relation between models and different types of big academic data (Guo et al. Citation2021). To account for the variable levels of academic importance of different impact indices, a weighted sum method was designed to quantitatively integrate the multidimensional academic impacts of models. To enable fair and objective evaluations, the length of time a model has been available should also be considered to reduce the bias caused by release date. The research area should also be considered when evaluating a model.
3.1. Index selection for academic impacts
Many types of data are available that are potentially related to model impacts, including publications, patents, projects, videos, questions, tweets, blogs, and hosted codes (e.g. those on GitHub). However, not all of these data types accurately represent the same level of academic impact of a geographic simulation model. For example, videos, questions, tweets, and blogs are usually published without peer review, as is code made available through a repository. Therefore, using indices associated with these data types as a measure of academic impact is unconvincing (Joppa et al. Citation2013; Howison et al. Citation2015). From the perspectives of research popularity and academic recognition, several academic indices are selected to evaluate the academic impacts of geographic simulation models. These academic indices include the following:
Published papers related to models (A1). Models are often used as tools to address geographic challenges (Benenson and Torrens Citation2004; Lin et al. Citation2013; Chen et al. Citation2021) and correspond to research results typically published as papers. Published papers, including journal articles, conference papers and books, provide evidence that the academic research results were noteworthy. Therefore, mentioning a model in a paper can demonstrate that this model was instrumental to address a scientific challenge. These cases can include publications that describe new models by name and mentions of existing models used in the research or that are recognized by the researchers as important.
Granted invention patents related to models (A2). As a protection of intellectual property rights, patents are a type of scientific research achievement other than publications related to the dissemination and sharing of knowledge. The scientific research results in patents are vital for patent applications. To protect intellectual property rights, patents must also undergo rigorous review before approval is granted. Therefore, mentioning a model in an approved patent can contribute to its academic impact. Open-source and public domain model codes are less likely to receive patents and thus will not receive credit in this part of the index.
Funded research projects related to models (A3). Before determining whether a research project should be funded, rigorous review is necessary. The use or mention of a model in a funded scientific research project can indicate that the model has academic research value. This component favours models that receive broad financial support, as noted in published government grant notices. Models that cannot be used to secure external funding will not receive credit in this part of the index.
Literature citations of model-related published papers (A4). After research results are published, other research papers citing these papers demonstrate the value of the research results and the impact of the model.
Literature citations of model-related granted patents (A5). A citation of a patent can not only be used to support the recognition of the patent but can also reflect that the model used in the patent produces an academic impact.
A1, A2 and A3 are the counts of model-related research activities and outputs, which represent the research popularity of models, whereas A4 and A5 are the citations of model-related outputs, which indicate the academic recognition of models.
3.2. Life-term and annual academic impacts
A model that has been available for a long period and is used by many people has a high life-term impact. In contrast, recently released models have not had sufficient time to establish life-term academic impacts. Thus, these models are at a disadvantage in traditional methods in terms of life-term impact. Therefore, to objectively evaluate the academic impacts of models, two time ranges were selected for evaluating the academic impact. One is the life-term academic impact of a model, which reflects the total impact of the model since its release. The other is the annual academic impact of the model, which demonstrates the recent impact of the model. The annual academic impact weakens the impact of the model release time by limiting the range of time assessed.
3.3. Formulas for evaluating academic impact
Differences in the meanings of indices lead to differences in the importance of different models or studies. To comprehensively and intuitively demonstrate the academic effects of models, the weighted sum method (Equationequation 1(1)
(1) ) is used to assess the significance of each index:
(1)
(1) where M is the academic impact of the model, wi is the importance weight of the i-th index, Count(Ai) is the value of the i-th academic impact index metric, and log is the common logarithm.
In formula 1, the logarithm is used to prevent the value of the weighted sum method from increasing too fast and keep academic impact in a specific range. For the model academic impact to be positive after using the logarithm, the value of the weighted sum method must be positive one.
Both the life-term and annual academic impacts of the models were calculated using Equationequation 1(1)
(1) , but there are differences in the academic impact index data used in the calculations. The academic impact index data since the release of each model were used to evaluate the life-term academic impact. Regarding the annual academic impact, the number of annual papers, projects and patents is explicit, so the indices A1, A3, and A4 are based on the annual counts of published papers, funded projects and granted patents. Since citations last a long time, to evaluate the impact of citation behaviours in a short-term period, the value of literature citation indices to annual academic impact was limited. As the number of years after publishing increases, the number of citations increases to a peak, which indicates that the impact of the study is at a maximum. Zhao and Li (Citation2015) found that the citation peak for papers is 2–4 years, and Fukuzawa and Ida (Citation2016) found that the citation peak for patents is 6 years. To evaluate the annual academic impact, the minimum number of years to reach the citation peak years for each kind of literature was used as the limit regarding the value of literature citations indices to annual academic impact. Hence, the value of index A2 is based on the number of literature citations 2 years after a paper is published, and the value of index A5 is based on the number of literature citations 6 years after a patent is granted.
3.4. Evaluations in different research areas
It is not informative to compare all geographic simulation models with each other, as the models are applied in different research areas and the research volume of each area varies, leading to variance in the academic impacts of geographic simulation models in different research areas. However, no reference value is available for researchers in different fields. Therefore, we divided the geographic simulation models into different research areas and compared their academic impacts in each area.
4. Evaluation method
The data from the five impact indices were used to evaluate the academic impacts of models: model-related published papers, granted patents, funded research projects, literature citations of papers, and literature citations of patents. Below, we describe how we collected data for these indices, determined the weight of each index, and classified the models according to their research areas.
4.1. Data acquisition and processing methods
The impact index data were acquired from different databases. These databases contain academic data from key counties/organizations around the world. The paper and citation data were obtained from the Scopus (https://www.scopus.com) and ScienceDirect (https://www.sciencedirect.com) databases. Patents and their citations were obtained from the Google Patents Public databases (https://console.cloud.google.com/launcher/partners/patents-public-data). Finally, funded scientific research project data were obtained from Fun Research (www.funresearch.cn), which has been noted as a reliable data source for scientific research projects by many well-known university libraries in China, such as Xiamen University, East China Normal University, and Nanjing Normal University. Fun Research includes data for approximately 13 million scientific research projects funded by over 20 key organizations in more than 10 countries, including China, the United States, the United Kingdom, Germany, Canada, France, and Japan, as well as the European Union. The data acquisition and use procedures followed the abovementioned database use policies.
The accuracy of the data used to calculate index values influences the confidence in the academic impact metric results. For example, models are typically distinguished from each other by name. However, the full names of some models are long; thus, they are identified by abbreviations. For example, the Soil and Water Assessment Tool is abbreviated as SWAT, and the Community Land Model is abbreviated as CLM. We used the full name and/or abbreviation to distinguish the models from their index data when data were collected.
4.1.1. Method for acquiring model-related paper data
According to the number of names that refer to the same model, the method was divided into two parts.
If a model had both a full name and an abbreviation, then both were used to retrieve information from the paper databases using APIs provided by Elsevier. First, the full name was used to refine paper queries in Scopus and ScienceDirect. In particular, the papers that had a title, abstract, keyword, or full text that contained the full model name were retrieved. Herein, we focused on geographic simulation models, which are mostly used in the fields of geography and/or the environment; therefore, the queried papers were limited to these relevant research areas. The three-level research area journal classifications in Scopus were used to determine the papers’ research areas. The research area of a paper was regarded as the journal in which it was published. The selected classifications related to geography and the environment in Scopus are shown in . After determining the classification, eligible papers were regarded as part of the paper index dataset. Second, a model’s abbreviation was used for fuzzy queries of papers. If the text of the paper only contained the model’s abbreviation, the references of the paper were checked to see whether they contained the model’s full name. If the text of the reference retrieved in Scopus or ScienceDirect contained the full name of the model, the paper was considered related to the model and included in the model-related paper index dataset; otherwise, the paper was not included in the index dataset. The results related to the model were also included in the paper index dataset. Finally, duplicates were removed from the dataset (based on the DOI or Scopus ID) to ensure that each paper only appeared once in a model-related paper index dataset.
Table 1. Classifications related to geography and the environment in Scopus.
If a model had only one specific name, then this name was used to retrieve the model-related papers by analysing whether a paper title, abstract, or full text contained the name and whether it included research areas in the classifications in . The retrieved results comprised the paper index dataset.
4.1.2. Method for acquiring model-related patent data
Based on the number of names that could refer to the same model, this method was divided into two parts.
A process similar to that described above was used to retrieve information from the patent database. First, the full name was used to refine a query of granted patents in the Google Patents Public database. In particular, the granted patents that had a title, abstract, claim, or description that contained the model’s full name were retrieved. Due to the classification of patents differing from that of research areas, the retrieved results were not filtered by their classification. The results were regarded as part of the patent index dataset. Second, the abbreviation was used to fuzzy query the granted patents. If the full text of the granted patent only contained the abbreviation of the model, the patent reference was analysed. Only if the content of the reference contained the full name of the model was the patent considered related to the model. The results related to the model were included in the patent index dataset. Finally, duplicates were removed to ensure that each patent only appeared once in the model-related patent index dataset.
If a model had only one specific name, then this name was used to retrieve the model-related granted patents by checking if a patent’s title, abstract, claim(s), or description contained the name. The retrieved results comprised the patent index dataset.
4.1.3. Method for acquiring model-related scientific research project data
To protect scientific intellectual property, the full text of scientific research projects and final reports are rarely disclosed. Therefore, in this study, we matched the names of models with other public attributes from scientific research projects, including the project name, keywords, and application abstract. If the project was completed, we also matched model names with the final report abstract and project output details (including name, keywords and abstract). Matching was divided into two cases. If the model had only one specific name, the abovementioned public attributes were checked to determine if they contained the model’s name. If the model’s name was present, the project was considered related to the model. However, models may have a full name and an abbreviation, both of which can be used to find model-related projects. In this case, full model names were used to identify model-related projects first, and the match process for which was the same as that mentioned above. Other model-related projects were retrieved by the model abbreviations. However, the lack of availability of references and full-text projects made it difficult to determine whether the abbreviations referred to models. Therefore, to limit the search results to those with as much relevance to the model as possible, abbreviations with the word ‘model’ were used to retrieve model-related projects. The project number was used as a unique identifier to remove duplicate model-related project data.
4.1.4. Method for acquiring citation data
Citation data include the citations of model-related papers and model-related patents. For a particular model, citations of model-related papers count how many papers cited the model-related paper. One paper that cited multiple papers related to a model counted only once. The method used to count citations of model-related patents was the same as that for papers. The unique identifiers (e.g. digital object identifiers) of different types of literature data were used to identify duplicate citations.
4.2. Index weight determination
The importance of indices that evaluate the academic impact of models varies. The weight can be used to indicate the importance of indices, as the weight of index importance is directly related to the accuracy and rationality of evaluation results. Two methods are used to determine the weight of indices: the subjective weight determination method and objective weight determination method (Liu et al. Citation2019). The subjective weight determination method includes an AHP and precedence chart. The objective weight determination includes the entropy weight method, criteria importance through intercriteria correlation (also known as CRITIC), and principal component analysis. The comparison of various approaches reveals that the subjective determination approach is intuitive, uncomplicated, and capable of utilizing the research expertise of professionals to the fullest extent. The drawback is that when the information is poor or the expertise of specialists is restricted, the subjective judgment of weight loses credibility (Li et al. Citation2021, Citation2022). To maximum the separation of alternatives, the objective technique for determining index weight is based on the law of data itself and considers how to employ information entropy or bias to distribute weight. The drawback of this method is that it fails to account for the relative value of various indications (Eftekhari, Yang, and Wakin Citation2018).
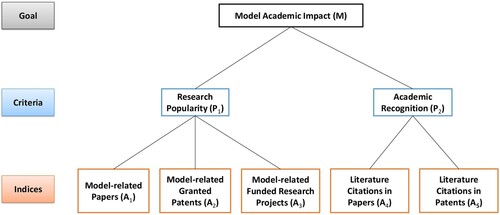
Given that people have different perceptions of the importance of different indices, in order to achieve broad agreement, the AHP (Saaty Citation1977, Citation1980) combined with the expert scoring method is used in this paper to analyse and evaluate the importance of the academic impact indices. The first step was establishing a hierarchical structure model. After dividing the decision-making goals, consideration criteria, and indices into high, middle, and low levels according to the associated relationships, a hierarchical structure diagram was established. The hierarchical structure model used in this study is shown in . Evaluating the academic impact (M) of geographic simulation models was the goal, and the model research popularity (P1) and academic recognition (P2) metrics were used as criteria for academic impact evaluation. The papers (A1), patents (A2), and scientific research projects (A3) related to models and the literature citations in relevant papers (A4) and patents (A5) were used as indices. The papers, patents, and scientific research projects related to the model are indices related to research popularity, whereas literature citations in relevant papers and patents are indices associated with academic recognition.
Figure 1. Hierarchical structure model used for academic impact evaluations of geographic simulation models.
The second step was to construct pairwise comparison matrices. When determining the weights of factors at different levels, qualitative results alone may be difficult to understand. Therefore, Saaty (Citation1977) proposed the consistent matrix method, which involves comparing factors in pairs instead of all together. A relative scale can also minimize the difficulty of comparing various factors and improve the accuracy of simulations. A pairwise comparison matrix can be used to compare the relative importance of all factors at a specific level to a certain factor in the upper level. According to the hierarchical structure model designed in this study, three pairwise comparison matrices were constructed for different levels (). In , the first pairwise comparison matrix was constructed for the goal, the second was constructed for criterion P1, and the third was constructed for criterion P2. According to the Weber-Fechner law, the magnitude of a subjective sensation increases in proportion to the logarithm of the intensity of the external physical stimulus; this proportion is a constant, also known as Weber's constant. In other words, the external physical stimulus equals a constant to the power of the magnitude of a subjective sensation divided by Weber’s constant. The 1–9 scale recommended by Saaty (Citation1983) based directly on the sensory responses of people does not consider the actual physical stimulus (Zhang, Liu, and Yang Citation2009). Hence, the (n = 0,1,2 … ,8) scale recommended by Zhang, Liu, and Yang (Citation2009) was selected to quantify people's subjective sensations and calculate the actual physical stimulus. To make it easier to distinguish importance at different levels, the levels of the
scale were reduced from 9 to 5 by retaining nonadjacent scales, and the format of the scale was simplified to
(n = 0,1,2,3,4) ().
Figure 2. Pairwise comparison matrices used in the hierarchical structure model. a) Compare the importance of research popularity (P1) and academic recognition (P2) to model academic impact (M). b) Compare the importance of model-related published papers (A1), model-related granted patents (A2) and model-related funded research projects (A3) to research popularity (P1). c) Compare the importance of literature citations in papers (A4) and literature citations in patents (A5) to academic recognition (P2).
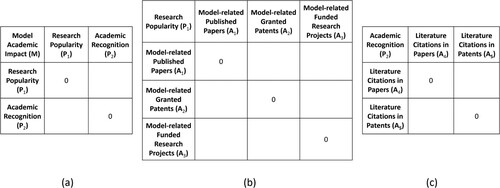
Table 2. Importance scale.
The third step was to invite scholars to compare the relative importance of all factors in each level against the relevant impact of factors in the upper level, and the results were then checked for consistency. When pairwise comparisons of over three factors were performed, a consistency test was required to prevent contradiction issues in the compared results. In this study, a consistency test was required for the pairwise comparison matrix shown in . After adding the comparison results into the pairwise comparison matrix, the maximum characteristic root of the pairwise comparison matrix was obtained using linear algebra. The value was then substituted into Equationequation 2
(2)
(2) to obtain the consistency index (CI).
(2)
(2) where CI is the consistency index,
is the maximum characteristic root of the pairwise comparison matrix, and n is the order of the matrix.
To determine whether the matrix displayed satisfactory consistency, CI was substituted into Equationequation 3(3)
(3) :
(3)
(3) where CR is the random consistency ratio and RI is the average random CI.
RI is related to the order of the matrix. When the matrix is a third-order matrix, RI has a value of 0.58. When CR ≤ 0.1, the matrix exhibits acceptable consistency, and the comparison results can be used in the next step.
In the fourth step, the importance weights of the academic impact indices were calculated. First, the average of the results that passed the consistency test was calculated as the final comparison result. Then, the consistency of the final comparison result was tested. If it did not pass the test, the third step was repeated. Next, the weight of each element from the index level to the goal level () was calculated according to the hierarchical structure model. Finally, each weight was normalized, whereby the ratio of each weight to the smallest weight was calculated as the importance weight for each indicator.
4.3. Model classification method
Different geographic simulation models can be used to investigate diverse geographic topics in specific research areas (Lü Citation2011; Harpham, Cleverley, and Kelly Citation2014; Gianni et al. Citation2018). If all models were compared regardless of research area, the results would not be meaningful because the information was not subject-area specific. Therefore, models must be classified and compared according to the associated research areas to obtain objective and meaningful comparison results.
Regarding papers, the Scopus database uses a three-level classification system to identify journal research areas. The first-level classification contains four categories: health, life, physical, and social sciences. The second-level classification distinguishes among the major disciplines of each of the first-level classifications. This classification divides the major disciplines into many specific research areas. The number of research areas in a journal in Scopus can vary from one to many. In Scopus, the research area of a paper is consistent with the research area of the corresponding journal. Regarding patents, the Google Patents Public database uses a cooperative patent classification scheme to classify patents according to their functions or applications. Regarding projects, Fun Research uses major disciplines, such as mathematics, physics, or geosciences, to distinguish scientific research projects. However, the cooperative patent classification system contains many functional classifications that cannot be converted into research areas, and the project classification system in Fun Research does not specify the detailed subdisciplines. Compared with the other two classifications, the Scopus classification method is detailed and fits well with the model subject area classification. Therefore, we used the subject areas from the Scopus database to classify the models. The studied models were more relevant to the geography and environmental research areas than to other areas. Thus, some classifications related to geography and the environment in Scopus were selected to identify the research areas of the models, and classifications with the same definitions were merged (). The third-level classifications were selected as the final model classifications.
Due to the broad research scopes encompassed by journals, defining a model’s research area based on the journal papers that mention the model can lead to certain models being incorrectly assigned to a specific research area. Thus, it was also necessary to analyse and screen the model research areas. The number of papers in which a model was applied to a given research area was counted, and the results were then sorted from highest to lowest. The number of papers in all research areas was used as the total, and the number of papers in each of the sorted research areas was added individually until the result of the sum divided by the total was not less than after adding the paper count for the n-th research area. The top-n research areas were regarded as the junior major research areas of models. In addition, these major research areas were further adjusted to ensure that the correlations between models and areas were correct. First, if there were other research areas with paper counts equal to the minimum paper count for a major research area, these research areas were added to the major research area list. Second, if the paper count for any major research area was more than one, the research areas with paper counts equal to one were not regarded as the major research area.
5. Implementation of the evaluation method
This academic impact evaluation method was implemented in two steps. First, the models were used as the study objects, and data were acquired for the five selected indices. Next, the importance weight of each academic impact index was determined by surveying expert opinions via a questionnaire. Finally, the academic impact of each model was calculated.
5.1. Data preparation
In the area of modelling and software, the adaptation and implementation of FAIR principles make a model findable, accessible, interoperable, reusable, and even useful (Wilkinson et al. Citation2016; Chue Hong et al. Citation2021; Barton et al. Citation2022b). CoMSES Net trusted digital repositories, including OpenGMS (https://geomodeling.njnu.edu.cn/), CSDMS (https://csdms.colorado.edu/), and CIG (https://geodynamics.org/), are strong supporters of FAIR principles (Barton et al. Citation2022a). Models and different versions of their metadata can be easily found and accessed in these repositories, and most of their software or code can be executed or reused by local or web-based services. To make a model interoperable with other models, CSDMS and OpenGMS developed basic model interface and model interoperation APIs (Hutton, Piper, and Tucker Citation2020; Zhang et al. Citation2021). As resources in trusted digital repositories are well documented and well known, the models evaluated in this study will be selected from these repositories, which focus on models of geographic physical processes in the Digital Earth.
Because of the absence of a unified naming convention for various models, the full names or abbreviations of some models were the same as other unrelated words or object names. For example, the Sakura model simulates hyperpycnal flows but is also the Japanese word for cherry blossoms. The soil and water assessment tool model is another example, as its abbreviation is the same as that for ‘special weapons and tactics’. Duplicate names can reduce the relevance of the index data for the model, and the corresponding academic impact may be incorrectly calculated. Model names that could not be distinguished from other entities were not included in this study. Fourteen models from various research fields and trusted geographic simulation model repositories were selected to verify the methods proposed in this paper (). Through December 31, 2020, all index data counts for the models acquired according to the method detailed in Section 4.1 are listed in .
Table 3. Model information.
Table 4. Importance weights of academic impact indices.
5.2. Calculation of the academic impact of geographic simulation models
Based on the hierarchical structure model for evaluating the academic impact of geographic simulation models, a questionnaire was designed (to generate a pairwise comparison matrix) and given to global researchers who have developed or applied geographic simulation models. Currently, 313 global researchers whose research interests are geography and/or environmental engineering have completed the questionnaire. The comparison results from all the questionnaires were then checked for consistency, as there was no fixed reference when multiple elements were compared in pairs, and some judgements may be counterintuitive. After the calculation process, all comparison results passed the check and were used to calculate the weight vectors of the indices. Finally, the importance weight of each index was obtained according to the established weight vector ().
Based on the importance weights, literature citations in papers related to models (A4) accounted for the largest contribution to the academic impact of geographic simulation models, with an importance weight of 3.56. The second-largest contribution was papers related to models (A1), with an importance weight of 2.91. Funded research projects related to models (A3), granted patents related to models (A2) and literature citations in patents (A5) had weights substantially lower than those of the top-two indices (1.12, 1.03 and 1, respectively). These numbers demonstrate that researchers are still inclined to regard papers as the final published form of academic research results, and the number of paper citations can represent the impact of research results. The academic impact score for each model was calculated using Equationequation 1(1)
(1) and these weights.
6. Results
6.1. Correlation check analysis
To assess the accuracy of the index data acquisition method, the correlation between the acquired index data and the model was investigated. Two people were trained to conduct the correlation check between index data and the models to ensure that they could identify whether words consistent with the model names in the index data text referred to the correct models. Because the size of the paper and project index dataset established in this study was large, 10% of the papers and 10% of the patents for each model were randomly selected (at least one of each index data is selected) to determine the correlation between index data and models. shows the correlation check counts and results for the paper, patent, and project data without the literature citation indices because the citations did not have to contain a model name. Here, the accuracies of the paper and patent data were high (nearly 100%) because the results of the paper and patent data were checked further by the citing literature, whereas the accuracy of project data was relatively low (95.0%). After checking the unrelated project data, we found that a few projects may list papers published in other research areas as outputs, and the themes of these papers may highly deviate from the project theme. In view of the high accuracy of index data (more than 95%), we believe that these data are reliable but could be improved.
Table 5. Correlation check results.
6.2. Comparison of life-term and annual academic impacts
By substituting the importance weights of the academic impact indices into the academic impact evaluation formula and supplementing them with the academic impact index data, the academic impact of each model was calculated. By adjusting the time range for each academic impact index calculation, the life-term and annual academic impacts of the models were determined. In , the life-term academic impacts of geographic simulation models increased progressively over time, whereas the annual academic impacts varied. Therefore, the life-term academic impact can better demonstrate the total impact of a model since its release, whereas the annual academic impact can describe the academic impact of a model in different periods.
Figure 3. Changes in the life-term and annual academic impacts of three geographic simulation models over time.
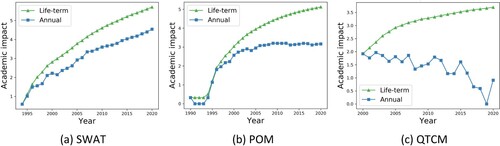
From the perspective of the changing trend of the models’ academic impact, life-term and annual academic impact are obviously correlative. As shown in , the annual academic impact of SWAT increases by years, which indicates that the research popularity and recognition of SWAT is improving rapidly so that the life-term academic impact trends upwards almost diagonally. The annual academic impact of POM remains at a stable level after having increased rapidly in the years since its release, which shows that the research scales and areas of POM are relatively stable; thus, the life-term academic impact trends upwards relatively rapidly. The annual academic impact of QTCM is in a downwards trend over time, which shows that the research interest in QTCM is decreasing, so the life-term academic impact is increasing slowly. These results obey the principle of models in which continuously high annual academic impacts can also exhibit continuously high life-term academic impacts.
6.3. Comparison with existing model repository records
6.3.1. Identification and comparison of the major model research areas
Using the method proposed in Section 4.3, major model research areas were identified. To verify whether the identification results were correct, model domains that were added by model contributors in CSDMS and OpenGMS were recorded (). Model domains in CSDMS focus on subject areas, while model domains in OpenGMS mainly focus on natural regions and include model scale classifications and method-focused classifications (e.g. regional-scale, global-scale and physical process calculation). These extra classifications are beneficial for identifying models from the perspective of model features. In , all model domains in CSDMS and OpenGMS are similar, and both contain key domains for which models were designed. Because the classifications in Scopus are designed for various subjects, including health sciences, life sciences, physical sciences and social sciences, classifications regarding geography are not domain distinct. For example, water science and technology includes research on hydrology and the cryosphere, and oceanography spans marine and coastal research. Overall, the major research areas encompass the domains in CSDMS and OpenGMS and, in some cases, contain specific application areas, such as environmental engineering and pollution.
Table 6. Model information comparison.
6.3.2. Comparison with CSDMS model impact
In CSDMS, model property information is recorded in the form of metadata, which is easy for people and machines to read and use. Using this information, CSDMS acquired model-related publications and their citations based on the search algorithms applied, and model impacts were assessed from the publication perspective.
also shows the model development years and the years of the model impact evaluation for different evaluation methods. Because CSDMS only uses publications to evaluate model impact, the start year of the evaluation in CSDMS was the first paper published year. The start year of the model impact evaluation in this paper was the earliest year of published papers, patents and projects related to a model. It is obvious that the start year of the proposed evaluation method for some models is earlier than the first publication year in CSDMS and close to the initial model development year. Additionally, a few academic impacts are first observed the year after the first publication in CSDMS. The reason is that papers acquired for this paper come from the Scopus and ScienceDirect database, which belong to Elsevier, but some of publications that CSDMS acquired were technical documentations for models and articles in journals not published by Elsevier.
According to the model-related metadata and publication information, CSDMS calculates the H-index and M-quotient of models to reveal model impact. Similar to the H-index of scholars, the model H-index means that there are at most H model-related publications, and each publication has been cited at least H times. The model M-quotient is equal to H-index for a given year divided by the difference between this year and the year that the model was developed. However, if the model development year is uncertain, it is replaced by the first paper published year. This study refers to model-related publications acquired by CSDMS and calculates three models’ H-index and M-quotient from the start year of the evaluation ().
Figure 4. Changes in the H-index and M-quotient of three geographic simulation models over time.
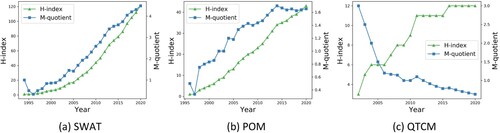
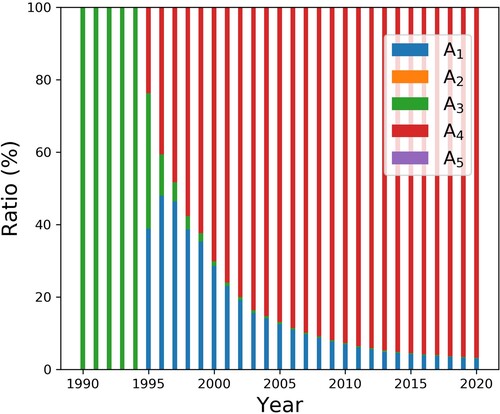
When is compared with , it becomes obvious that the CSDMS model impact is similar to the model academic impact from the perspective of the overall trend, but there are some differences in local features. The annual academic impact of SWAT continued to increase after 1994, while the M-quotient had a brief dip between 1994 and 1996 ((a) and (a)). After checking the contribution ratio of each index to the SWAT annual academic impact in 1995 and 1996 (), we find that the impact of literature citations in papers (A4) occupied a prominent ratio in annual academic impact. The M-quotient derives from the H-index, whereas the H-index cannot quantify the impact of literature citations in papers accurately; this is why the M-quotient decreases. Constrained by the large H-index, the downward trend of the QTCM M-quotient is gradual, while annual academic impact shows a fluctuating downwards trend ((c) and (c)). A comparison of with (b) shows that the introduction of the project (A3) brings the start time of the model academic impact evaluation forward by years. Overall, the model academic impact evaluation method proposed in this paper accurately describes the trend and fluctuation of model academic impact.
Figure 5. Contribution ratio of index A1 and A4 to SWAT annual academic impact over time.
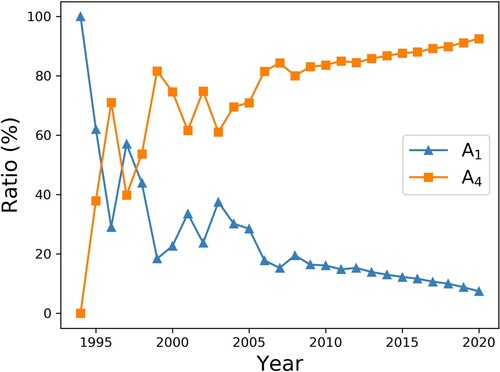
Figure 6. Contribution ratio of each index to POM life-term academic impact over time.
7. Discussion
For researchers in the geographic modelling and simulation fields, a geographic simulation model is an important research output. However, people can learn about the impacts of a publication through many indices and still know little about the research output other than what is discussed in publications, particularly for models. In this study, an evaluation method was proposed to quantify the academic impacts of geographic simulation models based on five indices related to academic outputs. This method used the AHP to determine the importance weight of each index and obtained the index data related to the models using a set of data acquisition methods. This method can be used to evaluate the life-term and annual model academic impacts and identify the major research area(s) that a model can impact.
Compared with the model impact evaluation method used by CSDMS, the model academic impact proposed in this study exhibits improvements. First, the model academic impact accounts for different time ranges, accurately reflecting changes in the life-term and annual impact of models. Second, the model academic impact is based on multiple factors and their importance weights to consider multiple perspectives, not just the publication perspective. Finally, people can learn the major research areas not only for model design but also for model impact and application, thus promoting targeted model use and development.
To improve the accuracy of the index data, the data acquisition method adopted in this study can limit the scope of the data by filtering the data multiple times. However, this strict method exclude data that look unreliable but are actually related to the model. Additionally, the method cannot retrieve highly credible index data related to a model with the same name as a common word because the results may be irrelevant. These limitations may be solved by applying natural language processing to model recognition.
When spanning a range of research areas, there are several ways in which bias can arise, such as differences in citation rates among research areas and differences in the potential audience for a particular model. The evaluation method may also be unfair for particular research areas. A normalized method should be explored to meet the challenges associated with considering various research areas.
In this study, the model academic impact evaluation method was helpful for measuring the academic achievements of models; it supports models as meaningful research outputs to obtain the corresponding academic impacts, much like those used in traditional publishing. This study expands the research on achievement impact indices, and the proposed approach can supplement evaluation methods for models from a multifactor perspective.
8. Conclusions and future work
Based on five academic impact indices and their levels of importance, a method for evaluating the academic impacts of geographic simulation models is developed. The method can be used for preliminary analyses of the academic impacts of different models from multiple perspectives, extend the time range of model academic impacts, demonstrate how multiple academic indices affect model academic impacts and acquire model major research areas. There is quite a number of models that can be used in next-generation digital earth systems to simulate social and physical processes. This study provides a new method for the rapid discovery of models and lays the foundation for semantic relation networks involving Digital Earth and other geographic-related domains throughout the modelling community.
The results obtained in this study verify the reasonability of the proposed academic impact index for geographic simulation models to some extent; however, some aspects of the method proposed in this paper require improvement:
The algorithm used to identify models in the literature should be improved. The models evaluated in this study had distinct names, whereas other models with names easily confused with other words and objects were ignored. The method developed cannot accurately evaluate the academic impacts of models with such names. Therefore, to support the automatic evaluation of the academic impacts of all geographic simulation models, it will be necessary to combine natural language processing and other machine learning methods to accurately identify geographic simulation models in various datasets.
There should be a distinction between publications that embrace or use a model, and publications that a model. Having such a distinction makes it possible to adjust the academic impact accordingly. For example, publications that embrace a model may increase the academic impact, whereas critical publications may decrease it.
Understanding the academic impacts of models for specific fields. In this study, models were classified according to the class used by the journal in which the paper was published, which was helpful for understanding the research area of the model. However, many studies focus on various factors in one research area. For example, in water science, some questions focus on rivers, whereas others focus on oceans. The models used to study these natural phenomena differ. Therefore, helping people understand the academic impact of a model in a particular field is most conducive to solving the relevant problem.
Copyright statement
Some rights reserved. This work permits non-commercial use, distribution, and reproduction in any medium without adaptation of the content, provided the original authors and source are credited.
Declaration of competing interests
The authors declare that they have no known competing financial interests or personal relationships that could have appeared to influence the work reported in this paper.
Acknowledgements
We appreciate the detailed suggestions and comments from editors and anonymous reviewers. We express heartfelt thanks to all questionnaire survey participants. This work was supported by National Key Research and Development Program of China (Grant number 2022YFF0711604) and the General Project of the NSF of China (Grant number 42071363).
Data availability statement
The datasets used in this paper can be accessed via the public API of Scopus, ScienceDirect, the Google Public Patents database and Fun Research. Due to the provisions of the data providers, these datasets cannot be redistributed externally.
Disclosure statement
No potential conflict of interest was reported by the author(s).
References
- Anderson, T. R., R. K. Hankin, and P. D. Killworth. 2008. “Beyond the Durfee Square: Enhancing the H-Index to Score Total Publication Output.” Scientometrics 76 (3): 577–588. doi:10.1007/S11192-007-2071-2.
- Arnold, J. G., R. Srinivasan, R. S. Muttiah, and J. R. Williams. 1998. “Large Area Hydrologic Modeling and Assessment Part I: Model Development.” JAWRA Journal of the American Water Resources Association 34 (1): 73–89. doi:10.1111/j.1752-1688.1998.tb05961.x.
- Bai, X., H. Pan, J. Hou, T. Guo, I. Lee, and F. Xia. 2020. “Quantifying Success in Science: An Overview.” IEEE Access 8: 123200–123214. doi:10.1109/ACCESS.2020.3007709.
- Barton, C. M., D. Ames, M. Chen, K. Frank, H. A. Jagers, A. Lee, S. Reis, L. Swantek, et al. 2022a. “Making Modeling and Software Fair.” Environmental Modelling & Software 156: 105496. doi:10.1016/j.envsoft.2022.105496.
- Barton, C. M., A. Lee, M. A. Janssen, S. van der Leeuw, G. E. Tucker, C. Porter, J. Greenberg, et al. 2022b. “How to Make Models More Useful.” Proceedings of the National Academy of Sciences 119 (35): e2202112119. doi:10.1073/pnas.2202112119.
- Bayer, T., D. P. Ames, and T. G. Cleveland. 2021. “Design and Development of a Web-Based EPANET Model Catalogue and Execution Environment.” Annals of GIS 27 (3): 247–260. doi:10.1080/19475683.2021.1936171.
- Benenson, I., and P. M. Torrens. 2004. “A Minimal Prototype for Integrating GIS and Geographic Simulation Through Geographic Automata Systems.” In Chap. 23 in Geodynamics, edited by P. Atkinson, G. M. Foody, S. E. Darby, and F. Wu, 347–368. Boca Raton: CRC Press.
- Blumberg, A. F., and G. L. Mellor. 1987. “A Description of a Three-Dimensional Coastal Ocean Circulation Model.” Three-dimensional coastal ocean models 4: 1–16. doi:10.1029/CO004p0001.
- Cagan, R. 2003. “San Francisco Declaration on Research Assessment.” Disease Models & Mechanisms 6 (4): 869–870. doi:10.1242/Dmm.012955.
- Carey, W. P. 1984. Physical Basis and Potential Estimation Techniques for Soil Erosion Parameters in The Precipitation-Runoff Modeling System (PRMS). Reston: U.S. Geological Survey.
- Chassanoff, A., Y. Alnoamany, K. Thornton, and J. Borghi. 2018. “Software Curation in Research Libraries: Practice and Promise.” Journal of Librarianship and Scholarly Communication 6 (1): eP2239. doi:10.7710/2162-3309.2239.
- Chelliah, V., J. Nick, A. Ishan, A. Raza, D. Marine, G. Mihai, H. Michael, et al. 2015. “Biomodels: Ten-Year Anniversary.” Nucleic Acids Research 43 (D1): D542–D548. doi:10.1093/Nar/Gku1181.
- Chen, M., G. Lv, C. Zhou, H. Lin, Z. Ma, S. Yue, Y. Wen, et al. 2021. “Geographic Modeling and Simulation Systems for Geographic Research in the New Era: Some Thoughts on Their Development and Construction.” Science China Earth Sciences 64 (8): 1207–1223. doi:10.1007/S11430-020-9759-0.
- Chen, M., A. Voinov, D. P. Ames, A. J. Kettner, J. L. Goodall, A. J. Jakeman, M. C. Barton, et al. 2020. “Position Paper: Open Web-Distributed Integrated Geographic Modelling and Simulation to Enable Broader Participation and Applications.” Earth-Science Reviews 207: 103223. doi:10.1016/J.Earscirev.2020.103223.
- Chen, M., S. Yue, G. Lü, H. Lin, C. Yang, Y. Wen, T. Hou, et al. 2019. “Teamwork-Oriented Integrated Modeling Method for Geo-Problem Solving.” Environmental Modelling & Software 119: 111–123. doi:10.1016/J.Envsoft.2019.05.015.
- Choi, E., E. Tan, L. L. Lavier, and V. M. Calo. 2013. “DynEarthSol2D: An Efficient Unstructured Finite Element Method to Study Long-term Tectonic Deformation.” Journal of Geophysical Research: solid earth 118 (5): 2429–2444. doi:10.1002/jgrb.50148.
- Chue Hong, N. P., D. S. Katz, M. Barker, A. Lamprecht, C. Martinez, F. E. Psomopoulos, J. Harrow, et al. 2021. “FAIR Principles for Research Software (FAIR4RS Principles).” Research Data Alliance. Accessed 23 October 2022. doi:10.15497/RDA00068.
- Claramunt, C. 2020. “Ontologies for Geospatial Information: Progress and Challenges Ahead.” Journal of spatial information science 20: 35–41. doi:10.5311/JOSIS.2020.20.666.
- Clow, G. D. 2018. “CVPM 1.1: A Flexible Heat-Transfer Modeling System for Permafrost.” Geoscientific Model Development 11 (12): 4889–4908. doi:10.5194/gmd-11-4889-2018.
- Connor, J. 2011. “Google Scholar Citations Open to All.” Accessed 6 July 2022. https://scholar.googleblog.com/2011/11/google-scholar-citations-open-to-all.html.
- Copiello, S., and P. Bonifaci. 2018. “A Few Remarks on Researchgate Score and Academic Reputation.” Scientometrics 114 (1): 301–306. doi:10.1007/S11192-017-2582-9.
- Croley, T. E., and C. He. 2005. “Distributed-Parameter Large Basin Runoff Model. I: Model Development.” Journal of Hydrologic Engineering 10: 173–181. doi:10.1061/(ASCE)1084-0699(2005)10:3(173).
- Daud, A., S. S. Yasir, and F. Muhammad. 2013. "V-Index an Index Based on Consistent Researcher Productivity." Paper presented at IEEE International Conference on Multi Topic, Lahore, December 19-20.
- De Roo, A., M. Odijk, G. Schmuck, E. Koster, and A. Lucieer. 2001. “Assessing the Effects of Land Use Changes on Floods in the Meuse and Oder Catchment.” Physics and Chemistry of the Earth, Part B: Hydrology, Oceans and Atmosphere 26: 593–599. doi:10.1016/S1464-1909(01)00054-5.
- De Roo, A. P. J., C. G. Wesseling, and W. P. A. Van Deursen. 2000. “Physically Based River Basin Modelling Within a GIS: The LISFLOOD Model.” Hydrological Processes 14: 1981–1992. doi:10.1002/1099-1085(20000815/30)14:11/12<1981::AID-HYP49>3.0.CO;2-F.
- Eftekhari, A., D. Yang, and M. B. Wakin. 2018. “Weighted Matrix Completion and Recovery with Prior Subspace Information.” IEEE Transactions on Information Theory 64 (6): 4044–4071. doi:10.1109/TIT.2018.2816685.
- Egghe, L. 2006a. “An Improvement of the H-Index: The G-Index.” ISSI Newsletter 2 (1): 8–9.
- Egghe, L. 2006b. “Theory and Practise of the G-Index.” Scientometrics 69 (1): 131–152. doi:10.1007/S11192-006-0144-7.
- Elias, E. P. L., D. J. R. Walstra, J. A. Roelvink, M. J. F. Stive, and M. D. Klein. 2001. “Hydrodynamic Validation of Delft3D with Field Measurements at Egmond.” Paper Presented at the 27th International Conference on Coastal Engineering (ICCE), Sydney, July 16–21. doi:10.1061/40549(276)212.
- Elsawah, S., T. Filatova, A. J. Jakeman, A. J. Kettner, M. L. Zellner, I. N. Athanasiadis, S. H. Hamilton, et al. 2020. “Eight Grand Challenges in Socio-Environmental Systems Modeling.” Socio-Environmental Systems Modelling 2: 16226. doi:10.18174/sesmo.2020a16226.
- Fukuzawa, N., and T. Ida. 2016. “Science Linkages between Scientific Articles and Patents for Leading Scientists in the Life and Medical Sciences Field: The Case of Japan.” Scientometrics 106 (2): 629–644. doi:10.1007/S11192-015-1795-Z.
- Garfield, E. 1955. “Citation Indexes for Science: A New Dimension in Documentation Through Association of Ideas.” Science 122 (3159): 108–111. doi:10.1126/Science.122.3159.108.
- Garfield, E. 1972. “Citation Analysis as a Tool in Journal Evaluation.” Science 178 (4060): 471–479. doi:10.1126/Science.178.4060.471.
- Gassman, P. W., M. R. Reyes, C. H. Green, and J. G. Arnold. 2007. “The Soil and Water Assessment Tool: Historical Development, Applications, and Future Research Directions.” Transactions of the ASABE 50 (4): 1211–1250. doi:10.13031/2013.23637.
- Gianni, G. M., F. M. Dávila, A. Echaurren, L. Fennell, J. Tobal, C. Navarrete, P. Quezada, A. Folguera, and M. Giménez. 2018. “A Geodynamic Model Linking Cretaceous Orogeny, Arc Migration, Foreland Dynamic Subsidence and Marine Ingression in Southern South America.” Earth-Science Reviews 185: 437–462. doi:10.1016/J.Earscirev.2018.06.016.
- González-Pereira, B., V. P. Guerrero-Bote, and F. Moya-Anegón. 2010. “A New Approach to the Metric of Journals’ Scientific Prestige: the SJR Indicator.” Journal of Informetrics 4 (3): 379–391. doi:10.1016/J.Joi.2010.03.002.
- Goodchild, M. F. 2008. “The Use Cases of Digital Earth.” International Journal of Digital Earth 1 (1): 31–42. doi:10.1080/17538940701782528.
- Goodchild, M. F. 2012. “The Future of Digital Earth.” Annals of GIS 18 (2): 93–98. doi:10.1080/19475683.2012.668561.
- Goodchild, M. F. 2022. “Commentary: General Principles and Analytical Frameworks in Geography and Giscience.” Annals of GIS 28 (1): 85–87. doi:10.1080/19475683.2022.2030943.
- Gore, A. 1993. “Earth in the Balance: Ecology and the Human Spirit.” Journal of Leisure Research 25 (2): 218.
- Guerrero-Bote, V. P., and F. Moya-Anegón. 2012. “A Further Step Forward in Measuring Journals’ Scientific Prestige: the SJR2 Indicator.” Journal of Informetrics 6 (4): 674–688. doi:10.1016/J.Joi.2012.07.001.
- Guo, H. 2020. “Big Earth Data Facilitates Sustainable Development Goals.” Big Earth Data 4 (1): 1–2. doi:10.1080/20964471.2020.1730568.
- Guo, H., D. Liang, F. Chen, and Z. Shirazi. 2021. “Innovative Approaches to the Sustainable Development Goals Using Big Earth Data.” Big Earth Data 5 (3): 263–276. doi:10.1080/20964471.2021.1939989.
- Guo, H. D., Z. Liu, and L. W. Zhu. 2010. “Digital Earth: Decadal Experiences and Some Thoughts.” International Journal of Digital Earth 3 (1): 31–46. doi:10.1080/17538941003622602.
- Guo, H., S. Nativi, D. Liang, M. Craglia, L. Wang, S. Schade, C. Corban, et al. 2020. “Big Earth Data Science: An Information Framework for a Sustainable Planet.” International Journal of Digital Earth 13 (7): 743–767. doi:10.1080/17538947.2020.1743785.
- Harpham, Q., P. Cleverley, and D. Kelly. 2014. “The Fluidearth 2 Implementation of Openmi 2.0.” Journal of Hydroinformatics 16 (4): 890–906. doi: 10.2166/Hydro.2013.190.
- Hicks, D., P. Wouters, L. Waltman, S. De Rijcke, and I. Rafols. 2015. “Bibliometrics: the Leiden Manifesto for Research Metrics.” Nature 520 (7548): 429–431. doi:10.1038/520429a.
- Hirsch, J. E. 2005. “An Index to Quantify an Individual's Scientific Research Output.” Proceedings of the National Academy of Sciences 102 (46): 16569–16572. doi:10.1073/Pnas.0507655102.
- Howison, J., E. Deelman, M. J. Mclennan, R. Ferreira da Silva, and J. D. Herbsleb. 2015. “Understanding the Scientific Software Ecosystem and Its Impact: Current and Future Measures.” Research Evaluation 24 (4): 454–470. doi:10.1093/Reseval/Rvv014.
- Hutton, E. W. H., M. D. Piper, and G. E. Tucker. 2020. “The Basic Model Interface 2.0: A Standard Interface for Coupling Numerical Models in The Geosciences.” Journal of Open Source Software 5 (51): 2317. doi:10.21105/joss.02317.
- Ingwersen, P., and V. Chavan. 2011. “Indicators for the Data Usage Index (DUI): An Incentive for Publishing Primary Biodiversity Data Through Global Information Infrastructure.” BMC Bioinformatics 12 (15): 1–10. doi:10.1186/1471-2105-12-S15-S3.
- Janssen, M. A., L. N. Alessa, M. Barton, S. Bergin, and A. Lee. 2008. “Towards a Community Framework for Agent-Based Modelling.” Journal of Artificial Societies and Social Simulation 11 (2): 6. doi:10.1016/J.Ijintrel.2008.02.001.
- Jin, B., L. Liang, R. Rousseau, and L. Egghe. 2007. “The R-And AR-Indices: Complementing the H-Index.” Chinese Science Bulletin 52 (6): 855–863. doi:10.1007/S11434-007-0145-9.
- Joppa, L. N., G. Mcinerny, R. Harper, L. Salido, K. Takeda, K. O’Hara, D. Gavaghan, and S. Emmott. 2013. “Troubling Trends in Scientific Software Use.” Science 340 (6134): 814–815. doi:10.1126/Science.1231535.
- Katsaros, D., L. Akritidis, and P. Bozanis. 2009. “The F Index: Quantifying the Impact of Coterminal Citations on Scientists’ Ranking.” Journal of the American Society for Information Science and Technology 60 (5): 1051–1056. doi:10.1002/Asi.21040.
- Kellogg, L. 2011. "Computational Infrastructure for Geodynamics." Accessed 22 October, 2022. http://geodynamics.org.
- Koltun, V., and D. Hafner. 2021. “The H-Index is No Longer an Effective Correlate of Scientific Reputation.” Plos One 16 (6): E0253397. doi:10.1371/Journal.Pone.0253397.
- Konkiel, S. 2016. “Altmetrics: Diversifying the Understanding of Influential Scholarship.” Palgrave Communications 2 (1): 1–7. doi:10.1057/Palcomms.2016.57.
- Kosmulski, M. 2011. “Successful Papers: A New Idea in Evaluation of Scientific Output.” Journal of Informetrics 5 (3): 481–485. doi:10.1016/J.Joi.2011.03.001.
- Kraker, P., K. Jordan, and E. Lex. 2015. “The Researchgate Score: A Good Example of a Bad Metric.” Accessed 6 July 2022. https://blogs.lse.ac.uk/impactofsocialsciences/2015/12/09/the-researchgate-score-a-good-example-of-a-bad-metric/.
- Lawrence, D. M., R. A. Fisher, C. D. Koven, K. W. Oleson, S. C. Swenson, G. Bonan, N. Collier, et al. 2019. “The Community Land Model Version 5: Description of New Features, Benchmarking, and Impact of Forcing Uncertainty.” Journal of Advances in Modeling Earth Systems 11 (12): 4245–4287. doi:10.1029/2018MS001583.
- Li, W., J. Zhu, L. Fu, Q. Zhu, Y. Xie, and Y. Hu. 2021. “An Augmented Representation Method of Debris Flow Scenes to Improve Public Perception.” International Journal of Geographical Information Science 35 (8): 1521–1544. doi: 10.1080/13658816.2020.1833016.
- Li, W., J. Zhu, Y. Gong, Q. Zhu, B. Xu, and M. Chen. 2022. “An Optimal Selection Method for Debris Flow Scene Symbols Considering Public Cognition Differences.” International Journal of Disaster Risk Reduction 68: 102698. doi: 10.1016/j.ijdrr.2021.102698.
- Liang, M., N. Geleynse, D. A. Edmonds, and P. Passalacqua. 2015. “A Reduced-Complexity Model for River Delta Formation-Part 2: Assessment of the Flow Routing Scheme.” Earth Surface Dynamics 3: 87–104. doi: 10.5194/esurf-3-87-2015.
- Liang, X., E. F. Wood, and D. P. Lettenmaier. 1996. “Surface Soil Moisture Parameterization of the VIC-2L Model: Evaluation and Modification.” Global and Planetary Change 13: 195–206. doi: 10.1016/0921-8181(95)00046-1.
- Lin, H., and M. Chen. 2015. “Managing and Sharing Geographic Knowledge in Virtual Geographic Environments (VGEs).” Annals of GIS 21 (4): 261–263. doi: 10.1080/19475683.2015.1099568.
- Lin, H., M. Chen, G. Lu, Q. Zhu, J. Gong, X. You, Y. Wen, B. Xu, and M. Hu. 2013. “Virtual Geographic Environments (VGEs): A New Generation of Geographic Analysis Tool.” Earth-Science Reviews 126: 74–84. doi: 10.1016/J.Earscirev.2013.08.001.
- Liu, X., M. Chen, C. Claramunt, M. Batty, M. P. Kwan, A. M. Senousi, T. Cheng, et al. 2022. “Geographic Information Science in the Era of Geospatial Big Data: A Cyberspace Perspective.” The Innovation 3 (5): 100279. doi: 10.1016/j.xinn.2022.100279.
- Liu, X., J. Yang, J. Lu, G. Liu, and Z. Geng. 2019. “Weight Empowerment Method in Information Fusion for Radar-Seeker Performance Evaluation.” The Journal of Engineering 2019 (12): 8452–8457. doi: 10.1049/joe.2018.5349.
- Lü, G. 2011. “Geographic Analysis-Oriented Virtual Geographic Environment: Framework, Structure and Functions.” Science China Earth Sciences 54 (5): 733–743. doi: 10.1007/S11430-011-4193-2.
- Lü, G., M. Batty, J. Strobl, H. Lin, A. X. Zhu, and M. Chen. 2019. “Reflections and Speculations on the Progress in Geographic Information Systems (GIS): A Geographic Perspective.” International Journal of Geographical Information Science 33 (2): 346–367. doi: 10.1080/13658816.2018.1533136.
- Miller, J. R., G. L. Russell, and G. Caliri. 1994. “Continental-Scale River Flow in Climate Models.” Journal of Climate 7: 914–928. doi: 10.1175/1520-0442(1994)0072.0.CO;2.
- Moed, H. F. 2010. “Measuring Contextual Citation Impact of Scientific Journals.” Journal of Informetrics 4 (3): 265–277. doi: 10.1016/J.Joi.2010.01.002.
- Morsy, M. M., J. L. Goodall, A. M. Castronova, P. Dash, V. Merwade, J. M. Sadler, M. A. Rajib, J. S. Horsburgh, and D. G. Tarboton. 2017. “Design of a Metadata Framework for Environmental Models with an Example Hydrologic Application in Hydroshare.” Environmental Modelling & Software 93: 13–28. doi: 10.1016/J.Envsoft.2017.02.028.
- Neelin, J. D., and N. Zeng. 2000. “A Quasi-Equilibrium Tropical Circulation Model-Formulation.” Journal of the Atmospheric Sciences 57: 1741–1766. doi: 10.1175/1520-0469(2000)057<1741:AQETCM>2.0.CO;2.
- Pan, R. K., and S. Fortunato. 2014. “Author Impact Factor: Tracking the Dynamics of Individual Scientific Impact.” Scientific Reports 4 (1): 1–7. doi: 10.1038/Srep04880.
- Peckham, S. D., E. W. H. Hutton, and B. Norris. 2013. “A Component-Based Approach to Integrated Modeling in the Geosciences: The Design of CSDMS.” Computers & Geosciences 53: 3–12. doi: 10.1016/J.Cageo.2012.04.002.
- Priem, J., P. Groth, and D. Taraborelli. 2012. “The Altmetrics Collection.” Plos One 7 (11): E48753. doi: 10.1371/Journal.Pone.0048753.
- Pusok, A. E., and B. J. P. Kaus. 2015. “Development of Topography in 3-D Continental-Collision Models.” Geochemistry, Geophysics, Geosystems 16: 1378–1400. doi: 10.1002/2015GC005732.
- Qian, X., J. Yu, and R. Dai. 1993. “A New Discipline of Science—The Study of Open Complex Giant System and Its Methodology.” Journal of Systems Engineering and Electronics 4 (2): 2–12.
- Rodríguez-Navarro, A. 2011. “A Simple Index for the High-Citation Tail of Citation Distribution to Quantify Research Performance in Countries and Institutions.” Plos One 6 (5): E20510. doi: 10.1371/Journal.Pone.0020510.
- Saaty, T. L. 1977. “A Scaling Method for Priorities in Hierarchical Structures.” Journal of Mathematical Psychology 15 (3): 234–281. doi: 10.1016/0022-2496(77)90033-5.
- Saaty, T. L. 1980. The Analytic Hierarchy Process. New York: Mcgraw-Hill International Book Company.
- Saaty, T. L. 1983. “Priority Setting in Complex Problems.” IEEE Transactions on Engineering Management 3: 140–155. doi: 10.1109/TEM.1983.6448606.
- Salas, D., X. Liang, M. Navarro, Y. Liang, and D. Luna. 2020. “An Open-Data Open-Model Framework for Hydrological Models’ Integration, Evaluation and Application.” Environmental Modelling & Software 126: 104622. doi: 10.1016/J.Envsoft.2020.104622.
- Salles, T. 2016. “Badlands: A Parallel Basin and Landscape Dynamics Model.” SoftwareX 5: 195–202. doi: 10.1016/j.softx.2016.08.005.
- Salles, T., X. Ding, G. Brocard, and I. Borazjani. 2018. “Pybadlands: A Framework to Simulate Sediment Transport, Landscape Dynamics and Basin Stratigraphic Evolution Through Space and Time.” PLOS ONE 13: e0195557. doi: 10.1371/journal.pone.0195557.
- Santhi, C., R. Srinivasan, J. G. Arnold, and J. R. Williams. 2006. “A Modeling Approach to Evaluate the Impacts of Water Quality Management Plans Implemented in a Watershed in Texas.” Environmental Modelling & Software 21 (8): 1141–1157. doi: 10.1016/j.envsoft.2005.05.013.
- Singh Chawla, D. 2016. “The Unsung Heroes of Scientific Software.” Nature 529 (7584): 115–116. doi: 10.1038/529115a.
- Smeyers, P., and N. C. Burbules. 2011. “How to Improve Your Impact Factor: Questioning the Quantification of Academic Quality.” Journal of Philosophy of Education 45 (1): 1–17. doi: 10.1111/J.1467-9752.2011.00787.X.
- Sombatsompop, N., A. Kositchaiyong, T. Markpin, and S. Inrit. 2006. “Scientific Evaluations of Citation Quality of International Research Articles in the SCI Database: Thailand Case Study.” Scientometrics 66 (3): 521–535. doi: 10.1007/S11192-006-0038-8.
- Teixeira da Silva, J. A., and A. R. Memon. 2017. “Citescore: A Cite for Sore Eyes, or a Valuable, Transparent Metric?” Scientometrics 111 (1): 553–556. doi: 10.1007/S11192-017-2250-0.
- Thain, D., T. Tannenbaum, and M. Livny. 2006. “How to Measure A Large Open-Source Distributed System.” Concurrency and Computation: Practice and Experience 18 (15): 1989–2019. doi: 10.1002/Cpe.1041.
- Tucker, G. E., E. W. H. Hutton, M. D. Piper, B. Campforts, T. Gan, K. R. Barnhart, A. J. Kettner, et al. 2022. “CSDMS: A Community Platform for Numerical Modeling of Earth Surface Processes.” Geoscientific Model Development 15 (4): 1413–1439. doi: 10.5194/Gmd-15-1413-2022.
- Umgiesser, G., M. Bajo, C. Ferrarin, A. Cucco, P. Lionello, D. Zanchettin, A. Papa, et al. 2021. “The Prediction of Floods in Venice: Methods, Models and Uncertainty.” Natural Hazards and Earth System Sciences 21 (8): 2679–2704. doi: 10.5194/Nhess-21-2679-2021.
- U.S. Environmental Protection Agency. 2012. “User Guide for MOVES2010b.” Accessed 6 July 2022. http://www.epa.gov/otaq/models/moves/documents/420b12001b.pdf.
- Waltman, L., N. J. van Eck, T. N. Van Leeuwen, and M. S. Visser. 2013. “Some Modifications to the SNIP Journal Impact Indicator.” Journal of Informetrics 7 (2): 272–285. doi: 10.1016/J.Joi.2012.11.011.
- Wang, J., M. Chen, G. Lü, S. Yue, K. Chen, and Y. Wen. 2018. “A Study on Data Processing Services for the Operation of Geo-Analysis Models in the Open Web Environment.” Earth and Space Science 5 (12): 844–862. doi: 10.1029/2018EA000459.
- Wang, J., Y. Hong, L. Li, J. J. Gourley, S. I. Khan, K. K. Yilmaz, R. F. Adler, et al. 2011. “The Coupled Routing and Excess Storage (CREST) Distributed Hydrological Model.” Hydrological Sciences Journal 56: 84–98. doi: 10.1080/02626667.2010.543087.
- Wen, Y., M. Chen, S. Yue, P. Zheng, G. Peng, and G. Lu. 2017. “A Model-Service Deployment Strategy for Collaboratively Sharing Geo-Analysis Models in an Open Web Environment.” International Journal of Digital Earth 10 (4): 405–425. doi: 10.1080/17538947.2015.1131340.
- Wilkinson, M. D., M. Dumontier, I. J. Aalbersberg, G. Appleton, M. Axton, A. Baak, N. Blomberg, et al. 2016. “The FAIR Guiding Principles for Scientific Data Management and Stewardship.” Scientific data 3: 160018. doi: 10.1038/sdata.2016.18.
- Winkelmann, R., M. A. Martin, M. Haseloff, T. Albrecht, E. Bueler, C. Khroulev, and A. Levermann. 2011. “The Potsdam Parallel Ice Sheet Model (PISM-PIK)-Part 1: Model description.” The Cryosphere 5: 715–726. doi: 10.5194/tc-5-715-2011.
- Wood, W. B. 1994. “Geo-Analysis for the Next Century: New Data and Tools for Sustainable Development.” In Chap. 10 in Reordering the World, edited by G. J. Demko and W. B. Wood, 192–205. New York: Routledge.
- Wu, Q. 2010. “The W-Index: A Measure to Assess Scientific Impact by Focusing on Widely Cited Papers.” Journal of the American Society for Information Science and Technology 61 (3): 609–614. doi: 10.1002/Asi.21276.
- Yue, S., M. Chen, Y. Wen, and G. Lu. 2016. “Service-Oriented Model-Encapsulation Strategy for Sharing and Integrating Heterogeneous Geo-Analysis Models in an Open Web Environment.” ISPRS Journal of Photogrammetry and Remote Sensing 114: 258–273. doi: 10.1016/J.Isprsjprs.2015.11.002.
- Zeng, N., J. D. Neelin, and C. Chou. 2000. “A Quasi-Equilibrium Tropical Circulation Model—Implementation and Simulation.” Journal of the Atmospheric Sciences 57 (11): 1767–1796. doi: 10.1175/1520-0469(2000)057<1767:AQETCM>2.0.CO;2.
- Zhang, C. T. 2009. “The E-Index, Complementing the H-Index for Excess Citations.” Plos One 4 (5): E5429. doi: 10.1371/Journal.Pone.0005429.
- Zhang, F., M. Chen, D. P. Ames, C. Shen, S. Yue, Y. Wen, and G. Lü. 2019. “Design and Development of a Service-Oriented Wrapper System for Sharing and Reusing Distributed Geoanalysis Models on the Web.” Environmental Modelling & Software 111: 498–509. doi: 10.1016/J.Envsoft.2018.11.002.
- Zhang, F., M. Chen, A. J. Kettner, D. P. Ames, Q. Harpham, S. Yue, Y. Wen, and G. Lü. 2021. “Interoperability Engine Design for Model Sharing and Reuse Among OpenMI, BMI And OpenGMS-IS Model Standards.” Environmental Modelling & Software 144: 105164. doi: 10.1016/j.envsoft.2021.105164.
- Zhang, Z., X. Liu, and S. Yang. 2009. “A Note on the 1-9 Scale and Index Scale in AHP.” International Conference on Multiple Criteria Decision Making 35: 630–634. doi: 10.1007/978-3-642-02298-2_92.
- Zhao, S. X., and J. Li. 2015. “Citation Peaks in Modern Science: 1900–2010.” Current Science 109 (9): 1523–1525.
- Zhu, A. X., F. H. Zhao, P. Liang, and C. Z. Qin. 2021. “Next Generation of GIS: Must be Easy.” Annals of GIS 27 (1): 71–86. doi: 10.1080/19475683.2020.1766563.