
 ?Mathematical formulae have been encoded as MathML and are displayed in this HTML version using MathJax in order to improve their display. Uncheck the box to turn MathJax off. This feature requires Javascript. Click on a formula to zoom.
ABSTRACT
With the development of satellite remote sensing technology, image classification task, as the basis of remote sensing data interpretation, has received wide attention to improving accuracy and robustness. At the same time, in-depth learning technology has been widely used in remote sensing and has a far-reaching impact. Since the existing image classification methods ignore the feature that the general image semantics are the same as the semantics of a single pixel, this paper presents an algorithm that uses the semantics of an image to achieve high-precision image classification. Based on the idea of partial substitution for global, this algorithm designs a split result voting mechanism and builds a Vgg-Vote network model. This mechanism votes on the semantically segmented result of an image and uses the maximum filtering function to select the category containing the most significant number of pixels as the prediction category of the image. Experiments on UC Merced Land-User complete datasets and five types of incomplete datasets with varying degrees of interference, including noise, data occlusion and loss, show that the Vote mechanism dramatically improves the classification accuracy, robustness and anti-jamming capability of Vgg-Vote.
1. Introduction
In recent years, image classification has been an important research hotspot in the field of computer vision. Its purpose is to assign different kinds of labels to images according to scene semantics, and it is widely used in unmanned driving (Qayyum, Malik, Saad Citation2019), face recognition (Wu et al. Citation2021), and medical assistant diagnosis (Manzo and Pellino Citation2021). With the development of satellite remote sensing imaging technology, the acquisition of remote sensing images becomes more convenient and fast, and the accuracy and automation of image classification are increasingly required in the field of remote sensing (Cheng et al. Citation2018). Because remote sensing images contain rich texture information and spatial semantic information, scene classification of remote sensing images plays an increasingly important role in smart agriculture (Li et al. Citation2018), disaster detection, and urban planning (Zhou et al. Citation2020), which improves the efficiency and accuracy of remote sensing data interpretation.
Traditional remote sensing image classification is mainly based on low-level features such as color (Van De Sande, Gevers, and Snoek Citation2010), direction gradient (Zhou et al. Citation2013), density feature (Zhang et al. Citation2014), feature point (Zhu et al. Citation2012), and texture in the transform domain (Qian et al. Citation2014). Such methods need to be based on prior knowledge, and the degree of automation and classification accuracy are low. Remote sensing image classification methods based on statistical analysis include neighborhood classification algorithm (KNN[Zhao et al. Citation2021]), decision tree algorithm (Zhang et al. Citation2022), support vector machine (Qu et al. Citation2022), etc. These methods are difficult to show a good classification effect in the face of complex data (Li et al. Citation2005). Image classification based on deep learning (Zheng et al. Citation2019) can mine deep-seated features of images, and combine feature extractors with classifiers to form an end-to-end network model, so as to obtain higher classification accuracy and automation level. Classical network models include AlexNet (Han et al. Citation2017), VggNet (Simonyan and Zisserman Citation2014), ResNet (He et al. Citation2016). When facing image classification, these networks show excellent hierarchical feature learning ability and mobility far better than traditional classification methods (Tian et al. Citation2019). Researchers have improved the classical network and made further research on remote sensing image classification. Qiao et al. (Citation2021) improved ResNet and applied it to the classification of remote sensing images and established an attention module in the two dimensions of channel and space to effectively classify remote sensing images. The ResNeXt proposed by Xie et al. (Citation2017) use a layered convolution to replace the standard convolution, which improves the network performance without significantly increasing the order of parameters. Gómez and Meoni (Citation2021) Proposed an MSMatch network based on small sample data, which greatly reduces the demand for labeled data and achieves good classification results. Li et al.(Citation2021) found that two factors, sparse connectivity and dynamic activation function, are effective to improve the accuracy, so arrive at a family of networks, named MicroNet. MobileNet V3, proposed by Howard et al.(Citation2019), uses a network search algorithm and introduces the SE module with H-Swish activation function.
The existing classification network model ignores the same characteristics of the whole image semantics and the semantics of a single image pixel, resulting in low classification accuracy and poor robustness to external interference (Aksoy, Ravanbakhsh, and Demir Citation2020). This paper uses the same characteristics of the whole image semantics and the semantics of a single pixel of the image, designs the screening voting mechanism of recognition results, and integrates it with the Vgg network to build a Vgg-Vote network model. Through the comparative experiment on UC merged land use public dataset and incomplete dataset, and taking Vgg, MicroNet, MobileNet V3 and other networks as the comparison group, the experimental results prove that the voting mechanism improves the accuracy of image classification tasks and the robustness to external interference.
2. Network principle and design
In this paper, the semantic category of a single image and the exact characteristics of each pixel semantic category are used as a priori knowledge to construct a voting mechanism. The mechanism is integrated with Vgg 16 network to design a Vgg-Vote network model for image high-precision classification. Vgg-Vote network model takes a Fully Convolutional Network (Evan, Long, Darrelll Citation2017) and voting mechanism as the main body and uses the cross-layer connection to fuse global and local information to realize high-precision image classification. The structure of the Vgg-Vote network model is shown in .
Figure 1. Vgg-Vote network structure.
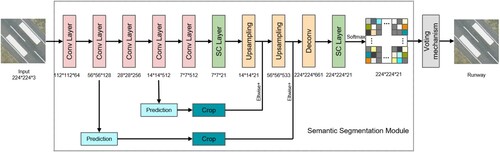
As can be seen from , the Vgg-Vote network model is mainly composed of an image semantic segmentation module and a category voting mechanism module. The image semantic segmentation module first extracts multi-dimensional features through five convolution layers using the downsampling method, then uses deconvolution to restore the size of the feature image to the size of the original input feature image, and finally uses the 1 * 1 single convolution layer to realize the pixel by pixel semantic category judgment of the input image. The voting mechanism counts the semantic categories of all pixels, calculates the number of pixels contained in each semantic category, and takes the pixel category with the most significant number as the final prediction category of the network model for the input image.
2.1. Image semantic segmentation module
The image semantic segmentation module of the Vgg-Vote network model is mainly composed of a lower sampling layer, cross-layer connection structure, upsampling layer and pixel-level semantic category prediction layer. The network structure is shown in .
Figure 2. Semantic segmentation module.
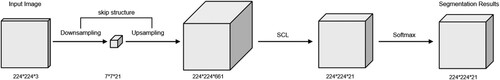
The lower sampling layer is composed of five convolution modules. Each convolution module includes three convolution structures and a maximum pooling structure. Different convolution modules extract the features of the feature map in different dimensions through convolution and pooling, which will also reduce the size of the feature map. The function of the deconvolution layer is mainly to restore the size of the characteristic image to the size of the original image. The deconvolution formula is as follows.
(1)
(1)
(2)
(2)
(3)
(3)
Among them,represents the small-size feature map to be sampled, and
is reshaped to obtain
.
represents transposed convolution matrix, which is the core parameter matrix of deconvolution and is constantly updated in the process of model training. After remodelling
,
is obtained, the large-scale feature map obtained after deconvolution.
In addition, to facilitate the extraction of global features and avoid the loss of detailed features, the semantic segmentation module adopts the strategy of cross-layer connection of different dimensional features. The same size can be found in the feature maps during process of the upsampling and downsampling. Therefore, the feature map features extracted by the second convolution module and the feature map features extracted by the second deconvolution module are feature stitched. The feature map features extracted by the fourth convolution module and the feature map features extracted by the first deconvolution module are spliced together to restore more detailed features of the original feature map in the process of upsampling. Through the skip structure connection of the features of different depth layers, the local information and global information are fused, which greatly retains the characteristics of the input feature map and ensures the performance of the model.
The function of 1 * 1 single convolution layer is to predict the category pixel by pixel. While keeping the size of the feature map unchanged, the convolution layer acts as a classifier to output each pixel in the feature map to channel 21, which corresponds to the prediction probability of the image category to which each pixel belongs. Finally, the category probability eigenvector of each pixel is normalized by the Softmax function. The sum of all vector values of the probability matrix is 1. The Softmax function formula is as follows.
(4)
(4) Where represents the prediction result of the j-th category, which is expressed in the form of numbers. It should be pointed out here that the semantic segmentation module can correctly predict most of the pixel categories represented by the scene in the image, laying the foundation for the voting mechanism to play a role.
2.2. Image semantic segmentation module
The Vote mechanism uses the idea of replacing the global with the local one, considering that the scene category of a single image is the same as the semantic category of each pixel point, and fuses this prior knowledge into a deep neural network, which improves the accuracy of scene classification of an image. The Vote mechanism works as shown in .
Figure 3. Vote mechanism structure.
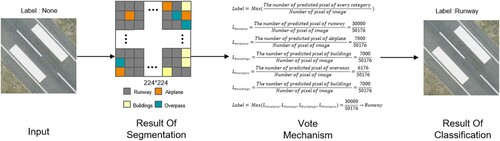
The semantic segmentation module of Vgg-Vote judges the category of each pixel in the image according to its trained feature parameters, obtains the category information of each pixel, and transmits the information to the voting mechanism. Since the Semantic Segmentation Module can theoretically predict most of the pixels contained in a scene as true categories, the idea of Vote mechanism replacing global with local is possible.The voting mechanism counts the number of pixels in each category by the proportion function (formula 5). It uses the maximum value filtering function (formula 6) to select the category with the largest number of pixels as the final prediction category (K) of the image. The formula is as follows.
(5)
(5)
(6)
(6) Where n is the total number of categories, and
represents the number of pixels whose category is label-i.
The advantage of the Vote mechanism is that it uses a local instead of global strategy, taking into account that the categories of images are the same as the semantic categories of the effective pixels in the image, and the network model is not required to accurately judge each pixel in the image to achieve the correct image classification. When the correct number of pixels is more than 50% in the result of the semantics segmentation module, the Vote mechanism will use the correct category as the category prediction of the image as a whole, ignoring the remaining misjudged pixel points, to achieve the correct classification of the image. Theoretically, with the assistance of the Vote mechanism, when the average accuracy of the Vgg-Vote semantics segmentation module exceeds 50%, the image classification accuracy of Vgg-Vote can reach 100%, which significantly improves the robustness of the network.
2.3. Accuracy evaluation index
Accuracy, Precision, Recall, and F1-score are often used as precision indicators in multi-class tasks for in-depth learning. In order to evaluate the performance of the classification model as a whole from the classification of all categories, a comprehensive set of evaluation indicators is used to evaluate the model. The macro method is used to obtain Macro-Precision, Macro-Recall and Maco-F1-score. The macro method calculates the arithmetic mean for different categories of indicators with the following formula.
(7)
(7) Among them, accuracy (A) represents the proportion of samples that are predicted correctly to the total number of samples,
represents the precision of a certain type of sample, TP represents the number of samples that are correctly determined to be positive, FP represents the number of samples that are incorrectly determined to be positive, FN represents the number of samples that are incorrectly determined to be negative. K represents the total number of categories of samples.
(8)
(8)
(9)
(9)
(10)
(10)
Precision (P) represents the ratio of the number of correctly predicted positive samples to the total number of predicted positive samples, and represents the precision of the i-th sample. Recall (R) represents the ratio of the number of samples correctly predicted to be positive samples to the total number of actually positive samples and, the
represents the recall of the i-th sample.. F1 score is an index used to measure the accuracy of two classification models in statistics, which considers the accuracy and recall of classification models.
3. Experimental results and analysis
This article uses the UCMerced_LandUse dataset to evaluate the accuracy and robustness of Vgg-Vote networks. The environment of the image classification experiment in this paper: Win10 system, Python 3.7, CUDA 10.1, CuDnn 7.6.5, uses PyTorch 1.7.1 deep learning framework. In the experiment of image classification, the batch of Vgg-Vote network training and testing is set to 16; Epoch is set to 128; The ratio of the training set to test set is 7:3; Adam optimizer is adopted; The learning rate is set to 0.001; The learning rate decay rate is set to 0.7.
3.1. Overview of dataset
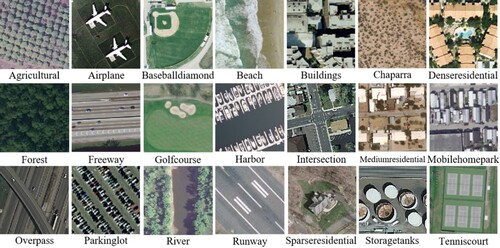
In this paper, the dataset used to verify the accuracy of the Vgg-Vote network is UCMerced_LandUse public dataset. All images are extracted from the USGS National Map Urban Area Imagery series, including 21 types of land use image data such as agriculture, airplanes, buildings, forests, highways, etc. Each type of image data is 100 pieces, and the size of each image is 256 × 256 pixels. The pixel resolution of public domain images is 1 foot. The dataset is shown in .
Figure 4. UCMerced LandUse dataset.
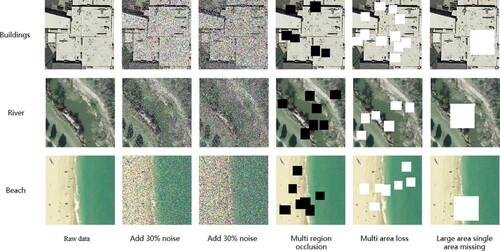
Due to the easy interference in the acquisition process of remote sensing images, there are noise, occlusion, and data loss in remote sensing images. In view of this, this paper discusses UCMerced_Landuse public dataset adds different ways of external interference, mainly including the following five ways: randomly adding 30% noise to the image; Randomly adding 50% noise to the image; Block the image in multiple small areas; Multiple small areas of the image are lost; In order to facilitate visualization, the occluded part is represented by pure black area, and the missing part is represented by the pure white area. The comparison effect between the finished dataset and the original dataset is shown in :
Figure 5. The incomplete dataset.
Therefore, the data set used in this experiment is UC Merced_LandUse Complete Dataset and UC Merced_LandUses incomplete dataset with Five Interferences whose characteristics are summarized in .
Table 1. Dataset summary table.
3.2. Analysis of experimental results
This paper uses the original dataset and five kinds of incomplete datasets to carry out classification experiments, using the Vgg-Vote network as the experimental group and Vgg, MicroNet and MobileNet V3 as the control group, to verify the model accuracy and robustness of the Vgg-Vote network. The difference between Vgg-Vote and Vgg is whether or not the Vote mechanism is used, so comparative experiments on all six datasets can be considered ablation studies. For easy comparison of the results, the red curve represents the Vgg-Vote network, the green curve represents the Vgg network, the purple represents the MicroNet, and the orange represents the MoblieNet V3.
3.2.1. verification of model accuracy
This section uses the complete dataset to compare the classification accuracy of Vgg-Vote, Vgg, MicroNet and MobileNet V3. The comparison between Vgg-Vote and Vgg on the complete dataset is a control variable experiment with the Vote mechanism as a variable, so it can be used as an ablation study to prove that the Vote mechanism can improve the classification accuracy of the model. The classification accuracy change diagram of the above network on the complete dataset is shown in :
Figure 6. Variation diagram of accuracy of different networks in the complete dataset.
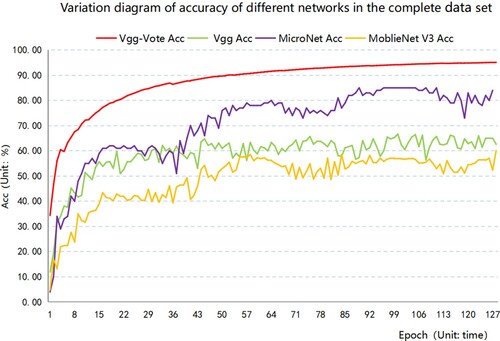
The accuracy of the Vgg-Vote network keeps increasing, and the accuracy of the Vgg-Vote network is always higher than other networks during the whole training process. When the number of iterations reaches 128, the accuracy reaches the highest, which is 95.12%; Although the accuracy of networks such as Vgg, MicroNet and MobileNet V3 is also increasing, the rise is gradually slower than that of Vgg-Vote. The optimal accuracy table for each of the above networks on the original dataset is shown in .
Table 2. Comparison of classification indices for different networks on complete datasets.
In the complete data set, the optimal accuracy of the Vgg-Vote network is up to 95.12%, and the optimal accuracy of the Vgg network is only 66.67%, 28.45% lower than Vgg-Vote, which fully demonstrates that the Vote mechanism can significantly improve the classification accuracy of Vgg-Vote network. The optimal classification accuracy of MicroNet and MobleNet V3 is 85.28% and 57.49%, respectively, which is 9.84% and 37.63% lower than that of the Vgg-Vote network. According to Macro-Recall, Macro-Precision and Macro-F1, Vgg-Vote also performs better than the other three networks, which proves that the Vgg-Vote network performs better in classification tasks.
In summary, the Vgg-Vote network model built by introducing the Vote mechanism into the Vgg network shows better recognition ability, and higher classification accuracy than the existing mainstream image scene classification network.
3.2.2. Verification of model robustness
Due to the weather, equipment itself, and other reasons, remote sensing image acquisition is prone to noise, data loss, occlusion, and other interference, resulting in the classification accuracy of the classification network being affected by varying degrees. Therefore, this section compares the classification accuracy of Vgg-Vote, Vgg, MicroNet, and MobileNet V3 on five types of incomplete datasets and then verifies the robustness of the Vgg-Vote network model to common disturbances such as noise, data loss, and occlusion.The comparison of Vgg-Vote and Vgg on five incomplete datasets uses the control variable method with the Vote mechanism as a variable. Hence, ablation research proves that the Vote mechanism can enhance the robustness of the model.
3.2.2.1. Comparison of results under noise interference
Noise is common in images, and the noise volume is usually different, so this paper adds 30% and 50% noise to the dataset and tests it on four networks, such as Vgg-Vote, to prove the robustness of Vgg-Vote to noise. Put the results of two levels of noise interference together for comparison. The classification accuracy curve of each network in the two groups of experiments is shown in :
Figure 7. Variation diagram of accuracy of each network under 30% and 50% noise interference.
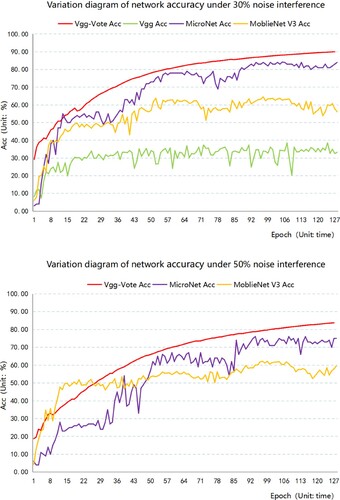
The optimal accuracy of Vgg is only 38.52% and 4.29% under both noise disturbances, and the network failure of Vgg on the 50% noise disturbance dataset is not represented in . The optimal accuracy of the Vgg-Vote network is 90.05% under the interference of 30% normal noise. The optimal accuracy of MicroNet and MobleNet V3 is only 84.21%, 65.54%. The optimal accuracy of the Vgg-Vote network is 51.53%, 5.84%, and 25.51% higher than that of the Vgg network, MicroNet and MobleNet V3, respectively. The optimal accuracy of the Vgg-Vote network is 83.82% under the interference of 50% severe noise, while that of MicroNet and MobleNet V3 is only 76.03%, 62.16%. Compared with Vgg, MicroNet and MobleNet V3, the optimal accuracy of the Vgg-Vote network is improved by 79.53%, 7.79%, and 21.66%, respectively. According to accuracy indicators such as Macro-Recall, Macro-Precision and Macro-F1, Vgg-Vote performs better than the other three comparison networks.
The above experimental results show that the classification accuracy of the Vgg-Vote network is still at a high level in the case of different noise interference. Compared with the other three networks, the Vgg-Vote network also has stronger robustness to noise, which proves that the voting mechanism greatly enhances the robustness of the Vgg-Vote network model in the case of noise interference.
3.2.2.2. Comparison of results under occlusion and random area loss interference
Due to the mutual occlusion and loss of geometric elements in the scene during image data acquisition, local features are lost, and global features are changed. Therefore, this paper deals with occlusion and random area loss of data, including two cases: one is large area loss in a single area, and the other is slight area loss in multiple areas. The former will cause global feature changes and partial local feature changes; The latter will lead to local feature changes in multiple regions and then affect the accuracy of global features, thus affecting the integrity of the extracted features to varying degrees. Through the comparative experiment with the control variable method, the accuracy change of each network in the case of data loss is shown in :
Figure 8. Accuracy variation diagram of each network with data loss interference.
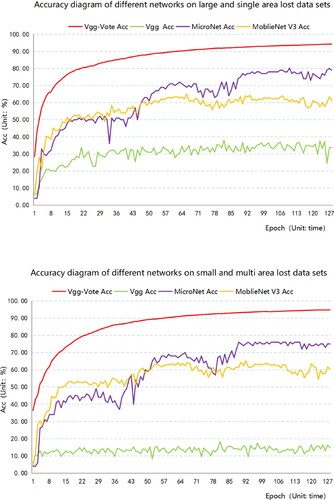
Through the experimental results, it can be found that the impact of small area loss in multiple areas is more significant because the classification accuracy of the Vgg network under the interference of small area loss in multiple areas is only 3.33%. The failure phenomenon occurs again, indicating that the network has poor robustness to noise, so it is not shown in .
The optimal accuracy of the Vgg-Vote network can reach 94.30% under the interference of large area loss in a single area. The optimal accuracy of Vgg, MicroNet and MobleNet V3 is only 37.86%, 80.24%, and 65.02%. The optimal accuracy of the Vgg-Vote network is 56.44%, 14.06%, and 29.28% higher than that of Vgg, MicroNet and MobleNet V3, respectively. Under the interference of small area loss in multiple regions, the optimal accuracy of the Vgg-Vote network can reach 94.80%. The optimal accuracy of Vgg, MicroNet and MobleNet V3 is only 18.33%, 76.33%, and 65.18%. The optimal accuracy of the Vgg-Vote network is 76.48%, 76.35%, and 65.18% higher than that of Vgg, MicroNet and MobleNet V3, respectively. According to Macro-Recall, Macro-Precision and Macro-F1, the Vgg-Vote table is still better than the three comparison networks. From the above results, it is known that the Vgg-Vote network is robust to data loss. ()
Table 3. Comparison of classification indexes of different networks in 30% noise dataset.
Table 4. Comparison of classification indexes of different networks in 50% noise dataset.
Table 5. Comparison of classification indexes of different networks on large and single area lost dataset.
Table 6. Comparison of classification indexes of different networks on small and multi area lost dataset.
Table 7. Comparison of classification indexes of different networks on small and multi area lost dataset.
Because the occlusion between scene geometry elements is easy to occur during image acquisition, this paper also obscures the dataset, adds 6–10 random obscure areas to each image data, and performs classification experiments on this dataset. The accuracy change curve of each network is shown in .
Figure 9. Accuracy variation diagram of each network with occlusion interference.
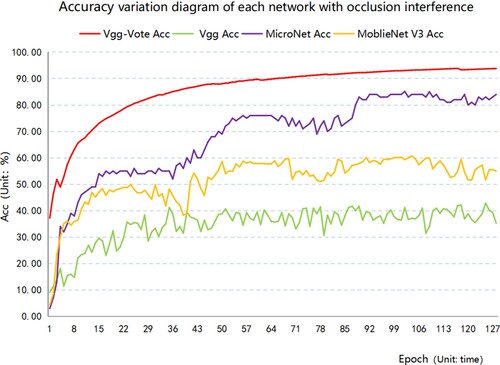
Under the interference of regional occlusion, the optimal accuracy of Vgg, MicroNet and MobleNet V3 is only 42.86%, 85.13%, and 60.73%. The optimal accuracy of the Vgg-Vote network can reach 93.83%, increasing by 50.97%, 8.70%, and 33.10% year on year. In addition, the curve graph shows that the accuracy of the Vgg-Vote network in the 25th epoch classification has reached 80%, while the accuracy of Vgg and MobleNet V3 is consistently below 80%. The accuracy of the Vgg-Vote network in the 70th epoch classification is already 90%, while that of MicroNet is always less than 90%. According to Macro-Recall, Macro-Precision and Macro-F1, the Vgg-Vote table is better than the three comparison networks. The above results show that with the Vote mechanism, the Vgg-Vote network can achieve higher accuracy with fewer iterations, which is more conducive to avoiding the occurrence of over-fitting phenomena and is robust to occlusion interference.
It can be seen from the above results that in the case of regional loss, the accuracy of the Vgg-Vote network is almost the same as that of the complete dataset, which proves that the network has strong resistance to regional loss. Vgg and MobileNet V3 have weak resistance to occlusion interference. In contrast, Micronet has slightly stronger resistance to occlusion interference, while the classification accuracy of the Vgg-Vote network is almost not affected by occlusion interference, and there is little difference between the accuracy under the complete dataset. To sum up, it shows that the voting mechanism greatly enhances the robustness of the Vgg-Vote network model in the case of data loss and data occlusion.
This section also analyzes the classification accuracy of each network on five types of incomplete datasets. The comparison experimental accuracy results are shown in :
Table 8. Comparison of classification accuracy of each network on incomplete dataset.
In , each comparative experiment adopts the strict control variable method, and the experimental environment is consistent. It can be seen from that for a lot of noise interference and large area loss interference, the Vgg network has failed; In the case of five kinds of incomplete data, the accuracy of the Vgg-Vote network is at a high level. Except for solid noise interference, the accuracy is 83.82%, and the classification accuracy under other interference is more than 90%. Compared with Vgg, the accuracy of the Vgg-Vote network is improved by about 50% to 80%, 5% to 15% compared with MicroNet, and 20% to 30% compared with MobileNet v3. The above experimental results show that the voting machine enhances the robustness of the Vgg-Vote network model under the interference of noise, data occlusion, and data loss.
3.2.3. Verification of the migration capability of voite mechanism
Because the pre-training weight parameter is a common feature derived from a large number of public datasets, it makes the model less burdensome to learn specific tasks. As a result, network migration is often used, but network models using pre-training weight parameters may not fit well in the face of new data, resulting in poor migration ability. To further verify the migration capability of the Vote mechanism, this section compares the classification accuracy of Vgg-Vote and Vgg using pre-training weight parameters on five types of incomplete datasets. The experimental results are compared as shown in :
Table 9. Comparison of classification accuracy between Vgg(pre) and Vgg-Vote on incomplete datasets.
In , the accuracy of Vgg-Vote loaded with vote module on five types of incomplete datasets is 90.05%, 83.82%, 93.83%, 94.30%, and 94.80%, respectively. In contrast, the accuracy after using pre-training weight parameters is only 80.24%, 73.81%, 80.48%, 83.81%, and 81.90%, with a year-on-year increase of 9.81%, 10.01%, 13.35%, 10.49%, and 12.90%. When remote sensing images are disturbed by noise, data occlusion, and data loss, Vgg-Vote not only has a classification accuracy much higher than Vgg but also has a higher classification accuracy even when Vgg uses pre-training weight parameters. The experimental results show that the voting mechanism enhances the migration ability of the Vgg-Vote network so that the classification network still maintains high classification accuracy on the new dataset.
4. Conclusion
Aiming at the problem that the existing remote sensing image classification methods ignore the characteristics that the overall semantic category of the image is the same as the semantic category of a single pixel, this paper designs a recognition result screening voting mechanism and integrates this mechanism with Vgg network to build a Vgg-Vote network model, and then verifies the accuracy and robustness of the Vgg-Vote network model.
In the classification experiment on the original dataset, the classification accuracy of Vgg-Vote is improved by 28.45%, 9.84%, and 37.63%, respectively, compared with Vgg, MicroNet, MobileNet V3, and other networks, indicating that the voting mechanism dramatically improves the accuracy of Vgg-Vote network model in classification tasks. In the five kinds of comparative experiments in which noise, data occlusion, and loss are introduced, the accuracy of the Vgg-Vote network is improved by about 50% to 80% compared with Vgg, 5% to 20% compared with MicroNet, and 20% to 30% compared with mobileNet V3, indicating that voting mechanism greatly enhances the robustness of Vgg-Vote network model under the interference of noise, data occlusion, data loss and so on. In the migration ability verification experiment of the voting mechanism, the classification accuracy of Vgg-Vote on five types of interference datasets is about 10% higher than that of Vgg, indicating that the voting mechanism enhances the migration ability of the Vgg-Vote network.
In the follow-up research, we will consider the migration of the Vgg-Vote network, apply the voting mechanism to the sound spectrum, three-dimensional point cloud, and other data, and verify the mobility and universality of the voting mechanism. At the same time, we try to verify the possibility of applying the Vgg-Vote network in the field of target detection and target recognition.
Disclosure statement
No potential conflict of interest was reported by the author(s).
Data availability statement
The data that support the findings of this study were derived from the following resources available in the public domain: [UC Merced Land-Use, http://weegee.vision.ucmerced.edu/datasets/landuse.html]
Additional information
Funding
References
- Aksoy, Kerem, Mahdyar Ravanbakhsh, and Begüm Demir. 2020. Multi-Label Noise Robust Collaborative Learning Model for Remote Sensing Image Classification.” arXiv preprint arXiv: 2012.10715.
- Cheng, Gong, Zhenping Li, Junwei Han, Xiwen Yao, and Lei Guo. 2018. “Exploring Hierarchical Convolutional Features for Hyperspectral Image Classification.” IEEE Transactions on Geoscience and Remote Sensing 56 (11): 6712–6722. doi:10.1109/TGRS.2018.2841823.
- Evan, Shelhamer, Jonathan Long, and Trevor Darrelll. 2017. “Fully Convolutional Networks for Semantic Segmentation.” IEEE Transactions on Pattern Analysis and Machine Intelligence 39 (4): 640–651. doi:10.1109/TPAMI.2016.2572683.
- Gómez, P., and G. Meoni. 2021. “MSMatch: Semi-Supervised Multispectral Scene Classification with Few Labels.” IEEE Journal of Selected Topics in Applied Earth Observations and Remote Sensing 14: 11643–11654. doi:10.1109/JSTARS.2021.3126082.
- Han, Xiaobing, Yanfei Zhong, Liqin Cao, and Zhang Liangpei. 2017. “Pre-Trained AlexNet Architecture with Pyramid Pooling and Supervision for High Spatial Resolution Remote Sensing Image Scene Classification.” Remote Sensing 9 (8): 848. doi:10.3390/rs9080848.
- He, Kaiming, Xiangyu Zhang, Shaoqing Ren, and Jian Sun. 2016. Deep residual learning for image recognition” Proceedings of the IEEE conference on computer vision and pattern recognition: 770–778.
- Howard, Andrew, Mark Sandler, Grace Chu, Liang-Chieh Chen, Bo Chen, Mingxing Tan, Weijun Wang, et al. 2019. “Searching for MobileNetV3.” Proceedings of the IEEE/CVF International Conference on Computer Vision (ICCV), 1314–1324.
- Li, Yunsheng, Yinpeng Chen, Xiyang Dai, Dongdong Chen, Mengchen Liu, Lu Yuan, Zicheng Liu, Lei Zhang, and Nuno Vasconcelos. 2021. “MicroNet: Improving Image Recognition with Extremely Low FLOPs.” Proceedings of the IEEE/CVF International Conference on Computer Vision (ICCV), 468–477. doi:10.48550/arXiv.2108.05894.
- Li, Anqi, Li Ma, Helong Yu, and Hanbo Zhang. 2018. “Application of Improved u-net Algorithm in Classification of Typical Crops in Remote Sensing Images.” Infrared and Laser Engineering 51 (9): 20210868-1–20210868-7.
- Li, Shihua, Jinliang Wang, Yan Bi, Yao Chen, Miaoyuan Zhu, Shuai Yang, and Jia Zhu. 2005. “A Review of Remote Sensing Image Classification Methods.” Remote Sensing of Land and Resources 2 (1): r6. doi:10.3969/j.issn.1001-070X.2005.02.001.
- Manzo, Mario, and Simone Pellino. 2021. “Fighting Together Against the Pandemic: Learning Multiple Models on Tomography Images for COVID-19 Diagnosis.” AI 2 (2): 261–273. doi:10.3390/ai2020016.
- Qayyum, A., A. S. Malik, and N. M. Saad. 2019. “Image Classification Based on Sparse-Coded Features Using Sparse Coding Technique for Aerial Imagery: A Hybrid Dictionary Approach.” Neural Computing and Applications 31: 3587–3607. doi:10.1007/s00521-017-3300-5.
- Qian, Xueming, Danping Guo, Xingsong Hou, Zhi Li, Huan Wang, Guizhong Liu, and Zhe Wang. 2014. “HWVP: Hierarchical Wavelet Packet Descriptors and Their Applications in Scene Categorization and Semantic Concept Retrieval.” Multimedia Tools and Applications 69 (3): 897–920. doi:10.1007/s11042-012-1151-8.
- Qiao, Xingxing, Wenzao Shi, Wanxi Liu, Huiyao Lin, Daiyi He, and Lei Wang. 2021. “Remote Sensing Image Scene Classification Based on RESNET Double Attention Mechanism.” Computer System Application 30 (8): 243–248.
- Qu, Zhen, L. I. Kunting, and Zhixi Feng. 2022. “Remote Sensing Image Scene Classification Based on Effective Channel Attention.” Computer Application 42 (5): 1431–1439. doi:10.11772/j.issn.1001-9081.2021030464.
- Simonyan, Karen, and Andrew Zisserman. 2014. Very Deep Convolutional Networks for Large-Scale Image Recognition.” arXiv preprint arXiv:1409.1556.
- Tian, X., L. Wang, and Q. Ding. 2019. “Overview of Image Semantic Segmentation Methods Based on Deep Learning.” Journal of Software 30 (2): 440–468. doi:10.13328/j.cnki.jos.005659.
- Van De Sande, Koen, Theo Gevers, and Cees Snoek. 2010. “Evaluating Color de-Scriptors for Object and Scene Recognition.” IEEE Transactions on Pattern Analysis and Machine Intelligence 32 (9): 1582–1596. doi:10.1109/TPAMI.2009.154.
- Wu, F., X. Y. Jing, and Y. Feng. 2021. “Spectrum-aware Discriminative Deep Feature Learning for Multi-Spectral Face Recognition.” Pattern Recognition 111 (2): 107632. doi:10.1016/j.patcog.2020.107632.
- Xie, S., R. Girshick, P. Dollár, Z. Tu, and K. He. 2017. “Aggregated Residual Transformations for Deep Neural Networks.” IEEE Conference on Computer Vision and Pattern Recognition, 5987–5995. doi:10.1109/cvpr.2017.634.
- Zhang, Fan, Bo Du, and Liangpei Zhang. 2014. “Saliency-guided Unsupervised Feature Learning for Scene Classification.” IEEE Transactions on Geoscience and Remote Sensing 53 (4): 2175–2184. doi:10.1109/TGRS.2014.2357078.
- Zhang, Nina, Ke Zhang, Yunping Li, Xi Li, and Tao Liu. 2022. “Research on UAV Multispectral Remote Sensing Machine Learning Classification of Vegetation Types in Typical Humid Mountainous Areas in Southern China.” Remote Sensing Technology and Application, 1–10.
- Zhao, Jinling, Lei Hu, Hao Yan, Guomin Chu, Yan Fang, and Linsheng Huang. 2021. “Hyperspectral Image Classification Method Combining Local Binary Mode and k-Nearest Neighbor Algorithm.” Journal of Infrared and Millimeter Wave 40 (3): 400–412. doi:10.11972/j.issn.1001-9014.2021.03.017.
- Zheng, Yuanpan, Guangyang Li, and Ye Li. 2019. “A Survey of the Application of Deep Learning in Image Recognition.” Computer Engineering and Application 55 (12): 20–36. doi:10.3778/j.issn.1002-8331.1903-0031.
- Zhou, Li, DeWen Hu, and ZongTan Zhou. 2013. “Scene Recognition Combining Structural and Textural Features.” Science China Information Sciences 56 (7): 1–14.
- Zhou, Wen, Dongping Ming, and Xianwei Lv. 2020. “SO-CNN Based Urban Functional Zone Fine Division with VHR Remote Sensing Image.” Remote Sensing of Environment 236 (1): 111458–111478. doi:10.1016/j.rse.2019.111458.
- Zhu, Xufeng, Caiwen Ma, Bo Liu, and Xiaoqian Cao. 2012. “Target Classification Using SIFT Sequence Scale Invariants.” Journal of Systems Engineering and Electronics 23 (5): 633–639. doi:10.1109/JSEE.2012.00079.