
 ?Mathematical formulae have been encoded as MathML and are displayed in this HTML version using MathJax in order to improve their display. Uncheck the box to turn MathJax off. This feature requires Javascript. Click on a formula to zoom.
ABSTRACT
Significant areas of native forest in Kalimantan, on the island of Borneo, have been cleared for the expansion of plantations of oil palm and rubber. In this study multisource remote sensing was used to develop a time series of land cover maps that distinguish native forest from plantations. Using a study area in east Kalimantan, Landsat images were combined with either ALOS PALSAR or Sentinel-1 images to map four land cover classes (native forest, oil palm plantation, rubber plantation, non-forest). Bayesian multitemporal classification was applied to increase map accuracy and maps were validated using a confusion matrix; final map overall accuracy was >90%. Over 18 years from 2000 to 2018 nearly half the native forests in the study area were converted to either non-forest or plantations of either rubber or oil palm, with the highest losses between 2015 and 2016. Trending upwards from 2008 large areas of degraded or cleared forests, mapped as non-forest, were converted to oil palm plantation. Conversion of native forests to plantation mainly occurred in lowland and wetland forest, while significant forest regrowth was detected in degraded peatland. These maps will help Indonesia with strategies and policies for balancing economic growth and conservation.
1. Introduction
Tropical forests cover approximately 45% of world forested area, account for about 60% of the global terrestrial carbon pool and play a vital role in biodiversity conservation (FAO Citation2020a; Poker and MacDicken Citation2016). Between 1990 and 2015, the area of global tropical forests declined by 10%, from 1966 million hectares to 1770 million hectares (Keenan et al. Citation2015). The countries with the largest decreases of native tropical forest area were Brazil, Indonesia, and the Democratic Republic of the Congo (Turubanova et al. Citation2018). In Indonesia, from 2000 to 2012, native forest area decreased by approximately 6.02 million hectares (Margono et al. Citation2014).
Remote sensing has been widely used to monitor global forest changes (Achard and Hansen Citation2012). The Landsat series of satellites have been used for global forest change monitoring using optical imagery for more than 40 years (Hansen et al. Citation2013). However, forest monitoring programs that have largely relied on single satellite sensors are limited in their ability to distinguish between different land cover types and to track changes in their extent. For example under certain conditions, land cover mapped using optical Landsat has limited ability to distinguish native forests, plantations and perennial crops (Curtis et al. Citation2018; Tropek et al. Citation2014). These limitations are generally due to similar spectral characteristics of these land cover types (Torbick et al. Citation2016).
Integration of multisource remote sensing data can provide additional information on surface reflectance characteristics and structural properties of land cover types. Moreover, integration of multisource remote sensing data increases temporal data density for capturing land cover in cloudy regions, characterizing seasonal variations, and in reducing uncertainty caused by variations in illumination conditions. This includes incorporating radar data, which can be used to distinguish variations in canopy structure and moisture characteristics (Bannari et al. Citation1995; Hoekman Citation1985). Furthermore, the use of radar images is essential to increase the temporal frequency of available imagery in cloudy tropical regions, further improving classification accuracy. Satellite-based synthetic aperture radar (SAR) images, such as Advanced Land Observing Satellite Phased Array type L-band Synthetic Aperture Radar (ALOS PALSAR), have been used to map global forest/non-forest areas (Shimada et al. Citation2014).
Free access to Global 25 m resolution PALSAR-2/PALSAR mosaic and forest/non-forest map and Sentinel-1 increases the data available for the system to support monitoring land cover changes (Altunel, Akturk, and Altunel Citation2020). Moreover, high-resolution SAR images such as the C band of Environmental Research Satellite (ERS) and Sentinel-1 are superior in agricultural classification (Blaes, Vanhalle, and Defourny Citation2005; Ban Citation2003; Miettinen, Liew, and Kwoh Citation2015). At the same time, free access to Sentinel-1 (10 m spatial resolution) since 2014 has also helped monitor global tree plantation development (Fagan et al. Citation2022).
Sarzynski et al. (Citation2020) integrated Landsat and ALOS-2/PALSAR-2 images for the tropical forests of Sumatra to improve discrimination between forests and oil palm plantations from 74% to 84%. A time series of ALOS-1/2 PALSAR-1/2 and Moderate Resolution Imaging Spectroradiometer (MODIS) normalized difference vegetation index (NDVI) was used to map oil palm plantations in Indonesia and Malaysia from 2001 to 2016, where a disturbance and recovery algorithm (Breaks For Additive Season and Trend – BFAST) of MODIS was applied to detect land cover change time points for the years without PALSAR data (2011–2014 and 2001–2006) (Xu et al. Citation2020; Verbesselt et al. Citation2010). ALOS PALSAR and MODIS images were also integrated to map rubber plantations in China for 2000–2010 based on a phenology-based method (Kou et al. Citation2018). However, oil palm and rubber plantations in the equatorial regions present as evergreen trees and do not exhibit a distinct seasonal variation in solar spectral reflectance characteristics (Cracknell et al. Citation2013).
A combination of multisource data such as L- and C-bands SAR images, Landsat and MODIS optical images increases near-real-time data for forest monitoring and plantation dynamics (Reiche et al. Citation2018; Dong et al. Citation2015). The integration of Landsat and Sentinel-1 imagery from 2018 was used to map the two largest in area plantation types (oil palm and rubber) in Kalimantan (Sari et al. Citation2022; Santosa, Sunkar, and Kwatrina Citation2020). Thus, integrating multisource and multitemporal remote sensing images can benefit the mapping of land cover dynamics in tropical regions for monitoring forest changes, including oil palm and rubber plantation expansion.
Indonesia’s current national forest monitoring process is based on visual interpretation (VI) of Landsat imagery, supplemented by automated digital processing (ADP) (Margono, Usman, and Sugardiman Citation2016; LAPAN Citation2014). However, technical improvements of the VI map are required due to the time-consuming and subjective nature of the process (Margono, Usman, and Sugardiman Citation2016). While improvements in the accuracy of the ADP maps is necessary, extension of this automated process to discriminate more land cover types (particularly identifying where native forest is being converted to oil palm and rubber plantations) is also critical (LAPAN Citation2014).
This study aims to improve the accuracy of Indonesia’s ADP mapping for better monitoring of native forest loss, particularly due to plantation expansion. The current study applied multitemporal processing using a Bayesian network to integrate Landsat, ALOS PALSAR, and Sentinel-1 to improve land cover maps that differentiate between native forest, non-forest, oil palm and rubber plantations for 2000–2018.
2. Materials and methods
2.1. Study area
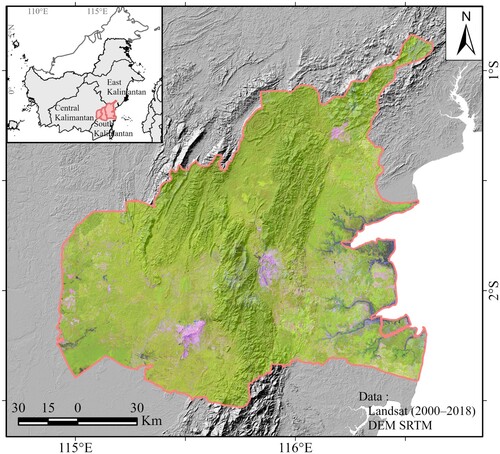
The study area of more than 1.9 million hectares is in the east of Kalimantan on the island of Borneo (). The terrain in this region is variable, with elevation ranging from sea level up to about 1550 m. The rainfall is generally more than 2000 mm. Native forests, oil palm plantations, rubber plantations, and non-forested areas such as settlements, rice fields, mixed agriculture, shrubs and grasslands, and mining, comprise the land cover in the region. Oil palm and rubber plantations have increased in this region of Indonesia since the 1990s (Ministry of Agriculture Citation2017a, Citation2017b). For example, from 2009 to 2018, oil palm and rubber plantations increased by 60% from 244,899 hectares to 391,286 hectares (Badan Pusat Statistik Citation2010a, Citation2010b, Citation2010c, Citation2010d, Citation2019a, Citation2019b, Citation2019c).
Figure 1. Location of the study area.
2.2. Data and image pre-processing
The current study used a time series multisource of optical and SAR images as follows: (1) from 2007 to 2010 using Landsat 5, Landsat 7, and ALOS PALSAR, (2) from 2015 to 2018 using Landsat 8 and Sentinel-1. These data were used to produce individual year land cover maps. All Landsat images from 2000 to 2018 were obtained from the Land Cover Change Analysis (LCCA) project (LAPAN Citation2014), and provided by the United States Geological Survey (USGS) (Citation2019). Sentinel-1 images from 2015 to 2018 were downloaded from the Alaska Satellite Facility (ASF) (Citation2019), and ALOS PALSAR images from 2007 to 2010 were downloaded from the Japan Aerospace Exploration Agency (JAXA) (Citation2019). The sensor characteristics for each instrument, pre-processing, and image details are described in the following sections.
2.2.1. Landsat
The Landsat series of satellites have imagery from several earth-observing instruments available. Specifically, we utilized Landsat 5 Thematic Mapper (TM), Landsat 7 Enhanced Thematic Mapper Plus (ETM+), and Landsat 8 Operational Land Imager (OLI) sensor imageries. These sensors all include solar reflectance spectral bands ranging from visible, thermal, and shortwave infrared (SWIR), including panchromatic bands. The pre-processing steps to produce annual mosaicked Landsat images at 25 m resolution resampled with six multispectral image bands (blue, green, red, near infrared, and shortwave infrared 1 and 2) were based on the LCCA method outlined in (LAPAN Citation2014), and include scene selection; geometric, radiometric, and terrain correction; cloud masking; and mosaicking of the individual Landsat images.
2.2.2. Sentinel-1
The study used Sentinel-1A C-band (wavelength ∼5.6 cm) SAR imagery with the dual-polarization of VV (vertical transmit, vertical receive) and VH (vertical transmit, horizontal receive). Sentinel-1A satellites can acquire data for the same ground location every 12 days. The SAR mosaic images in the current study developed from annual mosaic images, including annual mosaic images of Global 25 m ALOS PALSAR and Sentinel-1 to differentiate between dense cover trees of native forest, oil palm and rubber plantation in the tropics based on their vegetation structure. Three scenes of Sentinel-1A Interferometric Wide (IW) swath mode were acquired between January and February (wet season) in Level-1 Ground Range Detected (GRD) format in descending mode to produce annual mosaiced images. The pre-processing steps used the Sentinel Application Platform (SNAP) open-source software version 7.0.4 to produce a 25 m resampled image (to match Landsat images resampled in the LCCA) and to derive the backscatter intensity to gamma nought, in units of decibel (dB). The steps consisted of applying precise orbit acquisition information, radiometric calibration, and terrain correction.
2.2.3. Alos PALSAR
Global 25 m resolution of annual mosaics of ALOS PALSAR L-band (wavelength ∼23.5 cm) provided by JAXA were used for the study. The mosaic images were SAR Analysis Ready Data (ARD), meaning that the images had geometric, terrain and radiometric corrections applied. The ALOS PALSAR data included dual polarizations of HH (horizontal transmit, horizontal receive) and HV (horizontal transmit, vertical receive). The backscatter intensity for each of these bands was provided in gamma nought as outlined in (JAXA Citation2016).
2.3. Methodological overview
Incorporating multitemporal information into land cover classification can improve accuracy compared to maps produced using only a single-date (Symeonakis et al. Citation2012). This is because multiple images can be used to build additional confidence in class attribution. Multitemporal classification can also be used to reduce misclassification issues associated with missing data due to cloud cover, variable atmospheric conditions, and sensor and illumination angle effects (LAPAN Citation2014; Caccetta et al. Citation2016).
Bayesian networks use conditional probability to determine the likely outcome given a set of independent variables (Pollino and Henderson Citation2010; Ghahramani Citation2001). Previous studies have demonstrated Bayesian multitemporal classification to integrate Landsat and ALOS PALSAR from 2005 to 2010 (Reiche et al. Citation2015). These Bayesian networks can estimate and track land cover change, with probability conditioned on the basis of previous land cover state (Lee, Cardille, and Coe Citation2020).
The current study applies a multitemporal classification using a Bayesian network for integrating Landsat, ALOS PALSAR, and Sentinel-1 data. The classification probability for each pixel at each date in the time series is based on the Bayesian network calculation and reflects each pixel’s relative certainty for the final land cover class designation.
2.4. Individual year classification using decision trees
A method to produce land cover maps for Kalimantan for individual years, with no multi-temporal dependency, using a decision tree based on indices and image thresholds, has been outlined in our previous study (Sari et al. Citation2022). In brief, a decision tree was used to combine the forest and non-forest maps produced by Indonesia’s LCCA program with Landsat, ALOS PALSAR, and Sentinel-1 images, to produce more accurate land cover classifications that incorporate four classes (native forest, oil palm plantation, rubber plantation, and non-forest).
However, during 2000–2006 and 2011–2014, there were no ALOS PALSAR or Sentinel-1 data available covering the study area (CEOS Citation2014). To fill this gap in SAR data, we developed a method to use the shortwave infrared (SWIR 1: ) band from Landsat images to discriminate between native forest and other land cover classes. Previous studies have shown that SWIR 1 can be used to discriminate between vegetation types based on plant canopy water status (Olsen et al. Citation2013; Tucker Citation1980). In this study, we adapted the previously published method, by replacing decision tree nodes that rely on SAR data, with indices and thresholds based on SWIR 1, NDVI and Normalized Difference Moisture Index (NDMI) (Tucker Citation1980; Razak et al. Citation2017; Gao Citation1996; Sari et al. Citation2022).
The decision tree applied to Landsat images from 2000 to 2006, and 2011 to 2014, to discriminate between native forest and tree plantations, is shown in .
Figure 2. The individual year classification decision tree to discriminate between native forest, oil palm, rubber plantations, and non-forest developed from Landsat images, for years when no SAR data were available; modified from Sari et al. (Citation2022).
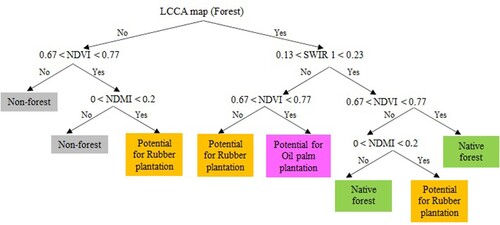
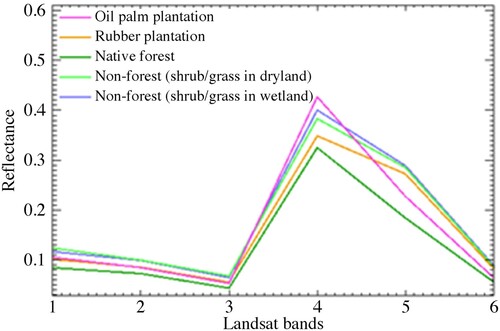
The SWIR 1 threshold was determined based on a training sample of Landsat images in 2018 with four land cover classes of oil palm (7500 pixels), rubber plantations (8000 pixels), native forest (7100 pixels), and non-forest (12,500 pixels distributed across shrub and grass in dryland and wetland). The SWIR 1 threshold was based on a 95% confidence interval of feature frequency histogram of training samples, which was then validated visually. The final SWIR 1 thresholds for forest cover were between 0.13 and 0.23 ().
Figure 3. Mean reflectance of training sample for native forest, oil palm and rubber plantations, and non-forest (dryland and wetland) in Landsat bands with band 1 (Blue), band 2 (Red), band 3 (Green), band 4 (Near Infrared), band 5 (SWIR 1), and band 6 (SWIR 2).
The thresholds for NDVI and NDMI used for discrimination of native forest, oil palm and rubber plantation, were derived in a similar way to the SWIR 1 thresholds. The methodology used is outlined in (Sari et al. Citation2022).
The plantation occurrence images were employed in the multitemporal classification and were used to create boundaries for potential plantation areas. The plantation occurrence was developed from a linear combination of NDVI and SWIR 1 for oil palm, and NDMI and SWIR 1 for rubber, and processed with a median filter of three-by-three pixels.
2.6. Multitemporal classification
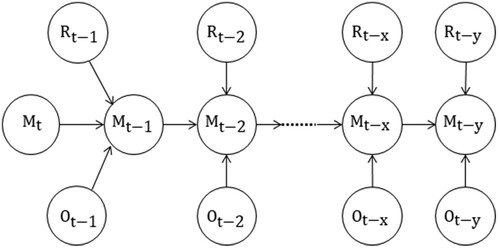
Multitemporal classification was used to refine the yearly four-class maps to produce the final time series of annual land cover maps. A Bayesian network was applied in reverse time order, where the classification for 2018 was used as an initial base classification image. Preceding classifications were then processed using Bayesian probability, based on the dependence of prior classification and the individual year probability of oil palm and rubber plantation occurrence.
The multitemporal algorithm is shown in Equations (1) and (2) and is adapted from Pollino and Henderson (Citation2010). The graphical representation of the processing is shown in . The multitemporal classification steps were:
determine the probability for each pixel to change class based on the two years of map classifications (e.g. 2017 and 2018) – designated as M. This probability P(M), was based on a transition matrix of 16 possible class changes, derived from the two individual land cover maps;
use Equation (1) to calculate pixel transition probability between forest and non-forest classes;
if the probability
of no-change is greater than the probability of change then the class will be stable. If the probability of change is greater, then the class for that pixel will change;
use Equation (2) for pixels that have transitions that involve oil palm and rubber plantation classes as either the initial or final classes to determine if the transition should occur, i.e.
Figure 4. Sample of graphical concept for the multitemporal process for 2018 and 2017, where M = individual year classification, O = approximate oil palm plantation occurrence, and R = approximate rubber plantation occurrence.
After the time series of classified maps is processed back to 2000, the next step is a second iteration of the same process in the forward direction from 2000 to 2018. These two iterations were used to reduce uncertainty of the final land cover classes (Guoping and Ren Citation2018). The final step was to reduce the occurrence of single pixels in the oil palm and rubber plantation classes based on a median filter of three-by-three pixels.
2.7. Map validation
To assess the accuracy of the temporally adjusted land cover maps over the time series, three land cover maps nine years apart were assessed: 2000, 2009, and 2018. These years represented the start, middle and end of the time series and for which high resolution images were available. We acknowledge that our approach contrasts with studies that evaluate time series classification accuracy in each year maps, such as from 2001 to 2013 (Tsutsumida and Comber Citation2015). However, there are also several studies on time series land cover classification that have used similar approach to temporally discrete validation (Chen et al. Citation2019; Yan et al. Citation2019). The maps were assessed using a confusion matrix. Overall accuracy (OA), producer’s accuracy (PA), and user’s accuracy (UA) were calculated based on 784 validation points for each map. The samples were selected based on stratified random sampling, as outlined in (Olofsson et al. Citation2014), and distributed proportionally across native forest, oil palm, rubber plantations, and non-forest classes. The minimum sampling unit was created from a block of 2 × 2 pixels in the land cover change map (50 × 50 m), which represents a minimum forested area of 0.25 hectares (Ministry of Environment and Forestry Citation2018). The land cover from the three maps at each of the validation datasets was assessed based on high-resolution images from SPOT 6/7 recorded in 2018 and temporal high-resolution images from the open-source platform for 2000 and 2009 (FAO Citation2020b).
3. Results
3.1. Classification results and accuracy assessment
Three land cover maps (2000, 2009, and 2018) were used for quantifying the accuracy of the native forest, oil palm, rubber plantation, and non-forest classes, relative to SPOT 6/7 and high-resolution validation data. Maps from these three years are shown in .
Figure 5. Maps of land cover in the study area for 2000, 2009 and 2018.
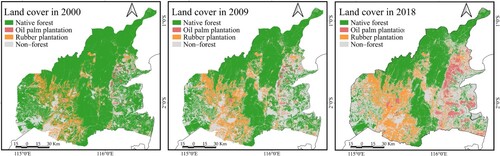
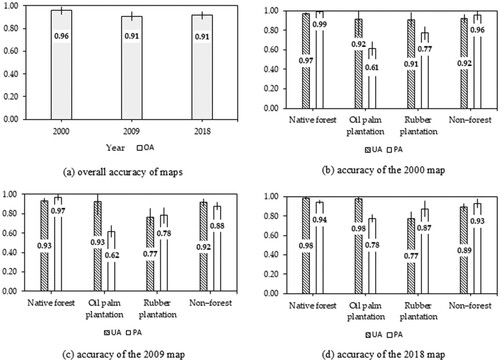
Accuracy assessment of the three representative maps can be seen in . Overall accuracy of the maps was above 90%. The native forest class had user’s and producer’s accuracy for all years of greater than 90%. The non-forest class had user’s and producer’s accuracy of more than 85% for all years. However, producer’s accuracy for rubber plantations was as low as 77%, and as low as 61% for oil palm in 2000.
Figure 6. Map accuracy assessment: (a) overall accuracy for the three validation years selected, (b) user’s accuracy and producer’s accuracy for the 2000 map, (c) user’s accuracy and producer’s accuracy for the 2009 map, and (d) user’s accuracy and producer’s accuracy for the 2018 map.
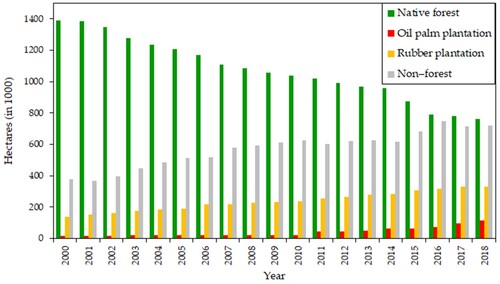
shows the estimated areas of each land cover class over the time series from 2000 to 2018. In 2000 the native forest covered 72.58% (1,390,080.69 hectares) of the total area, while non-forests covered 19.57% (376,286.25 hectares). Rubber plantations covered 7.21% (138,637.81 hectares) and oil palm plantations covered 0.95% (18,207.25 hectares) of the total area. Over the 18 years of the time series, native forest area gradually decreased, mainly due to an increase in non-forest area, followed by rubber and oil palm plantation expansion. By 2018, native forest area accounted for only 39.52% (760,055.57 hectares) of the total area. At the same time, non-forest areas increased to 37.35% (718,387.56 hectares) of the total area. Rubber was the dominant plantation type in the region, covering 17.20% (330,696.63 hectares) of the total area in 2018. However, oil palm plantation area increased significantly from 2011, reaching nearly half that of rubber plantations (114,072.25 hectares, 5.93%) ().
Figure 7. Land cover changes from 2000 to 2018 across the study area.
3.2. Land-cover change results from 2000 to 2018
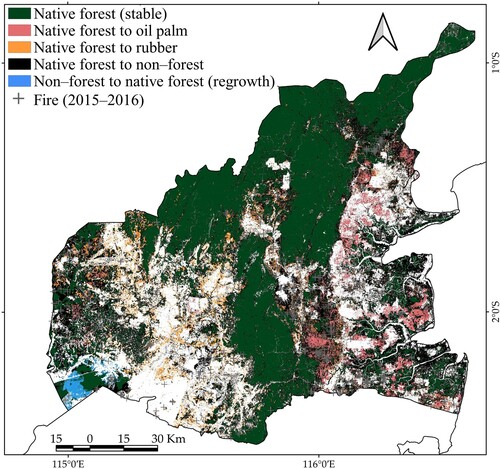
shows the dynamics of native forest change from 2000 to 2018. Over 18 years, native forest conversion to non-forest largely occurred in lowland and wetland regions. Native forest conversion to rubber plantations tended to occur in the hilly areas close to native forest in the north, and in the lowland forest in the centre and west of the region. Native forest conversion to oil palm plantations mainly occurred in the lowland areas in the east. However, a significant area of native forest regrowth was detected in peatlands in the southwest of the region ().
Figure 8. Native forest conversion to non-forest, oil palm and rubber plantations, and native forest regrowth from 2000 to 2018 in Kalimantan.
Estimated areas of land cover conversion during the study period were derived from pixel-by-pixel analysis of the land cover map between 2000 and 2018, as shown in .
Table 1. Areas of land cover changed from 2000 to 2018 (Ha).
From 2000 to 2018 the study area in Kalimantan lost 630,025.12 hectares (45.32%) of native forest. More than 70% of this conversion was to non-forest (71.89%), followed by rubber plantation (24.14%) and oil palm plantation (3.97%). Non-forest areas increased by 342,101.31 hectares (90.92%), from 376,286.25 hectares in 2000 to 718,387.56 hectares in 2018 (). However, as previously shown in , a relatively large area (6,548.88 hectares) of native forest regrowth from non-forest was detected during the study period ().
During the study period, rubber plantations increased by 192,058.81 hectares (138.53%) with native forest contributing 47% and non-forest contributing 15% of the new areas established (). These new rubber plantations that were established between 2000 and 2018 were largely distributed in the central region of the study area ().
Oil palm plantations increased by 95,865 hectares (526.52%) from 18,207.25 hectares in 2000 to 114,072.25 hectares in 2018. Oil palm plantations mainly developed in non-forest areas (60%), followed by native forest conversion (22%). A small proportion of rubber plantations were converted to oil palm plantations (3%). shows the spatial distribution of the oil palm plantation expansion. Over 18 years, oil palm plantations largely developed in lowland areas in the east of the study area. A recent trend of oil palm plantation expansion was also detected in the west of the region ().
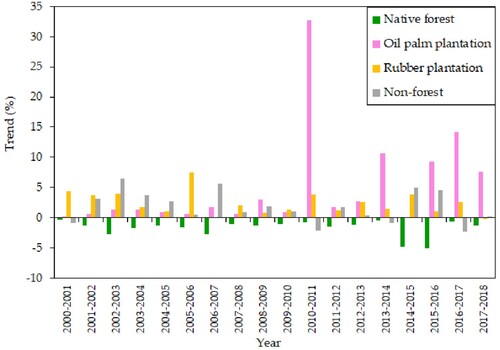
The trend of land cover changes from 2000 to 2018 can be seen in . Significant native forest loss occurred between 2015 and 2016. Rubber plantations increased significantly in the period from 2000 to 2006. The oil palm plantation area increased markedly between 2010 and 2011 and continued to increase until 2018.
Figure 9. Trend of land cover changes across the east Kalimantan study area from 2000 to 2018.
4. Discussion
This study developed a method to integrate a time series of Landsat, ALOS PALSAR, and Sentinel-1 satellite imagery, processed using Bayesian classification probability, to produce multitemporal land cover maps from 2000 to 2018 that differentiate between native forest, oil palm and rubber plantations, and non-forest. Over the 18-year time series, nearly half of the east Kalimantan study area native forests were converted to either non-forest, rubber plantations, or oil palm plantations.
The current land cover maps had an overall accuracy of 91–96%. This compares favourably to previous studies that showed an overall map accuracy of 73–77% using only optical images (Sari et al. Citation2021). Incorporating SAR images improved classification accuracy in discriminating closed-canopy cover (>50%), such as between native forests, oil palm and rubber plantations, due to SAR ability to penetrate the canopy and distinguish vegetation structural differences (Sari et al. Citation2022; Miettinen and Liew Citation2011). The time series Bayesian method was used to refine the individual year land cover classification to discriminate between native forest, oil palm and rubber plantation and non-forest.
ALOS PALSAR L-band images increased classification accuracy because of the greater penetration and sensitivity to vegetation structure to distinguish rubber plantations. L-band discriminated rubber plantations through the canopy with more distinct scattering from trunks and branches, twigs, and ground cover vegetation (Rosenqvist Citation1996). Whilst Sentinel-1 C-band was prominent in discriminating oil palm plantations based on marked differences between VV (high backscatter value) and VH (low backscatter value), due to the low density of stems (Sari et al. Citation2022; Miettinen and Liew Citation2011). Map validation in 2018 showed oil palm plantation had a relatively high user’s accuracy (>90%), and producer’s accuracy (>75%).
The highest accuracy was in mapping native forest and non-forest classes, with 88–99% for both user’s accuracy and producer’s accuracy. The oil palm class had user’s accuracy in the range of 92–98%, while producer’s accuracy varied from 61% to 78%. The rubber plantation class had user’s accuracy from 77% to 91% and producer’s accuracy from 77% to 87%. The method demonstrated lower map accuracy for oil palm plantations, particularly for areas in the earlier stages of plantation development. Similarly, there were higher errors in differentiation between young rubber and non-forests. For example, the final maps showed many small areas with mixes of oil palm plantation, non-forest, and young rubber plantation, particularly in the southeast of the region ().
Future improvement of map accuracy can be achieved by using a higher resolution digital elevation model (DEM) for terrain correction, to reduce the uncertainty. SAR images are sensitive to topography that causes a bias, such as low certainty of forest biomass estimation, due to variation of the backscatter coefficients that are dependent on the incidence angle, wavelength, polarization, topography and land surface (CEOS Citation2018; Suzuki, Kim, and Ishii Citation2013). To improve DEM accuracy in spatial pixel spacing and elevation, FABDEM (Forest And Buildings removed Copernicus DEM) of TanDEM-X can be used that reduces a mean absolute vertical error of forests from 5.15 to 2.88 m (Hawker et al. Citation2022). Moreover, future improvements for oil palm plantation classification accuracy may be achieved by adding information of oil palm in the multitemporal Bayesian network developed using object-based segmentation or random forest from ALOS PALSAR (Ahmed et al. Citation2018; Dong et al. Citation2020; Sarzynski et al. Citation2020).
In agreement with previous studies, we showed that native forest loss in the east Kalimantan study area largely occurred in lowland and wetland areas, due to forest conversion, and possibly from forest fires between 2015 and 2016 (), that covered approximately 849,703 hectares of the total area in east Kalimantan (Margono et al. Citation2014; Field et al. Citation2016; Decree of the Ministry of Environment and Forestry Citation2017). Fire data from MODIS and Suomi NPP Visible Infrared Imaging Radiometer Suite (VIIRS S-NPP), with an accuracy of >85%, showed that several fires occurred in the region between 2015 and 2016 () (NASA Citation2022).
A significant increase in oil palm plantation areas started in 2008. This is likely due to an increasing global demand for this product, with global palm oil production increasing by 242% from 120 Mt in 2000 to 410 Mt in 2018 (FAO Citation2021). Oil palm plantations largely grow below 150 m elevation and are located on mineral soils, in peatlands, coastal plains and swamp ecosystems (Ruysschaert et al. Citation2011). Oil palm plantation expansion from 2000 to 2018 was mainly in near-coastal areas of east Kalimantan. Recently oil palm plantation expansion was detected in lowlands, close to peatland in the west of the study region (scattered small areas) (). Rubber plantations can grow at elevations up to 700 m and are mainly small-scale plantations (Phuc and Nghi Citation2014). We observed a significant rubber plantation expansion into native forest areas (153,790.13 hectares over 18 years) as well as in non-forest areas in lowland areas in the south of the region. This study also detected conversion of rubber plantations to oil palm plantations in the central region, which may have been driven by a relatively more profitable palm oil, and fuelled by the decline in rubber prices in 2011–2013 (Feintrenie, Chong, and Levang Citation2010; Krishna et al. Citation2017; ResearchInChina Citation2014).
Overall, over the 18 years, expansion of rubber and oil palm plantations contributed to native forest loss of approximately 179,081 hectares. Vast areas of plantation were also developed in previously non-forested land (117,134.94 hectares), such as degraded or cleared forests (Austin et al. Citation2017). Dramatic increase in rubber and oil palm plantations in areas of Kalimantan observed in this study is in line with a corresponding increase in global demand for rubber and palm oil products over the past two decades (FAO Citation2021; Wicke et al. Citation2011).
However, we also found a significant native forest regrowth in the degraded area of peatland in the study area, which can be a direct consequence of a recent Indonesian policy on peatland restoration (CitationPresidential Instruction No. 5/2019). The results shown in this study can be an objective measure of the benefits of such a policy in terms of land restoration.
The time series of land cover maps developed in this study have demonstrated that they fulfil the Indonesian national standard of map accuracy of >85% and support sustainable plantation development in the Kalimantan region (Badan Standardisasi Nasional Citation2010; Badan Informasi Geospasial Citation2014). This information on land cover changes can be used to support Indonesia’s national forest monitoring system and sustainable forest management and investment decisions.
5. Conclusions
The current study used remote sensing data from Landsat, ALOS PALSAR, and Sentinel-1 satellite sensors over the period from 2000 to 2018 to improve automated mapping of spatial dynamics of native forest and plantation areas in east region of Kalimantan. Incorporating multisource SAR images of L- and C-bands and Landsat increased temporal data to improve land cover map accuracy, including ability to distinguish among vegetation types. The current study showed that nearly half of native forests in the east Kalimantan study area were converted to non-forest, or plantations of either rubber or oil palm between 2000 and 2018. Plantation expansion occurred mainly in lowland and wetland areas. However, significant native forest regrowth was also detected in peatland in the southwestern region of the study area over this period.
A multitemporal classification using a Bayesian network was applied to accurately map change and estimate areas of native forest conversion over the 18-year period. The maps had an overall accuracy above 90%. This fulfils the national map accuracy benchmark to comply with the IPCC requirement for transparent, repeatable, accurate, consistent, and complete land cover change mapping for sustainable forest management, including sustainable plantation development (Penman et al. Citation2003).
Accurate time series maps are critical to support Indonesia’s national forest monitoring system and to conserve the remaining native forests. Responsible management of this valuable resource will help to reduce emissions from forest degradation and deforestation, which is one of Indonesia’s strategies to reduce global greenhouse gas emissions (Indonesia LTS-LCCR Citation2050 Citation2021). Moreover, land cover maps developed in this study provide insights into forest cover dynamics, including the rapid expansion of rubber and oil palm plantations. The ongoing generation of these land cover maps will help Indonesia to plan management strategies and policies that can balance the need for economic growth, and the need to conserve the valuable natural ecosystems and habitats across the region.
Acknowledgements
The authors thank the Research Center for Remote Sensing, National Research and Innovation Agency (BRIN), the LCCA teams, and the Indonesia–Australia Forest Carbon Partnership for sharing the satellite images and methods. I.L.S acknowledges the Indonesian LPDP for Ph.D scholarship.
Disclosure statement
No potential conflict of interest was reported by the author(s).
Data availability statement
The data that support the findings of this study are available from the corresponding author, ILS, upon reasonable request.
References
- Achard, Frédéric, and Matthew C Hansen. 2012. Global Forest Monitoring from Earth Observation. Boca Raton, FL: Taylor & Francis.
- Ahmed, Ahmed Abdulkareem, Biswajeet Pradhan, Maher Ibrahim Sameen, and Ali Muayad Makky. 2018. “An Optimized Object-Based Analysis for Vegetation Mapping Using Integration of Quickbird and Sentinel-1 Data.” Arabian Journal of Geosciences 11 (11): 280. doi:10.1007/s12517-018-3632-1.
- Altunel, Arif Oguz, Emre Akturk, and Tayyibe Altunel. 2020. “Examining the PALSAR-2 Global Forest/non-Forest Maps Through Turkish Afforestation Practices.” International Journal of Remote Sensing 41 (16): 6071–6088. doi:10.1080/01431161.2020.1760397.
- ASF. 2019. “Sentinel-1.” Accessed 3 July 2019. https://search.asf.alaska.edu/#/.
- Austin, K. G., A. Mosnier, J. Pirker, I. McCallum, S. Fritz, and P. S. Kasibhatla. 2017. “Shifting Patterns of oil Palm Driven Deforestation in Indonesia and Implications for Zero-Deforestation Commitments.” Land Use Policy 69: 41–48. doi:10.1016/j.landusepol.2017.08.036.
- Badan Informasi Geospasial. 2014. Peraturan Kepala Badan Informasi Geospasial Nomor 15 Tahun 2014 Tentang Pedoman Teknis Ketelitian Peta Dasar (Head of Geospatial Information Agency: Technical Guidelines to Determine the Accuracy of the Base Map Number 15 Year 2014). Cibinong, Indonesia. Accessed 12 July 2021. https://jdih.big.go.id/media/resources/files/law/tUF25Yj2xW_Perka_Ketelitian_Peta_Dasar_-_Salinan.pdf.
- Badan Pusat Statistik. 2010b. Kabupaten Tabalong Dalam Angka 2010 (Tabalong Regency In Figures 2010). Tanjung: BPS-Statistics of Tabalong Regency. Accessed 14 February 2022. https://tabalongkab.bps.go.id/publication/2010/12/06/c58b044270e5e00272057388/kabupaten-tabalong-dalam-angka-tahun-2010.html.
- Badan Pusat Statistik. 2010a. Kabupaten Balangan Dalam Angka 2010 (Balangan Regency In Figures 2010). Paringin: BPS-Statistics of Balangan Regency. Accessed 11 February 2022. https://balangankab.bps.go.id/publication/2017/08/04/337024047f1f89cc57cffe57/kabupaten-balangan-dalam-angka-2010.html
- Badan Pusat Statistik. 2010c. Provinsi Kalimantan Tengah Dalam Angka 2010 (Kalimantan Tengah Province In Figures 2010). Palangka Raya: BPS-Statistics of Kalimantan Tengah Province. Accessed 14 February 2022. https://kalteng.bps.go.id/publication/2011/03/08/87bd80e03b750dcfd5ba9ed9/provinsi-kalimantan-tengah-dalam-angka-2010.html.
- Badan Pusat Statistik. 2010d. Provinsi Kalimantan Timur Dalam Angka 2010 (Kalimantan Timur Province In Figures 2010). Samarinda: BPS-Statistics of Kalimantan Timur Province. Accessed 14 February 2022. https://kaltim.bps.go.id/publication/2010/11/15/72791ce3392060467b266036/kalimantan-timur-dalam-angka-2010.html
- Badan Pusat Statistik. 2019a. Provinsi Kalimantan Selatan Dalam Angka 2019 (Kalimantan Selatan Province In Figures 2019). Banjarbaru: BPS-Statistics of Kalimantan Selatan Province. Accessed 14 February 2022. https://kalsel.bps.go.id/publication/2019/08/16/903c009fdaf5616cd7982d8a/provinsi-kalimantan-selatan-dalam-angka-2019.html
- Badan Pusat Statistik. 2019b. Provinsi Kalimantan Tengah Dalam Angka 2019 (Kalimantan Tengah Province In Figures 2019). Palangka Raya: BPS-Statistics of Kalimantan Tengah Province. Accessed 14 February 2022. https://kalteng.bps.go.id/publication/2019/08/16/265deb0d37728f33459e1303/provinsi-kalimantan-tengah-dalam-angka-2019.html.
- Badan Pusat Statistik. 2019c. Provinsi Kalimantan Timur Dalam Angka 2019 (Kalimantan Timur Province In Figures 2019). Samarinda: BPS-Statistics of Kalimantan Timur Province. Accessed 11 February 2022. https://kaltim.bps.go.id/publication/2019/08/16/a9deb9809e0b2606ce96573f/provinsi-kalimantan-timur-dalam-angka-2019.html.
- Badan Standardisasi Nasional. 2010. Klasifikasi Penutup Lahan SNI 7645:2010 (Indonesian National Standard on Land Cover Classification SNI 7645:2010). Jakarta: Badan Standardisasi Nasional. Accessed 25 January 2022. https://www.big.go.id/assets/download/sni/SNI/15.%20SNI%207645-2010%20Klasifikasi%20penutup%20lahan.pdf.
- Ban, Yifang. 2003. “Synergy of Multitemporal ERS-1 SAR and Landsat TM Data for Classification of Agricultural Crops.” Canadian Journal of Remote Sensing 29 (4): 518–526. doi:10.5589/m03-014.
- Bannari, Abdou, Daniel Morin, F. Bonn, and AjRsr Huete. 1995. “A Review of Vegetation Indices.” Remote Sensing Reviews 13 (1-2): 95–120. doi:10.1080/02757259509532298.
- Blaes, Xavier, Laurent Vanhalle, and Pierre Defourny. 2005. “Efficiency of Crop Identification Based on Optical and SAR Image Time Series.” Remote Sensing of Environment 96 (3): 352–365. doi:10.1016/j.rse.2005.03.010.
- Caccetta, Peter, Suzanne Furby, Jeremy Wallace, Xiaoliang Wu, Gary Richards, and Robert Waterworth. 2016. “Long-Term Monitoring of Australian Land Cover Change Using Landsat Data: Development, Implementation, and Operation.” In In Global Forest Monitoring from Earth Observation, edited by Frédéric Achard and Matthew C. Hansen, 229–242. New York, NY: Taylor & Francis.
- CEOS. 2014. “Global Baseline Data Acquisition Strategy for the Global Forest Observations Initiative (GFOI).” Accessed 11 February 2022. https://ceos.org/document_management/Ad_Hoc_Teams/SDCG_for_GFOI/SDCG_Global-Baseline-Data-Acquisition-Strategy-Annex-B-2013-Implementation-Report_Apr2014.pdf.
- CEOS. 2018. “A Layman’s Interpretation to L-Band and C-Band Synthetic Aperture Radar Data.” Accessed on 11 June 2021. https://ceos.org/document_management/SEO/DataCube/Laymans_SAR_Interpretation_Guide_2.0.pdf.
- Chen, Zuoqi, Bailang Yu, Yuyu Zhou, Hongxing Liu, Chengshu Yang, Kaifang Shi, and Jianping Wu. 2019. “Mapping Global Urban Areas from 2000 to 2012 Using Time-Series Nighttime Light Data and MODIS Products.” IEEE Journal of Selected Topics in Applied Earth Observations and Remote Sensing 12 (4): 1143–1153. doi:10.1109/JSTARS.2019.2900457.
- Cracknell, Arthur Phillip, Kasturi Devi Kanniah, Kian Pang Tan, and Lei Wang. 2013. “Evaluation of MODIS Gross Primary Productivity and Land Cover Products for the Humid Tropics Using oil Palm Trees in Peninsular Malaysia and Google Earth Imagery.” International Journal of Remote Sensing 34 (20): 7400–7423. doi:10.1080/01431161.2013.820367.
- Curtis, Philip G, Christy M Slay, Nancy L Harris, Alexandra Tyukavina, and Matthew C Hansen. 2018. “Classifying Drivers of Global Forest Loss.” Science 361 (6407): 1108–1111. doi:10.1126/science.aau3445.
- Decree of the Ministry of Environment and Forestry No. SK.282/MENLHK/SETJEN/PLA.1/6/2017 regarding the Forest Fire Areas in 2015 and 2016. Accessed 25 June 2022. http://ditjenppi.menlhk.go.id/reddplus/images/adminppi/permen/SK282tahun2017.pdf.
- Dong, Runmin, Weijia Li, Haohuan Fu, Lin Gan, Le Yu, Juepeng Zheng, and Maocai Xia. 2020. “Oil Palm Plantation Mapping from High-Resolution Remote Sensing Images Using Deep Learning.” International Journal of Remote Sensing 41 (5): 2022–2046. doi:10.1080/01431161.2019.1681604.
- Dong, Xichao, Shaun Quegan, Uryu Yumiko, Cheng Hu, and Tao Zeng. 2015. “Feasibility Study of C- and L-Band SAR Time Series Data in Tracking Indonesian Plantation and Natural Forest Cover Changes.” IEEE Journal of Selected Topics in Applied Earth Observations and Remote Sensing 8 (7): 3692–3699. doi:10.1109/JSTARS.2015.2400439.
- Fagan, Matthew E, Do-Hyung Kim, Wesley Settle, Lexie Ferry, Justin Drew, Haven Carlson, Joshua Slaughter, et al. 2022. “The Expansion of Tree Plantations Across Tropical Biomes.” Nature Sustainability 5: 681–688. doi:10.1038/s41893-022-00904-w.
- FAO. 2020a. “Global Forest Resources Assessment 2020.” Accessed 6 June 2021. https://www.fao.org/3/ca8753en/CA8753EN.pdf.
- FAO. 2020b. “Open Foris.” Accessed 28 March 2020. http://www.openforis.org/.
- FAO. 2021. “FAOSTAT.” Accessed 6 June 2021. http://www.fao.org/faostat/en/#data.
- Feintrenie, Laurene, Wan Kian Chong, and Patrice Levang. 2010. “Why do Farmers Prefer Oil Palm? Lessons Learnt from Bungo District, Indonesia.” Small-scale Forestry 9 (3): 379–396. doi:10.1007/s11842-010-9122-2.
- Field, Robert D, Guido R van der Werf, Thierry Fanin, Eric J Fetzer, Ryan Fuller, Hiren Jethva, Robert Levy, et al. 2016. “Indonesian Fire Activity and Smoke Pollution in 2015 Show Persistent Nonlinear Sensitivity to El Niño-Induced Drought.” Proceedings of the National Academy of Sciences 113 (33): 9204–9209. doi:10.1073/pnas.1524888113.
- Gao, Bo-Cai. 1996. “NDWI—A Normalized Difference Water Index for Remote Sensing of Vegetation Liquid Water from Space.” Remote Sensing of Environment 58 (3): 257–266. doi:10.1016/S0034-4257(96)00067-3.
- Ghahramani, Zoubin. 2001. “AN INTRODUCTION TO HIDDEN MARKOV MODELS AND BAYESIAN NETWORKS.” International Journal of Pattern Recognition and Artificial Intelligence 15 (01): 9–42. doi:10.1142/S0218001401000836.
- Guoping, Jiang, and Mingkui Ren. 2018. “Cyclic Bayesian Network for Software Project Iterative Process.” In Proceedings of Proceedings of the 2018 International Conference on Mathematics, Modelling, Simulation and Algorithms (MMSA 2018), 413–417.
- Hansen, Matthew C, Peter V Potapov, Rebecca Moore, Matt Hancher, Svetlana Turubanova, Alexandra Tyukavina, David Thau, S. V. Stehman, S. Goetz, and T. R. Loveland. 2013. “High-Resolution Global Maps of 21st-Century Forest Cover Change.” Science 342 (6160): 850–853. doi:10.1126/science.1244693.
- Hawker, Laurence, Peter Uhe, Luntadila Paulo, Jeison Sosa, James Savage, Christopher Sampson, and Jeffrey Neal. 2022. “A 30 m Global map of Elevation with Forests and Buildings Removed.” Environmental Research Letters 17 (2): 024016.
- Hoekman, Dirk H. 1985. “Radar Backscattering of Forest Stands.” International Journal of Remote Sensing 6 (2): 325–343. doi:10.1080/01431168508948447.
- Indonesia LTS-LCCR 2050. 2021. “Indonesia Long-Term Strategy for Low Carbon and Climate Resilience 2050 (Indonesia LTS-LCCR 2050).” Accessed 25 June 2022. https://unfccc.int/sites/default/files/resource/Indonesia_LTS-LCCR_2021.pdf.
- JAXA. 2016. “Global 25 m Resolution PALSAR-2/PALSAR Mosaic and Forest/Non-Forest Map (FNF) Dataset Description.” Accessed 25 October 2021. https://www.eorc.jaxa.jp/ALOS/en/dataset/pdf/DatasetDescription_PALSAR_Mosaic_FNF_revO.pdf.
- JAXA. 2019. “ALOS PALSAR.” Accessed 3 July 2019. https://www.eorc.jaxa.jp/ALOS/en/palsar_fnf/data/index.htm.
- Keenan, Rodney J, Gregory A Reams, Frédéric Achard, Joberto V de Freitas, Alan Grainger, and Erik Lindquist. 2015. “Dynamics of Global Forest Area: Results from the FAO Global Forest Resources Assessment 2015.” Forest Ecology and Management 352: 9–20. doi:10.1016/j.foreco.2015.06.014.
- Kou, Weili, Jinwei Dong, Xiangming Xiao, Alexander J Hernandez, Yuanwei Qin, Geli Zhang, Bangqian Chen, Ning Lu, and Russell Doughty. 2018. “Expansion Dynamics of Deciduous Rubber Plantations in Xishuangbanna, China During 2000–2010.” GIScience & Remote Sensing 55 (6): 905–925. doi:10.1080/15481603.2018.1466441.
- Krishna, Vijesh, Michael Euler, Hermanto Siregar, and Matin Qaim. 2017. “Differential Livelihood Impacts of oil Palm Expansion in Indonesia.” Agricultural Economics 48 (5): 639–653. doi:10.1111/agec.12363.
- LAPAN. 2014. The Remote Sensing Monitoring Program of Indonesia’s National Carbon Accounting System: Methodology and Products, Version 1. Jakarta, Indonesia: LAPAN-IAFCP. Accessed 4 January 2019. http://incas.menlhk.go.id/methodology/incas-standard-method-forest-cover-change/.
- Lee, Jacky, Jeffrey A Cardille, and Michael T Coe. 2020. “Agricultural Expansion in Mato Grosso from 1986–2000: A Bayesian Time Series Approach to Tracking Past Land Cover Change.” Remote Sensing 12 (4): 688. doi:10.3390/rs12040688.
- Margono, Belinda Arunarwati, Ahmad Basyirudin Usman, and Ruandha Agung Sugardiman. 2016. “Indonesia’s Forest Resource Monitoring.” Indonesian Journal of Geography 48 (1). doi:10.22146/ijg.12496.
- Margono, Belinda Arunarwati, Peter V Potapov, Svetlana Turubanova, Fred Stolle, and Matthew C Hansen. 2014. “Primary Forest Cover Loss in Indonesia Over 2000–2012.” Nature Climate Change 4 (8): 730–735. doi:10.1038/nclimate2277.
- Miettinen, Jukka, and Soo Chin Liew. 2011. “Separability of Insular Southeast Asian Woody Plantation Species in the 50 m Resolution ALOS PALSAR Mosaic Product.” Remote Sensing Letters 2 (4): 299–307. doi:10.1080/01431161.2010.520345.
- Miettinen, Jukka, Soo Chin Liew, and Leong Keong Kwoh. 2015. “Usability of Sentinel-1 Dual Polarization C-Band Data for Plantation Detection in Insular Southeast Asia.” Paper presented at the Proceedings of the 36th Asian Conference on Remote Sensing (ACRS2015).
- Ministry of Agriculture. 2017a. Statistik Perkebunan Indonesia 2015–2017: Karet (Tree Crop Estate Statistics of Indonesia 2015-2017: Rubber). Jakarta, Indonesia. Accessed 26 April 2020. http://ditjenbun.pertanian.go.id/tinymcpuk/gambar/file/statistik/2017/Karet-2015-2017.pdf.
- Ministry of Agriculture. 2017b. Statistik Perkebunan Indonesia 2015–2017: Kelapa sawit (Tree Crop Estate Statistics of Indonesia 2015-2017: Palm Oil). Jakarta, Indonesia. Accessed 26 April 2020. http://ditjenbun.pertanian.go.id/tinymcpuk/gambar/file/statistik/2017/Kelapa-Sawit-2015-2017.pdf.
- Ministry of Environment and Forestry, Republic of Indonesia. 2018. The State of Indonesia’s Forests 2018; Ministry of Environment and Forestry. Jakarta, Indonesia. Accessed 14 May 2019. https://www.menlhk.go.id/site/download?start=10.
- NASA. 2022. “FIRMS Fire Information for Resource Management System.” Accessed 28 June 2022. https://firms.modaps.eosdis.nasa.gov/country/.
- Olofsson, Pontus, Giles M Foody, Martin Herold, Stephen V Stehman, Curtis E Woodcock, and Michael A Wulder. 2014. “Good Practices for Estimating Area and Assessing Accuracy of Land Change.” Remote Sensing of Environment 148: 42–57. doi:10.1016/j.rse.2014.02.015.
- Olsen, Jørgen L., Pietro Ceccato, Simon R. Proud, Rasmus Fensholt, Manuela Grippa, Eric Mougin, Jonas Ardö, and Inge Sandholt. 2013. “Relation Between Seasonally Detrended Shortwave Infrared Reflectance Data and Land Surface Moisture in Semi–Arid Sahel.” Remote Sensing 5 (6): 2898–2927. doi:10.3390/rs5062898.
- Penman, Jim, Michael Gytarsky, Taka Hiraishi, Thelma Krug, Dina Kruger, Riitta Pipatti, Leandro Buendia, et al. 2003. Good Practice Guidance for Land use, Land-use Change and Forestry. Hayama: Institute for Global Environmental Strategies (IGES). Accessed 9 January 2021. https://www.ipcc.ch/site/assets/uploads/2018/03/GPG_LULUCF_FULLEN.pdf.
- Phuc, To Xuan, and Tran Huu Nghi. 2014. Rubber Expansion and Forest Protection in Vietnam. Hue: Tropenbos International Viet Nam. Accessed 28 May 2019. https://www.tropenbos.org/resources/publications/rubber+expansion+and+forest+protection+in+vietnam.
- Poker, Jutta, and Kenneth MacDicken. 2016. “Tropical Forest Resources: Facts and Tables.” In Tropical Forestry Handbook, edited by L. Pancel and M. Köhl, 3–45. Berlin: Springer Berlin Heidelberg.
- Pollino, Carmel A, and Christian Henderson. 2010. Bayesian Networks: A Guide for Their Application in Natural Resource Management and Policy. Tasmania: Landscape Logic. Volume 14.
- Presidential Instruction No. 5/2019 regarding the Termination of Granting of New Permits and Improving Management of Primary Natural Forests and Peatlands. Accessed 25 June 2022. https://jdihn.go.id/search/pusat/detail/945310.
- Razak, Janatul Aziera binti Abd, Abdul Rashid bin M. Shariff, Noordin bin Ahmad, and Maher Ibrahim Sameen. 2017. “Mapping Rubber Trees Based on Phenological Analysis of Landsat Time Series Data-Sets.” Geocarto International 33 (6): 1–24.
- Reiche, Johannes, Sytze De Bruin, Dirk Hoekman, Jan Verbesselt, and Martin Herold. 2015. “A Bayesian Approach to Combine Landsat and ALOS PALSAR Time Series for Near Real-Time Deforestation Detection.” Remote Sensing 7 (5): 4973–4996. doi:10.3390/rs70504973.
- Reiche, Johannes, Eliakim Hamunyela, Jan Verbesselt, Dirk Hoekman, and Martin Herold. 2018. “Improving Near-Real Time Deforestation Monitoring in Tropical dry Forests by Combining Dense Sentinel-1 Time Series with Landsat and ALOS-2 PALSAR-2.” Remote Sensing of Environment 204: 147–161. doi:10.1016/j.rse.2017.10.034.
- ResearchInChina. 2014. “Global and China Natural Rubber Industry Report, 2013–2016.” Accessed 25 January 2022. http://www.researchinchina.com/htmls/report/2014/6851.html.
- Rosenqvist, Å. 1996. “Evaluation of JERS-1, ERS-1 and Almaz SAR Backscatter for Rubber and oil Palm Stands in West Malaysia.” International Journal of Remote Sensing 17 (16): 3219–3231. doi:10.1080/01431169608949140.
- Ruysschaert, Denis, Adji Darsoyo, Rizwan Zen, Gunung Gea, and Ian Singleton. 2011. “Developing Palm-Oil Production on Degraded Land.” Foundation PanEco, YEL, World Agroforestry Centre, Medan. Accessed 28 May 2019. https://www.ifc.org/wps/wcm/connect/534db066-91a5-4816-a277-97eb687c0dd5/Developing+OP+plantation+on+degraded+land-draft_Output+22.pdf?MOD=AJPERES&CVID=kjG1KkB.
- Santosa, Yanto, Arzyana Sunkar, and Rozza Tri Kwatrina. 2020. “Is It True That Oil Palm Plantations Are The Main Driver of Deforestation of Indonesia’s Tropical Forest?” International Journal of Oil Palm 3 (1): 1–10. doi:10.35876/ijop.v3i1.37.
- Sari, Inggit Lolita, Christopher J Weston, Glenn J Newnham, and Liubov Volkova. 2021. “Assessing Accuracy of Land Cover Change Maps Derived from Automated Digital Processing and Visual Interpretation in Tropical Forests in Indonesia.” Remote Sensing 13 (8): 1446. doi:10.3390/rs13081446.
- Sari, Inggit Lolita, Christopher J Weston, Glenn J Newnham, and Liubov Volkova. 2022. “Developing Multi-Source Indices to Discriminate Between Native Tropical Forests, Oil Palm and Rubber Plantations in Indonesia.” Remote Sensing 14 (1): 3. doi:10.3390/rs14010003.
- Sarzynski, Thuan, Xingli Giam, Luis Carrasco, and Janice Ser Huay Lee. 2020. “Combining Radar and Optical Imagery to Map Oil Palm Plantations in Sumatra, Indonesia, Using the Google Earth Engine.” Remote Sensing 12 (7): 1220. doi:10.3390/rs12071220.
- Shimada, Masanobu, Takuya Itoh, Takeshi Motooka, Manabu Watanabe, Tomohiro Shiraishi, Rajesh Thapa, and Richard Lucas. 2014. “New Global Forest/non-Forest Maps from ALOS PALSAR Data (2007–2010).” Remote Sensing of Environment 155: 13–31. doi:10.1016/j.rse.2014.04.014.
- Suzuki, Rikie, Yongwon Kim, and Reiichiro Ishii. 2013. “Sensitivity of the Backscatter Intensity of ALOS/PALSAR to the Above-Ground Biomass and Other Biophysical Parameters of Boreal Forest in Alaska.” Polar Science 7 (2): 100–112. doi:10.1016/j.polar.2013.03.001.
- Symeonakis, Elias, Peter A. Caccetta, Sotirios Koukoulas, Suzanne Furby, and Nikolaos Karathanasis. 2012. “Multi-temporal Land-Cover Classification and Change Analysis with Conditional Probability Networks: The Case of Lesvos Island (Greece).” International Journal of Remote Sensing 33 (13): 4075–4093. doi:10.1080/01431161.2011.640961.
- Torbick, Nathan, Lindsay Ledoux, William Salas, and Meng Zhao. 2016. “Regional Mapping of Plantation Extent Using Multisensor Imagery.” Remote Sensing 8 (3): 236. doi:10.3390/rs8030236.
- Tropek, Robert, Ondřej Sedláček, Jan Beck, Petr Keil, Zuzana Musilová, Irena Šímová, and David Storch. 2014. “Comment on “High-Resolution Global Maps of 21st-Century Forest Cover Change”.” Science 344 (6187): 981–981. doi:10.1126/science.1248753.
- Tsutsumida, Narumasa, and Alexis J Comber. 2015. “Measures of Spatio-Temporal Accuracy for Time Series Land Cover Data.” International Journal of Applied Earth Observation and Geoinformation 41: 46–55. doi:10.1016/j.jag.2015.04.018.
- Tucker, Compton J. 1980. “Remote Sensing of Leaf Water Content in the Near Infrared.” Remote Sensing of Environment 10 (1): 23–32. doi:10.1016/0034-4257(80)90096-6.
- Turubanova, Svetlana, Peter V Potapov, Alexandra Tyukavina, and Matthew C Hansen. 2018. “Ongoing Primary Forest Loss in Brazil, Democratic Republic of the Congo, and Indonesia.” Environmental Research Letters 13 (7): 074028. doi:10.1088/1748-9326/aacd1c.
- USGS. 2019. “Landsat.” Accessed 3 July 2019. https://earthexplorer.usgs.gov/.
- Verbesselt, Jan, Rob Hyndman, Glenn Newnham, and Darius Culvenor. 2010. “Detecting Trend and Seasonal Changes in Satellite Image Time Series.” Remote Sensing of Environment 114 (1): 106–115. doi:10.1016/j.rse.2009.08.014.
- Wicke, Birka, Richard Sikkema, Veronika Dornburg, and André Faaij. 2011. “Exploring Land use Changes and the Role of Palm oil Production in Indonesia and Malaysia.” Land Use Policy 28 (1): 193–206. doi:10.1016/j.landusepol.2010.06.001.
- Xu, Yidi, Le Yu, Wei Li, Philippe Ciais, Yuqi Cheng, and Peng Gong. 2020. “Annual oil Palm Plantation Maps in Malaysia and Indonesia from 2001 to 2016.” Earth System Science Data 12 (2): 847–867. doi:10.5194/essd-12-847-2020.
- Yan, Jining, Lizhe Wang, Weijing Song, Yunliang Chen, Xiaodao Chen, and Ze Deng. 2019. “A Time-Series Classification Approach Based on Change Detection for Rapid Land Cover Mapping.” ISPRS Journal of Photogrammetry and Remote Sensing 158: 249–262. doi:10.1016/j.isprsjprs.2019.10.003.