
 ?Mathematical formulae have been encoded as MathML and are displayed in this HTML version using MathJax in order to improve their display. Uncheck the box to turn MathJax off. This feature requires Javascript. Click on a formula to zoom.
ABSTRACT
Urban Functional Zone (UFZ) identification is vital for urban planning, renewal, and development. Point of Interest (POI), as one of the most popular data in UFZ studies, is transformed into a geo-corpus under specific sampling strategies, which can be used with Natural Language Processing (NLP) technology to extract geo-semantic features and identify UFZs. However, existing studies only capture a single spatial distribution pattern of POIs, while ignoring the other spatial distribution information. In this paper, we developed an integrated geo-corpus construction approach to capture multi-spatial distribution patterns of POIs that were represented by different modal POI embeddings. Subsequently, random forest model was leveraged to classify UFZs based on those embeddings. A set of combination experiments were designed for performance validation. The results show that our proposed method can effectively identify UFZs with an accuracy of 72.9%, with an improvement of 8.5% compared to the baseline methods. The outcome of this study will help urban planners to better understand UFZs through investigating the integrated spatial distribution patterns of POIs embedded in UFZs.
1. Introduction
Urban Functional Zones (UFZs) refer to the basic geographical units that aggregate local socio-economic attributes in cities, expressed as different land use categories (e.g. residential, industrial, and commercial). UFZs usually engage the characterized types of human social activities. While cities are open and complex giant systems (Batty Citation2008), there exist inevitable deviations between regional planning policies and actual resource allocation in the urbanization process. Appropriately identifying UFZs can help policy-makers better understand the urban functional structure before making decisions and further optimize urban planning, promoting the coupling of the human-land system and the sustainable development of city (Sun et al. Citation2013; Feng et al. Citation2019; Huang and Wang Citation2019; Yu et al. Citation2021; Zhang et al. Citation2022; Zheng et al. Citation2022).
Traditional methods of exploring urban functions mainly relied on the cadastral census data, which had the shortcomings of high subjectivity, high cost, and poor timeliness (Liu et al. Citation2021). With the rapid development of global urbanization (Berry Citation2008; Ritchie and Roser Citation2018), traditional data cannot meet the demand of mining urban texture and socio-spatial structure. As the remote sensing technology emerged, a large number of studies attempted to analyze optical remote sensing images (Zhou et al. Citation2020; Du et al. Citation2021;Lu et al. Citation2022), nighttime lighting images (Huang, Zhao, and Song Citation2018; Gong et al. Citation2020; Huang et al. Citation2021), microwave remote sensing images (Tu et al. Citation2020; Zong et al. Citation2020), LiDAR data (Zhang et al. Citation2017a; Sanlang et al. Citation2021), multi-angle remote sensing images (Huang et al. Citation2021), and other remote sensing data have been used to identify UFZs and delineate the spatial patterns or functional expression of UFZs. The spatial morphological characteristics of UFZs can be captured from the explicit physical features such as geometric, spectral, texture, and radar scattering coefficients of remote sensing data, but the socio-economic characteristics lacked. As such, it is difficult to accurately distinguish the socio-economic UFZs using remote sensing data only.
In recent years, urban big data has driven new research practices in UFZ identification. Mobile phone data (Tu et al. Citation2017; Dong, Wang, and Liu Citation2021; Zhang et al. Citation2021b), GPS trajectory data (Houssou, Guillaume, and Prigent Citation2019; Du et al. Citation2020; Hu et al. Citation2021), traffic smart card data (Long and Shen Citation2015), social media data (Huang et al. Citation2020; Wen and Li Citation2021; Mawuenyegah, Li, and Xu Citation2022), street view data (Li, Zhang, and Li Citation2017; Cao et al. Citation2018; Ye et al. Citation2021), Point of Interest (POI) data (Jiang et al. Citation2015; Bao et al. Citation2017; Gao, Janowicz, and Couclelis Citation2017; Yao et al. Citation2017; Chen et al. Citation2018; Zhang et al. Citation2018; Zhai et al. Citation2019; Zhang et al. Citation2019; Andrade, Alves, and Bento Citation2020; Bao et al. Citation2020; Gong et al. Citation2020; Xu et al. Citation2020; Zong et al. Citation2020; Cai Citation2021; Gao, Janowicz, and Couclelis Citation2017; Hu et al. Citation2021; Niu and Silva Citation2021; Qian et al. Citation2021; Sun et al. Citation2021; Wang et al. Citation2021; Wu et al. Citation2021; Xu et al. Citation2021; Zhang et al. Citation2021b; Zhang et al. Citation2021c; Lu et al. Citation2022; Qin et al. Citation2022), and other social-sensing data have been used by many scholars to explore the socio-spatial structure of cities and the functional semantics of regions. Among them, POI data is one of the most popular and accessible sources of social sensing data for urban computing (Andrade, Alves, and Bento Citation2020), carrying abundant semantics of socio-economic information. In addition, POI data is less biased compared with other types of data with biased sampling, e.g. social media data is biased towards the younger generation, and mobility data is biased towards certain areas.
A variety of methods have been used in the existing POI-based studies to identify UFZs, such as predefining rules (Song et al. Citation2018) and extracting low-level features (e.g. frequencies) of POIs to roughly identify UFZs using machine learning methods (Jiang et al. Citation2015; Hu et al. Citation2016; Gong et al. Citation2020; Tu et al. Citation2020; Zong et al. Citation2020). These methods missed the relation between POI data and regional socio-economic characteristics. Natural Language Processing (NLP) methods are promising solutions to understand the potential relation between POI data and socio-economic characteristics from a textual description perspective and have been increasingly used for UFZ identification (Chen, Xu, and Gong Citation2021). Corpus generally refers to a substantial collection of organized texts in the NLP domain (Ng and Zelle Citation1997). Correspondingly, geo-corpus is constructed with geospatial data (e.g. POI data used in this work) under specific sampling strategies within a region. As such, NLP methods can effectively paraphrase the potential relation between POI data and regional socio-economic characteristics in a geo-corpus (i.e. urban functions of a region), which is similar to understanding the relation between words and sentences or paragraphs in a corpus. Earlier studies mainly tried Term Frequency-Inverse Document Frequency (TF-IDF) (Yuan, Zheng, and Xie Citation2012; Yuan et al. Citation2015; Qian et al. Citation2021), Latent Dirichlet Allocation (LDA) (Yuan, Zheng, and Xie Citation2012; Yuan et al. Citation2015; Chen, Huang, and Xu Citation2017; Xing and Meng Citation2018; Chang et al. Citation2020a), and other topic models to infer regional functional semantics and achieved higher accuracy compared to the aforementioned methods. However, the adapted Bag-of-Words (BOW)-based geo-corpuses constructed by those NLP methods are unordered, which lack the sequential and contextual information. The unordered means that there is no order or sequence among the words in the BOW-based geo-corpus, which is similar to the unordered things in a bag. In contrast, the sequential and contextual information refers to the order and sequence of words within documents. Since different sequences and contexts of words result in the different meanings of the words and even the whole document, the sequences of POIs in a geo-corpus affects understanding the urban functions of the zone to which the above-mentioned geo-corpus corresponds. In other words, they ignore the spatial relation and spatial interaction of POIs, which is helpful to capture the spatial heterogeneity of UFZ semantics and plays an important role in accurately identifying UFZs. For instance, it is difficult for the topic model to distinguish two categories of UFZs with similar POI statistical frequency features but different spatial distributions. As such, it is important to take the sequential and contextual information of POIs into consideration for UFZ identification.
The spatial distribution patterns of POIs show how POIs distribute in space in terms of their geographical locations. The pattern can be used to determine how POIs are related to the socio-economic characteristics and functions of UFZs. In other words, POIs are spatially dependent on the neighboring POIs as well as some geographical objects. For instance, POIs of the commercial type tend to be distributed near the streets, POIs of residential type tend to be distributed around the center of UFZs, and POIs of kindergarten type tend to be distributed around the POIs of residential type. The spatial distribution patterns of POIs can be determined by specific sampling strategies in this work. To take the spatial distribution patterns of POIs into consideration for UFZ identification, POI spatial relation-based geo-corpus construction approaches have been utilized. They capture the corresponding spatial distribution patterns depending on specific POI sampling strategies. In practice, Yao et al. (Citation2017) constructed geo-corpus based on the greedy algorithm that calculates the order of POIs by returning the shortest distance among them, which captures the local spatial co-occurrence distribution information of POIs. The Word2Vec model was introduced to embed regional geo-semantics by training the geo-corpus, following which a random forest classifier was trained to identify UFZs. Similar approaches were adopted by Xiang (Citation2020) and Yang et al. (Citation2022) to construct geo-corpus, and yielded regional feature vectors in combination with Word2Vec model for UFZ identification. Different attempts have been made for constructing geo-corpuses using the distance-based sampling strategies. Zhai et al. (Citation2019) used each POI as a sampling point to search for the surrounding K-nearest POIs to construct geo-corpus, enhancing the spatial context with Information Theoretic, Distance Lagged (ITDL). Sun et al. (Citation2021) used the centroid of each parcel as the sampling point and sequentially sampled POIs within the parcel based on point pair distances to construct geo-corpuses to train Word2Vec model. Niu and Silva (Citation2021) used random points generated based on roads as sampling points, sequentially sampled the POIs in the buffer of each sampling point according to the point pair distances, and aggregated the POIs sequences in each parcel into documents to construct geo-corpus for training Doc2Vec model to identify UFZs. Recently, the network-based sampling strategies were adopted to construct geo-corpuses to capture the spatial distributions of POIs. Huang et al. (Citation2022) sampled POIs by spatially explicit random walk in a network structure, and captured both local and long-range spatial co-occurrence distribution patterns of POIs.
Although the aforementioned studies attempted to construct geo-corpuses with different POI sampling strategies to achieve excellent performance for UFZ identification supported by powerful NLP models, there still exist certain shortcomings. The single-spatial distribution pattern of POIs refers to the spatial distribution pattern which captured by a single geo-corpus. It is difficult to accurately portray UFZs using the information dominated by a single-spatial distribution pattern of POIs. In contrast, the multi-spatial distribution patterns of POIs refer to multiple spatial distribution patterns which are captured by multiple geo-corpuses. The fusion of multi-spatial distribution patterns of POIs is likely to provide more comprehensive information to portray UFZs. In addition, similar to the semantics of words being influenced by context, the geo-semantics of UFZs are also influenced by the spatial interactions of POIs. The interaction strength between different types of POIs inevitably varies, which is also a problem ignored in existing studies. The interaction strength between different types of POIs refers to the extent a POI spatially interacts with different POIs. Normally, the interaction strength is closely related to the social influence of POIs. The greater the social influence of POIs, the higher the interaction strength. In other words, those POIs with high social influence usually have a large area they potentially interact with other POIs in space (i.e. high interaction strength). The social influence was computed by the Baidu search platform in this work. For instance, the POIs of university type usually have a higher interaction strength with other POIs compared to the POIs of phone booth type since the social influence of a university is larger than a phone booth, and further resulting in a richer context for the POIs of university type. Furthermore, the contribution of different geo-corpus-dominated POI spatial distribution patterns to UFZ identification is unclear.
To fill the above research gaps, this study proposed a UFZ identification method by capturing multi-spatial distribution patterns of POIs. First, we develop a geo-corpus construction approach that takes POI spatial interaction into account, and introduce three existing geo-corpus construction approaches to obtain UFZ embeddings with Word2Vec model. The POI spatial distribution information of UFZ embeddings is enhanced by feature combination. By testing the UFZ identification performance of UFZ embeddings under different feature combination modes, it reveals which spatial distribution pattern of POIs contributes the most. The main contributions of this study are summarized as follows.
A geo-corpus construction approach that takes POI spatial interaction into account and can interpret POI data into an effective geo-corpus.
A UFZ identification method that can effectively enhance the semantic information of UFZ embedding by capturing multi-spatial distribution patterns from several geo-corpuses.
A performance evaluation of the contribution of different spatial distribution patterns and their different combination modes to UFZ identification.
This study contributes to understanding urban spatial structure and identifying UFZs through measuring the spatial distribution patterns of POIs, which provides references for urban decision makers and planners.
The remaining sections of this paper are organized as follows. Section 2 describes the study area and experimental data. Section 3 introduces the methodological workflow and details. The results of all experiments are demonstrated and discussed in Section 4. Finally, we conclude the study and provide recommendations for future work in Section 5.
2. Study area and data description
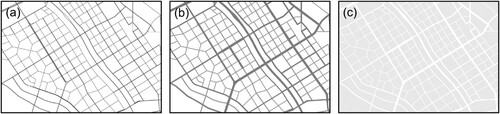
The area within the fifth ring road of Beijing, China, was chosen as our study area (). Beijing is the political, scientific, cultural and educational center and one of the most developed cities in China. Beijing is a complex urban system with various functions with regard to the urban land use structure, making it a good area for UFZ studies.
Figure 1. (a) The spatial distribution of the POI data and the road data. (b) Overview of the study area. (c) The spatial distribution of the POI kernel density. (d) The spatial distribution of three levels of the road network.
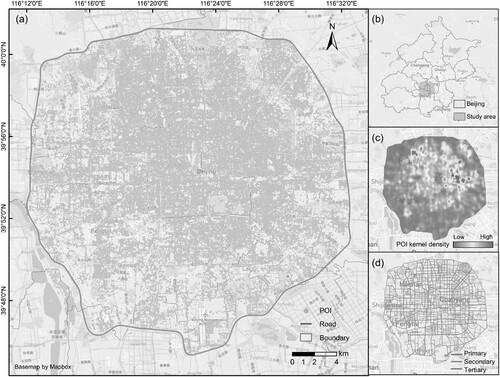
Two types of data in the study area were used in this study, namely road network data and POI data.
Road network data is vector line data, which represents urban roads such as primary roads, secondary roads, and tertiary roads. It is usually used in studies to portray urban texture and constrain urban geographical units. The road network data for this study ( [a, d]) was acquired from the open-source platform Open Street MapFootnote1 (OSM). OSM is currently the most popular source of urban road data, and it is a crowdsourcing project with the advantages of fast data updates, free access, high data quality and other advantages (Wang et al. Citation2013; Hong and Yao Citation2019).
POI data is vector point data used to simplify the expression of geographic entities in the city. POI data labels naturally carry rich socioeconomic semantic information, which can reflect human urban socioeconomic activities. In practice, POI data can be effectively and reliably used in UFZ identification studies (Gong et al. Citation2020; Cai et al. Citation2022; Xu et al. Citation2022; Yang et al. Citation2022).
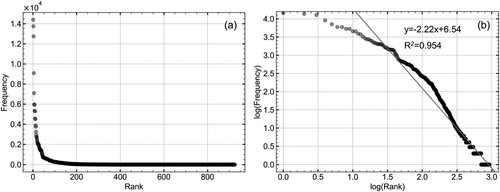
The POI data for this study ( [a, c]) was obtained in 2018 through the application program interface of AmapFootnote2 (a.k.a. Gaode map), one of the largest map service providers in China, which can supply POI data with comprehensive coverage. Each POI has multiple attributes, including name, geographic coordinates, detailed address, and three levels of types (Big-type, Mid-type, and Sub-type). By counting the POI Sub-types and their frequencies of the raw POI dataset, its rank-frequency distribution presents a long tail ( [a]). It has been demonstrated that natural language follows a power-law distribution (Li Citation2018). In order to investigate whether POI data is suitable to be processed using NLP technology in our case, we further fit the POI data with a rank-frequency distribution as a line with a high coefficient of 0.954 after transforming POI data to a logarithmic coordinate ( [b]). It reveals that this POI dataset follows a power-law distribution, which is similar to the natural language. This indicates the feasibility of combining NLP technology with POI data for UFZ identification in this study.
Figure 2. Rank-frequency plot for POI Sub-types. (a) Rank-frequency plot and (b) Rank-frequency log plot.
3. Methodology
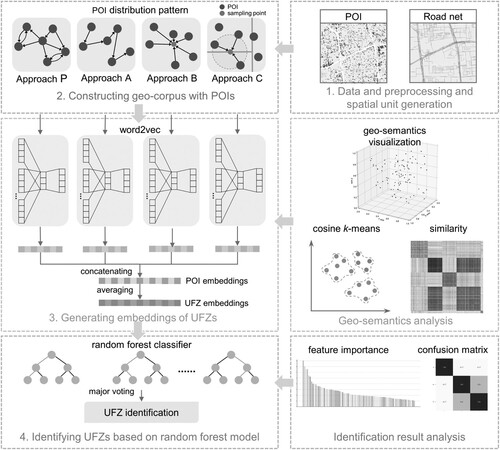
The overall framework of this study is illustrated in , which consists of four main steps. (1) Data preprocessing and spatial unit generation. The raw POI data and road network data were first preprocessed, based on which the spatial units were generated. (2) Constructing geo-corpus with POIs. POIs were mapped to the corresponding spatial units, and four different geo-corpuses were constructed according to the corresponding approaches to capture different POI spatial distribution patterns. (3) Generating embeddings of UFZs. The Word2Vec model was trained on the four geo-corpuses to learn the POI embeddings. The UFZ embeddings were obtained by averaging the sum of the internal POI embeddings of each UFZ. t-SNE dimension-reduction algorithm and K-means clustering algorithm were further implemented to investigate whether the embeddings generated by the proposed method were effective and applicable. (4) Identifying UFZs based on random forest model. The categories of UFZs were obtained by classifying the UFZ embeddings using the random forest model. The confusion matrix was used to evaluate the accuracy of the classification results. Furthermore, a set of combination experiments were designed to explore the contribution of each geo-corpus construction approach to the UFZ identification results.
Figure 3. An overall framework of the proposed approach.
3.1. Data preprocessing and spatial unit generation
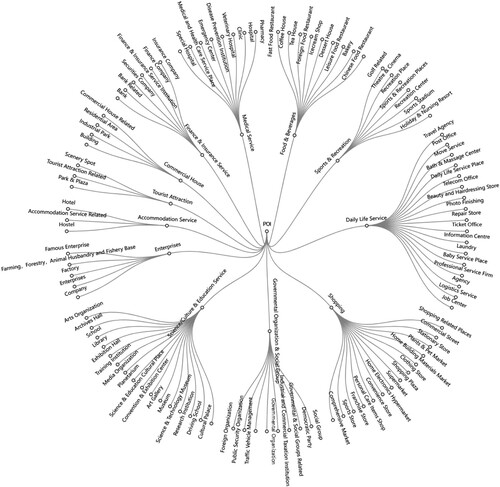
We cleaned the raw POI data, including removing duplicate POIs, eliminating POIs with missing attributes, and eliminating POI types that were not meaningful to UFZ (e.g. place names and addresses). Ultimately, over 240,000 POIs in the study area were obtained. The specific Big-type and Mid-type of POIs and their hierarchical relationships are shown in .
Figure 4. POI taxonomy tree map for 12 Big-types with 100 Mid-types.
Irregular parcels based on the spatial segmentation of road networks is the most popular method for generating spatial units among UFZ studies. The urban road network guides the development of urban spatial structure and fits the realistic urban form. In this study, we segmented the urban space based on road network to generate the spatial units for UFZ analysis and aggregating POI data for geo-corpus construction. In this study, we referred to the method of Liu and Long (Citation2016) to obtain spatial units, which consists of the following three steps (see ).
Road network data pre-processing. We selected the original OSM road categoriesFootnote3, i.e. ‘motorway’, ‘trunk’, and ‘primary’ as primary roads, ‘secondary’ as secondary roads, and ‘tertiary’ as tertiary roads to generate parcels. The ‘unclassified’ and ‘residential’ roads were deleted because they were considered to be the weakest socio-economic carrying capacity of the road network. Subsequently, all overhanging roads were extended until the topology could be connected. Those roads that were extended more than 100 m but still overhanging and independent were deleted.
Road expansion. Buffer zones of different distances were calculated for each road to represent the road space instead. The buffer distance was set according to Zhang et al. (Citation2017b), which was set to 40 m (rendered in red in [b]), 20 m (rendered in green in [b]), and 10 m (rendered in blue in [b]) for the primary roads, secondary roads, and tertiary roads, respectively.
Road space removal. By removing the road space from the urban geographic space, we finally obtained irregular spatial units.
Figure 5. Obtaining spatial units based on road network.
3.2. Constructing geo-corpus with POIs
Inspired by Yuan, Zheng, and Xie (Citation2012), the geo-corpus was analogized to a corpus in natural language, and we considered each UFZ as a separate document. Considering the POI Sub-type is complex and redundant for identifying UFZs (Hu et al. Citation2020; Huang et al. Citation2022) and the POI Big-type contains too little information, we treated the Mid-types of POIs as words, and transformed the spatial location of POIs into textual organization structure. We assumed that the occurrence of spatial interaction between POIs within their influence area can be analogous to the semantic interaction between words and their context. The influence area was determined by the social influence of the POIs, e.g. a university is supposed to interact spatially with wider other POIs than a phone booth. Based on the above ideas, we developed a new approach for geo-corpus construction considering the spatial interaction between POIs, which consists of two stages, namely the constructing stage and the formatting stage (). The constructing stage mainly follows the following three steps.
Figure 6. The process of the proposed geo-corpus construction approach.
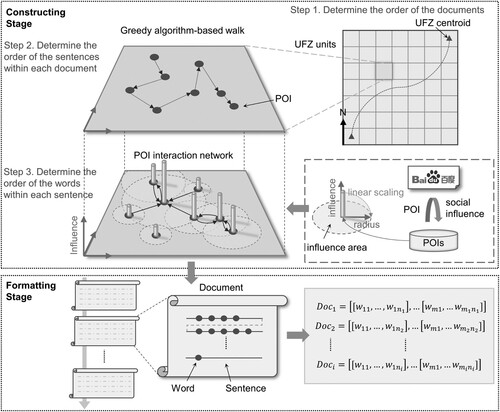
Step 1. Determining the order of the documents (i.e. UFZs). First, we calculated the pairwise distances between centroids of all spatial units. The pair of centroids composing the largest distance (denoted as ,
) were taken as the endpoints of the UFZ sequence. The greedy algorithm-based shortest path method (Yao et al. Citation2017) can associate the POIs and UFZs in an effective organized form based on their spatial relation. This method was adopted to obtain the sequential sequence of all UFZs (i.e.
) by calculating the shortest sequence from one endpoint to another endpoint via other UFZ centroids.
Step 2. Determining the order of the sentences within each document. In this step, each POI was used to label a separate sentence. For , the sequence of sentences within it,
, was obtained following the similar calculation process of Step 1. The iterative calculation yielded the sequence of sentences for all UFZs.
Step 3. Determining the order of the words within each sentence. According to the above, each POI interacts spatially with other POIs in its influence area. The spatial interaction is usually realized by urban roads. Considering that the roads in Beijing are generally oriented north–south and east–west, the POIs in its influence area were sampled sequentially based on Manhattan distance. The specific influence area of each POI is supposed to be aligned with the social influence area of each POI. Inspired by Liu et al. (Citation2020a) and considering that the Baidu search platform is one of the most popular search engines in China, we searched the Baidu entries of each POI Mid-types (i.e. ‘Mid-types’ ‘Beijing’) through web crawler technology, and the number of returned search results was regarded as its social influence in Beijing. Subsequently, the social influence of all POI Mid-types was linearly scaled to the interval of 100-300, which was transformed into an influence distance of 100m-300 m. Each POI in the UFZ was treated as a sentence sampling point and a sample point (i.e. a word) for making up other sentences. By calculating the point-pair distance between the sampling point and other POIs, a POI sequence (i.e. a sentence) was arranged in ascending order of point-pair distance. For the m-th sentence in the i-th document, the sampling yields its word sequence as . As POIs interact within the same UFZ or with different UFZs, we take both POIs within the same UFZ and POIs in different UFZs into account in this sampling step. The sentences of each document were then obtained.
Formatting stage: As a result of the constructing stage, we established sequential relationships between documents, sequential relationships between sentences in each document, and sequential relationships between words in each sentence. Eventually, the geo-corpus of the study area was constructed from the above structural information and converted it into text form.
In order to enhance the POI spatial distribution information and approximate more realistic geo-semantics of UFZ, three state-of-the-art geo-corpus construction approaches proposed by Yao et al. (Citation2017) (denoted as Approach A), Sun et al. (Citation2021) (denoted as Approach B), and Niu and Silva (Citation2021) (denoted as Approach C), which are described in Section 1, were used for subsequent combination experiments and as baseline approaches to compare with our proposed approach. The dominant POI spatial distribution patterns captured by the four geo-corpus construction approaches are elaborated as follows.
Pattern P: Our proposed approach, i.e. Approach P, captures the spatial distribution information of POIs by considering the spatial dependency as well as the interaction strength between different types of POIs. The spatial distribution pattern of POIs captured by Approach P is denoted as Pattern P.
Pattern A: As illustrated in (a), Approach A (Yao et al. Citation2017) searches the nearest neighbor POIs based on the greedy algorithm to capture the local spatial co-occurrence distribution information of POIs. The spatial distribution pattern of POIs captured by Approach A is denoted as Pattern A.
Figure 7. Schematic diagram of the geo-corpus construction approaches. (a) Approach A. (b) Approach B. (c) Approach C.
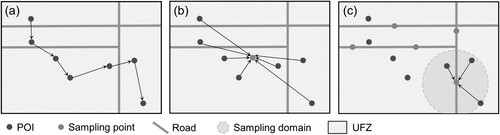
Pattern B: As illustrated in (b), Approach B (Sun et al. Citation2021) selects the centroid of each UFZ as the sampling point, and captures the spatial distribution information regarding the POI-to-UFZ tendency, i.e. whether different types of POIs tend to be deployed in the centroid or periphery of UFZs. The spatial distribution pattern of POIs captured by Approach B is denoted as Pattern B.
Pattern C: As illustrated in (c), Approach C (Niu and Silva Citation2021) randomly selects points that are evenly distributed on the road within UFZs as sampling points, and captures the spatial distribution information regarding the POI-to-road tendency, i.e. for each category of UFZ, whether different types of POIs tend to be deployed closer to the road or distant from the road. The spatial distribution pattern of POIs captured by Approach C is denoted as Pattern C.
3.3. Generating embeddings of UFZs
3.3.1. Generating POI embeddings with Word2Vec model
Word2Vec is a neural language model (Mikolov et al. Citation2013a) that can embed the geo-semantics of POI into a high-dimensional semantic space (Yao et al. Citation2017). The Word2Vec model contains two types of neural network architecture, which are Continuous Bag-of-Words (CBOW) and Skip-Gram (SG). Compared with the SG architecture, the CBOW architecture is easier to learn POI spatial contextual features (Yu and Dredze Citation2014; Yao et al. Citation2017). Therefore, the CBOW architecture was chosen to train the geo-corpus in this study. The CBOW architecture predicts the current POI through contextual POIs within a window (Mikolov et al. Citation2013b). In short, its objective is to maximize the average log probability to predict the central POI within the given context (EquationEquation 1(1)
(1) ).
(1)
(1) where T refers to the size of the geo-corpus.
is the i-th central POI,
is a context POIs set obtained based on
and the sampling window c.
The conditional probabilities is calculated using the softmax function as follows:
(2)
(2) where E is an energy function and is calculated with
.
The model training process used the stochastic gradient descent algorithm to obtain the optimal embeddings of POIs. The four modal POI embeddings were learned by training the four geo-corpuses constructed in Section 3.2. As mentioned earlier, the construction strategy of each geo-corpus can capture a single spatial distribution pattern of POIs. This means, the embeddings learned based on different geo-corpuses can convey the corresponding main POI spatial distribution information.
Differing from the linear context of words in natural languages with only forward and backward directions, the actual spatial context of POIs are coupled by multi-spatial distribution patterns. The embeddings that incorporate more spatial distribution information are closer to the realistic geo-semantics. It is assumed that the embeddings of type i POI learned based on the four constructed geo-corpuses are ,
,
,
. Subsequently, the combination of the four modal embeddings was implemented based on vector concatenation. The combined embeddings of type i POIs can be described as
. Finally, this approach yielded the embeddings of all POIs, representing their geo-semantics.
The t-Distributed Stochastic Neighbor Embedding (t-SNE) is a reliable dimension-reduction algorithm (Maaten and Hinton Citation2008), which is generally better than other algorithms (e.g. principal component analysis) for high dimensionality (Liu et al. Citation2020b). We used the t-SNE algorithm to project the embeddings of each POI Mid-types from a high-dimensional semantic space to a three-dimensional sub-semantic space for visual analysis (Liu et al. Citation2020b; Zhang et al. Citation2021c; Huang et al. Citation2022). Theoretically, POIs with similar functions in space own similar angles and orientations in the semantic space (Yao et al. Citation2017). In other words, POIs with similar geo-semantics are closer in the semantic space. This can be used to validate the effectiveness of POI combined embeddings for distinguishing UFZ semantics.
3.3.2. Generating UFZ embeddings
Previous studies have shown that the geo-semantics of a UFZ can be effectively depicted by a weighted average vector of all POIs within the UFZ (Yao et al. Citation2017; Yang et al. Citation2022). Thus, the embeddings of the UFZ are obtained by averaging the embeddings of all POIs enclosed. The embeddings representing the geo-semantics of the j-th UFZ can be mathematically defined as follows.
(3)
(3) where POIEi,j refers to the embeddings of i-th type POI in j-th UFZS, and N is the number of POIs in j-th UFZ.
Ultimately, we obtained the embeddings of all UFZs in the study area by EquationEquation 3(3)
(3) . Cosine similarity was used to measure the geo-semantic similarity between UFZs. The cosine similarity between two UFZs is calculated from their embedding as follows.
(4)
(4) where Xi and Yi refer to their corresponding UFZ embeddings.
In order to confirm the availability of UFZ embeddings for subsequently feeding the classifier to identify UFZs, it is crucial to test the semantic discrimination of UFZ embeddings and whether the geo-semantics of UFZ embeddings representation are correlated with the actual UFZ functional categories.
Based on the pairwise geo-semantics distance (i.e. cosine distance, which is equal to one minus the cosine similarity) of UFZs, K-means algorithm was used to implement clustering of the UFZ embeddings with similar geo-semantics. Exploring whether UFZ embeddings have an explicit clustering pattern helps verify the semantic discrimination of embeddings. Meanwhile, whether the clustering pattern is consistent with reality verifies whether there is a correlation between the geo-semantics of UFZ embeddings representation and the actual UFZ functions. Silhouette coefficient (Rousseeuw Citation1987) was used as a criterion to determine the optimal prior parameter K for the K-means algorithm. Given a UFZ embedding i, the average distance between i and other UFZ embeddings in the same class is denoted as , and the average distance between i and all UFZ embeddings in the next closest class is denoted as
, then the silhouette coefficient can be calculated as follows:
(5)
(5) The silhouette coefficient of the clustering results was obtained by averaging the silhouette coefficient of all UFZ embeddings. The range of silhouette coefficient is [−1, 1], and the higher values (close to 1) indicate the better clustering results.
3.4. Identifying UFZs based on random forest model
3.4.1. Random forest classification
The random forest (RF) model is an ensemble learning algorithm consisting of multiple uncorrelated decision trees, which can well avoid overfitting and variable correlation problems (Breiman Citation2001). It has been widely used for UFZ classification (Du, Zhang, and Zhang Citation2015; Yao et al. Citation2017; Zhang et al. Citation2017b; Xing and Meng Citation2018; Chang et al. Citation2020b; Niu and Silva Citation2021; Wu et al. Citation2021). In this study, the RF model was used to learn the relationship between UFZ embeddings and urban functional categories to implement classification of all UFZs.
For the set of N UFZs with features (i.e. UFZ embeddings) of dimension M, the Bootstrap aggregating (i.e. Bagging) method was used to randomly sample them with put-back. All trees were pruning-free trained on a randomly selected set of samples. Due to the Bagging sampling method, about 1/3 of the samples were unsampled out-of-bag (OOB) data. The OOB error was used to represent the generalization error of the decision tree.
We optimized the random forest model by balancing the two critical parameters, namely max_features and n_estimators. The max_features refers to the number of features used at each node to generate a tree. The n_estimators refers to the number of trees. The grid search method based on the OOB accuracy was used for RF parameter optimization. The optimal combination of parameters was used to train the model, and the major voting of all decision trees inside the trained model was taken as the final UFZ classification result.
3.4.2. Gini index for feature importance analysis
Although the corresponding UFZ classification was achieved for the combined embeddings by the trained RF model, the contribution of each modal features to the classification in the combined embeddings needed further discussion, which helped us to assess the different impacts of POI spatial distribution patterns on the geo-semantics of UFZs. This study quantified the importance of feature variables on the classification of the RF model based on the Gini index (Strobl, Boulesteix, and Augustin Citation2007; Du, Zhang, and Zhang Citation2015). For a given feature variable, its feature importance is equal to the average decrease of Gini after the split of this feature node. The Gini index can be defined as follows.
(6)
(6) where k represents the k-th category and
refers to the probability of a sample belonging to category k.
3.4.3. Validation
The ground truth (i.e. actual categories of UFZs) are crucial to validate our method and the training of the RF model. Referring to the classification of urban land in the ‘Code for classification of urban and rural land use and planning standards of development land (GB50137)’, which was issued by the Ministry of Housing and Urban-Rural Development of China in 2011, the UFZs in the study area are divided into five categories, namely, residential zone (R, land for residential and corresponding service facilities), industrial zone (M, land for industrial and mining enterprises), administrative and public service zone (A, land for administrative, cultural, educational, scientific research, sports, health, and other institutions and facilities), and business zone (B, land for commercial, business, entertainment and recreation facilities), and green space (G, public open space such as park green space, protective green space, and plaza). Referring to the Baidu e-mapsFootnote4 (including street view image layer and high-resolution remote sensing image layer) that was accessed in 2022, the ground truth of each UFZ was manually labeled as the above five UFZ categories. With regard to the inevitable mixed functional zones (Dovey and Pafka Citation2017), we labeled their functional categories based on the dominant functional category within the UFZs.
In this study, the confusion matrix was used to evaluate the classification results, while four metrics, namely Overall accuracy (OA), Kappa coefficient (Kappa), Producer's accuracy (PA), and User's accuracy (UA) to quantify the results accuracy from four aspects. OA indicates the ratio between the number of correctly classified UFZs and the overall number of UFZs, and measures the probability that for each random UFZ, the UFZ classification result is consistent with the ground truth. Kappa evaluates the consistency between the overall UFZ classification results and the ground truth. PA indicates the conditional probability that the classification result is consistent with a random sample of the actual UFZ sample. UA indicates the conditional probability of a random UFZ sample in the classification results whose functional category is consistent with the ground truth.
To further assess the effects of different POI spatial distribution patterns on UFZ geo-semantic representations under different coupling mechanisms, a total of 15 combination experiments were designed in this study (see ). Different combination strategies were tried for four modal POI embeddings learned based on different geo-corpuses to calculate the corresponding UFZ embeddings. The four combination modes include single feature mode (Mode 0), two-two feature combination mode (Mode 1), three-three feature combination mode (Mode 2), and four-four feature combination mode (Mode 3), corresponding to experiment 1∼4, 5 ∼10, 11∼14, and 15.
Table 1. Experiments design based on four combination modes.
4. Results and discussion
This study used Python 3 and ArcGIS 10 on Windows 10 (×64) to implement the experiments. GeopandasFootnote5 for Python and ArcGIS were used for geoprocessing, including generating spatial units and constructing geo-corpus. PandasFootnote6 for Python and NumpyFootnote7 for Python were used for scientific calculations. GensimFootnote8 for Python was used to run the Word2Vec models. Scikit-learnFootnote9 for Python was used to conduct machine learning algorithms such as RF classification, t-SNE dimensionality reduction, and K-means clustering.
Using the method described in Section 3.1, the study area was segmented into 1,258 irregular parcels by the road network, which were used as spatial units of the UFZs.
4.1. POI embeddings
Based on the approaches introduced in Section 3.2, the POIs in geographic space were transformed into the corresponding four different sets of texts with contextual information, i.e. four geo-corpuses. Among them, sentences with less than three words (POIs) were removed from the geo-corpuses to avoid the sparse meaning and randomness generated by short sentences (Niu and Silva Citation2021), and documents without sentences (spatial units) were excluded in this study. Subsequently, each geo-corpus was used independently to train the Word2Vec model.
With regard to the deployment of the Word2Vec model, we set the output vector dimension to 20 (Niu and Silva Citation2021), the size of the context window to 3, and the number of epochs to 500, keeping the default settings of the Python library for the other parameters.Footnote10 We learned four modal POI embeddings from the four geo-corpuses, representing the geo-semantics of POIs under the influence of different spatial distribution patterns. Subsequently. The four modal embeddings were features combined based on the method described in Section 3.3.1, and finally, the POI embeddings fusing the four spatial distribution information were obtained.
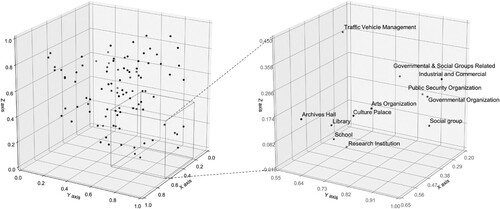
Subsequently, we deployed the t-SNE dimension-reduction algorithm to visually analyze the POI embeddings. We set the hyperparameters of t-SNE including perplexity to 6.5, iteration number to 10000, n_components to 3, and other parameters to keep the default settings of the Python library.Footnote11 With the t-SNE algorithm, POI embeddings were mapped into a three-dimensional sub-semantic space (). It shows that the POIs with close distance in the sub-semantic space, of which the Mid-types labels also exhibit similar functional attributes. For example, the right side of shows the semantic relationship and the actual types of POIs in the local space. It can be seen that POIs are distributed in two clusters in the lower left and upper right corners. The POIs in the lower left corner all refer to education and culture related functions (e.g. Archives Hall, Library, School, and Research). The POIs in the lower left corner indicate educational and cultural related functions (e.g. Archives Hall, Library, School, Research Institution, Culture Palace, and Arts Organization), and the POIs in the upper right corner are almost all governmental organization services (e.g. Governmental and School Groups Related, Public Security Organization, Governmental Organization, Social group, and Traffic Vehicle Management). The POIs in these two groups are generally oriented towards public services. This is consistent with our assumption that if the geographic attributes of POIs are similar, their semantic distance is close. Therefore, the obtained POI embeddings can effectively represent the geo-semantics of POIs and be further used to represent UFZ embeddings.
Figure 8. POI-type semantic subspace with a local space.
The static POI embeddings trained by the Word2Vec model fixed the geo-semantics of POIs, while the dynamic geo-semantics would be more applicable to the different geo-semantics represented by POIs in different spatial contexts, i.e. the actual geo-semantics of POIs may be different in different configuration environments. The Bidirectional Encoder Representation from Transformer (BERT) model of NLP technology will be considered to further explore the POI dynamic geo-semantics in the future.
4.2. UFZ embeddings
The UFZ embeddings corresponding to 878 spatial units were calculated from 1,258 spatial units by EquationEquation 3(3)
(3) . Those 380 spatial units with sparse data were not enough to learn UFZ embeddings and were excluded from the study. Subsequently, we calculated the cosine similarity between all pairwise UFZ embeddings corresponding to the 878 spatial units based on EquationEquation 4
(4)
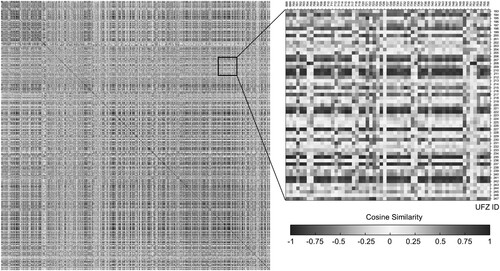
(4) to measure the geo-semantic similarity between two UFZs. In other words, the more similar the functional attributes between two UFZs are, the higher the cosine similarity is (close to 1). As shown in , we retrieved the pairwise geo-semantics similarity between UFZs.
Figure 9. The pairwise similarities between UFZs.
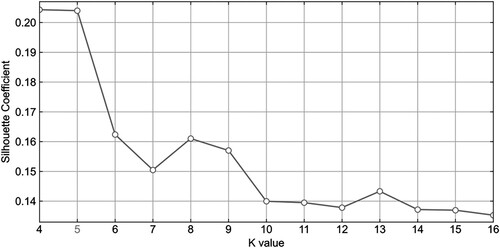
Subsequently, the UFZs were clustered using the K-means algorithm based on the cosine similarity that had been obtained between all UFZs. The K values were set from 4 to 16 for the silhouette coefficient to test the performance. As shown in , the highest silhouette coefficient was returned when K = 4 and 5, indicating that this is the optimal K value to achieve better clustering results. Considering that the UFZ in this study was divided into five categories, K = 5 was chosen for further analysis and validation.
Figure 10. Changes of clustering effect of different K values.
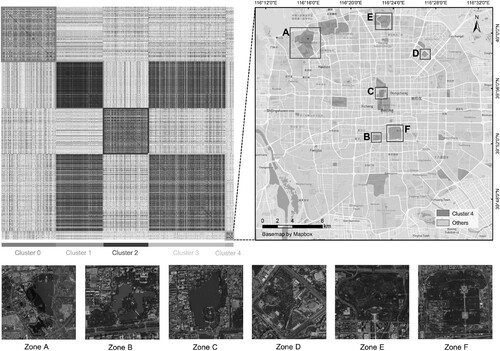
Based on the K-means algorithm, the UFZs were grouped into five clusters. We reordered by the corresponding clusters of UFZs. As shown in , the pairwise similarity distribution pattern of UFZs is consistent with the clustering results of K-means, presenting as five red matrices on the diagonal and corresponding to the five clustering categories. The results reveal that the UFZs within the same cluster have high similarity in geo-semantics and differ significantly from those UFZs enclosed by other clusters. The ground truth from Baidu e-maps supports such observation. For instance, we randomly selected six sample zones (i.e. Zone A∼F) from cluster #4, and after comparing them with Baidu e-maps, Zone A∼F corresponded to six famous locations in Beijing, namely Summer Palace, Taoranting Park, Beihai Park, Taiyanggong Park. The results of K-means show that our UFZ embeddings are semantic discriminative and able to represent the actual UFZs. However, K-means as an unsupervised method cannot explain the explicit functional categories of each cluster directly. Supervised classification methods based on the training data are considered for further identification of UFZs.
Figure 11. The pairwise similarity between UFZs ranked by K-means-based cluster, and locations and remote sensing images of the six sample zones in cluster #4.
4.3. UFZ identification
4.3.1. Classification results
The above results show that UFZ embeddings can be effectively used for the RF model to implement UFZ classification. The overall dataset of UFZ embeddings with ground truth labels was randomly split into two datasets with the ratio of 7:3, which were used as the training set and the test set, respectively. The training set was used for model tuning and model training, and the test set was used to evaluate the classification accuracy.
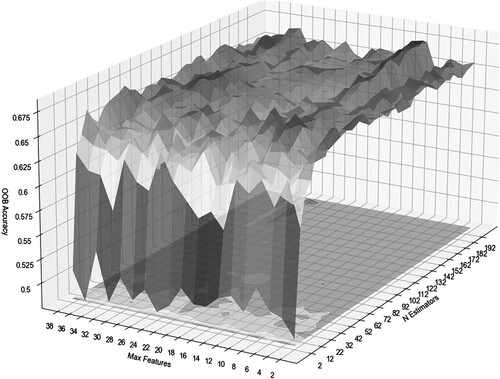
First, we deployed the grid search method to build the optimal model. We set max_features from 2 to 40 with an interval of 2, n_estimators from 2 to 200 with an interval of 5 and calculated the OOB accuracy of all parameter combinations by 10-fold cross-validation. As shown in , higher accuracy appeared at max_features = 12. The OOB score increases rapidly at first with increasing n estimators, and then levels off. The optimal combination of parameters was max_features = 10 and n_estimators = 172, which yielded the highest OOB accuracy.
Figure 12. The matrix of OOB accuracy with different combinations of max_features and n_estimators.
Subsequently, the RF model was built based on the training set for predicting the categories of all UFZs in the study area, and the accuracy was evaluated using the test set. The classification experiments including random splits of the training and test sets that followed the ratio of seven to three repeated 100 times to reduce the unreliability of the classification results. The UFZ classification results of our proposed approach are rendered in (15) and the corresponding confusion matrix is shown in .
Figure 14. Classification results of UFZs. (0) Ground truth. (1) ∼ (15) Results of experiment 1 ∼ 15, and experiment 15 corresponds to our proposed method. Sparse zones refer to spatial units that are excluded from the study.
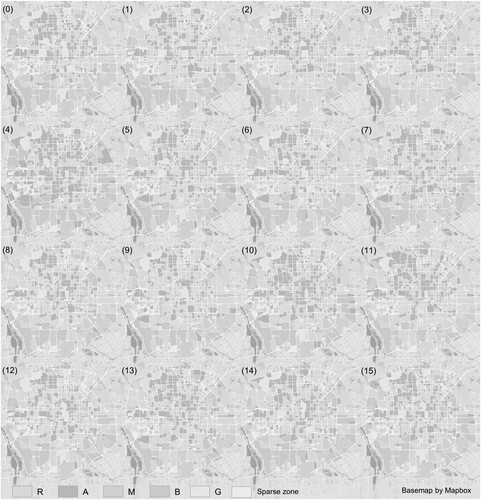
Table 2. Confusion matrix of classification results. (R: residential zone. A: administrative and public service zone. M: industrial zone. B: business zone. G: green space).
4.3.2. Feature importance analysis
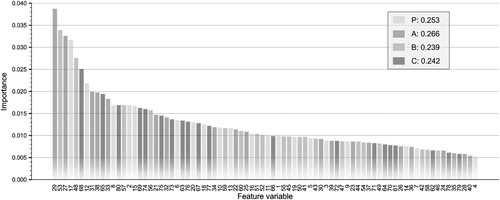
For the 80-dimensional combined UFZ embeddings learned from the four geo-corpuses (i.e. P, A, B, C), the feature variables of 0∼19, 19∼39, 40∼59 and 60∼79 dimensions came from P, A, B, and C, respectively. The relative importance of the 80 feature variables in the combined UFZ embeddings for the whole classification was tested according to Section 3.3.2 and plotted in order of importance in . As seen in , the importance of the feature variables is evenly distributed. We counted the sum of feature importance from each geo-corpus. The differences in the importance of the features are not significant, and the standard deviation of the importance of the four-modal features is 0.011, indicating that each modal POI spatial distribution information does not differ significantly in the classification contribution. Among them, the features generated by Approach B have the lowest feature importance, and the features generated by Approach P and C have slightly lower importance than the features generated by Approach A. It reveals that the four geo-corpuses capture valid spatial distribution patterns, and their contribution can be ranked as follows, Pattern A (captured by Approach A) > Pattern B (captured by Approach B) > pattern P (captured by Approach P) > Pattern C (captured by Approach C). Considering that Approach P, B, and C all adopt a central-context pairs-based (Hu et al. Citation2020) sampling strategy, there may be a certain degree of homogeneous information, resulting in the features generated by Approach A being prominent slightly more than the others.
Figure 13. Feature variable importance ranking for UFZ classification.
4.3.3. Comparison of different-modal features combination
Based on the feature combination method described in Section 3.3.1, the four types of POI embeddings derived from the Approach P, A, B, and C were combined according to the different modes of the designed experiments in to yield the corresponding UFZ embeddings, which are in total 15 experiments. The UFZ embeddings were used to implement the UFZ classification according to the method in Section 3.4.1. The UFZ classification results of all experiments were rendered in , and the accuracy evaluation of all results was listed in . The bolded numbers indicate the maximum value within each combination mode in .
Table 3. Accuracy evaluation. (*: feature combination mode. R: residential zone. A: administrative and public service zone. M: industrial zone. B: business zone. G: green space).
The 15 experiments in respectively adopted different combination modes of the spatial distribution patterns (see ). Among them, experiment 15 (corresponding to Mode 3, i.e. our proposed approach) combined the four categories of spatial distribution patterns of POIs indicated by A, B, C, and P, respectively. The accuracy of experiment 15 is significantly higher than the remaining 14 experiments, which indicates that our proposed method can effectively integrate all POI spatial distribution information to achieve the optimal classification performance. The experimental results of Mode 0 illustrate that there is a slight difference in performance among the four geo-corpus construction approaches ranked as A > B > P > C. All of them can identify UFZs with high accuracy. This indicates that the four spatial distribution patterns do not differ much in their ability to represent the true geo-semantics of UFZs, but the Pattern A is better for distinguishing UFZs. Interestingly, the performance of different geo-corpus construction approaches vary for identifying different categories of UFZs. Approach P has the best identification performance for administrative and public service zone and industrial zone, Approach A has the best identification performance for residential zone, Approach B has the best identification performance for business zone, and Approach C has the best identification performance for green space. This indicates that there is a tendency of geo-semantic representation of POI spatial distribution patterns, i.e. POI spatial distribution patterns have different ability to distinguish UFZs of different categories. Pattern P (captured by Approach P) is optimal for identifying administrative and public service zone and industrial zone, Pattern A (captured by Approach A) is optimal for identifying residential zone, Pattern B (captured by Approach B) is optimal for identifying business zone, and Pattern C (captured by Approach C) is optimal for identifying green space. In addition, for almost all experiments, the identification performance on industrial zone and green space are the worst, obtaining low UA while PA is higher.
There is difference between the accuracy of the results obtained by the proposed method and the baseline work (Yao et al. Citation2017; Niu and Silva Citation2021; Sun et al. Citation2021). The possible reasons are as follows. First, the identification methods are not completely consistent since we only referred to the approaches of geo-corpus construction while the classification methods may be different. Second, the study areas are different. There is inevitable structural difference between different cities. The more mature the cities, the more complex their urban structure is, which makes it relatively more difficult to identify accurate UFZs. Finally, the time inconsistency among the data used in this study, e.g. the ground truth data was obtained in 2022 and POI data was obtained in 2018, may lead to a certain deviation between the ground truth and the UFZs we identified. An exploration study to investigate such deviation can be further conducted, if the POI data in 2022 can be fully collected.
Although the geo-corpus construction approach proposed in this study is able to achieve the most advanced performance level on the UFZ identification task, it still performs slightly lower than Approach A and B in terms of OA and Kappa. This may be the same as the worst performing Approach C, which suffers from some oversampling problems, i.e. it is easy to sample some homogeneous samples in POI intensive areas leading to overfitting of the model (Niu and Silva Citation2021). Though both Approach P and C attempted to prevent oversampling, e.g. Approach C set a 50 m interval to generate random sampling points for roads, and Approach P sets different sampling distances for different sampling points based on social influence to prevent oversampling. However, this repeated sampling method inevitably has oversampling problems. A potential solution relies on the enhancement factor based on the distance decay effect can be used for weighting POI sampling to further optimize the sampling strategy of the Approach P and suppress the POI oversampling problem in geo-corpus construction.
The method proposed in this study has difficulties in industrial zone and green space identification, i.e. all experiments designed do not identify industrial zone and green space well. This is consistent with the results of the UFZ identification study based on POI (Sun et al. Citation2021). This difficulty can be attributed to the POI data. Considering that the performance of the study method relies heavily on the quality of the training data, and that the actual POI data have fewer POI description for industrial types and open land types compared to other types. The simplified representation of geographical entities by POIs suppresses some POIs that occupy a large area to some extent (e.g. parks and barbershops may be sampled as a separate POI). Therefore, integrating Area of Interests (AOI) data, remote sensing image data and other multi-source data can be a way to improve the classification accuracy. Some dynamic urban data sources (e.g. trajectory data, smart card data, and social media data) and static urban data sources (e.g. street view images and remote sensing images) can also be considered for integration with POI data to further explore potential regional geo-information.
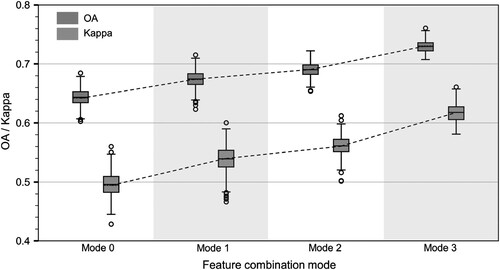
Moreover, as shown in , we visualize the average OA and Kappa of all experiments for each combination mode that are shown in . The average OA and Kappa of Mode 3 show a significant improvement relative to Mode 0 (ΔOA = 0.085, ΔKappa = 0.122), which indicates that the proposed combination method can efficiently exploit more potential of POI data. Apparently, the classification performance steadily increases in steps from Mode 0 to Mode 3 (the average increase is ΔOA = 0.028, ΔKappa = 0.041), which means that each additional combination of spatial distribution information increases the classification OA by approximately 0.028 and Kappa by approximately 0.041. This also verifies our previous assumption that the more spatial distribution information, the more accurate the UFZ embeddings are in representing the geo-semantics of the UFZ. Although the overall identification performance increases with increasing modes, there is no improvement in identification accuracy for green space. This suggests that several geo-corpuses used in this study do not seem to capture a valid POI distribution pattern for green space.
Figure 15. Box plot of different feature combination modes.
5. Conclusions and future work
This paper presented an integrated approach to identify UFZs by capturing multi-spatial distribution patterns of POIs. Distinct from previous model-driven studies that focus on exploring different NLP or deep learning models to extract more effective POI data features to accurately identify UFZs, the proposed method starts from the perspective of explaining the mechanism of how discrete POI data perceives UFZ geo-semantics, and enhances the POI spatial distribution information of UFZ embeddings by capturing multi-spatial distribution patterns.
The results show that: 1. The POI embeddings and UFZ embeddings obtained by the proposed method that consider multi-spatial distribution patterns of POIs can effectively represent the geo-semantics and can be further used to classify UFZs more accurately, with a significant performance improvement (ΔOA = 8.5% and ΔKappa = 0.122) relative to the methods from existing studies that only consider a single spatial distribution pattern of POIs. 2. The contribution of each geo-corpus construction approach to UFZ identification results was investigated by measuring the importance of the features corresponding to each approach. Our developed geo-corpus approach (i.e. Approach P) takes the effects of POI spatial interaction into account and can achieve the most advanced level of performance available in existing studies. 3. The embeddings that combine more spatial distribution information can represent more accurate geo-semantics. The more POI spatial distribution patterns considered, the better UFZ identification performance. For each new distribution pattern combined, OA increases by 2.8% on average and Kappa by 0.041.
In conclusion, the proposed method of capturing POI multi-spatial distribution patterns to identify UFZs can effectively identify UFZs and obtain significant improvement compared to those baseline methods. This study can provide a new way of understanding urban socio-spatial structure from the perspective of POI spatial distribution patterns, which can help scientific urban planning, urban construction, and urban renewal. The proposed method can extract POI embeddings and UFZ embeddings that represent realistic geo-semantics, which has great potential for more application scenarios such as POI recommendation and commercial site selection. As POI data has been widely used and easily accessible ubiquitous data source, the proposed method can be extended or transferred to more POI-related urban studies related to, e.g. health, mobility, and community studies (Psyllidis et al. Citation2022).
The proposed approach may be further improved by fusing multi-source data. Some dynamic urban data sources (e.g. trajectory data, smart card data, and social media data) and static urban data sources (e.g. street view images, remote sensing images, and AOI) can also be considered for integration with POI data to further explore potential regional geo-information. On the one hand, it can make up for the limitations of single POI data. On the other hand, image data carrying urban physical characteristics can help delineate the morphology of UFZ finer and minimize the effect of the Modifiable Areal Unit Problem (MAUP) (Openshaw and Taylor Citation1979) on UFZ identification. Furthermore, we will consider introducing the BERT model to explore the dynamic geo-semantics of POIs.
Acknowledgement
The authors would like to thank anonymous reviewers for their constructive comments that helped improve the manuscript.
Disclosure statement
No potential conflict of interest was reported by the author(s).
Additional information
Funding
Notes
References
- Andrade, Renato, Ana Alves, and Carlos Bento. 2020. “POI Mining for Land Use Classification: A Case Study.” ISPRS International Journal of Geo-Information 9 (9): 493–423. doi:10.3390/ijgi9090493.
- Bao, Jie, Tianfu He, Sijie Ruan, Yanhua Li, and Yu Zheng. 2017. “Planning Bike Lanes Based on Sharing-Bikes’ Trajectories.” Proceedings of the ACM SIGKDD International Conference on Knowledge Discovery and Data Mining, Part F129685:1377–86. Association for Computing Machinery.
- Bao, Hanqing, Dongping Ming, Ya Guo, Kui Zhang, Keqi Zhou, and Shigao Du. 2020. “DFCNN-Based Semantic Recognition of Urban Functional Zones by Integrating Remote Sensing Data and POI Data.” Remote Sensing 12 (7). MDPI AG: 1088. doi:10.3390/rs12071088.
- Batty, Michael. 2008. “The Size, Scale, and Shape of Cities.” Science 319 (5864): 769–771. doi:10.1126/science.1151419.
- Berry, Brian JL. 2008. “Urbanization.” In Urban Ecology, edited by John M. Marzluff, Gordon Bradley, Clare Ryan, Eric Shulenberger, Wilfried Endlicher, Marina Alberti, Ute Simon, and Craig ZumBrunnen. Boston, MA: Springer. doi:10.1007/978-0-387-73412-5_3
- Breiman, Leo. 2001. “Random Forests.” Machine Learning 45 (1): 5–32. doi:10.1023/A:1010933404324.
- Cai, Meng. 2021. “Natural Language Processing for Urban Research: A Systematic Review.” Heliyon. Elsevier Ltd, doi:10.1016/j.heliyon.2021.e06322.
- Cai, Li, Lanqiuyue Zhang, Yu Liang, and Jin Li. 2022. “Discovery of Urban Functional Regions Based on Node2vec.” Applied Intelligence, 16886–16899. doi:10.1007/s10489-022-03285-x.
- Cao, Rui, Jiasong Zhu, Wei Tu, Qingquan Li, Jinzhou Cao, Bozhi Liu, Qian Zhang, and Guoping Qiu. 2018. “Integrating Aerial and Street View Images for Urban Land Use Classification.” Remote Sensing 10 (10): 1553–1523. doi:10.3390/rs10101553.
- Chang, Shouzhi, Zongming Wang, Dehua Mao, Kehan Guan, Mingming Jia, and Chaoqun Chen. 2020a. “Mapping the Essential Urban Land Use in Changchun by Applying Random Forest and Multi-Source Geospatial Data.” Remote Sensing 12 (15). MDPI AG, doi:10.3390/RS12152488.
- Chang, Ximing, Jianjun Wu, Zhengbing He, Daqing Li, Huijun Sun, and Weiping Wang. 2020b. “Understanding User’s Travel Behavior and City Region Functions from Station-Free Shared Bike Usage Data.” Transportation Research Part F: Traffic Psychology and Behaviour, 81–95. doi:10.1016/j.trf.2020.03.018.
- Chen, Wei, Huiping Huang, Jinwei Dong, Yuan Zhang, Yichen Tian, and Zhiqi Yang. 2018. “Social Functional Mapping of Urban Green Space Using Remote Sensing and Social Sensing Data.” ISPRS Journal of Photogrammetry and Remote Sensing 146. Elsevier B.V.: 436–452. doi:10.1016/j.isprsjprs.2018.10.010.
- Chen, Bin, Bo Huang, and Bing Xu. 2017. “Multi-Source Remotely Sensed Data Fusion for Improving Land Cover Classification.” ISPRS Journal of Photogrammetry and Remote Sensing 124: 27–39. doi:10.1016/j.isprsjprs.2016.12.008.
- Chen, Bin, Bing Xu, and Peng Gong. 2021. “Mapping Essential Urban Land use Categories (EULUC) Using Geospatial big Data: Progress, Challenges, and Opportunities.” Big Earth Data 5 (3). Taylor & Francis: 410–441. doi:10.1080/20964471.2021.1939243.
- Dong, Weihua, Shengkai Wang, and Yu Liu. 2021. “Mapping Relationships between Mobile Phone Call Activity and Regional Function Using Self-Organizing map.” Computers, Environment and Urban Systems 87. Elsevier Ltd, doi:10.1016/j.compenvurbsys.2021.101624.
- Dovey, Kim, and Elek Pafka. 2017. “What is Functional mix? An Assemblage Approach.” Planning Theory & Practice, 249–267. doi:10.1080/14649357.2017.1281996.
- Du, Shouhang, Shihong Du, Bo Liu, and Xiuyuan Zhang. 2021. “Mapping Large-Scale and Fine-Grained Urban Functional Zones from VHR Images Using a Multi-Scale Semantic Segmentation Network and Object Based Approach.” Remote Sensing of Environment 261: 112480. doi:10.1016/j.rse.2021.112480.
- Du, Zhenhong, Xiaoyi Zhang, Wenwen Li, Feng Zhang, and Renyi Liu. 2020. “A Multi-Modal Transportation Data-Driven Approach to Identify Urban Functional Zones: An Exploration Based on Hangzhou City, China.” Transactions in GIS 24 (1). Blackwell Publishing Ltd: 123–141. doi:10.1111/tgis.12591.
- Du, Shihong, Fangli Zhang, and Xiuyuan Zhang. 2015. “Semantic Classification of Urban Buildings Combining VHR Image and GIS Data: An Improved Random Forest Approach.” ISPRS Journal of Photogrammetry and Remote Sensing, 107–119. doi:10.1016/j.isprsjprs.2015.03.011.
- Feng, Yuning, Shihong Du, Soe W. Myint, and Mi Shu. 2019. “Do Urban Functional Zones Affect Land Surface Temperature Differently? A Case Study of Beijing, China.” Remote Sensing 11, doi:10.3390/rs11151802.
- Gao, Song, Krzysztof Janowicz, and Helen Couclelis. 2017. “Extracting Urban Functional Regions from Points of Interest and Human Activities on Location-Based Social Networks.” Transactions in GIS 3. Blackwell Publishing Ltd: 446–467. doi:10.1111/tgis.12289.
- Gong, Peng, Bin Chen, Xuecao Li, Han Liu, Jie Wang, Yuqi Bai, Jingming Chen, et al. 2020. “Mapping Essential Urban Land Use Categories in China (EULUC-China): Preliminary Results for 2018.” Science Bulletin 65 (3). Elsevier B.V.: 182–187. doi:10.1016/j.scib.2019.12.007.
- Hong, Ye, and Yao Yao. 2019. “Hierarchical Community Detection and Functional Area Identification with OSM Roads and Complex Graph Theory.” International Journal of Geographical Information Science 33 (8). Taylor and Francis Ltd.: 1569–1587. doi:10.1080/13658816.2019.1584806.
- Houssou, Noudéhouénou L.J., Jean Loup Guillaume, and Armelle Prigent. 2019. “A Graph Based Approach for Functional Urban Areas Delineation." In Proceedings of the 34th ACM/SIGAPP Symposium on Applied Computing. Limassol, Cyprus.
- Hu, Sheng, Song Gao, Liang Wu, Yongyang Xu, Ziwei Zhang, Haifu Cui, and Xi Gong. 2021. “Urban Function Classification at Road Segment Level Using Taxi Trajectory Data: A Graph Convolutional Neural Network Approach, Computers, Environment and Urban Systems 87. doi:10.1016/j.compenvurbsys.2021.101619.
- Hu, Sheng, Zhanjun He, Liang Wu, Li Yin, Yongyang Xu, and Haifu Cui. 2020. “A Framework for Extracting Urban Functional Regions Based on Multiprototype Word Embeddings Using Points-of-Interest Data.” Computers, Environment and Urban Systems, 101442. doi:10.1016/j.compenvurbsys.2019.101442.
- Hu, Tengyun, Jun Yang, Xuecao Li, and Peng Gong. 2016. “Mapping Urban Land Use by Using Landsat Images and Open Social Data.” Remote Sensing 8 (2). MDPI AG, doi:10.3390/rs8020151.
- Huang, Weiming, Lizhen Cui, Meng Chen, Daokun Zhang, and Yao Yao. 2022. “Estimating Urban Functional Distributions with Semantics Preserved POI Embedding.” International Journal of Geographical Information Science, 1905–1930. doi:10.1080/13658816.2022.2040510.
- Huang, Zhou, Houji Qi, Chaogui Kang, Yuelong Su, and Yu Liu. 2020. “An Ensemble Learning Approach for Urban Land Use Mapping Based on Remote Sensing Imagery and Social Sensing Data.” Remote Sensing 12 (19): 3254–3218. doi:10.3390/rs12193254.
- Huang, Xin, and Ying Wang. 2019. “Investigating the Effects of 3D Urban Morphology on the Surface Urban Heat Island Effect in Urban Functional Zones by Using High-Resolution Remote Sensing Data: A Case Study of Wuhan, Central China.” ISPRS Journal of Photogrammetry and Remote Sensing 152. Elsevier: 119–131. doi:10.1016/j.isprsjprs.2019.04.010.
- Huang, Xin, Junjing Yang, Jiayi Li, and Dawei Wen. 2021. “Urban Functional Zone Mapping by Integrating High Spatial Resolution Nighttime Light and Daytime Multi-View Imagery.” ISPRS Journal of Photogrammetry and Remote Sensing 175. Elsevier B.V.: 403–415. doi:10.1016/j.isprsjprs.2021.03.019.
- Huang, Bo, Bei Zhao, and Yimeng Song. 2018. “Urban Land-use Mapping Using a Deep Convolutional Neural Network with High Spatial Resolution Multispectral Remote Sensing Imagery.” Remote Sensing of Environment, 73–86. doi:10.1016/j.rse.2018.04.050.
- Jiang, Shan, Ana Alves, Filipe Rodrigues, Joseph Ferreira, and Francisco C. Pereira. 2015. “Mining Point-of-Interest Data from Social Networks for Urban Land use Classification and Disaggregation.” Computers, Environment and Urban Systems, 36–46. doi:10.1016/j.compenvurbsys.2014.12.001.
- Li, Hang. 2018. “Deep Learning for Natural Language Processing: Advantages and Challenges.” National Science Review 5 (1): 24–26. doi:10.1093/nsr/nwx110.
- Li, Xiaojiang, Chuanrong Zhang, and Weidong Li. 2017. “Building Block Level Urban Land-use Information Retrieval Based on Google Street View Images.” GIScience & Remote Sensing, 819–835. doi:10.1080/15481603.2017.1338389.
- Liu, Baihua, Yingbin Deng, Miao Li, Ji Yang, and Tao Liu. 2021. “Classification Schemes and Identification Methods for Urban Functional Zone: A Review of Recent Papers.” Applied Sciences (Switzerland) 11 (21), doi:10.3390/app11219968.
- Liu, Xingjian, and Ying Long. 2016. “Automated Identification and Characterization of Parcels with OpenStreetMap and Points of Interest.” Environment and Planning B: Planning and Design, 341–360. doi:10.1177/0265813515604767.
- Liu, Kang, Peiyuan Qiu, Song Gao, Feng Lu, Jincheng Jiang, and Ling Yin. 2020a. “Investigating Urban Metro Stations as Cognitive Places in Cities Using Points of Interest.” Cities, 102561. doi:10.1016/j.cities.2019.102561.
- Liu, Kang, Ling Yin, Feng Lu, and Naixia Mou. 2020b. “Visualizing and Exploring POI Configurations of Urban Regions on POI-Type Semantic Space.” Cities, 102610. doi:10.1016/j.cities.2020.102610.
- Long, Ying, and Zhenjiang Shen. 2015. “Discovering Functional Zones Using Bus Smart Card Data and Points of Interest in Beijing.” In GeoJournal Library, Vol. 116. Cham: Springer. doi:10.1007/978-3-319-19342-7_10
- Lu, Weipeng, Chao Tao, Haifeng Li, Ji Qi, and Yansheng Li. 2022. “A Unified Deep Learning Framework for Urban Functional Zone Extraction Based on Multi-Source Heterogeneous Data.” Remote Sensing of Environment 270: 112830. doi:10.1016/j.rse.2021.112830.
- Maaten, Laurens van der, and Geoffrey Hinton. 2008. “Visualizing Data Using T-SNE.” Journal of Machine Learning Research 9 (11): 2579–2605.
- Mawuenyegah, Aleta, Songnian Li, and Shishuo Xu. 2022. “Exploring Spatiotemporal Patterns of Geosocial Media Data for Urban Functional Zone Identification.” International Journal of Digital Earth 15 (1): 1305–1325. doi:10.1080/17538947.2022.2107099.
- Mikolov, Tomas, Kai Chen, Greg Corrado, and Jeffrey Dean. 2013b. “Efficient Estimation of Word Representations in Vector Space.” 1st International Conference on Learning Representations, ICLR 2013 - Workshop Track Proceedings, 1–12.
- Mikolov, Tomas, Ilya Sutskever, Kai Chen, Greg Corrado, and Jeffrey Dean. 2013a. “Distributed Representations of Words and Phrases and Their Compositionality.” In Advances in neural information processing systems, edited by C. J. Burges, L. Bottou, M. Welling, Z. Ghahramani, and K. Q. Weinberger, 3111–3119.
- Ng, Hwee Tou, and John Zelle. 1997. “Corpus-Based Approaches to Semantic Interpretation in NLP.” AI Magazine 18 (4): 45–45. doi:10.1609/aimag.v18i4.1321.
- Niu, Haifeng, and Elisabete A. Silva. 2021. “Delineating Urban Functional use from Points of Interest Data with Neural Network Embedding: A Case Study in Greater London.” Computers, Environment and Urban Systems 88: 101651. doi:10.1016/j.compenvurbsys.2021.101651.
- Openshaw, Stan, and Peter J. Taylor. 1979. “A Million or so Correlation Coefficients: Three Experiments on the Modifiable Areal Unit Problem.” Statistical Applications in the Spatial Sciences, 127–114.
- Psyllidis, Achilleas, Song Gao, Yingjie Hu, Eun-Kyeong Kim, Grant McKenzie, Ross Purves, May Yuan, and Clio Andris. 2022. “Points of Interest (POI): A Commentary on the State of the Art, Challenges, and Prospects for the Future.” Computational Urban Science 2 (1). Springer Nature Singapore: 20. doi:10.1007/s43762-022-00047-w.
- Qian, Jiale, Zhang Liu, Yunyan Du, Fuyuan Liang, Jiawei Yi, Ting Ma, and Tao Pei. 2021. “Quantify City-Level Dynamic Functions Across China Using Social Media and POIs Data.” Computers, Environment and Urban Systems, 101552. doi:10.1016/j.compenvurbsys.2020.101552.
- Qin, Quan, Shishuo Xu, Mingyi Du, and Songnian Li. 2022. “Urban Functional Zone Identification by Considering The Heterogeneous Distribution of Points of Interests." ISPRS Annals of the Photogrammetry, Remote Sensing and Spatial Information Sciences. Nice, France.
- Ritchie, Hannah, and Max Roser. 2018. “Urbanization.” Our World in Data. https://ourworldindata.org/urbanization?source=content_type%3Areact%7Cfirst_level_url%3Aarticle%7Csection%3Amain_content%7Cbutton%3Abody_link.
- Rousseeuw, Peter J. 1987. “Silhouettes: A Graphical Aid to the Interpretation and Validation of Cluster Analysis.” Journal of Computational and Applied Mathematics 20: 53–65. doi:10.1016/0377-0427(87)90125-7.
- Sanlang, Siji, Shisong Cao, Mingyi Du, You Mo, Qiang Chen, and Wen He. 2021. “Integrating Aerial LiDAR and Very-High-Resolution Images for Urban Functional Zone Mapping.” Remote Sensing 13 (13): 2573. doi:10.3390/rs13132573.
- Song, Jinchao, Tao Lin, Xinhu Li, and Alexander V. Prishchepov. 2018. “Mapping Urban Functional Zones by Integrating Very High Spatial Resolution Remote Sensing Imagery and Points of Interest: A Case Study of Xiamen, China.” Remote Sensing, doi:10.3390/rs10111737.
- Strobl, Carolin, Anne-Laure Boulesteix, and Thomas Augustin. 2007. “Unbiased Split Selection for Classification Trees Based on the Gini Index.” Computational Statistics & Data Analysis 52 (1): 483–501. doi:10.1016/j.csda.2006.12.030.
- Sun, Zhihao, Hongzan Jiao, Hao Wu, Zhenghong Peng, and Lingbo Liu. 2021. “Block2vec: An Approach for Identifying Urban Functional Regions by Integrating Sentence Embedding Model and Points of Interest.” ISPRS International Journal of Geo-Information 10 (5). MDPI AG: 339. doi:10.3390/ijgi10050339.
- Sun, Ranhao, Yihe Lü, Liding Chen, Liu Yang, and Ailian Chen. 2013. “Assessing the Stability of Annual Temperatures for Different Urban Functional Zones.” Building and Environment, 90–98. doi:10.1016/j.buildenv.2013.04.001.
- Tu, Wei, Jinzhou Cao, Yang Yue, Shih Lung Shaw, Meng Zhou, Zhensheng Wang, Xiaomeng Chang, Yang Xu, and Qingquan Li. 2017. “Coupling Mobile Phone and Social Media Data: A New Approach to Understanding Urban Functions and Diurnal Patterns.” International Journal of Geographical Information Science 31 (12). Taylor and Francis Ltd.: 2331–2358. doi:10.1080/13658816.2017.1356464.
- Tu, Ying, Bin Chen, Tao Zhang, and Bing Xu. 2020. “Regional Mapping of Essential Urban Land Use Categories in China: A Segmentation-Based Approach.” Remote Sensing 12 (7). MDPI AG: 1058. doi:10.3390/rs12071058.
- Wang, Ming, Qingquan Li, Qingwu Hu, and Meng Zhou. 2013. “Quality Analysis Crowd Scourcing Geographic Data with Open Map Data.” Geomatics and Information Science of Wuhan University 38 (12): 1490–1494. doi:10.13203/j.whugis2013.12.023.
- Wang, Ziyi, Debin Ma, Dongqi Sun, and Jingxiang Zhang. 2021. “Identification and Analysis of Urban Functional Area in Hangzhou Based on OSM and POI Data.” Edited by Jun Yang. PLOS ONE 16 (5): e0251988. doi:10.1371/journal.pone.0251988.
- Wen, Richard, and Songnian Li. 2021. “A Review of the Use of Geosocial Media Data in Agent-Based Models for Studying Urban Systems.” Big Earth Data 5 (1). Taylor & Francis: 5–23. doi:10.1080/20964471.2020.1810492.
- Wu, Rong, Jieyu Wang, Dachuan Zhang, and Shaojian Wang. 2021. “Identifying Different Types of Urban Land use Dynamics Using Point-of-Interest (POI) and Random Forest Algorithm: The Case of Huizhou, China.” Cities, 103202. doi:10.1016/j.cities.2021.103202.
- Xiang, Mingjun. 2020. “Region2vec: An Approach for Urban Land Use Detection by Fusing multiple Features.” In Proceedings of the 2020 6th International Conference on Computing and Artificial Intelligence, 13–18.
- Xing, Hanfa, and Yuan Meng. 2018. “Integrating Landscape Metrics and Socioeconomic Features for Urban Functional Region Classification.” Computers, Environment and Urban Systems, 134–145. doi:10.1016/j.compenvurbsys.2018.06.005.
- Xu, Nan, Jiancheng Luo, Tianjun Wu, Wen Dong, Wei Liu, and Nan Zhou. 2021. “Identification and Portrait of Urban Functional Zones Based on Multisource Heterogeneous Data and Ensemble Learning.” Remote Sensing, 373–320. doi:10.3390/rs13030373.
- Xu, Shengyu, Linbo Qing, Longmei Han, Mei Liu, Yonghong Peng, and Lifang Shen. 2020. “A New Remote Sensing Images and Point-of-Interest Fused (RPF) Model for Sensing Urban Functional Regions.” Remote Sensing 12 (6): 1032. doi:10.3390/rs12061032.
- Xu, Yongyang, Bo Zhou, Shuai Jin, Xuejing Xie, Zhanlong Chen, Sheng Hu, and Nan He. 2022. “A Framework for Urban Land use Classification by Integrating the Spatial Context of Points of Interest and Graph Convolutional Neural Network Method.” Computers, Environment and Urban Systems, 101807. doi:10.1016/j.compenvurbsys.2022.101807.
- Yang, Min, Bo Kong, Ruirong Dang, and Xiongfeng Yan. 2022. “Classifying Urban Functional Regions by Integrating Buildings and Points-of-Interest Using a Stacking Ensemble Method.” International Journal of Applied Earth Observation and Geoinformation 108. Elsevier B.V.: 102753. doi:10.1016/j.jag.2022.102753.
- Yao, Yao, Xia Li, Xiaoping Liu, Penghua Liu, Zhaotang Liang, Jinbao Zhang, and Ke Mai. 2017. “Sensing Spatial Distribution of Urban Land Use by Integrating Points-of-Interest and Google Word2Vec Model.” International Journal of Geographical Information Science 31 (4). Taylor and Francis Ltd.: 825–848. doi:10.1080/13658816.2016.1244608.
- Ye, Chao, Fan Zhang, Lan Mu, Yong Gao, and Yu Liu. 2021. “Urban Function Recognition by Integrating Social Media and Street-Level Imagery.” Environment and Planning B: Urban Analytics and City Science 48 (6): 1430–1444. doi:10.1177/2399808320935467.
- Yu, Mo, and Mark Dredze. 2014. “Improving Lexical Embeddings with Semantic Knowledge.” Proceedings of the 52nd Annual Meeting of the Association for Computational Linguistics (Volume 2: Short Papers), 545–550.
- Yu, Zhaowu, Yongcai Jing, Gaoyuan Yang, and Ranhao Sun. 2021. “A New Urban Functional Zone-Based Climate Zoning System for Urban Temperature Study.” Remote Sensing, 251. doi:10.3390/RS13020251.
- Yuan, Jin, Yu Zheng, and Xing Xie. 2012. “Discovering Regions of Different Functions in a City Using Human Mobility and POIs.” In Proceedings of the 18th ACM SIGKDD International Conference on Knowledge Discovery and Data Mining, 186–94. ACM, doi:10.1145/2339530.2339561.
- Yuan, Nicholas Jing, Yu Zheng, Xing Xie, Yingzi Wang, Kai Zheng, and Hui Xiong. 2015. “Discovering Urban Functional Zones Using Latent Activity Trajectories.” IEEE Transactions on Knowledge and Data Engineering 27 (3). IEEE Computer Society: 712–725. doi:10.1109/TKDE.2014.2345405.
- Zhai, Wei, Xueyin Bai, Yu Shi, Yu Han, Zhong Ren Peng, and Chaolin Gu. 2019. “Beyond Word2vec: An Approach for Urban Functional Region Extraction and Identification by Combining Place2vec and POIs.” Computers, Environment and Urban Systems, 1–12. doi:10.1016/j.compenvurbsys.2018.11.008.
- Zhang, Xiuyuan, Shihong Du, Qiao Wang, and Weiqi Zhou. 2018. “Multiscale Geoscene Segmentation for Extracting Urban Functional Zones from VHR Satellite Images.” Remote Sensing 10 (2). MDPI AG: 281. doi:10.3390/rs10020281.
- Zhang, Yuan, Qiangzi Li, Huiping Huang, Wei Wu, Xin Du, and Hongyan Wang. 2017a. “The Combined Use of Remote Sensing and Social Sensing Data in Fine-Grained Urban Land Use Mapping: A Case Study in Beijing, China, China.” Remote Sensing 9 (9). MDPI AG: 865. doi:10.3390/rs9090865.
- Zhang, Yatao, Qingquan Li, Wei Tu, Ke Mai, Yao Yao, and Yiyong Chen. 2019. “Functional Urban Land use Recognition Integrating Multi-Source Geospatial Data and Cross-Correlations.” Computers, Environment and Urban Systems 78. Elsevier Ltd: 101374. doi:10.1016/j.compenvurbsys.2019.101374.
- Zhang, Jinbao, Xia Li, Yao Yao, Ye Hong, Jialyu He, Zhangwei Jiang, and Jianchao Sun. 2021. “The Traj2Vec Model to Quantify Residents’ Spatial Trajectories and Estimate the Proportions of Urban Land-Use Types.” International Journal of Geographical Information Science 35 (1). Taylor and Francis Ltd.: 193–211. doi:10.1080/13658816.2020.1726923.
- Zhang, Weixing, Weidong Li, Chuanrong Zhang, Dean M. Hanink, Xiaojiang Li, and Wenjie Wang. 2017b. “Parcel-based Urban Land use Classification in Megacity Using Airborne LiDAR, High Resolution Orthoimagery, and Google Street View.” Computers, Environment and Urban Systems, 215–228. doi:10.1016/j.compenvurbsys.2017.03.001.
- Zhang, Chengkun, Liuchang Xu, Zhen Yan, and Sensen Wu. 2021c. “A Glove-Based Poi Type Embedding Model for Extracting and Identifying Urban Functional Regions.” ISPRS International Journal of Geo-Information 10 (6). MDPI AG: 327. doi:10.3390/ijgi10060372.
- Zhang, Nanyu, Jianjun Zhang, Wei Chen, and Jiajia Su. 2022. “Block-based Variations in the Impact of Characteristics of Urban Functional Zones on the Urban Heat Island Effect: A Case Study of Beijing.” Sustainable Cities and Society, 103529. doi:10.1016/j.scs.2021.103529.
- Zheng, Yunqiang, Shihong Du, Xiuyuan Zhang, Lubin Bai, and Haoyu Wang. 2022. “Estimating Carbon Emissions in Urban Functional Zones Using Multi-Source Data: A Case Study in Beijing.” Building and Environment 212. Elsevier Ltd: 108804. doi:10.1016/j.buildenv.2022.108804.
- Zhou, Wen, Dongping Ming, Xianwei Lv, Keqi Zhou, Hanqing Bao, and Zhaoli Hong. 2020. “SO–CNN Based Urban Functional Zone Fine Division with VHR Remote Sensing Image.” Remote Sensing of Environment 236, doi:10.1016/j.rse.2019.111458.
- Zong, Leli, Sijia He, Jiting Lian, Qiang Bie, Xiaoyun Wang, Jingru Dong, and Yaowen Xie. 2020. “Detailed Mapping of Urban Land Use Based on Multi-Source Data: A Case Study of Lanzhou.” Remote Sensing, doi:10.3390/rs12121987.