?Mathematical formulae have been encoded as MathML and are displayed in this HTML version using MathJax in order to improve their display. Uncheck the box to turn MathJax off. This feature requires Javascript. Click on a formula to zoom.
ABSTRACT
Synthesis of multi-satellite altimetry facilitates the acquisition of long-term changes in lake level but may induce biases due to inconsistent data sources, and thus remains largely unexplored. This study investigates the integrated application of Ice, Cloud, and land Elevation Satellite (ICESat), ICESat-2, and CryoSat-2 missions to provide consecutive lake level series in 2003–2020. The sample comprises 48 lakes in the world with gauge-based or Hydroweb water level data. The CryoSat-2 data are first adjusted to the ICESat-2 height reference based on the mean values of their monthly water level difference during their overlapping period (2018–2020). Then, the corrected CryoSat-2 data are used to link the ICESat and ICESat-2 data. Results show that in the sample lakes, the deviations between CryoSat-2 and ICESat-2 data vary and range from −0.78 m to 0.13 m. The data quality of the synthesized time series is evaluated by comparing against the validation data, with an average R2 of 0.84. This study shows that CryoSat-2 has the potential of filling the gap between ICESat and ICESat-2. The three altimeters can be expected to integrate effectively for monitoring lake water level changes in the past two decades.
1. Introduction
Lakes play an essential role in the terrestrial hydrosphere and serve various functions such as regulating regional climate, supplying water resources, and maintaining ecological balance (Tang et al. Citation2019; Woolway and Merchant Citation2019; Zhang et al. Citation2013; Zhou et al. Citation2022). The world has over 1.42 million lakes and reservoirs larger than 10 hectares, covering approximately 1.8% of the global land surface area (Khazaei et al. Citation2022; Messager et al. Citation2016; Meyer et al. Citation2020; Yao Citation2020). Given their sensitive response to climate change and human activity, lakes are also often known as sentinels of earth environments (Adrian et al. Citation2009). Their water level is a direct indicator of lake water budgets (Adrian et al. Citation2009; Legesse, Vallet-Coulomb, and Gasse Citation2004). Traditionally, lake levels are measured through in situ gauge stations (Duan and Bastiaanssen Citation2013). However, these observations of spatiotemporal variations are commonly limited due to the harsh environments and logistics conditions of many lakes in remote areas (Lei et al. Citation2018; Qiao et al. Citation2019a). Even the number of lake level gauge stations has decreased in recent years (Calmant, Seyler, and Cretaux Citation2008; Crétaux and Birkett Citation2006; Ghiggi et al. Citation2021; Lu et al. Citation2010). Remote sensing provides a practical tool for monitoring the spatial and temporal dynamics of large-scale surface water (Lu et al. Citation2017; Qiao et al. Citation2019b; Tang et al. Citation2022; Yang et al. Citation2016; Yang et al. Citation2022). Since the 1990s, satellite altimetry has been gradually used to monitor the water levels of large water bodies (Duan and Bastiaanssen Citation2013). Thus far, over 20 altimetry satellites have been launched. Satellite altimetry has become an effective approach for monitoring water level changes in open water bodies (Duan and Bastiaanssen Citation2013; Schumann et al. Citation2022; Zhang, Chen, and Xie Citation2019). More and more studies use satellite radar altimetry data to estimate changes in lake water levels (Crétaux et al. Citation2016; Jiang et al. Citation2017b; Li et al. Citation2019; Song, Huang, and Ke Citation2015; Xu et al. Citation2022).
Although related literature uses various satellite altimeters, one (type of) altimeter only works for a few years and provides measurements for a limited number of lakes. Furthermore, different altimetry missions operate in different orbits and thus have varying spatial and temporal coverage of lakes worldwide. The limitations of satellites cause difficulties in obtaining long-term regular and continuous observation records for lakes on regional scales (Dettmering et al. Citation2020). Therefore, multi-altimeter data are used to monitor the lake levels over a more extended and intensive period and broader area (Chen and Liao Citation2020). A few studies have previously investigated the biases in merging different missions for several lakes (Berry Citation2002; Berry et al. Citation2005; Calmant, Seyler, and Cretaux Citation2008; Jiang et al. Citation2017a; Song et al. Citation2015). Song et al. (Citation2015) used ICESat and CryoSat-2 observation data to obtain and compare the change rates of lake water levels on the Qinghai-Tibet Plateau between the two sub-periods 2003–2009 and 2010–2014. Jiang et al. (Citation2017a) monitored water level variations in the 70 largest lakes on the Tibetan Plateau between 2003 and 2015 from the CryoSat-2 and ICESat missions. However, these studies only used ICESat and CryoSat-2 altimetry data and did not consider any systematic bias between the two. To create a lake level time series for 61 lakes on the Tibetan Plateau from 2003 to 2016, Hwang et al. (Citation2019) combined data from multiple satellites, including CryoSat-2, SARAL ICESat, and Jason-2. Li et al. (Citation2019) created a time series of high geographic and temporal resolution lake level and storage changes for 52 large lakes on the Qinghai-Tibet Plateau from 2000 to 2017 using multiple satellite data from Jason-1/2/3, Envisat, ICESat, Cryosat-2, and Landsat. By using re-tracking and outlier identification techniques, Chen and Liao (Citation2020) merged four sets of radar altimeter data to estimate water level trends and analyze the sources of changes for 340 lakes in China from 2016 to 2019. To create a global long-term record of lake levels, Shu et al. (Citation2021) evaluated the measurement precision of 11 radar satellites and offered a two-step bias correction and normalization technique. The above studies note the systematic bias between different satellites, but focus not on its correction and accuracy, but rather on the use of multiple sources to obtain lake water levels. The Hydroweb (Crétaux et al. Citation2011) and DAHITI (Schwatke et al. Citation2015) datasets also use multiple altimetry satellite data to combine water level measurements in the larger lakes around the world. However, few studies focus on the comprehensive investigation of the uncertainty of synthesizing the ICESat/ICESat-2 and CryoSat-2 observations worldwide, and obtaining uniform quality of data for different lakes in finer sizes remains a challenge.
Compiling a consecutive time series of lake levels by combining multiple satellite data sources may induce various uncertainties, that are mainly caused by instrument biases, inconsistent geoid, incompatible reference ellipsoids and delay corrections for different satellite data, and inconsistent satellite penetration of lake surface ice (Busker et al. Citation2019; Li et al. Citation2019). However, questions remain on how to combine the multi-mission altimetry data for lakes around the world, the systematic deviation between different altimeters, and how many lakes may benefit from the common use of different altimeters. The laser altimeter ICESat and ICESat-2 were launched in 2003 and 2018, respectively, and can be used to record inland lake water level variations because of their tiny footprints (Luo et al. Citation2022; Phan, Lindenbergh, and Menenti Citation2012). The joint use of the two laser altimeters can monitor water level changes over a longer timescale (2003 to present). Unfortunately, the ICESat data service stopped in 2009, leading to a nearly 10-year gap. CryoSat-2, launched in April 2010, provides finer altimetry footprints and higher coverage of global lakes than traditional radar altimeters (Jiang et al. Citation2017b), which bridge the time gap between ICESat and ICESat-2 observations.
By considering the characteristics of the working period and spatiotemporal resolution of these altimetry missions, the present study focuses on the integrated application of ICESat, ICESat-2, and CryoSat-2 missions to provide near-two-decade observations of lake levels. The primary purpose is to explore the systematic biases between satellites, quality of the merged data, and the global lake coverage of the combined three satellites. As the successor of ICESat, ICESat-2 is used as basis to mainly adjust the CryoSat-2 data height reference during their overlapping period (2018–2020). Then the corrected CryoSat-2 data are used to bridge the data gap of ICESat and ICESat-2, to obtain a time series of water levels in each lake and to calculate the change rates of water levels. Thus, a water level time series of 48 lakes in different regions worldwide is obtained from hydrological stations or Hydroweb data (excluding the observations from CryoSat-2, ICESat, and ICESat-2) from 2003 to 2020 to evaluate the quality of the synthesized data.
2. Study area and data
2.1. Study lakes
In this study, 48 lakes from all over the world are selected (), which mainly meet three requirements. First, they all have long-term coverage of altimetry measurements from the three satellites, ICESat, CryoSat-2, and ICESat-2. CryoSat-2 observations in low-resolution mode (LRM) or synthetic aperture radar interferometric modes (SARIn) are used with different resolutions. These two-mode observations for investigated lakes are distinguished by color in . Second, the number of paired water level records for CryoSat-2 and ICESat-2 measurements must be more than 2. Third, the data from the multiple altimeters can be evaluated based on water level measurements from hydrological stations or Hydroweb data. The in situ observations and Hydroweb data are also differentiated for corresponding lakes in .
Figure 1. Geographical distribution of the sample lakes in this study.
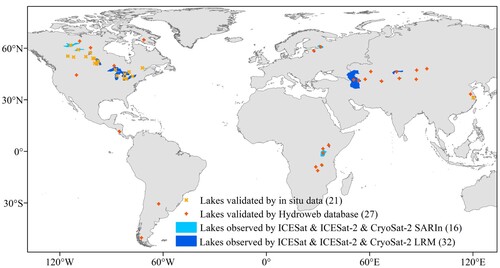
The selected 48 lakes are distributed across five continents, as follows: 25 in North America, 11 in Asia, 6 in Africa, 4 in Europe, and 2 in South America. North America mainly includes the five Laurentian Great Lakes (Superior, Huron, Erie, Michigan, and Ontario) and several other such as the Great Slave, Athabasca, and Reindeer in the northwest of Canada. Africa mainly includes several large lakes in the East. For Asia, several lakes in High Mountain Asia and two lakes in East China with Hydroweb data records or gauged data are included as study cases. In addition, this study includes the Caspian Sea, the world’s largest lake at the border of Asia and Europe.
2.2. Data
2.2.1. ICESat and ICESat-2 laser altimetry data
The ICESat is the first satellite with a laser altimeter, and its mission includes a revisit cycle of 91 days (Schutz et al. Citation2005; Yue et al. Citation2017; Zwally et al. Citation2002). The satellite collected altimetry data from 20 February 2003 to 10 October 2009, but only in February/March, May/June, and October/November during its seven years of operation. The Geoscience Laser Altimeter System (GLAS) aboard the ICESat spacecraft is referenced to the Topex/Poseidon ellipsoid, with laser footprints 70 m in diameter and the space of approximately 17 m along the track. The mission provides a wide range of measurements to monitor ice cover conditions and accurately measure the terrestrial topography vegetation canopy height and other scientific tasks (Kwok, Zwally, and Yi Citation2004; Zhang, Chen, and Xie Citation2019; Zwally et al. Citation2002). The data have been extensively used in measuring water level changes in inland lakes (Phan, Lindenbergh, and Menenti Citation2012; Song et al. Citation2015; Wang et al. Citation2011; Yi et al. Citation2016). Previous studies show that the absolute accuracy of ICESat measurements on lake water levels is better than 10 cm during ice-free seasons (Chipman and Lillesand Citation2007; Urban, Schutz, and Neuenschwander Citation2008; Zhang et al. Citation2011). This study uses the GLAH14 Release-34 product from the National Snow and Ice Data Center (NSIDC; https://nsidc.org/data/icesat (accessed on 18 September 2021)). GLAH14 contains GLAS land elevation data, geolocation, and reflectance, and the geodetic, instrument, and atmospheric corrections used. Within the ICESat land mask, parameters are at the full 40 Hz resolution for locations.
As a successor to ICESat and following its 91-day repeat cycle mode, ICESat-2 was launched in September 2018. ICESat-2 carried the advanced topographic laser altimeter system (ATLAS), which operates with three rows of six beams to monitor the surface, further increasing the density of the monitoring of water bodies (Abdalati et al. Citation2010; Jasinski et al. Citation2021a ; Koo et al. Citation2021; Neumann et al. Citation2019). Moreover, the diameter of its footprint is approximately 17 m, and the cross-track distance is approximately 3 km (Abdalati et al. Citation2010; Markus et al. Citation2017). The ATL13 product is derived primarily from geolocation, time-stamped photon heights, and other parameters from the ATLAS/ICESat-2 L2A global geolocation photon data (ATL03). The ATL13 product is created for inland water bodies, such as lakes, rivers, reservoirs, bays, and estuaries. HydroLAKES masks are used for lakes (Jasinski et al. Citation2021b; Xu et al. Citation2022). Moreover, the WGS84 ellipsoidal heights h, EGM2008 orthometric heights H, and geoid N along the track are provided in the ATL13 product. This study uses version-5 ICESat-2 ATL13 data from October 2018 to December 2020, accessed from the NASA National Snow and Ice Data Center Distributed Active Archive Center https://doi.org/10.5067/ATLAS/ATL13.005 (on 18 September 2021).
2.2.2. CryoSat-2 radar altimetry data
The CryoSat-2 altimetry satellite started collecting altimetry data from July 2010. The radar altimetry instrument is called synthetic aperture interferometric radar altimeter (SIRAL) and the heights refer to the WGS84 ellipsoid (European Space Agency. Citation2018). CryoSat-2 has an entire geodetic repetition of 369 days with sub-cycles of nearly 30 days. The Cryosat-2 dataset offers sampling at different spatial resolutions relative to other altimeter missions, with LRM, SARIn, and synthetic aperture mode (SAR) (Wingham et al. Citation2006). The LRM is the traditional mode of radar altimetry satellites, using a single receiving channel, similar to a conventional pulse width limited altimeter operations. The footprint diameter of the LRM mode is approximately 1.65 km. The SARIn is a unique capability of the SIRAL instrument with a narrower footprint, providing a high resolution elevation of observation footprint at approximately 0.3 km by 1.65 km in the along- and cross-track directions (Bouzinac Citation2019; Jiang et al. Citation2017b; Song, Ye, and Cheng Citation2015). The CryoSat-2 radar altimeter satellite has a relatively larger footprint than ICESat and ICESat-2, a longer wavelength than the laser altimeter and can operate in all weather conditions. CryoSat-2 can reach centimeter-level observation accuracy in challenging terrain compared with previously launched radar satellites (Bouzinac Citation2019; Wang, Bamber, and Cheng Citation2015). This study uses the baseline-D level-2 dataset from SARIn and LRM modes. The CryoSat-2 data are available on ftp://science-pds.cryosat.esa.int/ (accessed on 26 August 2021), containing the longitude, latitude, and surface height for 20 Hz data. lists the basic information of the ICESat, ICESat-2, and CryoSat-2 satellite missions.
Table 1. Satellite basic parameters.
2.2.3. Lake level validation data
As gauged lake level data are scarce and not readily available to the public, two sources of validation data (in situ measurement from the hydrological station and the other from the Hydroweb website) are used for this study. Water level data are obtained from in situ gauge stations for 21 lakes and Hydroweb for the remaining 27 lakes. Hydrological gauged water level data are collected from three websites. Water level data for 14 lakes are collected from the Water Survey of Canada (https://wateroffice.ec.gc.ca/), and six are from the National Oceanic and Atmospheric Administration TIDES and CURRENTS website (https://tidesandcurrents.noaa.gov/). In addition, the monthly water level time series of Taihu Lake is obtained from the Taihu Lake Basin Administration bureau of the Ministry of Water Resources (http://www.tba.gov.cn/). The Hydroweb database provides water levels based on multi-radar altimeter data and lake boundaries extracted from optical images. At the time of this study, Hydroweb contained time series of water level observations for 427 lakes and reservoirs water bodies on the website (https://hydroweb.theia-land.fr/) (Crétaux et al. Citation2011). Published literature experiments on the Hydroweb data demonstrate that it has an accuracy better than 10 cm in large lakes and decimetre level in intermediate lakes. These data are utilized as validation data to assess the results of synthesized lake levels using ICESat, ICESat-2, and CryoSat-2 altimetry data.
2.2.4. Lake water mask
The HydroLAKES dataset (https://www.hydrosheds.org/products/hydrolakes) with lake vector boundary information is used to generate the water mask for extracting the altimetry footprints (Messager et al. Citation2016). To ensure that the altimetry data are less affected by the shore topography, we generate a new mask by inwardly buffering lake shorelines based on the HydroLAKES data (Feng et al. Citation2022). The lakes are divided into four classes: less than 500 km2, 500–1,000 km2, 1,000–10,000 km2, and more than 10,000 km2, with corresponding shrinking inwards widths of 500, 800, 1,000, and 5,000 m, respectively.
3. Methods
3.1. Satellite altimetry-derived lake levels
A crucial prerequisite for obtaining reliable water levels is the accurate extraction of lake elevation footprints. The first step in acquiring satellite altimetry data on a lake is to select its measurements (Li et al. Citation2019). The water body mask is generated by shrinking the HydroLAKES data boundary inwards. The validity of measurements is determined by whether the geographic coordinates of the footprints are within a water mask dataset. Each measurement has its associated data records. In this study, the primary recorded data are latitude, longitude, and the distance from the water surface to the ellipsoidal height. The reference ellipsoid of the three satellites is Topex/Poseidon for ICESat and WGS84 for CryoSat-2 and ICESat-2. The difference in altitude between the two reference ellipsoids of Topex/Poseidon and WGS84 is approximately 0.70 m. To assure comparability, we must convert the extracted elevation data from the multi-altimetry to the same elevation base. The distance from EGM2008 to the WGS84 reference ellipsoid is calculated using the NGA (https://earth-info.nga.mil/ (accessed on 9 April 2022)) tool based on the latitude and longitude of the footprint. Once the suitable footprints are selected, the height of the lake can be calculated. In this study, the water level is defined as the range from the lake surface to the EGM2008 reference, which is the orthometric height obtained by the following expression:
(1)
(1) where h is the distance between the satellite and the reference ellipsoid; R is the range from the altimetry to the lake surface; and Ngeoid is the height of EGM2008 reference with respect to the WGS84 ellipsoidal. For the ICESat data, an additional subtraction of 0.70 m is required; c is the corrections, and its sum include ionosphere, wet and dry troposphere, solid earth tide, ocean loading tide, and pole tide. The relevant corrections are contained in the variables provided with the products (Bouzinac Citation2019).
The extracted measurement elevations have certain anomalies due to the influence of nearshore areas, photon noise, and scattering of the satellite itself (Jasinski et al. Citation2016). The second step is filtering ‘contaminated’ height measurements, commonly via the mean and 3σ methods; the former relies on sufficient measurements to filter outliers while the latter uses the mean as a reference and eliminates other values. This study first excludes lakes with less than five elevation measurements per observation date. Then, we use the normalized median absolute deviation (NMAD) approach for each lake to remove the elevation anomalies for each altimetric observation date. Finally, after removing the outliers, we retain the lakes with an elevation standard deviation (SD) of less than 0.20 m for each observation date (Höhle and Höhle Citation2009; Luo et al. Citation2022). After filtering ‘contaminated’ height measurements, we calculate the average elevations of the retained footprints on the lake for each month as the monthly water level. Thus, we obtain a time series of water levels within the observation time for each satellite altimetry.
3.2. Bias removal
After obtaining the time series from each altimeter, we need to combine the water-level observations of ICESat, ICESat-2, and CryoSat-2 for each lake. The data from the three satellites are unified under the same reference (EGM2008), but may have systematic biases among satellite altimeters due to orbit variations, discrepancy between correction models, and sensor-related errors (Li et al. Citation2019). Therefore, the synthesis of lake level time series from multiple altimeter data requires bias adjustment (Bosch, Dettmering, and Schwatke Citation2014; Schwatke et al. Citation2015). In addition, the relative calibration between two altimeters requires the observations to be simultaneously available on the same lake surface, but fewer observations meet this criteria (Li et al. Citation2020; Quartly et al. Citation2021). A common method used for system deviation correction is the relative calibration between altimeters, which removes systematic offset by comparing the average water level deviation during the overlapping period and considering the lake as perfectly horizontal (Leuliette, Nerem, and Mitchum Citation2004; Li et al. Citation2019).
The ICESat-2 has been applied to monitor water levels in inland lakes with high accuracy (Xu et al. Citation2021; Yuan, Gong, and Bai Citation2020). Therefore, we use the lake levels obtained from ICESat-2 data as a reference. With no overlapping period between ICESat (2003–2009) and ICESat-2 (2018 to present) or CryoSat-2 (2010 to present), systematic deviations cannot be directly obtained for ICESat. We separately match the ICESat and ICESat-2 monthly data to the validation data to obtain their relative deviations. The difference between the two independent deviations against the validation data is considered the bias of ICESat relative to ICESat-2. The two satellites, CryoSat-2 and ICESat-2, overlap from 2018 to the present. Thus, the ICESat-2 data are used as a baseline to calibrate the CryoSat-2 data. The primary method to correct the CryoSat-2 data is to calculate the mean difference of monthly paired data between the CryoSat-2 and ICESat-2 as the systematic bias. Below (Section 5.1), we analyze and compare the results derived from two other methods of correcting CryoSat-2. First, the CryoSat-2 data is matched to the ICESat-2 data by using the least-squares fitting relationship of the observation pairs falling in the same month. The other is to calculate the difference in the mean values of all CryoSat-2 and ICESat-2 observations in the overlap period without considering their temporal match. The different temporal buffer intervals (monthly, half month, 10 days, and one day) for the paired observations are also discussed (Section 5.2). We use the water levels obtained from ICESat-2 as a baseline and remove systematic differences from the CryoSat-2 data. Finally, all satellite data are processed to the EGM2008 reference system. We construct time series of water levels between 2003 and 2020. The systematic deviations of ICESat and CryoSat-2 altimeters relative to ICESat-2 can be expressed in Equations (2) and (3).
(2)
(2)
(3)
(3) where BiasICE is the bias between ICESat and ICESat-2; N1 and N2 represent the number of pairs of ICESat and ICESat-2 with validation data, respectively;
,
, and
represent the matching water level of the corresponding ICESat, ICESat-2, and validation data, respectively; BiasCS is the bias between CryoSat-2 and ICESat-2; N represents the number of months in which both CryoSat-2 and ICESat-2 have data; HC and HI represent the monthly water level according to CryoSat-2 and ICESat-2 altimetry data in N months.
3.3. Validation of the synthesized lake level data
The synthesized lake levels are compared with gauge measurements and Hydroweb data (Dubey et al. Citation2015; Kropacek et al. Citation2012). The linear regression model is adopted to fit the synthesized and validation data of existing month-matched pairs. A robust fitting method is applied to obtain the change rate based on the lake water level time series (2003–2020) (Holland and Welsch Citation2007; Luo et al. Citation2022). The robust fitting uses an iterative weighted least squares approach, giving varying weights to different samples until the regression coefficients converge and are not insensitive to the effects of noise. The same linear regression model is used to estimate the correlation of lake level time series change rate from monitoring and validation data. The accuracy evaluation metrics for linear regression model include the correlation (R2) and the root mean square error (RMSE). The formulas are as follows:
(4)
(4)
(5)
(5) When we linear fit the joint altimeter and validation data, n is the number of pairs;
is the validation water level value, of which
is the average;
is the synthesized water level value from altimetry observations, of which
is the average; and
is the bias of the average difference between synthesized satellite altimetry and validation data pairs. When linearly fitting the change rate of lake level, n is the number of lakes;
is the validation lake level change rate, of which
is the average;
is the synthesized lake level change rate from altimetry observations, of which
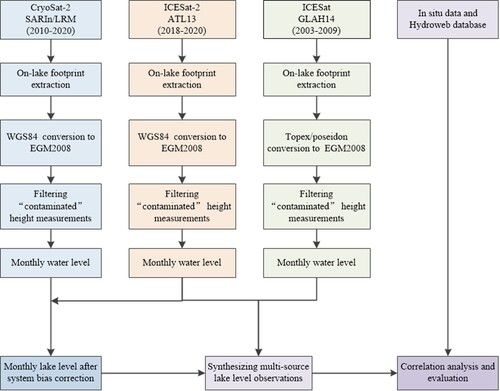
is the average. illustrates the processing and merging data from multiple sources.
Figure 2. Flowchart of deriving the time series of lake water level by synthesizing multiple satellite altimetry data.
4. Results
4.1. Analysis of lake level bias between different altimetry missions
In this study, we selected lake levels from ICESat-2 as the baseline. shows the difference between the ICESat relative to the ICESat-2. For the 48 lakes in this study, the biases of ICESat relative to ICESat-2 are distributed in the range of −0.29 to 0.22 m, with most of these lakes (29) distributed in the range of −0.15 to 0.15 m. In view of the random distribution of data biases, the different acquisition times and measurement locations between the satellite and validation data can be one of the major uncertainty sources that lead to the biases between ICESat and ICESat-2 data. As shown in , the deviation values are basically distributed around zero, both in the medium of in situ values and the Hydroweb data. Furthermore, the deviation values, lake sizes, or location latitudes have no strong relationships. Considering that the deviations are relatively small and have no overlapping observation periods between ICESat and ICESat-2/CryoSat-2, this study does not take the data biases as a systematic error for time series correction.
Figure 3. Data difference between ICESat and ICESat-2 in relation to location latitude (a) and lake area (b).
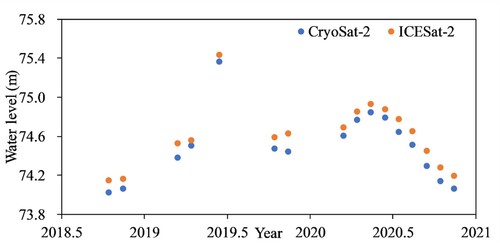
The mean difference between CryoSat-2 and ICESat-2 data for the same months is removed from the former as a systematic deviation. For the 48 study lakes, CryoSat-2 and ICESat-2 data are paired between October 2018 and December 2020. The number of pairs of observations, excluding the winter (January, February, and December) months, ranges from 3 to 21, with a mean value of approximately 13. represents the CryoSat-2 and ICESat-2 paired data for Lake Ontario (CryoSat-2 and ICESat-2 paired data for all lakes in Appendix Figure A1). The difference between each pair of CryoSat-2 relative to ICESat-2 data is not exactly the same due to random errors, the fact that the lake surface is not perfectly horizontal, and the inconsistency of the actual observation time. Of the study lakes, 54% (26/48) have a difference between the maximum and minimum pairing errors within 0.30 m. This situation indicates that the differences in the paired data are consistent. Therefore, considering the mean value of the paired data differences as the systematic deviation is reasonable.
Figure 4. Pairing results for CryoSat-2 and ICESat-2 in Lake Ontario.
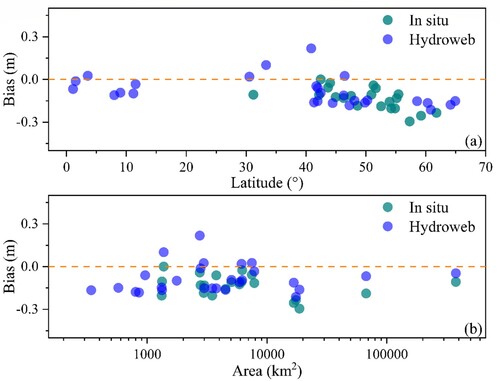
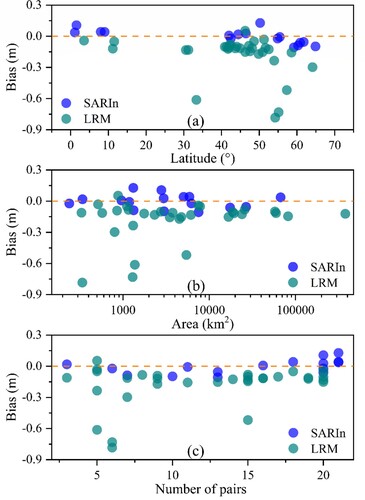
The systematic deviation between CryoSat-2 and ICESat-2 is distributed between −0.78 and 0.13 m. shows the relationship of the systematic deviations of CryoSat-2 and ICESat-2 within the lake area, absolute values of latitudes, and the number of pairs. The majority (39 of 48 lakes) of the systematic deviations are negative. Regarding different satellite modes, only Lake Nipissing has a systematic deviation greater than zero in the CryoSat-2 LRM mode, which is 0.05 m. The systematic deviation for the other lakes is distributed between −0.78 and −0.03 m. In the SARIn mode of CryoSat-2, the systematic deviations distribute more balance. Eight lakes have positive systematic deviations and eight are negative, ranging from −0.11 to 0.13 m. The systematic bias values of the SARIn mode are smaller for the same latitude or for the same lake size. a shows that the systematic bias for lakes at low latitudes approaches zero, but systematic deviation partially increases with increasing latitude. The winter lake ice cover strongly affects the radar altimetry signal, causing the measured elevations to be lower than the actual lake surface elevation (Birkett and Beckley Citation2010; Crétaux and Birkett Citation2006; Ziyad et al. Citation2020). Although the winter paired results are removed, certain biases remain due to the uncertainty of the ice period. b shows that the system deviation gradually stabilizes around zero meters as the lake area increases. c represents the variation of the system deviation with the number of pairs. The magnitude of the deviation is clearly not significantly related to the number of pairs.
Figure 5. Relationship between CryoSat-2 systematic deviation and (a) location latitude; (b) lake area; and (c) the number of pairs.
4.2. Accuracy evaluation of the synthesized lake level time series
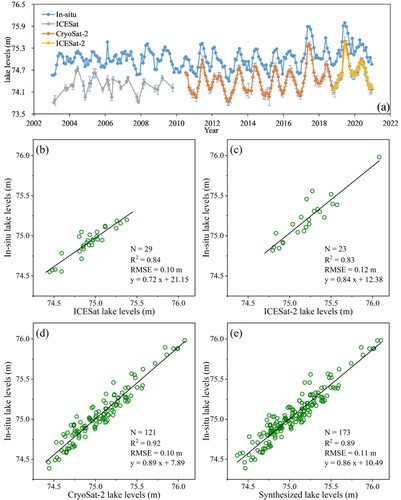
We calculate the mean monthly water levels from the satellite altimetry and validation data. Each altimeter data are paired with the validation data by month. a represents the water level time series of the satellite altimetry and in situ data for Lake Ontario (other lakes are shown in Appendix Figure A2 and the lake information is listed in Appendix ). The apparent offset in the Figure is attributed to the inconsistent height reference systems between the altimeter and in situ data (in local height reference). b–e represent the scatter plots of ICESat, ICESat-2, CryoSat-2, and the synthesized altimetry paired with in situ water level data. As shown in , the ICESat, ICESat-2, and CryoSat-2 altimetry derived lake levels strongly correlate with in situ measurements. In addition, the data from the multiple altimeters paired with the in situ data have high agreement and low error, with a value of 0.86 for R2 and 0.11 m for RMSE.
Figure 6. Comparison of lake water levels derived from satellite altimetry data and in situ measurements for Ontario Lake during 2003–2020. Water level time series (a); ICESat (b), ICESat-2 (c), CryoSat-2 (d), ICESat & ICESat-2 & CryoSat-2 (e).
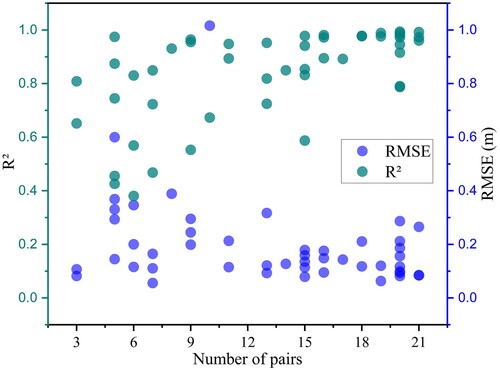
By pairing the ICESat, ICESat-2, and CryoSat-2 observations with the validation data for each lake, we obtain R2 and RMSE, presented in . As shown in a and b, although a few lakes have a low coefficient of determination R2, the overall R2 can reach approximately 0.8. c and d demonstrates that the overall RMSE is approximately 0.2 m. Of the 21 lakes with in situ data as validation data, the average RMSE is 0.21 m and 14 lakes have a high correlation between the synthesized altimetry and the in situ data (R2 > 0.8). Of the 27 lakes with Hydroweb data as validation data, the mean RMSE is 0.19 m, and 20 lakes have a high correlation between the synthesized and Hydroweb data. Overall, the combined data from the three satellites correlates well with the validation data with a small RMSE and can effectively reflect the actual water level fluctuations. Differences in the results of the synthetic data involve the SARIn and LRM modes of CryoSat-2. represents the R2 and RMSE of the synthetic and validation data in two separate modes. The synthetic data in SARIn mode has a higher R2 (mean value of 0.89) and a lower RMSE (mean value of 0.19 m). The possible reasons for this are the smaller footprint in SARIn mode, which has a high spatial resolution. shows the effect of CryoSat-2 and ICESat-2 pairs on the results. The number of pairs affects the synthetic data by influencing the results of the systematic bias correction for CryoSat-2. As the number of pairs increases, the results are more robust with more concentrated R2 and RMSE values.
Figure 7. Box plot representing R2 and RMSE of satellite and validation data (gauge station and Hydroweb data).
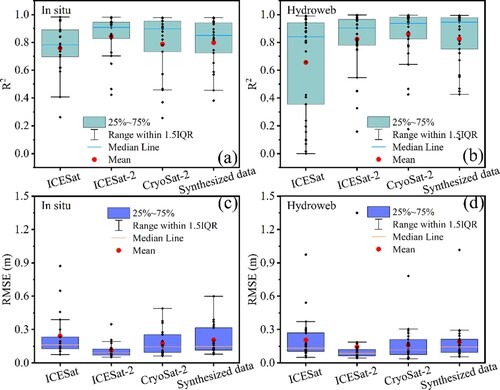
Figure 8. Box plot representing R2 and RMSE of synthesized data (using CryoSat-2 SARIn and LRM modes, respectively) and validation data.
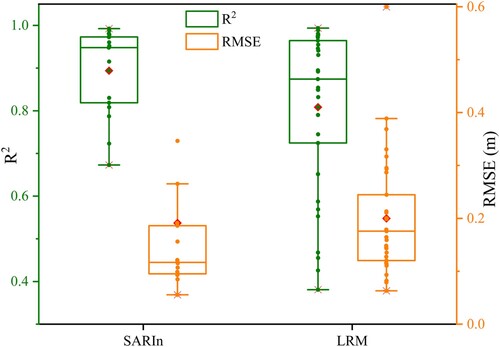
Figure 9. R2 and RMSE of synthesized and validation data versus the number of CryoSat-2 and ICESat-2 pairs.
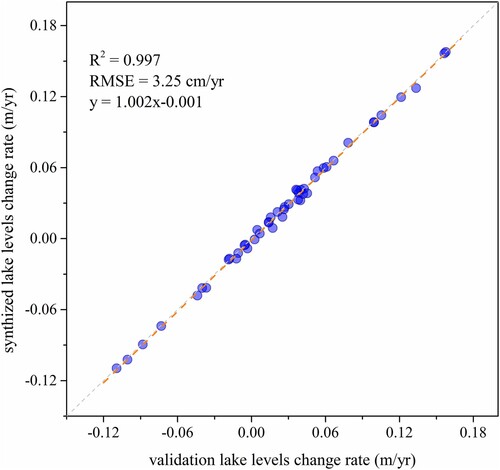
We use satellite altimetry data to obtain lake levels, mainly for monitoring changes in water levels over time. The change rates of water levels are an important indicator to reflect the hydrologic dynamics of lakes. The ICESat/ICESat-2 and corrected CryoSat-2 data are combined as multiple altimetry satellite to obtain lake level time series. This study uses a robust fitting method to obtain the water level change rate from the multiple altimetry satellite and validation data from 2003 to 2020. represents the relationship between the synthesized satellite and the validation data regarding the rate of lake level changes. The figure shows that the change rates of lake levels obtained from the combined ICESat, ICESat-2, and CryoSat-2 data are almost identical to the change rate in water levels from the validation data. R2 reaches 0.997 and the RMSE is 3.25 cm/yr.
Figure 10. Scatter plot of lake level change rates between the validation and synthesized data.
5. Discussion
5.1. Comparison of different methods for calibrating CryoSat-2 and ICESat-2 data
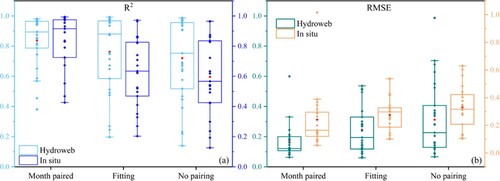
Calibration between altimeters is essential to establish a uniform water level time series. The first step is to search cross-measurement points on the lake track at the same time. However, the ideal number of crossover points is insufficient in the actual process. The above-analyzed results adopt the approach of correcting the CryoSat-2 data based on the pairing lake level difference of CryoSat-2 and ICESat-2 monthly data (Method-1). Here, we compare the results with those derived from two other methods of correcting CryoSat-2 data, which are the least-squares fitting relationship of paired observations (Method-2) and calculating the CryoSat-2 and ICESat-2 difference without considering their temporal match (Method-3). shows the box diagram of the R2 and RMSE obtained by the three methods and the validation data, which clearly show that the difference in R2 is relatively significant. Method-1 has the R2 range from 0.38 to 0.99, with a mean value of 0.84. The other two methods show R2 mean values of 0.70 and 0.67. The differences between using Hydroweb and in situ data as validation are also noticeable. Hydroweb data synthesized with radar data correlates better with satellite synthesized in this study data. The RMSEs of the three methods slightly differ, all at the decimeter level. However, the RMSE for Method-1 is 0.20 m, slightly less than the 0.26 and .32 m for Methods-2 and −3, respectively. Overall, the data consistency and the bias results show that the results of Method-1 are acceptable. Nevertheless, Method-3 can be considered for coarse corrections only with little or no matched data and when lake level fluctuations are not significant.
Figure 11. R2 (a) and RMSE (b) of the joint satellite and validation data are obtained by three different correction methods: Method-1 (Month paired), Method-2 (Fitting), and Method-3 (No pairing).
5.2. Uncertainties CryoSat-2 calibration results
We calculate the monthly water levels of the satellites, and its use in calculating the CryoSat-2 system deviation leads to uncertainty when comparing the difference between CryoSat-2 and ICESat-2 satellite data. In this part, we separately calculate the systematic deviation of CryoSat-2 relative to ICESat-2 using one day-matched, 10 days-matched, and semimonthly-matched data, and compare them with the monthly-matched data (all the above matches exclude the winter months of December, January, and February). The number of CryoSat-2 and ICESat-2 data matches must still be greater than or equal to 3, in the same way as matching by month. Of the 48 study lakes, 25 have day-matched data, with 15 of the LRM mode with deviation values ranging from −1.01 to −0.07 m and 10 of the SARIn mode with deviation values ranging −0.12 to 0.15 m. In the 10 days of matching, system deviations can be calculated for 41 lakes, distributed in the range of −0.82 to 0.09 m. In the half-monthly data matching, 44 study lakes have CryoSat-2 bias from −0.91 to 0.09 m. shows that, as the paired data become more demanding (from month to day), the deviations disperse further across the different lakes, and the distribution of the magnitude of deviation values partially changes. However, the broad range does not significantly differ. presents the systematic deviation of CryoSat-2 for the lakes at different matching time windows. Most of the lakes have small differences in the system deviation values but a few individual lakes have greater than 0.10 m differences, as calculated using daily or monthly data matching.
Figure 12. Systematic deviations of CryoSat-2 relative to ICESat-2 calculated for different matching times.
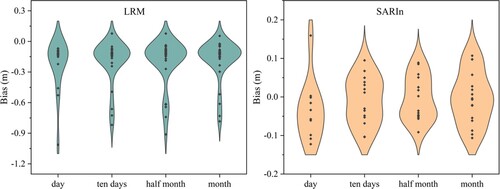
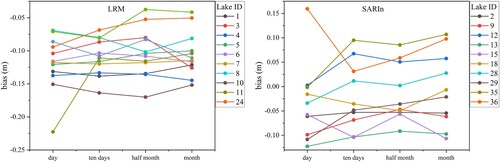
Figure 13. Systematic bias of CryoSat-2 data for different matching time windows.
5.3. Global lakes covered by synthesized altimetry observations
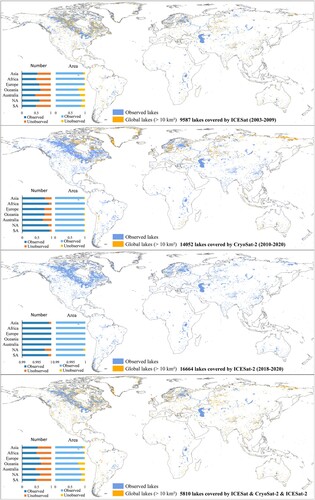
The combination of ICESat, ICESat-2, and CryoSat-2 aims to obtain a long-term water level series for a broader range of lakes. Therefore, the global lake coverage by the three satellites needs to be explored. The number and area of lakes that can be observed vary from different altimeters. As inventoried in HydroLAKES, 16,689 lakes are greater or equal to 10 km2. ICESat, CryoSat-2, and ICESat-2 can monitor 9,587, 14,052, and 16,664 lakes, respectively, of which 7,300, 13,389, and 15,593 have more than five observation dates over the study periods. The three satellite tracks jointly cover 8,186 lakes, of which 5,810 have more than five observation dates per satellite, with a total area of 1.83 × 10⁶ km2 and 84.78% of the global lake area. shows the coverage of lakes by different altimeters and the proportion of the number and area of monitored and unmonitored lakes by continent (where NA and SA indicate North and South America, respectively).
Figure 14. Coverage of global lakes by different satellites.
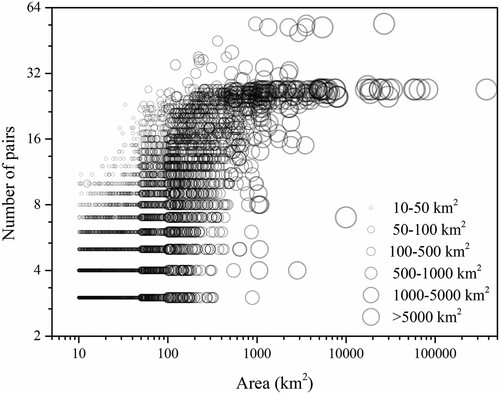
Furthermore, among these 5,810 lakes covered by the three satellite tracks, 3,744 have more than two pairs of CryoSat-2 and ICESat-2 observations between 2018 and 2020. The area of these lakes is 1.70 × 10⁶ km2, accounting for 78.99% of the total area of all lakes exceeding 10 km2. shows the relationship of the number of observation pairs varying with the lake area. The number of paired months for lakes larger than 300 km2 can basically reach 7, and almost all 27 (2018.10–2020.12) for lakes up to 1000 km2. The above data show that the joint use of ICESat, ICESat-2, and CryoSat-2 satellites cover most of the global lake areas and can be applied to construct a time series of water levels over the past two decades.
Figure 15. Relationship between the number of pairs of CryoSat-2 and ICESat-2 and the lake area.
6. Conclusions
This study investigates the biases in the joint use of ICESat, ICESat-2, and CryoSat-2 data and evaluates the performances of the synthesized data. We select 48 lakes worldwide with in situ or Hydroweb data as study cases. The multi-mission satellite altimetry lake levels are extracted separately, and all the water level records are converted to the consistent reference system of the EGM2008 geoid. We calculate the difference between the data from ICESat and ICESat-2 based on the mean deviation against the validation data. However, given the relatively slight difference between ICESat and ICESat-2 data and the calibration of their randomly scattered deviations lack temporally overlapping observations, this study does not correct the time series of two laser altimeters. For each study lake, the systematic bias of CryoSat-2 is calculated and calibrated based on the average difference of paired lake level observations between CryoSat-2 and ICESat-2 during the overlap period (October 2018 to December 2020). The ICESat, ICESat-2, and CryoSat-2 data are integrated into a more extended, denser time series of lake levels. The synthesized water level data for the 48 lakes are evaluated against in situ or Hydroweb water level data from 2003 to 2020.
For the study lakes, the mean bias between CryoSat-2 and ICESat-2 ranges from −0.78 to 0.13 m. We obtain consistent measurements for each lake by calibrating CryoSat-2 data to the ICESat/ICESat-2 time series. The performance evaluation shows that the combined measurements from multiple satellite altimetry data correlated well with gauged or Hydroweb validation data, with an average R2 is 0.84. More specifically, the evaluation with gauged data for 21 lakes shows an average R2 of 0.80 and a mean RMSE of approximately 0.21 m. In terms of different CryoSat-2 modes, the SARIn mode performance is better than LRM with a higher R2 and smaller RMSE. After obtaining the lake level time series, we calculate the change rate for the combined ICESat/ICESat-2 and CryoSat-2 data by using a robust fit method and compared it with that from the validation data. The results show a strong correlation with R2 reaching 0.997 and the RMSE of 3.25 cm/yr. To investigate the potential of synthesizing the water level observations from the three missions for global lakes, we confirm that 3,744 lakes larger than 10 km2 worldwide (78.99% of the total lake area) are jointly covered by ICESat, ICESat-2 and CryoSat-2 and have more than two observation pairs of the latter 2 during 2018–2020.
This study demonstrates that the CryoSat-2 altimetry data have the potential to fill the observation gap of the ICESat/ICESat-2 altimetry missions. The CryoSat-2 altimeter can be considered an acceptable bridge to the ICESat/ICESat-2 altimetry missions for monitoring global lake level changes over the past two decades. In the future, this study focuses on producing the long-term and consecutive water level data for the globally observed lakes with further accurate calculation of systematic errors among satellite altimetry missions.
Acknowledgements
We sincerely appreciate the National Aeronautics and Space Administration (NASA) for providing the ICESat/ICESat-2 data (https://nsidc.org/data/), the National Environmental Satellite, Data, and Information Service (NESDIS) for providing the CryoSat-2 data (ftp://ftp.star.nesdis.noaa.gov/pub/sod/lsa/cs2igdr/), the Hydroweb for providing the data of lake level series (http://hydroweb.theia-land.fr/).
Disclosure statement
No potential conflict of interest was reported by the author(s).
Additional information
Funding
References
- Abdalati, W., H. J. Zwally, R. Bindschadler, B. Csatho, S. L. Farrell, H. A. Fricker, D. Harding, et al. 2010. “The ICESat-2 Laser Altimetry Mission.” Proceedings of the IEEE 98 (5): 735–751. doi:10.1109/JPROC.2009.2034765.
- Adrian, R., C. M. O’Reilly, H. Zagarese, S. B. Baines, D. O. Hessen, W. Keller, D. M. Livingstone, et al. 2009. “Lakes as Sentinels of Climate Change.” Limnology and Oceanography 54 (6part2): 2283–2297. doi:10.4319/lo.2009.54.6_part_2.2283
- Berry, P. 2002. “Global River and Lake Height Monitoring Using Satellite Altimeter Data.” International Journal on Hydropower & Dams 9 (6): 52–54.
- Berry, P., J. Garlick, J. Freeman, and E. Mathers. 2005. “Global Inland Water Monitoring from Multi-Mission Altimetry.” Geophysical Research Letters 32 (16): L16401. doi:10.1029/2005GL022814.
- Birkett, C. M., and B. Beckley. 2010. “Investigating the Performance of the Jason-2/OSTM Radar Altimeter Over Lakes and Reservoirs.” Marine Geodesy 33 (S1): 204–238. doi:10.1080/01490419.2010.488983.
- Bosch, W., D. Dettmering, and C. Schwatke. 2014. “Multi-mission Cross-Calibration of Satellite Altimeters: Constructing a Long-Term Data Record for Global and Regional sea Level Change Studies.” Remote Sensing 6 (3): 2255–2281. doi:10.3390/rs6032255.
- Bouzinac, C. 2019. “CryoSat Product Handbook.” ESA UCL. https://earth.esa.int/documents/10174/125272/CryoSat-Baseline-D-Product-Handbook.
- Busker, T., A. de Roo, E. Gelati, C. Schwatke, M. Adamovic, B. Bisselink, J.-F. Pekel, et al. 2019. “A Global Lake and Reservoir Volume Analysis Using a Surface Water Dataset and Satellite Altimetry.” Hydrology and Earth System Sciences 23 (2): 669–690. doi:10.5194/hess-23-669-2019
- Calmant, S., F. Seyler, and J. F. Cretaux. 2008. “Monitoring Continental Surface Waters by Satellite Altimetry.” Surveys in Geophysics 29 (4): 247–269. doi:10.1007/s10712-008-9051-1.
- Chen, J., and J. Liao. 2020. “Monitoring Lake Level Changes in China Using Multi-Altimeter Data (2016–2019).” Journal of Hydrology 590, 125544. doi:10.1016/j.jhydrol.2020.125544.
- Chipman, J., and T. Lillesand. 2007. “Satellite-Based Assessment of the Dynamics of New Lakes in Southern Egypt.” International Journal of Remote Sensing 28 (19): 4365–4379. doi:10.1080/01431160701241787.
- Crétaux, J. F., R. Abarca-del-Río, M. Bergé-Nguyen, A. Arsen, V. Drolon, G. Clos, and P. Maisongrande. 2016. “Lake Volume Monitoring from Space.” Surveys in Geophysics 37 (2): 269–305. doi:10.1007/s10712-016-9362-6.
- Crétaux, J. F., A. Arsen, S. Calmant, A. Kouraev, V. Vuglinski, M. Bergé-Nguyen, M. C. Gennero, et al. 2011. “SOLS: A Lake Database to Monitor in the Near Real Time Water Level and Storage Variations from Remote Sensing Data.” Advances in Space Research 47 (9): 1497–1507. doi:10.1016/j.asr.2011.01.004.
- Crétaux, J.-F., and C. Birkett. 2006. “Lake Studies from Satellite Radar Altimetry.” Comptes Rendus Geoscience 338 (14-15): 1098–1112. doi:10.1016/j.crte.2006.08.002.
- Dettmering, D., L. Ellenbeck, D. Scherer, C. Schwatke, and C. Niemann. 2020. “Potential and Limitations of Satellite Altimetry Constellations for Monitoring Surface Water Storage Changes—A Case Study in the Mississippi Basin.” Remote Sensing 12 (20): 3320. doi:10.3390/rs12203320.
- Duan, Z., and W. Bastiaanssen. 2013. “Estimating Water Volume Variations in Lakes and Reservoirs from Four Operational Satellite Altimetry Databases and Satellite Imagery Data.” Remote Sensing of Environment 134: 403–416. doi:10.1016/j.rse.2013.03.010.
- Dubey, A., P. Gupta, S. Dutta, and R. Singh. 2015. “An Improved Methodology to Estimate River Stage and Discharge Using Jason-2 Satellite Data.” Journal of Hydrology 529: 1776–1787. doi:10.1016/j.jhydrol.2015.08.009.
- European Space Agency. 2018. Mullar Space Science Laboratory CryoSat Product Handbook. Paris, France: European Space Agency. https://earth.esa.int/eogateway/search?text=&category=Document%20library&filter=cryosat&subFilter=product%20handbook&sortby=RELEVANCE.
- Feng, Y., H. Zhang, S. Tao, Z. Ao, C. Song, J. Chave, T. Le Toan, et al. 2022. “Decadal Lake Volume Changes (2003–2020) and Driving Forces at a Global Scale.” Remote Sensing 14 (4). doi:10.3390/rs14041032.
- Ghiggi, G., V. Humphrey, S. I. Seneviratne, and L. Gudmundsson. 2021. “G-RUN ENSEMBLE: A Multi-Forcing Observation-Based Global Runoff Reanalysis.” Water Resources Research 57 (5). doi:10.1029/2020WR028787.
- Höhle, J., and M. Höhle. 2009. “Accuracy Assessment of Digital Elevation Models by Means of Robust Statistical Methods.” ISPRS Journal of Photogrammetry and Remote Sensing 64 (4): 398–406. doi:10.1016/j.isprsjprs.2009.02.003.
- Holland, P. W., and R. E. Welsch. 2007. “Robust Regression Using Iteratively Reweighted Least-Squares.” Communications in Statistics – Theory and Methods 6 (9): 813–827. doi:10.1080/03610927708827533.
- Hwang, C., Y.-S. Cheng, W.-H. Yang, G. Zhang, Y.-R. Huang, W.-B. Shen, and Y. Pan. 2019. “Introduction to the Special Issue on Tibet: Contemporary Geodetic-Geophysical Observations and Interpretations.” Terrestrial, Atmospheric and Oceanic Sciences 30: 1–5. doi:10.3319/TAO.2019.01.22.01.
- Jasinski, M. F., J. D. Stoll, W. B. Cook, M. Ondrusek, E. Stengel, and K. Brunt. 2016. “Inland and Near-Shore Water Profiles Derived from the High-altitude Multiple Altimeter Beam Experimental Lidar (MABEL).” Journal of Coastal Research 76 (10076): 44–55. doi:10.2112/SI76-005
- Jasinski, M. F., J. D. Stoll, D. Hancock, J. Robbins, J. Nattala, J. Morison, B. M. Jones, et al. 2021a. ATLAS/ICESat-2 L3A Along Track Inland Surface Water Data, Version 5 [ATL13]. Boulder, Colorado: NASA National Snow and Ice Data Center Distributed Active Archive Center. doi:10.5067/ATLAS/ATL13.005.
- Jasinski, M., J. Stoll, D. Hancock, J. Robbins, J. Nattala, and T. Pavelsky. 2021b. 10. “Algorithm Theoretical Basis Document (ATBD) for Inland Water Data Products ATL13 Version 005.” NASA Goddard Space Flight Center, August 31. https://nsidc.org/sites/nsidc.org/files/technical-references/ICESat2_ATL13_ATBD_r005.pdf.
- Jiang, L., K. Nielsen, O. B. Andersen, and P. Bauer-Gottwein. 2017a. “Monitoring Recent Lake Level Variations on the Tibetan Plateau Using CryoSat-2 SARIn Mode Data.” Journal of Hydrology 544: 109–124. doi:10.1016/j.jhydrol.2016.11.024.
- Jiang, L., R. Schneider, O. B. Andersen, and P. Bauer-Gottwein. 2017b. “CryoSat-2 Altimetry Applications Over Rivers and Lakes.” Water (Switzerland) 9 (3). doi:10.3390/w9030211.
- Khazaei, B., L. K. Read, M. Casali, K. M. Sampson, and D. N. Yates. 2022. “GLOBathy, the Global Lakes Bathymetry Dataset.” Scientific Data 9 (1): 36. doi:10.1038/s41597-022-01132-9
- Koo, Y., H. Xie, N. T. Kurtz, S. F. Ackley, and A. M. Mestas-Nuñez. 2021. “Weekly Mapping of Sea Ice Freeboard in the Ross Sea from ICESat-2.” Remote Sensing 13 (16). doi:10.3390/rs13163277.
- Kropacek, J., A. Braun, S. Kang, C. Feng, Q. Ye, and V. Hochschild. 2012. “Analysis of Lake Level Changes in Nam Co in Central Tibet Utilizing Synergistic Satellite Altimetry and Optical Imagery.” International Journal of Applied Earth Observation and Geoinformation 17: 3–11. doi:10.1016/j.jag.2011.10.001.
- Kwok, R., H. J. Zwally, and D. Yi. 2004. “ICESat Observations of Arctic Sea Ice: A First Look.” Geophysical Research Letters 31: L16401. doi:10.1029/2004GL020309.
- Legesse, D., C. Vallet-Coulomb, and F. Gasse. 2004. “Analysis of the Hydrological Response of a Tropical Terminal Lake, Lake Abiyata(Main Ethiopian Rift Valley) to Changes in Climate and Human Activities.” Hydrological Processes 18 (3): 487–504. doi:10.1002/hyp.1334.
- Lei, Y., T. Yao, K. Yang, B. W. Bird, L. Tian, X. Zhang, W. Wang, et al. 2018. “An Integrated Investigation of Lake Storage and Water Level Changes in the Paiku Co Basin, Central Himalayas.” Journal of Hydrology 562: 599–608. doi:10.1016/j.jhydrol.2018.05.040.
- Leuliette, E. W., R. S. Nerem, and G. T. Mitchum. 2004. “Calibration of TOPEX/Poseidon and Jason Altimeter Data to Construct a Continuous Record of Mean Sea Level Change.” Marine Geodesy 27 (1-2): 79–94. doi:10.1080/01490410490465193.
- Li, P., H. Li, F. Chen, and X. Cai. 2020. “Monitoring Long-Term Lake Level Variations in Middle and Lower Yangtze Basin Over 2002-2017 Through Integration of Multiple Satellite Altimetry Datasets.” Remote Sensing 12 (9). doi:10.3390/RS12091448.
- Li, X., D. Long, Q. Huang, P. Han, F. Zhao, and Y. Wada. 2019. “High-temporal-resolution Water Level and Storage Change Data Sets for Lakes on the Tibetan Plateau During 2000–2017 Using Multiple Altimetric Missions and Landsat-Derived Lake Shoreline Positions.” Earth System Science Data 11 (4): 1603–1627. doi:10.5194/essd-11-1603-2019
- Lu, S., L. Jia, L. Zhang, Y. Wei, M. H. A. Baig, Z. Zhai, J. Meng, et al. 2017. “Lake Water Surface Mapping in the Tibetan Plateau Using the MODIS MOD09Q1 Product.” Remote Sensing Letters 8 (3): 224–233. doi:10.1080/2150704X.2016.1260178.
- Lu, S., B. Wu, N. Yan, F. Li, M. Wen, and J. Wang. 2010. “Progress in River Runoff Monitoring by Remote Sensing.” Advances in Earth Science 25 (8): 820–826. doi:10.11867/j.issn.1001-8166.2010.08.0820.
- Luo, S., C. Song, L. Ke, P. Zhan, C. Fan, K. Liu, T. Chen, et al. 2022. “Satellite Laser Altimetry Reveals a Net Water Mass Gain in Global Lakes with Spatial Heterogeneity in the Early 21st Century.” Geophysical Research Letters 49 (3). doi:10.1029/2021gl096676.
- Markus, T., T. Neumann, A. Martino, W. Abdalati, K. Brunt, B. Csatho, S. Farrell, et al. 2017. “The Ice, Cloud, and Land Elevation Satellite-2 (ICESat-2): Science Requirements, Concept, and Implementation.” Remote Sensing of Environment 190: 260–273. doi:10.1016/j.rse.2016.12.029.
- Messager, M. L., B. Lehner, G. Grill, I. Nedeva, and O. Schmitt. 2016. “Estimating the Volume and Age of Water Stored in Global Lakes Using a Geo-Statistical Approach.” Nature Communications 7 (1): 1–11. doi:10.1038/ncomms13603.
- Meyer, M. F., S. G. Labou, A. N. Cramer, M. R. Brousil, and B. T. Luff. 2020. “The Global Lake Area, Climate, and Population Dataset.” Scientific Data 7 (1): 1–12. doi:10.1038/s41597-020-0517-4
- Neumann, T. A., A. J. Martino, T. Markus, S. Bae, M. R. Bock, A. C. Brenner, K. M. Brunt, et al. 2019. “The Ice, Cloud, and Land Elevation Satellite – 2 Mission: A Global Geolocated Photon Product Derived from the Advanced Topographic Laser Altimeter System.” Remote Sensing of Environment 233: 111325. doi:10.1016/j.rse.2019.111325.
- Phan, V. H., R. Lindenbergh, and M. Menenti. 2012. “ICESat Derived Elevation Changes of Tibetan Lakes Between 2003 and 2009.” International Journal of Applied Earth Observation and Geoinformation 17: 12–22. doi:10.1016/j.jag.2011.09.015.
- Qiao, G., Y. Li, S. Guo, and W. Ye. 2019b. “Evolving Instability of the Scar Inlet ice Shelf Based on Sequential Landsat Images Spanning 2005–2018.” Remote Sensing 12 (1): 36. doi:10.3390/rs12010036.
- Qiao, B., L. Zhu, J. Wang, J. Ju, Q. Ma, L. Huang, H. Chen, et al. 2019a. “Estimation of Lake Water Storage and Changes Based on Bathymetric Data and Altimetry Data and the Association with Climate Change in the Central Tibetan Plateau.” Journal of Hydrology 578: 124052. doi:10.1016/j.jhydrol.2019.124052.
- Quartly, G. D., G. Chen, F. Nencioli, R. Morrow, and N. Picot. 2021. “An Overview of Requirements, Procedures and Current Advances in the Calibration/Validation of Radar Altimeters.” Remote Sensing 13 (1): 125. doi:10.3390/rs13010125.
- Schumann, G. J. P., D. K. Moller, L. Croneborg-Jones, and K. M. Andreadis. 2022. “Reviewing Applications of Remote Sensing Techniques to Hydrologic Research in Sub-Saharan Africa, with a Special Focus on the Congo Basin.” In Congo Basin Hydrology, Climate, and Biogeochemistry: A Foundation for the Future, 295–321. doi:10.1002/9781119657002.ch16.
- Schutz, B. E., H. J. Zwally, C. A. Shuman, D. Hancock, and J. P. DiMarzio. 2005. “Overview of the ICESat Mission.” Geophysical Research Letters 32 (21). doi:10.1029/2005GL024009.
- Schwatke, C., D. Dettmering, W. Bosch, and F. Seitz. 2015. “DAHITI – an Innovative Approach for Estimating Water Level Time Series Over Inland Waters Using Multi-Mission Satellite Altimetry.” Hydrology and Earth System Sciences 19 (10): 4345–4364. doi:10.5194/hess-19-4345-2015.
- Shu, S., H. Liu, R. A. Beck, F. Frappart, J. Korhonen, M. Lan, M. Xu, et al. 2021. “Evaluation of Historic and Operational Satellite Radar Altimetry Missions for Constructing Consistent Long-Term Lake Water Level Records.” Hydrology and Earth System Sciences 25 (3): 1643–1670. doi:10.5194/hess-25-1643-2021.
- Song, C., B. Huang, and L. Ke. 2015. “Heterogeneous Change Patterns of Water Level for Inland Lakes in High Mountain Asia Derived from Multi-Mission Satellite Altimetry.” Hydrological Processes 29 (12): 2769–2781. doi:10.1002/hyp.10399.
- Song, C., Q. Ye, and X. Cheng. 2015. “Shifts in Water-Level Variation of Namco in the Central Tibetan Plateau from ICESat and CryoSat-2 Altimetry and Station Observations.” Science Bulletin 60 (14): 1287–1297. doi:10.1007/s11434-015-0826-8.
- Song, C., Q. Ye, Y. Sheng, and T. Gong. 2015. “Combined ICESat and CryoSat-2 Altimetry for Accessing Water Level Dynamics of Tibetan Lakes Over 2003-2014.” Water 7 (9): 4685–4700. doi:10.3390/w7094685.
- Tang, H., S. Lu, M. H. Ali Baig, M. Li, C. Fang, and Y. Wang. 2022. “Large-Scale Surface Water Mapping Based on Landsat and Sentinel-1 Images.” Water 14 (9). doi:10.3390/w14091454.
- Tang, H., S. Lu, Y. Cheng, L. Ge, J. Zhang, H. Dong, and H. Shao. 2019. “Analysis of Dynamic Changes and Influence Factors of Lake Balkhash in the Last Twenty Years.” Journal of Groundwater Science and Engineering 7 (3): 214–223. doi:10.19637/j.cnki.2305-7068.2019.03.002.
- Urban, T. J., B. E. Schutz, and A. L. Neuenschwander. 2008. “A Survey of ICESat Coastal Altimetry Applications: Continental Coast, Open Ocean Island, and Inland River.” Terrestrial, Atmospheric and Oceanic Sciences 19: 1–19. doi:10.3319/TAO.2008.19.1-2.1(SA).
- Wang, F., J. L. Bamber, and X. Cheng. 2015. “Accuracy and Performance of CryoSat-2 SARIn Mode Data Over Antarctica.” Ieee Geoscience and Remote Sensing Letters 12 (7): 1516–1520. doi:10.1109/LGRS.2015.2411434.
- Wang, X., X. Cheng, P. Gong, H. Huang, Z. Li, and X. Li. 2011. “Earth Science Applications of ICESat/GLAS: A Review.” International Journal of Remote Sensing 32 (23): 8837–8864. doi:10.1080/01431161.2010.547533.
- Wingham, D., C. Francis, S. Baker, C. Bouzinac, D. Brockley, R. Cullen, P. de Chateau-Thierry, et al. 2006. “CryoSat: A Mission to Determine the Fluctuations in Earth’s Land and Marine ice Fields.” Advances in Space Research 37 (4): 841–871. doi:10.1016/j.asr.2005.07.027.
- Woolway, R. I., and C. J. Merchant. 2019. “Worldwide Alteration of Lake Mixing Regimes in Response to Climate Change.” Nature Geoscience 12 (4): 271–276. doi:10.1038/s41561-019-0322-x.
- Xu, F., G. Zhang, S. Yi, and W. Chen. 2022. “Seasonal Trends and Cycles of Lake-Level Variations Over the Tibetan Plateau Using Multi-Sensor Altimetry Data.” Journal of Hydrology 604. doi:10.1016/j.jhydrol.2021.127251.
- Xu, N., H. Zheng, Y. Ma, J. Yang, X. Liu, and X. Wang. 2021. “Global Estimation and Assessment of Monthly Lake/Reservoir Water Level Changes Using ICESat-2 ATL13 Products.” Remote Sensing 13: 2744. doi:10.3390/rs13142744.
- Yang, K., L. Karlstrom, L. C. Smith, and M. Li. 2016. “Automated High-Resolution Satellite Image Registration Using Supraglacial Rivers on the Greenland ice Sheet.” IEEE Journal of Selected Topics in Applied Earth Observations and Remote Sensing 10 (3): 845–856. doi:10.1109/JSTARS.2016.2617822.
- Yang, K., L. C. Smith, L. C. Andrews, X. Fettweis, and M. Li. 2022. “Supraglacial Drainage Efficiency of the Greenland Ice Sheet Estimated from Remote Sensing and Climate Models.” Journal of Geophysical Research: Earth Surface 127: e2021JF006269. doi:10.1029/2021JF006269.
- Yao, F. 2020. Global Spatiotemporal Dynamics of Inland Water Body Storage During the Satellite Altimetry Era. Manhattan, Kansas,Kansas State University.
- Yi, S., Q. Wang, L. Chang, and W. Sun. 2016. “Changes in Mountain Glaciers, Lake Levels, and Snow Coverage in the Tianshan Monitored by GRACE, ICESat, Altimetry, and MODIS.” Remote Sensing 8: 798. doi:10.3390/rs8100798.
- Yuan, C., P. Gong, and Y. Bai. 2020. “Performance Assessment of ICESat-2 Laser Altimeter Data for Water-Level Measurement Over Lakes and Reservoirs in China.” Remote Sensing 12 (5), 770. doi:10.3390/rs12050770.
- Yue, L., H. Shen, L. Zhang, X. Zheng, F. Zhang, and Q. Yuan. 2017. “High-quality Seamless DEM Generation Blending SRTM-1, ASTER GDEM v2 and ICESat/GLAS Observations.” ISPRS Journal of Photogrammetry and Remote Sensing 123: 20–34. doi:10.1016/j.isprsjprs.2016.11.002.
- Zhang, G., W. Chen, and H. Xie. 2019. “Tibetan Plateau’s Lake Level and Volume Changes from NASA’s ICESat/ICESat-2 and Landsat Missions.” Geophysical Research Letters 46 (22): 13107–13118. doi:10.1029/2019GL085032.
- Zhang, G., H. Xie, S. Duan, M. Tian, and D. Yi. 2011. “Water Level Variation of Lake Qinghai from Satellite and In Situ Measurements Under Climate Change.” Journal of Applied Remote Sensing 5 (1): 053532. doi:10.1117/1.3601363.
- Zhang, G., H. Xie, T. Yao, and S. Kang. 2013. “Water Balance Estimates of Ten Greatest Lakes in China Using ICESat and Landsat Data.” Chinese Science Bulletin 58 (31): 3815–3829. doi:10.1007/s11434-013-5818-y.
- Zhou, J., L. Wang, X. Zhong, T. Yao, J. Qi, Y. Wang, and Y. Xue. 2022. “Quantifying the Major Drivers for the Expanding Lakes in the Interior Tibetan Plateau.” Science Bulletin 67 (5): 474–478. doi:10.1016/j.scib.2021.11.010.
- Ziyad, J., K. Goïta, R. Magagi, F. Blarel, and F. Frappart. 2020. “Improving the Estimation of Water Level Over Freshwater ice Cover Using Altimetry Satellite Active and Passive Observations.” Remote Sensing 12 (6): 967. doi:10.3390/rs12060967.
- Zwally, H. J., B. Schutz, W. Abdalati, J. Abshire, C. Bentley, A. Brenner, J. Bufton, et al. 2002. “ICESat’s Laser Measurements of Polar Ice, Atmosphere, Ocean, and Land.” Journal of Geodynamics 34 (3-4): 405–445. doi:10.1016/S0264-3707(02)00042-X.
Appendix
Table A1. Information for study lakes.
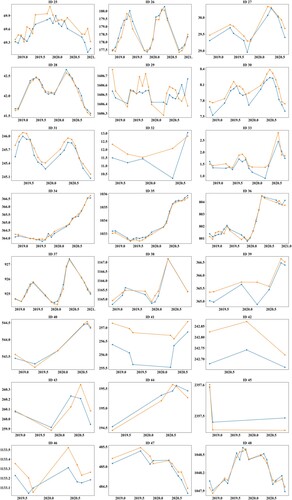
Figure A1. Water level time series obtained from synthesized data and validation data for lakes 1 to 48.
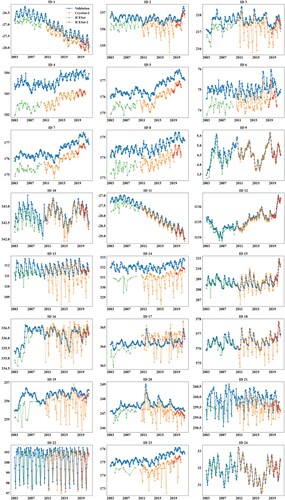
Figure A1. Continued
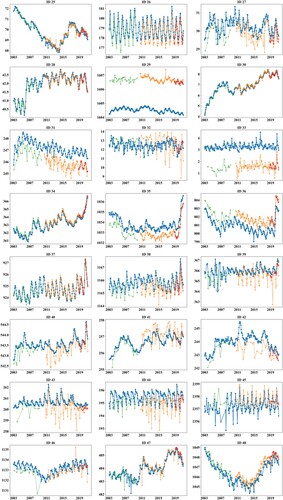
Figure A2. CryoSat-2 and ICESat-2 pairs data for lakes 1 to 48.
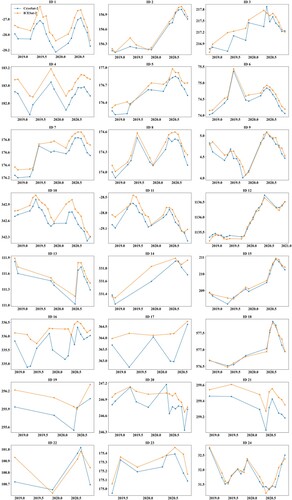
Figure A2. Continued