
 ?Mathematical formulae have been encoded as MathML and are displayed in this HTML version using MathJax in order to improve their display. Uncheck the box to turn MathJax off. This feature requires Javascript. Click on a formula to zoom.
ABSTRACT
Albedo is a key variable in the study of global or regional earth system models. High-quality albedo products are helpful for the accurate analysis and prediction of the Earth’s environment and climate. This paper analyzes the similarities and differences in several global-scale albedo products. The conclusions are as follows: (1) Ignoring the downward radiation weight leads to a maximum deviation of ±0.2 in the mean albedo in space and time; (2) Most of the products have good consistency at the global scale, especially after 2000, the consistency in the middle latitudes is better than that in the low latitudes and high latitudes; (3) Although there are obvious inter-annual variations and zonal differences in global mean albedo data from 2000 to 2020, the overall trend is not significant. The complex spatio-temporal variation of albedo requires high-quality remote sensing products to characterize its details. However, existing datasets do not show good agreement in these details, and more efforts are needed in this area.
1. Introduction
Albedo is defined as the ratio of the reflected solar radiation to the incident solar radiation (Dickinson Citation1983), which is an uncertain factor in the earth-air system. It plays an important role in the study of global or regional climate change (Knorr and Chnitzler Citation2001; Valero and Charlson Citation2008; Zhang et al. Citation2010). On the global scale, as global temperatures rise, ice and sea ice at high latitudes melt massively, resulting in lower albedo and more solar radiation absorption on the surface, which, in turn, exacerbates temperature rises, creating a feedback process that has attracted much attention (Ingram, Wilson, and Mitchell Citation1989; Curry and Schramm Citation1995; Winton Citation2008). Deforestation causes changes in surface albedo, evapotranspiration, and surface roughness, thereby triggering two opposing types of forcing mechanisms, radiative forcing and non-radiative forcing, with a net cooling effect on the earth (Bala et al. Citation2007; Davin and De Noblet-Ducoudré Citation2010). At a regional scale, the expansion of biofuels causes regional climate change by changing surface parameters such as albedo (Loarie et al. Citation2011), with boreal forests generating positive climate forcing through albedo and mitigating regional warming (Bonan Citation2008). Therefore, using the relevant data to record the spatial and temporal changes of albedo is helpful to better study the environment and climate change.
The traditional way to obtain albedo is to set up observing stations on the ground, which cannot make intensive observations on a global scale and has poor spatial and temporal continuity due to terrain and financial constraints. The birth of satellite remote sensing technology in the 1970s made it possible to continuously acquire large-scale land surface observation data. In recent decades, the increasing availability of global satellite data has enriched remote sensing datasets for global change research and environmental monitoring. Most of the albedo products with global coverage come from polar-orbiting satellite data, such as Global Land Surface Satellites (GLASS) (Liang et al. Citation2013; Liang et al. Citation2021), Moderate-Resolution Imaging Spectroradiometer (MODIS) (Strahler et al. Citation1999; Schaaf et al. Citation2002) and Clouds and the Earth's Radiant Energy System (CERES), etc. These datasets are currently used as one of the key variables in climate change studies and are also applied to global albedo variability and uncertainty assessment (Zhang et al. Citation2010; He, Liang, and Song Citation2014). Although climate models and reanalysis datasets can estimate albedo by using ground-based observations, remote sensing data, etc., they usually obtain albedo by using fixed values or simple correlation models with vegetation and soil parameters. Compared with remote sensing products, they cannot faithfully reflect the temporal and spatial variability of albedo. For example, Oleson et al. (Citation2003) used MODIS data to evaluate surface albedo from the Community Land Model and found that these models had a poor ability to simulate white-sky albedo. Zhou et al. (Citation2013) evaluated the anomalies of Global Land Data Assimilation System (GLDAS) data in 1996 and found that large errors and lack of monthly variability in the precipitation data used by GLDAS are the main sources of simulated runoff anomalies.
The increase in extreme climate events has led to higher quality requirements on remote sensing products for related variables. It has been shown that albedo products with an absolute accuracy of 0.02–0.03 are often required in studies of global or regional climate change (Sellers et al. Citation1995; He, Liang, and Song Citation2014). However, there are certain errors in the land surface parameter products obtained by remote sensing due to various factors such as the atmospheric radiative transfer characteristics, the sensors’ defects, and the heterogeneity in spatial and temporal scales (Wen et al. Citation2022c). In addition, different inversion algorithms and data sources lead to the inconsistency of different albedo products. For example, there is a deviation of 0.02–0.03 between MODIS, GLASS, Medium-Resolution Imaging Spectrometer (MERIS) and GlobAlbedo albedo products (Zhang et al. Citation2010; He, Liang, and Song Citation2014; Qu et al. Citation2015). Therefore, in the process of using albedo remote sensing products, it is necessary to have a correct understanding of the error characteristics presented in the products.
Many previous studies have focused on the validation of remote sensing products using ground observation data (Wright et al. Citation2014; Wu et al. Citation2014; Wen et al. Citation2022b). However, in large-scale and long-time research studies, it is difficult to carry out the validation of global-scale long-time series albedo products based on ground station data because of the difficulty of obtaining representative ground station observations and the poor spatial and temporal consistency with satellite remote sensing products. For compensation, the rationality of low-resolution time series remote sensing products can also be analyzed by comparing them with the simulation results of climate models (Oleson et al. Citation2003; Zhou et al. Citation2003; Wang and Zeng Citation2010; Zhang et al. Citation2010). In addition, some researchers take the research method of cross-comparison and comprehensive analysis of multiple long-time series albedo datasets (Zhang et al. Citation2010; He, Liang, and Song Citation2014) to obtain the distribution and variation of global albedo, as well as deriving some assessment of the overall uncertainty of various products. In this paper, we also use the cross-comparison methods to carry out verification and analysis work, to assess the ability of these products to reflect the spatial and temporal changes of global albedo, which can provide a decision-making basis for selecting appropriate land surface dataset for relevant climate research, and promote the development of applications such as environmental protection and counteracting global warming.
He, Liang, and Song (Citation2014) compared nine albedo datasets, such as MODIS, GLASS and GlobAlbedo, etc., and found that they were significantly different in the high latitudes of winter. This indicates that different types of albedo products have latitudinal bias and seasonal bias. So, this study will calculate the albedo variation in low (0∼30°), middle (30∼60°), and high latitude (60∼90°) regions separately to better show the differences among albedo datasets. The organization of this paper is as follows: (1) Discussing the method of calculating the mean of global surface albedo; (2) Evaluating the consistency of nine global surface albedo datasets () at the global scale and different latitudinal zones, and (3) Analyzing the spatial–temporal trend of global surface albedo.
Table 1. The datasets used in this study.
2. Data and methods
2.1. Global-scale long-time series albedo products
2.1.1. CERES
The monthly shortwave radiation data from the CERES sensors onboard Terra and Aqua are available at a spatial resolution of 1°, using MODIS surface anisotropy data as background information (He, Liang, and Song Citation2014). CERES products include both clear-sky and all-sky shortwave radiation. They are produced based on the radiative transfer model. Previous studies verified the accuracy of CERES products, showing that their quality can meet the accuracy requirements of scientific research (Rutan et al. Citation2009; Kato et al. Citation2013; Loeb et al. Citation2019).
2.1.2. CLARA
The Cloud, Albedo and Surface Radiation dataset (CLARA) edition 2 (CLARA2) by the EUMETSAT Climate Monitoring Satellite Application Facility (CM-SAF) is the latest edition of the CLARA dataset and was first released in December 2016. Surface albedo (Sanchez-Lorenzo et al. Citation2007; Pfeifroth et al. Citation2018) and solar radiation (Babar, Graversen, and Boström Citation2018; Montero-Martín et al. Citation2020) estimates of CLARA were obtained from the Advanced Very High-Resolution Radiometer (AVHRR) sensor on board METOP and National Oceanic and Atmospheric Administration (NOAA) polar-orbiting satellites, calculated using the Bidirectional Reflectance Distribution Function (BRDF) algorithm with a spatial resolution of 0.25 × 0.25° and a temporal range of 1982–2018. Previous studies have shown that although the CLARA2 product had missing data before 1992 (Pfeifroth et al. Citation2018), the validation results using ground measurement data show that the CLARA2 product has good accuracy (Müller et al. Citation2015; Urraca et al. Citation2017).
2.1.3. GEWEX
The Global Energy and Water Exchanges (GEWEX) project, as part of the World Climate Research Programme (WCRP), is dedicated to the understanding of Earth’s water cycle and energy fluxes at, and below the surface and in the atmosphere. The GEWEX-SRB radiation products are obtained using the estimation scheme developed by Pinker and Laszlo (Citation1991). This algorithm applies cloud cover and radiances from the nominal 30 km pixels within each 1°×1° grid box (Qin et al. Citation2011). GEWEX-SRB Release 4 integrates data products from the cloud, aerosol, atmosphere, ocean surface, and land surface projects within the Data and Assessments Panel (GDAP) to produce a long-term time series of top-of-atmosphere and surface radiative. The relevant research shows that GEWEX-SRB overestimates the albedo of glacial regions compared to MODIS products (Qin et al. Citation2011).
2.1.4. GLASS
The GLASS product suite was first published in 2009 (Liang et al. Citation2021) and updated till recently, and primarily based on NASA’s AVHRR long-term data record (LTDR) (https://ltdr.modaps.eosdis.nasa.gov) and MODIS data, in conjunction with other satellite data and ancillary information. GLASS albedo products are generated by the Angular Bin inversion algorithm and the Statistics-based Temporal Filter algorithm. GLASS albedo products have been widely used in scientific research because of their long-time series and spatio-temporal continuity without missing data (He et al. Citation2013; Li et al. Citation2015; Chen, Liang, and Cao Citation2017; Wen et al. Citation2022a).
In this paper, two GLASS albedo products are used: GLASS-MODIS product and GLASS-AVHRR product. Since the AVHRR dataset has an albedo product with a spatial resolution of 0.05 DEG that expands forward to the 1980s, and the MODIS dataset was produced after 2000 with a spatial resolution both in 500 m and 0.05 DEG, there are two separate GLASS albedo datasets available for global-scale analysis. These two datasets are basically generated with the same algorithm applied to different source data. Since the quality of AVHRR data is significantly lower than that of MODIS data, the credibility of GLASS-AVHRR albedo is lower than that of GLASS-MODIS albedo. Furthermore, the temporal filtering window for GLASS-AVHRR albedo is 33 days, wider than the temporal filtering window of GLASS-MODIS albedo, which is 17 days, making the GLASS-AVHRR albedo less sensitive to the quick change of surface such as in snow/melting process.
2.1.5. GLDAS
GLDAS is a global offline terrestrial modeling system (Wang et al. Citation2016), developed jointly by the National Aeronautics and Space Administration (NASA) Goddard Space Flight Center (GSFC) and the NOAA/National Centers for Environmental Prediction (NCEP). The GLDAS dataset was simulated by Noah Model 3.6 in Land Information System (LIS) Version 7. This simulation was forced with NOAA/Global Data Assimilation System (GDAS) atmospheric analysis fields, the disaggregated Global Precipitation Climatology Project (GPCP) V1.3 Daily Analysis precipitation fields, and the Air Force Weather Agency’s AGRicultural METeorological modeling system (AGRMET) radiation fields. GLDAS datasets are available in gridded format with varying spatial resolutions, some as high as 0.25° (Zhou et al. Citation2013). The recent GLDAS Version 2 (GLDAS2) albedo and downward shortwave radiation datasets are adopted in this study (Bi et al. Citation2016). For more details about the GLDAS, readers are kindly referred to Rodell et al. (Citation2004).
2.1.6. ISCCP
The International Satellite Cloud Climatology Project (ISCCP) was established in 1982 as part of the WCRP. Since July 1983 ISCCP has collected, normalized, and calibrated radiance data (visible and thermal infrared) from the imaging radiometers on the NOAA polar orbiters and the geostationary satellites GOES Meteosat, and GMS (Brest, Rossow, and Roiter Citation1997). The radiation flux is calculated using a complete radiation transfer model. It is commented in the article (Raschke, Bakan, and Kinne Citation2006) that ISCCP overestimates the radiation budget when compared with the GEWEX-SRB product.
2.1.7. MERRA2
The Modern-Era Retrospective analysis for Research and Applications, Version 2 (MERRA2) provides data beginning in 1980 till now. It uses the Goddard Earth Observing System Model (GEOS-5) with its Atmospheric Data Assimilation System (ADAS) (Isaza et al. Citation2021) to incorporate data from many modern observation systems (e.g. MODIS, AVHRR, etc.) (Randles et al. Citation2017). MERRA2 data files are provided in the netCDF-4 format in approximately 0.63 DEG*0.5 DEG grid.
2.1.8. MODIS
The MODIS sensors operate on both the Terra and Aqua satellites and serve as one of the most important instruments in the Earth Science Enterprise (ESE) of NASA. MODIS has 36 spectral bands with a spatial resolution of 250–1000 m and a time resolution of 1–2 observations per day. The MODIS albedo product is produced based on the BRDF model. The calculation method is to first establish a surface reflectance anisotropy model and then integrate it over the viewing hemisphere (Liu et al. Citation2009). At present, MODIS products have been widely verified and used in scientific research (He et al. Citation2012; Wang et al. Citation2012; Elmes et al. Citation2021; Pisek et al. Citation2021; Wen et al. Citation2022d). The MCD43C3 Collection 6 product in 0.05 DEG resolution was adopted in this study.
2.2. Calculation of global and regional average albedo
Albedo (blue-sky albedo) is the ratio of the reflected radiation to the total incoming radiation. Since the black-sky albedo and white-sky albedo represent the albedo of solar radiation under completely direct and completely diffuse conditions, respectively, the blue-sky albedo is obtained by weighting them linearly according to the proportion of scattered light, and its numerical magnitude usually depends on the wavelength and incident angle of the solar radiation (Dickinson Citation1983). Different products provide different types of albedo, for example, CERES products provide blue-sky albedo directly and CLARA2 products provide only black-sky albedo (Karlsson et al. Citation2017). Some reanalysis products provide all-sky albedo and clear-sky albedo. However, remote sensing products derived from albedo, either black-sky or white-sky, come from observations of cloudless conditions, so their combination of blue-sky albedo will be more like clear-sky albedo than all-sky albedo. In this paper, we uniformly use the clear sky albedo and the proportion of scattered light is calculated according to the method proposed by Long and Ackerman (Citation2000), as in Equations (1) and (2).
(1)
(1)
(2)
(2) where
is the fraction of scattered light;
is the solar zenith angle at the local solar noon;
is the blue-sky albedo (i.e. the true surface albedo);
is the black-sky albedo; and
is the white-sky albedo.
Albedo is spatially and temporally scalable. To calculate the regional average of albedo from the remote sensing dataset involves all the pixels in the region. However, if the data product does not use equal-area projections, this can lead to inaccuracies in the calculation of the mean albedo. Therefore, it has been concluded that pixel-wise area weight should be adopted in regional or global scale calculation of mean albedo (Zhang et al. Citation2010). Furthermore, as the incident solar radiation varies with latitude as well as seasonality, it is also necessary to consider solar radiation weighting to better quantify the role of surface albedo in the energy budget of the earth-atmosphere system. To eliminate these inaccuracies, Equation (3) (Long and Ackerman Citation2000), Equations (4) and (5) are used in this paper to calculate the spatial and temporal averaging of the albedo. Equation (4) represents the mean albedo calculation method considering both area and downward radiation weight, and Equation (5) represents the mean albedo calculation method considering only area weight. Because some products directly provide clear-sky albedo and some others provide black-sky albedo and white-sky albedo, this study uniformly uses α to represent various albedos. In addition, we use one-dimensional linear regression, as in (6), to calculate the spatio-temporal variation trend of global surface albedo.
(3)
(3)
(4)
(4)
(5)
(5)
(6)
(6)
where is the regional mean of albedo. For pixel i,
is the area,
is the downward radiation,
denotes the blue-sky albedo in pixel scale.
represents the prediction of annual albedo in the year
, A and B are regression constants.
3 Results and discussions
3.1. Spatial distribution of global albedo
To better compare different products, we first give a brief introduction to the spatial and temporal distribution of global albedo. show that the global albedo has obvious spatial distribution characteristics. The ocean albedo is the lowest, followed by the land surface albedo around the center of the map, and the highest albedo is in the Antarctic and Arctic Ocean regions. Among them, the land surface albedo varies with latitude. At low latitudes, albedo values are higher in northern Africa, and at mid-high latitudes, albedo values are higher in central and northern Eurasia, and northeast and southwest North America. In addition, there are some differences in the spatial distribution characteristics of global albedo between different products, specifically in the middle and high latitudes of northern Eurasia, northern North America, the Arctic Ocean and Antarctica, which is mainly related to the satellite data, as well as algorithm, used in the generation of these albedo products. Another point worth mentioning is the distribution and the influence of missing data in these albedo products. The missing data, also called gaps, distribute in areas either contaminated by clouds or the algorithms choose to skip, such as the high latitude areas in the winter. The gaps are very clear in and , as indicated by white or gray color. It is found that except for GLASS-AVHRR, all other albedo products have large gaps around Antarctic areas in the January map () and around Artic areas in the July map (), and there are also small gaps distributed in the tropical areas. The MODIS, GLASS-MODIS and GLDAS albedo products do not cover most of the ocean, so we treated them as land surface-only products, and this paper does not discuss the albedo statistics over the ocean.
Figure 1. Spatial distribution of albedo in January.
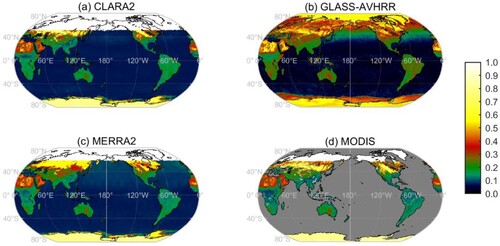
Figure 2. Spatial distribution of albedo in July.
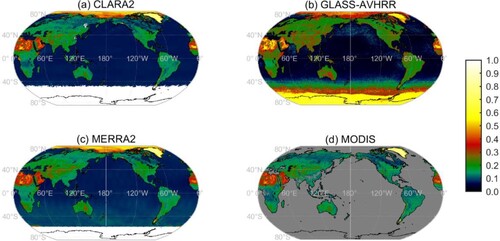
Figure 3. The arithmetic annual mean of albedo in 2010.
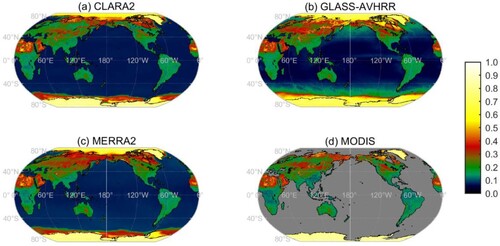
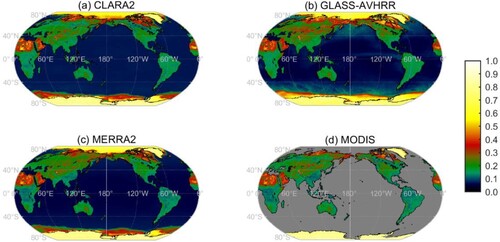
Figure 4. The radiation-weighted annual mean of albedo in 2010.
3.2. Discussion of statistical methods for global albedo mean
The difference calculation of the two mean values can reflect the specific deviation between the two schemes to derive the annual mean, as shown in . It can be found that without considering the weight of downward radiation will lead to the maximum deviation of the calculation result of annual albedo mean value up to ±0.2 in sub-Arctic and Antarctic areas. Globally, the arithmetic mean annual albedo is higher than the radiation-weighted annual mean in northern Eurasia, northern North America and around Antarctica. It should be pointed out that in Greenland and Antarctica, the pattern of GLASS-AVHRR albedo in b is obviously different from the other three products in (a,c,d). This difference is because that GLASS-AVHRR is a gap-filled product, while others are not. Gaps are excluded from the calculation of annual mean albedo for each pixel, so, for a pixel in high-latitude area, a gap in winter will cause the annual average to only consider the summer samples, the result becomes different from the annual average considering both summer and winter samples.
Figure 5. Comparison of different mean statistic methods in annual albedo (arithmetic mean minus incident radiation-weighted mean).
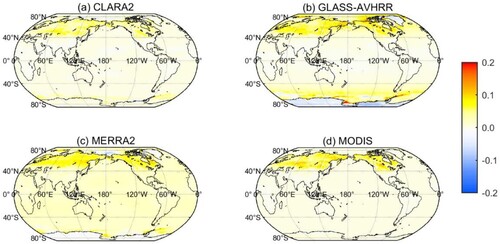
Previous studies pointed out that arithmetic averaging without considering pixel area usually leads to an overestimation of albedo, which is not advisable (Zhang et al. Citation2010), but the influence of incident radiation weight is not quantitatively discussed. To show more clearly the differences between different mean calculation methods applied to albedo products, the spatial mean of the global land surface of these four global albedo data is presented in . It can be found that the deviation caused by not considering the downward radiation weight on the spatially averaged albedo calculation can reach a maximum of about 0.07 in the case of GLASS-AVHRR. In contrast, the spatial mean values of CLARA2 products calculated using area weighting are small, which can be explained by the missing data of CLARA2 products at high latitudes. These complicate the situation. As albedo is a quantity that characterized the radiation budget of the Earth’s surface, it is more reasonable that both area and downward radiation weights should be considered when calculating the spatial average of global albedo. Only then can the statistical results be more pertinent to the purpose of radiation budget estimation. In addition, the use of radiation weighting can reduce the impact of missing data or inaccurate data at high latitudes, because the downward radiation is much smaller in high latitudes compared with that in low latitudes. By calculating the standard deviation between the four products, it can be found in that the Std. Dev between the different products becomes smaller after considering the radiation weighting. So, the subsequent spatial averages shown in this paper are, by default, the results obtained by considering the area and downward radiation weights.
Table 2. Differences in the two statistical methods to derive spatial mean of global land surface albedo.
3.3. Consistency assessment and analysis of global albedo datasets
shows the area and radiation-weighted annual average of surface albedo for CERES, CLARA2, GEWEX, GLASS-AVHRR, GLASS-MODIS, ISCCP, MODIS, GLDAS and MERRA2 at a global scale (a) and different latitudes (b–d). It can be obtained that the global surface albedo fluctuated enormously before 2000, especially between 1990 and 1995, and was more stable after 2000. Comparing these datasets across different temporal ranges shows that most products are in good agreement at the global scale, especially after 2000. Among them, CLARA2 has the best agreement with GLASS-AVHRR in the long-time series (1982–2018) characteristics; GLASS-MODIS has the best agreement with MODIS in the albedo dataset with short-time series (2001–2020). The time series of GLASS-MODIS are almost overlapped by the time series of MODIS products, the detailed view of these two series can be found in . In contrast, GEWEX and ISCCP products are overestimated, which is consistent with previous studies (Gui, Liang, and Li Citation2010). The annual mean shortwave albedo of GLDAS products is significantly underestimated as the global mean, which is mainly due to the lack of albedo estimation at high latitudes (absence in d). From 1990 to 1998, all products except MERRA2 captured the fluctuation of global shortwave albedo. This may be due to the poor ability to reflect snow and ice albedo by MERRA2 products in middle and high latitudes (c,d).
Figure 6. Variation of annual mean surface albedo in global (a) and different latitude (b–d) from 1980 to 2020.
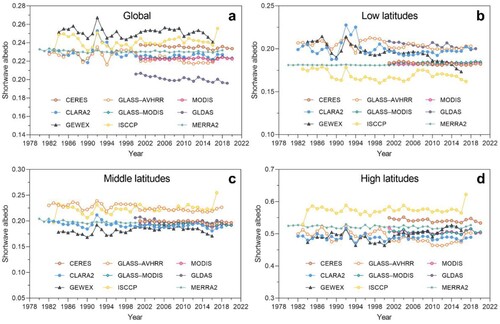
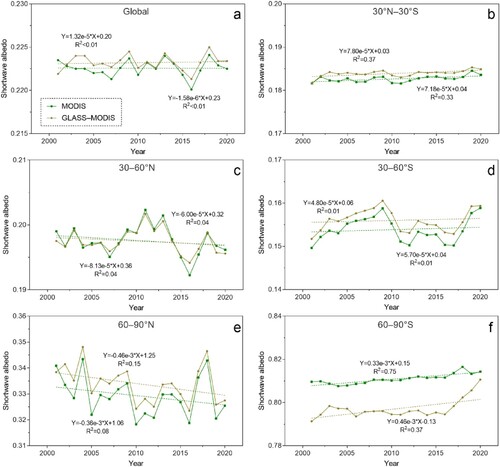
Figure 7. Variation of surface albedo in global (a) and different latitudes (b–f) from 2001 to 2020.
According to the statistical results of different latitudes (b–d), it can be obtained that the global surface albedo is low in the middle and low latitudes, ranging from 0.15 to –0.28. At high latitudes, the mean albedo ranges between 0.45 and 0.65. The global surface albedo fluctuated from 1990 to 1998, and the fluctuation was greater in the low and high latitudes. At low latitudes, CERES, GLASS-MODIS, MODIS and MERRA2 are in good agreement from 2000 to 2020. In the overall year range of 1982–2020, CLARA2, GEWEX, GLASS-AVHRR and GLDAS are in good agreement, and ISCCP product is lower than other products. In the mid-latitudes, most of the products have good consistency, including CERES, CLARA2, GLASS-MODIS, MODIS, GLDAS, and MERRA2. The GEWEX product is relatively low, and ISCCP is in good agreement with GLASS-AVHRR, but their land surface albedo is relatively high. CERES and ISCCP are higher in high latitudes, and their consistency with other products is poorer. In conclusion, CERES is overestimated in high latitudes, GEWEX is underestimated in middle and high latitudes, GLASS-AVHRR is overestimated in middle latitudes, and ISCCP has a high value in middle and high latitudes and is clearly underestimated in low latitudes. Hudson, Warren, and Kato (Citation2010) also concluded that CERES products were overestimated by comparing them with the observed estimates from Antarctica, and pointed out that the error might come from the calibration of CERES. In addition, the ISCCP product was significantly higher than the GEWEX product in the high-latitude region, which is consistent with the findings of Raschke, Bakan, and Kinne (Citation2006). At low latitudes, Raschke, Bakan, and Kinne (Citation2006) indicate that the GEWEX product underestimates the ISCCP product by 2–5 W/m2 in the tropical region.
3.4. Spatio-temporal trend analysis of global albedo
Based on the second section, in this section, we select albedo datasets (GLASS-MODIS and MODIS) with similar temporal coverage and good consistency to analyze the temporal and spatial variation of global albedo over the period 2001–2020.
shows the variation of MODIS and GLASS-MODIS land surface albedo in global and different latitudes from 2001 to 2020. It can be found that there is no obvious trend of global land surface albedo in general between 2001 and 2020, and the fluctuation range is between 0.220 and 0.225. By analyzing the variation of land surface albedo in different latitudes, it can be found that there is no obvious trend of albedo variation in the middle latitudes, a decreasing trend in the high latitudes of the northern hemisphere, and an increasing trend in the low latitudes and the high latitudes of the southern hemisphere. Of these, the variation in the northern and southern hemispheres depends mostly on the variation in snowfall. In addition, comparing with the variation of albedo in global and different latitudes, it can be found that the global land surface albedos shown by GLASS-MODIS and MODIS have good consistency in the northern hemisphere mid- and high-latitude regions, while the MODIS product is low in low-latitude and southern hemisphere mid-latitude regions and high in southern hemisphere high-latitude regions.
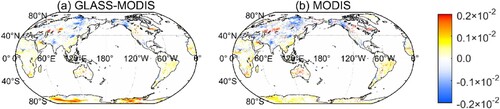
Further analysis of the spatial variation of the temporal trend of albedo from 2001 to 2020 () reveals the spatial distribution of change trend in global surface albedo, with several regions showing a significant increase in surface albedo during 2001–2020, including central Eurasia, southeastern South America, southeastern China, Australia, Canada, and South Africa. The comparison of GLASS-MODIS and MODIS shows that they are more consistent in the northern hemisphere than in the southern hemisphere. The increasing trend of albedo in the Southern Hemisphere with increasing latitude is clearly reflected in the GLASS-MODIS product. This is consistent with the finding of Zhang et al. (Citation2010) that the global albedo decreased in the northern hemisphere and increased in the southern hemisphere. Except for Antarctica, the surface albedo variations shown by these two products are relatively congruent for most regions of the world, such as Eurasia, Africa, Australia, etc. The difference between them in the Antarctic region must come from the estimation algorithm as these two products are based on the same observation data. Both products are generated by independent algorithms, i.e. MODIS albedo with the BRDF model inversion-based algorithm and GLASS-MODIS albedo with direction estimation combined with a gap-filling algorithm. The MODIS algorithm handles the BRDF effect using the RTLSR model globally, while the GLASS algorithm chooses the ART model for permanent snow-ice area, the difference in the Antarctic may come from the different BRDF models. However, this topic is complicated and will be left for our future studies.
Figure 8. Spatial distribution of multi-year trends in global albedo during 2001–2020 (p < 0.01).
In short, the global albedo variation is not a monotonic trend, for example, there are different albedo variations in different latitudes, inconsistent trends in the northern and southern hemispheres, and different regions also have different trends. As the spatio-temporal variation of global albedo is complicated, high-quality remote sensing products are needed to characterize it.
4 Conclusions
To facilitate the use of land surface albedo data for global climate studies, we collected nine global-scale albedo datasets and analyzed their similarities and differences. We first discussed the magnitude of the differences caused by different weighting schemes on the calculation of temporal and spatial mean and found that without considering the weight of downward radiation, the maximum deviation of global albedo in annual mean calculation can reach ±0.2. Then, the mean values of nine albedo data were calculated considering both the pixel area and the weight of downward radiation. The consistency evaluation of the nine albedo datasets shows that most of the products have good consistency at the global scale and can be applied to climate research and scientific applications. In the long time series of the albedo dataset, CLARA2 has the best agreement with GLASS-AVHRR; in the shorter and more recent time series of the albedo dataset, GLASS-MODIS has the best agreement with MODIS. In contrast, GEWEX and ISCCP are overestimated and GLDAS is clearly underestimated. The comparison results at different latitudes show that CERES is overestimated at high latitudes, GEWEX is underestimated at middle and high latitudes, GLASS-AVHRR is overestimated at middle latitudes, and ISCCP has high values at middle and high latitudes and is clearly underestimated at low latitudes. These products are more consistent at mid-latitudes compared to low latitudes and high latitudes.
Finally, we calculated the spatio-temporal variation trend of global surface albedo based on products with good consistency in the short-time range. The results show that there is no obvious overall trend of global land surface albedo in general during 2001–2020, but there is observable interannual variation. The pixel-wise trend is increasing significantly in most parts of the world, including central Eurasia, southeast South America, southeast China, Australia, Canada, and South Africa; decreasing at high latitudes in the Northern Hemisphere and increasing at low and high latitudes in the Southern Hemisphere, largely depending on the change in snowfall. In addition, the agreement between GLASS-MODIS and MODIS is better in the Northern Hemisphere than in the Southern Hemisphere. In summary, the spatial and temporal variability of global albedo is complicated, so there is a great need for high-quality remote sensing products to accurately estimate the shortwave radiation budget on a global scale.
Acknowledgements
We acknowledge the data support from the National Earth System Science Data Center, National Science & Technology Infrastructure of China (http://www.geodata.cn). The authors would also like to thank anonymous reviewers for their valuable comments on the manuscript.
Disclosure statement
No potential conflict of interest was reported by the author(s).
Data availability statement
The data that support the findings of this study can be obtained from the corresponding author upon reasonable request.
Additional information
Funding
References
- Babar, B., R. Graversen, and T. Boström. 2018. “Evaluating CM-SAF Solar Radiation CLARA-A1 and CLARA-A2 Datasets in Scandinavia.” Solar Energy 170: 76–85. doi:10.1016/j.solener.2018.05.009.
- Bala, G., K. Caldeira, M. Wickett, T. J. Phillips, D. B. Lobell, C. Delire, and A. Mirin. 2007. “Combined Climate and Carbon-Cycle Effects of Large-Scale Deforestation.” Proceedings of the National Academy of Sciences of the United States of America 104 (16): 6550–6555. doi:10.1073/pnas.0704096104.
- Bi, H., J. Ma, W. Zheng, and J. Zeng. 2016. “Comparison of Soil Moisture in GLDAS Model Simulations and in situ Observations over the Tibetan Plateau.” Journal of Geophysical Research: Atmospheres 121 (6): 2658–2678. doi:10.1002/2015JD024131.
- Bonan, G. B. 2008. “Forests and Climate Change: Forcings, Feedbacks, and the Climate Benefits of Forests.” Science 320 (5882): 1444–1449. doi:10.1126/science.1155121.
- Brest, C. L., W. B. Rossow, and M. D. Roiter. 1997. “Update of Radiance Calibrations for ISCCP.” Journal of Atmospheric and Oceanic Technology 14 (5): 1091–1109. doi:10.1175/1520-0426(1997)014<1091:UORCFI>2.0.CO;2.
- Chen, X., S. Liang, and Y. Cao. 2017. “Sensitivity of Summer Drying to Spring Snow-Albedo Feedback Throughout the Northern Hemisphere From Satellite Observations.” IEEE Geoscience and Remote Sensing Letters 14 (12): 2345–2349. doi:10.1109/LGRS.2017.2764543.
- Curry, J. A., and J. L. Schramm. 1995. “Sea Ice-Albedo Climate Feedback Mechanism.” Journal of Climate 8 (2): 240–247. doi:10.1175/1520-0442(1995)008<0240:SIACFM>2.0.CO;2.
- Davin, E. L., and N. De Noblet-Ducoudré. 2010. “Climatic Impact of Global-Scale Deforestation: Radiative versus Nonradiative Processes.” Journal of Climate 23 (1): 97–112. doi:10.1175/2009JCLI3102.1.
- Dickinson, R. E. 1983. “Land Surface Processes and Climate—Surface Albedos and Energy Balance.” Advances in Geophysics 25: 305–353. doi:10.1016/S0065-2687(08)60176-4.
- Elmes, A., C. Levy, A. Erb, D. K. Hall, T. A. Scambos, N. DiGirolamo, and C. Schaaf. 2021. “Consequences of the 2019 Greenland Ice Sheet Melt Episode on Albedo.” Remote Sensing 13 (2): 227. doi:10.3390/rs13020227.
- Gui, S., S. Liang, and L. Li. 2010. “Evaluation of Satellite-Estimated Surface Longwave Radiation Using Ground-Based Observations.” Journal of Geophysical Research: Atmospheres 115. doi:10.1029/2009JD013635.
- He, T., S. Liang, and D. Song. 2014. “Analysis of Global land Surface Albedo Climatology and Spatial-Temporal Variation During 1981-2010 from Multiple Satellite Products.” Journal of Geophysical Research: Atmospheres 119 (17): 10281–10298. doi:10.1002/2014JD021667.
- He, T., S. Liang, D. Wang, H. Wu, Y. Yu, and J. Wang. 2012. “Estimation of Surface Albedo and Directional Reflectance from Moderate Resolution Imaging Spectroradiometer (MODIS) Observations.” Remote Sensing of Environment 119: 286–300. doi:10.1016/j.rse.2012.01.004.
- He, T., S. Liang, Y. Yu, D. Wang, F. Gao, and Q. Liu. 2013. “Greenland Surface Albedo Changes in July 1981–2012 from Satellite Observations.” Environmental Research Letters 8 (4): 044043–044051. doi:10.1088/1748-9326/8/4/044043.
- Hudson, S. R., S. G. Warren, and S. Kato. 2010. “A Comparison of Shortwave Reflectance over the East Antarctic Plateau Observed by CERES to that Estimated from Surface Reflectance Observations.” Journal of Geophysical Research: Atmospheres 115: D20110–D20120. doi:10.1029/2010JD013912.
- Ingram, W. J., C. A. Wilson, and F. B. Mitchell. 1989. “Modeling Climate Change: An Assessment of Sea Ice and Surface Albedo Feedbacks.” Journal of Geophysical Research: Atmospheres 94 (D6): 8609–8622. doi:10.1029/JD094iD06p08609.
- Isaza, A., M. Kay, J. P. Evans, S. Bremner, and A. Prasad. 2021. “Validation of Australian Atmospheric Aerosols from Reanalysis Data and CMIP6 Simulations.” Atmospheric Research 264. doi:10.1016/j.atmosres.2021.105856.
- Karlsson, K., K. Anttila, J. Trentmann, M. Stengel, J. Fokke Meirink, A. Devasthale, and T. Hanschmann. 2017. “CLARA-A2: The Second Edition of the CM SAF Cloud and Radiation Data Record from 34 years of Global AVHRR Data.” Atmospheric Chemistry and Physics 17 (9): 5809–5828. doi:10.5194/acp-17-5809-2017.
- Kato, S., N. G. Loeb, F. G. Rose, D. R. Doelling, D. A. Rutan, T. E. Caldwell, L. Yu, and R. A. Weller. 2013. “Surface Irradiances Consistent with CERES-Derived Top-of-Atmosphere Shortwave and Longwave Irradiances.” Journal of Climate 26 (9): 2719–2740. doi:10.1175/JCLI-D-12-00436.1.
- Knorr, W., and K. Chnitzler. 2001. “The Role of Bright Desert Regions in Shaping North African Climate.” Geophysical Research Letters 28 (18): 3489–3492. doi:10.1029/2001GL013283.
- Li, Y., M. Zhao, S. Motesharrei, Q. Mu, E. Kalnay, and S. Li. 2015. “Local Cooling and Warming Effects of Forests Based on Satellite Observations.” Nature Communications 6: 6603. doi:10.1038/ncomms7603.
- Liang, S., J. Cheng, K. Jia, B. Jiang, Q. Liu, Z. Xiao, Y. Yao, et al. 2021. “The Global Land Surface Satellite (GLASS) Product Suite.” Bulletin of the American Meteorological Society 102 (2): E323–E337. doi:10.1175/BAMS-D-18-0341.1.
- Liang, S., X. Zhao, S. Liu, W. Yuan, X. Cheng, Z. Xiao, X. Zhang, et al. 2013. “A Long-Term Global LAnd Surface Satellite (GLASS) Data-Set for Environmental Studies.” International Journal of Digital Earth 6 (Sup1): 5–33. doi:10.1080/17538947.2013.805262.
- Liu, J., C. Schaaf, A. Strahler, Z. Jiao, Y. Shuai, Q. Zhang, M. Roman, J. A. Augustine, and E. G. Dutton. 2009. “Validation of Moderate Resolution Imaging Spectroradiometer (MODIS) Albedo Retrieval Algorithm: Dependence of Albedo on Solar Zenith Angle.” Journal of Geophysical Research: Atmospheres 114. doi:10.1029/2008JD009969.
- Loarie, S. R., D. B. Lobell, G. P. Asner, Q. Mu, and C. B. Field. 2011. “Direct Impacts on Local Climate of Sugar-Cane Expansion in Brazil.” Nature Climate Change 1 (2): 105–109. doi:10.1038/NCLIMATE1067.
- Loeb, N. G., F. G. Rose, S. Kato, D. A. Rutan, W. Su, H. Wang, D. R. Doelling, W. L. Smith, and A. Gettelman. 2019. “Toward a Consistent Definition between Satellite and Model Clear-Sky Radiative Fluxes.” Journal of Climate 33 (1): 61–75. doi:10.1175/JCLI-D-19-0381.1.
- Long, C. N., and T. P. Ackerman. 2000. “Identification of Clear Skies from Broadband Pyranometer Measurements and Calculation of Downwelling Shortwave Cloud Effects.” Journal of Geophysical Research: Atmospheres 105 (D12): 15609–15626. doi:10.1029/2000JD900077.
- Montero-Martín, J., M. Antón, J. Vaquero-Martínez, and A. Sanchez-Lorenzo. 2020. “Comparison of Long-Term Solar Radiation Trends from CM SAF Satellite Products with Ground-Based Data at the Iberian Peninsula for the Period 1985–2015.” Atmospheric Research 236. doi:10.1016/j.atmosres.2019.104839.
- Müller, R., U. Pfeifroth, C. Träger-Chatterjee, J. Trentmann, and R. Cremer. 2015. “Digging the METEOSAT Treasure—3 Decades of Solar Surface Radiation.” Remote Sensing 7 (6): 8067–8101. doi:10.3390/rs70608067.
- Oleson, K. W., G. B. Bonan, C. Schaaf, F. Gao, Y. Jin, and A. Strahler. 2003. “Assessment of Global Climate Model Land Surface Albedo using MODIS Data.” Geophysical Research Letters 30 (8). doi:10.1029/2002GL016749.
- Pfeifroth, U., J. S. Bojanowski, N. Clerbaux, V. Manara, A. Sanchez-Lorenzo, J. Trentmann, J. P. Walawender, and R. Hollmann. 2018. “Satellite-Based Trends of Solar Radiation and Cloud Parameters in Europe.” Advances in Science and Research 15: 31–37. doi:10.5194/asr-15-31-2018.
- Pfeifroth, U., A. Sanchez Lorenzo, V. Manara, J. Trentmann, and R. Hollmann. 2018. “Trends and Variability of Surface Solar Radiation in Europe Based On Surface- and Satellite-Based Data Records.” Journal of Geophysical Research: Atmospheres 123 (3): 1735–1754. doi:10.1002/2017JD027418.
- Pinker, R. T., and I. Laszlo. 1991. “Modeling Surface Solar Irradiance for Satellite Applications on a Global Scale.” Journal of Applied Meteorology and Climatology 31 (2): 194–211. doi:10.1175/1520-0450(1992)031<0194:MSSIFS>2.0.CO;2.
- Pisek, J., A. Erb, L. Korhonen, T. Biermann, A. Carrara, E. Cremonese, M. Cuntz, et al. 2021. “Retrieval and Validation of Forest Background Reflectivity from Daily MODIS Bidirectional Reflectance Distribution Function (BRDF) Data Across European Forests.” Biogeosciences 18 (2): 621–635. doi:10.5194/bg-18-621-2021.
- Qin, J., K. Yang, S. Liang, H. Zhang, Y. Ma, X. Guo, and Z. Chen. 2011. “Evaluation of Surface Albedo from GEWEX-SRB and ISCCP-FD Data Against Validated MODIS Product over the Tibetan Plateau.” Journal of Geophysical Research: Atmospheres 116: D24116–D24121. doi:10.1029/2011JD015823.
- Qu, Y., S. Liang, Q. Liu, T. He, S. Liu, and X. Li. 2015. “Mapping Surface Broadband Albedo from Satellite Observations: A Review of Literatures on Algorithms and Products.” Remote Sensing 7 (1): 990–1020. doi:10.3390/rs70100990.
- Randles, C. A., A. M. Da Silva, V. Buchard, P. R. Colarco, A. Darmenov, R. Govindaraju, A. Smirnov, et al. 2017. “The MERRA-2 Aerosol Reanalysis, 1980 Onward. Part I: System Description and Data Assimilation Evaluation.” Journal of Climate 30 (17): 6823–6850. doi:10.1175/JCLI-D-16-0609.1.
- Raschke, E., S. Bakan, and S. Kinne. 2006. “An Assessment of Radiation Budget Data Provided by the ISCCP and GEWEX-SRB.” Geophysical Research Letters 33 (7). doi:10.1029/2005GL025503.
- Rodell, M., P. Houser, U. Jambor, J. Gottschalck, K. Mitchell, C. Meng, and K. Arsenault. 2004. “THE GLOBAL LAND DATA ASSIMILATION SYSTEM.” Bulletin of the American Meteorological Society 85 (3): 381–394. doi:10.1175/BAMS-85-3-381.
- Rutan, D., F. Rose, M. Roman, N. Manalo Smith, C. Schaaf, and T. Charlock. 2009. “Development and Assessment of Broadband Surface Albedo from Clouds and the Earth's Radiant Energy System Clouds and Radiation Swath Data Product.” Journal of Geophysical Research: Atmospheres 114. doi:10.1029/2008JD010669.
- Sanchez-Lorenzo, A., M. Brunetti, J. Calbó, and J. Martin-Vide. 2007. “Recent Spatial and Temporal Variability and Trends of Sunshine Duration over the Iberian Peninsula from a Homogenized Data Set.” Journal of Geophysical Research: Atmospheres 112 (D20). doi:10.1029/2007JD008677.
- Schaaf, C. B., F. Gao, A. H. Strahler, W. Lucht, X. Li, T. Tsang, N. C. Strugnell, et al. 2002. “First Operational BRDF, Albedo Nadir Reflectance Products from MODIS.” Remote Sensing of Environment 83 (1-2): 135–148. doi:10.1016/S0034-4257(02)00091-3.
- Sellers, P. J., B. W. Meeson, F. G. Hall, G. Asrar, R. E. Murphy, R. A. Schiffer, F. P. Bretherton, et al. 1995. “Remote Sensing of the Land Surface for Studies of Global Change: Models — Algorithms — Experiments.” Remote Sensing of Environment 51 (1): 3–26. doi:10.1016/0034-4257(94)00061-Q.
- Strahler, A. H., J. Muller, W. Lucht, C. Schaaf, T. Tsang, F. Gao, X. Li, P. Lewis, and M. J. Barnsley. 1999. “MODIS BRDF/Albedo Product: Algorithm Theoretical Basis Document Version 5.0.” MODIS Doc 23: 42–47.
- Urraca, R., A. M. Gracia-Amillo, T. Huld, F. J. Martinez-de-Pison, J. Trentmann, A. V. Lindfors, A. Riihelä, and A. Sanz-Garcia. 2017. “Quality Control of Global Solar Radiation Data with Satellite-Based Products.” Solar Energy 158: 49–62. doi:10.1016/j.solener.2017.09.032.
- Valero, F. P. J., and R. J. Charlson. 2008. “Albedo-Watching Satellite Needed to Monitor Change.” Nature 451 (7181): 887–887. doi:10.1038/451887c.
- Wang, W., W. Cui, X. Wang, and X. Chen. 2016. “Evaluation of GLDAS-1 and GLDAS-2 Forcing Data and Noah Model Simulations over China at the Monthly Scale.” Journal of Hydrometeorology 17 (11): 2815–2833. doi:10.1175/JHM-D-15-0191.1.
- Wang, Z., C. B. Schaaf, M. J. Chopping, A. H. Strahler, J. Wang, M. O. Román, A. V. Rocha, C. E. Woodcock, and Y. Shuai. 2012. “Evaluation of Moderate-Resolution Imaging Spectroradiometer (MODIS) Snow Albedo Product (MCD43A) over Tundra.” Remote Sensing of Environment 117: 264–280. doi:10.1016/j.rse.2011.10.002.
- Wang, Z., and X. Zeng. 2010. “Evaluation of Snow Albedo in Land Models for Weather and Climate Studies.” Journal of Applied Meteorology and Climatology 49 (3): 363–380. doi:10.1175/2009JAMC2134.1.
- Wen, J., X. Lin, X. Wu, Y. Bao, D. You, B. Gong, Y. Tang, S. Wu, Q. Xiao, and Q. Liu. 2022a. “Validation of the MCD43A3 Collection 6 and GLASS V04 Snow-Free Albedo Products Over Rugged Terrain.” IEEE Transactions on Geoscience and Remote Sensing 60: 1–11. doi:10.1109/TGRS.2022.3214103.
- Wen, J., X. Wu, J. Wang, R. Tang, D. Ma, Q. Zeng, B. Gong, and Q. Xiao. 2022b. “Characterizing the Effect of Spatial Heterogeneity and the Deployment of Sampled Plots on the Uncertainty of Ground "Truth" on a Coarse Grid Scale: Case Study for Near-Infrared (NIR) Surface Reflectance.” Journal of Geophysical Research: Atmospheres 127 (11). doi:10.1029/2022JD036779.
- Wen, J., X. Wu, D. You, X. Ma, D. Ma, J. Wang, and Q. Xiao. 2022c. “The Main Inherent Uncertainty Sources in Trend Estimation Based on Satellite Remote Sensing Data.” Theoretical and Applied Climatology 151: 915–934. doi:10.1007/s00704-022-04312-0.
- Wen, J., D. You, Y. Han, X. Lin, S. Wu, Y. Tang, Q. Xiao, and Q. Liu. 2022d. “Estimating Surface BRDF/Albedo Over Rugged Terrain Using an Extended Multisensor Combined BRDF Inversion (EMCBI) Model.” IEEE Geoscience and Remote Sensing Letters 19: 1–5. doi:10.1109/LGRS.2022.3143197.
- Winton, M. 2008. “Sea Ice–Albedo Feedback and Nonlinear Arctic Climate Change.” Geophysical Monograph 180: 111–131. doi:10.1029/180GM09.
- Wright, P., M. Bergin, J. Dibb, B. Lefer, F. Domine, T. Carman, C. Carmagnola, et al. 2014. “Comparing MODIS Daily Snow Albedo to Spectral Albedo Field Measurements in Central Greenland.” Remote Sensing of Environment 140: 118–129. doi:10.1016/j.rse.2013.08.044.
- Wu, X., J. Wen, Q. Xiao, J. Peng, Q. Liu, B. Dou, Y. Tang, et al. 2014. “Remote Sensing Albedo Product Validation over Heterogenicity Surface Based on WSN: Preliminary Results and its Uncertainty.” Proceedings of SPIE-The International Society for Optical Engineering 9260. doi:10.1117/12.2069113.
- Zhang, X., S. Liang, K. Wang, L. Li, and S. Gui. 2010. “Analysis of Global Land Surface Shortwave Broadband Albedo From Multiple Data Sources.” IEEE Journal of Selected Topics in Applied Earth Observations and Remote Sensing 3 (3): 296–305. doi:10.1109/JSTARS.2010.2049342.
- Zhou, L., R. E. Dickinson, Y. Tian, X. Zeng, Y. Dai, Z. L. Yang, C. B. Schaaf, et al. 2003. “Comparison of Seasonal and Spatial Variations of Slbedos from Moderate-Resolution Imaging Spectroradiometer (MODIS) and Common Land Model.” Journal of Geophysical Research: Atmospheres 108 (D15): 4488–4507. doi:10.1029/2002JD003326.
- Zhou, X., Y. Zhang, Y. Yang, Y. Yang, and S. Han. 2013. “Evaluation of Anomalies in GLDAS-1996 Dataset.” Water Science and Technology 67 (8): 1718–1727. doi:10.2166/wst.2013.043.