
 ?Mathematical formulae have been encoded as MathML and are displayed in this HTML version using MathJax in order to improve their display. Uncheck the box to turn MathJax off. This feature requires Javascript. Click on a formula to zoom.
ABSTRACT
When various urban functions are integrated into one location, they form a mixture of functions. The emerging big data promote an alternative way to identify mixed functions. However, current methods are largely unable to extract deep features in these data, resulting in low accuracy. In this study, we focused on recognizing mixed urban functions from the perspective of human activities, which are essential indicators of functional areas in a city. We proposed a framework to comprehensively extract deep features of human activities in big data, including activity dynamics, mobility interactions, and activity semantics, through representation learning methods. Then, integrating these features, we employed fuzzy clustering to identify the mixture of urban functions. We conducted a case study using taxi flow and social media data in Beijing, China, in which five urban functions and their correlations with land use were recognized. The mixture degree of urban functions in each location was revealed, which had a negative correlation with taxi trip distance. The results confirmed the advantages of our method in understanding mixed urban functions by employing various representation learning methods to comprehensively depict human activities. This study has important implications for urban planners in understanding urban systems and developing better strategies.
1. Introduction
A city is a complex system composed of various forms of functional areas (Zhong et al. Citation2014). Urban function is defined as the type of occurring activities and the recognized human uses of urban space (Crooks et al. Citation2015; Tu et al. Citation2017; Zhong et al. Citation2014), which is a key attribute within a city. Its heterogeneous distribution in a city underlies location semantics and interactions. A reliable identification of urban functions is essential to developing an understanding of locations (Hu et al. Citation2020, Citation2021; Tu et al. Citation2017; Yao et al. Citation2017). With rapid urbanization increasing in recent decades, various urban functions are integrated in a land parcel, enhancing the diversity and sophistication of urban structures (Grant Citation2002). This situation entails the challenge of recognizing mixed urban functions (Huang et al. Citation2022; Wu et al. Citation2018; Ye et al. Citation2021; Zhang et al. Citation2021). Previous research found that moderately mixed urban functions can promote urban compactness by providing more services in shorter distances, reducing traffic stress, and strengthening intra-community connections (Burton, Jenks, and Williams Citation1996; Cervero Citation1996). Hence, recognizing and understanding mixed urban functions is advantageous to urban planning and management. This contributes to solving urban development problems such as urban traffic jams and urban sprawl (Du et al. Citation2020; Hashim, Mohd Noor, and Marghany Citation2011), satisfying residents’ living needs, improving urban vitality, and promoting sustainable development.
Recognizing urban functions is a pressing topic in urban studies (Feng et al. Citation2021; Hu et al. Citation2020; Huang et al. Citation2022; Huang et al. Citation2020; Mawuenyegah, Li, and Xu Citation2022; Yao et al. Citation2017; Ye et al. Citation2021; Zhai et al. Citation2019; Zhang et al. Citation2021). Considering the physical environment from a coarse-grained scope, remote sensing images have been widely used to classify urban land uses and functions (Du et al. Citation2019; Gong et al. Citation2020). The emerging geospatial big data promote an alternative approach from a fine-grained socioeconomic perspective. Yao et al. (Citation2017) regarded land use as a proxy of urban function, using points of interest (POI) data to identify dominant urban functions. Zhai et al. (Citation2019) extracted urban functional regions by clustering place embeddings and identifying urban function from the most significant POI category in each cluster. Feng et al. (Citation2021) proposed a scene–object–economy framework to recognize urban functional zones from remote sensing images, building footprints and POIs. However, these studies recognized the urban functions solely from static urban structures. We argue that human activities reveal urban functions more directly. People carry out distinct activities in different urban functional regions, and such activities reshape a location’s usage (i.e. urban functions) (Goodchild Citation2011; Tu et al. Citation2017; Zhong et al. Citation2014). Human activities capture the dynamic characteristics of urban functions. It is more effective, then, to recognize urban functions from a human activity perspective.
Advances in geospatial big data and social sensing methods have promoted urban studies from the human activity perspective (Liu et al. Citation2015; Tu et al. Citation2017). Human activities denote the routine and institutional behaviors of individuals or groups (Tu et al. Citation2017; Zhong et al. Citation2014), such as housekeeping, working, and shopping. Geospatial big data, such as origin-destinations (OD) and trajectories from vehicle positioning (Du et al. Citation2020), mobile phone data (Tu et al. Citation2017; Zhang et al. Citation2021), social media check-ins (Gao, Janowicz, and Couclelis Citation2017; Wu et al. Citation2018), and tweet texts (Ye et al. Citation2021), illustrate human activities on an individual scale. Tu et al. (Citation2017) proposed the data–activity–function framework based on a bottom-up strategy, uncovering urban functions using the spatiotemporal patterns of human activities inferred from mobile phone positioning and social media data. Ye et al. (Citation2021) leveraged the semantic information in social media tweets for urban function recognition.
Despite the important contributions of previous studies, there are two limitations in recognizing urban functions. First, many studies only identify the dominant urban function in a place, while ignoring the realistic proportions of mixed functions. Although some studies have attempted to address this problem (Huang et al. Citation2022; Wu et al. Citation2018; Zhang et al. Citation2021), they have not provided a detailed analysis of spatial patterns and socioeconomic effect. Second, while human activities exhibit temporal, spatial, and semantic characteristics in different aspects, most preceding studies only considered one of these aspects. The capability of simultaneously integrating multiple human activity characteristics should be improved to better understand mixed urban functions.
To solve the aforementioned problems, we propose a representation learning-based approach to recognize mixed urban functions in Beijing, China, using geospatial big data. Our key hypothesis is that multiple human activities can effectively reveal the mixed urban functions with the aid of representation learning methods. Residents’ travel and behavior patterns vary across urban functional regions (Gao, Janowicz, and Couclelis Citation2017; Ye et al. Citation2021; Liu et al. Citation2012). Thus, integrating these activity patterns can aid in better recognizing urban functions. Representation learning methods are advantageous in extracting useful information that characterizes human activities. Representation learning automatically extracts useful knowledge in geospatial big data, compressing raw data into fixed-length embedding vectors, while also preserving key information (Bengio, Courville, and Vincent Citation2013). In urban research, recent studies captured the spatial proximity (Hu et al. Citation2020; Liu, Andris, and Rahimi Citation2019; Yan et al. Citation2017; Yao et al. Citation2017), spatial interaction (Crivellari and Beinat Citation2019; Li, Fei, and Zhang Citation2019; Zhou and Huang Citation2018; Zhu et al. Citation2020), and semantic similarity (Liu and De Sabbata Citation2021; Wang, Li, and Rajagopal Citation2020; Ye et al. Citation2021) of certain locations based on representation learning approaches. According to the Third Law of Geography (Zhu et al. Citation2018), we assume that the locations have similar proportions of urban functions if their embedding vectors are proximate. To make efficient use of representation learning, it is necessary to choose the appropriate method according to the nature of an activity. Thus, integrating multiple approaches that target different activity features is required for comprehensively illustrating human activities.
This study contributes to existing literature on mixed urban functions and human activities in three ways. First, we provide a framework to comprehensively understand human activities for the task of recognizing urban functions. We propose three features (activity dynamic, mobility interaction, and activity semantics) that depict human activities in different aspects. Second, we promote representation learning to better extract deep features in geospatial big data. We integrate three representation learning approaches based on the characteristics of time series, graph structure, and textual data. Third, we recognize mixed urban functions in each location and analyze their spatial patterns and socioeconomic effects. Our model can efficiently distinguish the mixture of urban functions, resulting in valuable implications for urban planning and construction.
2. Study region and materials
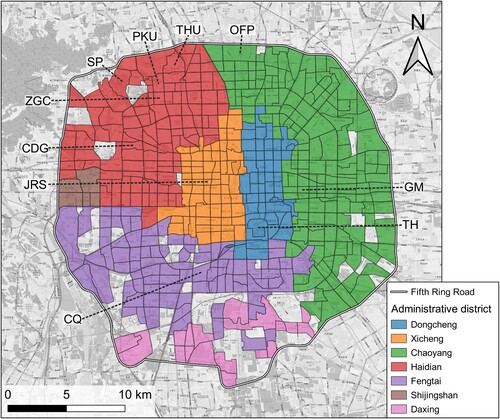
Our study region was set within the Fifth Ring Road in Beijing, China (), which contains diverse urban functions and is a primary location for residents’ activities. Traffic analysis zones (TAZs) were selected as the spatial units. TAZs are segregated by motorways and main roads and the interactions within each zone are accessible on foot (Gao et al. Citation2022; Wu et al. Citation2018; Yao et al. Citation2017). Thus, urban functions in a zone are associated.
Figure 1. The study area in Beijing and the segregation of traffic analysis zones. Abbreviations of places: CDG – Chedaogou, CQ – Caoqiao, GM – Guomao, JRS – Jinrong Street, OFP – Olympic Forest Park, PKU – Peking University, SP – the Summer Palace, TH – Temple of Heaven, THU – Tsinghua University, ZGC – Zhongguancun.
The taxi OD data in Beijing from August and September 2016 were collected from Didi Chuxing, one of the leading mobile transportation platforms in China. Each OD record contains the latitude, longitude, and timestamp of the origin and destination. There were 9,528,521 OD records in total. We then aggregated OD records to TAZs based on the locations. Only OD records with both origin and destination points within the Fifth Ring Road in Beijing were used to extract mobility interaction features. However, we retained the records of one of the OD points outside of the research area for time series data. Time series of taxi inflow and outflow per location were processed by grouping taxi trips into time-bins of length 168 (24 hours a day, 7 days a week), to mitigate data randomness. This is because taxi inflow and outflow tend to be generally similar when viewed broadly (i.e. in terms of weeks or months). However, when examined more closely (i.e. day-by-day), their behavior diversifies (Zhu and Guo Citation2017). Finally, the inflow and outflow time series were normalized by the z-score method to fit the model.
Sina Weibo is a prevalent social media platform in China, on which we collected the geo-tagged tweets in the study region throughout the year of 2016. Each tweet contained latitude and longitude, timestamp, and textual contents. Weibo tweets were aggregated to TAZs based on the location. We pre-processed the textual contents by the following steps: (1) Hashtags with theme titles, emojis, and special characters, @ signs with usernames, and hyperlinks were removed. (2) Blank tweets were dropped. (3) Chinese word segmentation was performed, then the stop words were removed. We obtained 2,137,669 tweets after data pre-process.
To avoid data sparseness, TAZs with less than 1200 taxi trips, or less than 600 social media tweets, were eliminated. Finally, 509 TAZs remained in our research.
3. Methods
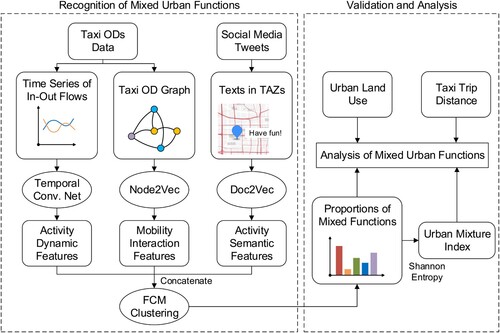
We proposed an unsupervised approach to recognize the proportions of mixed urban functions from the perspective of human activity utilizing representation learning. To be specific, we raised three human activity features of a place: activity dynamics, mobility interactions, and activity semantics. These three features illustrate human activities in temporal, spatial, and semantic context aspects, respectively. They were extracted by appropriate representation learning models. The flowchart of our approach is shown in . The procedure consisted of four parts: (1) Three activity features of a location were extracted from taxi flows and social media by representation learning methods. We extracted activity dynamic feature from time series data of taxi in–out flows by temporal convolutional networks model (Bai, Kolter, and Koltun Citation2018; Franceschi, Dieuleveut, and Jaggi Citation2019), mobility interaction feature from taxi OD graph by node2vec approach (Grover and Leskovec Citation2016), and activity semantic feature from geo-tagged social media tweets by doc2vec approach (Le and Mikolov Citation2014). Then, the three embedding vectors obtained were concatenated into an integrated vector. (2) Fuzzy C-Means (FCM) clustering algorithm (Bezdek, Ehrlich, and Full Citation1984) was performed to calculate fuzzy partitions of clusters. We considered each cluster prototype as one urban function and the membership value of a cluster as the proportion of the corresponding urban function. (3) The mixture index of urban functions was calculated from membership values. (4) We investigated the spatial distribution and proportion of mixed urban functions, revealing the correlations with land use and travel distance.
Figure 2. The flowchart of the proposed approach.
3.1. Extracting human activity features
3.1.1. Extracting activity dynamic features by convolutional networks
Activity dynamic features are the temporal intensity, tendency, and periodicity of human activity in an area. Each urban function has a corresponding temporal pattern of human activities, and different places with similar urban functions usually have similar activity dynamics (Liu et al. Citation2012; Wu et al. Citation2018). Thus, we can infer that the urban functions in a certain location resemble another’s if their activity dynamic features are proximate. Activity dynamic features can be efficiently extracted by representation learning from time series data, which can then reveal the temporal variants of human activities. If the time series of certain areas have a similar pattern, their distributed representations will be proximate in vector space, indicating the similarity of mixed urban functions.
We integrated temporal convolutional networks with contrastive learning to obtain vectors of activity dynamic features for each selected area. The temporal convolutional network model (Bai, Kolter, and Koltun Citation2018; Franceschi, Dieuleveut, and Jaggi Citation2019) boosted the learning process compared to the sequential process in recurrent neural networks, because the convolutional elements could be efficiently parallelized in training and evaluation. This model leveraged the structure of causal convolutions and exponentially dilated convolutions. The causal convolution ensured there was no information leakage from the future segment into the past segment of the time series. To be specific, the output at time was computed using only the input before time
. We implemented this using a one-sided convolution. As the time order influences the dynamic features of the taxi time series, the model needed to capture the variation of the order. The causal convolution can detect such a change by calculating the past side of a sequence. Therefore, it was suitable for the process of taxi time series. The receptive field of each convolution layer was constrained by the kernel size, so simply broadening the kernel size could have resulted in a large number of parameters. The dilated convolution introduced a fixed step between the time steps of inputs, enabling the networks to look deeply into the past of the time series with few layers, thus maintaining its performance with less parameters.
The dilated causal convolution layer is defined as Equation (1):
(1)
(1) where the output of the
-th element in hidden layer
(i.e.
) is the dilated causal convolution of layer
, and the input layer
receives the initial taxi time series.
denotes the convolution kernel with dilation factor
and kernel size
. The base of exponential dilation is set to 2, and
is set to
for the
-th residual layer. The convolutional network is composed of stacks of residual blocks, each of which contained two convolution modules and one residual connection. Each convolution module contained an exponentially dilated causal convolution layer, followed by a weight normalization layer and an activation function. The output of the convolutional network was given to a global max pooling layer followed by a dense layer to create fixed-size activity dynamic embeddings.
We introduced an unsupervised representation learning method in contrastive pattern to train the model, inspired by Franceschi, Dieuleveut, and Jaggi (Citation2019), which leverages negative sampling and triplet loss for time series data. The objective of training the encoder was to ensure that representation vectors of reference samples were close to those of positive samples and far away from those of negative samples in vector space, so that similar time series obtained proximate embeddings. For each given time series , we considered a subsequence of random length as the reference sample
in each epoch. Then, a random subseries of the reference sample was selected as the positive sample
, considering that the temporal characteristics of the reference sample should be similar to its subseries (i.e. the positive sample), as they both depicted activity dynamic feature of the same place. Negative samples were randomly selected independently from the time series of other places (example: several negative samples
from other time series
, where
,
, and
is the number of negative samples for each reference sample). The encoder was trained to minimize the triplet loss (Equation (2)):
(2)
(2) where
,
, and
denote the representation vectors of
,
, and
respectively, and
is a sigmoid function. The inner product was used in this loss to measure the similarities of vectors, enabling the model to distinguish the representations of different places.
3.1.2. Extracting mobility interaction features by node2vec
Mobility interaction features are the associations and interactions of human flows from one place to another. They represent the spatial relationship of different areas in a city. We extracted mobility interactions based on a graph model, in which locations were regarded as nodes and interactions as edges. We used taxi OD flows to construct a graph , representing an area
as a node
, the OD flow from location
to
as an edge
, and the magnitude of an OD flow as the weight
of an edge.
Node embeddings of a graph were learned by the node2vec model (Grover and Leskovec Citation2016). Node2vec utilizes random walks on the graph, generating numerous walk paths of nodes. Assuming one step from node to
of random walk, the bias probability of taking adjacent
as the next node is calculated by Equation (3):
(3)
(3)
where denotes the neighbor nodes of
, and
is the unnormalized transition probability calculated by Equation (4):
(4)
(4) where
is the node before
in the walk path,
and
are hyper-parameters controlling walking behaviors. After sampling walk paths on the mobility interaction graph, representation vectors of nodes were learned using the skip-gram model (Mikolov et al. Citation2013), which maximized the logarithm probability of contextual nodes in the window of a certain size, given reference nodes in walk paths.
We treated the node embeddings as the mobility interaction features of places. Node2vec model extracted homophily and structural equivalence of nodes in a graph. These two characteristics delineate mobility interaction features from different perspectives. Homophily in the graph indicates that areas are connected with intense OD flows to form a community. Structural equivalence denotes that areas play comparable roles in traffic ODs. Accordingly, we used this model to infer the similarity of mixed urban functions from similar mobility interaction features.
3.1.3. Extracting activity semantic feature by doc2vec
Activity semantic features describe semantic properties of human activities in a location, including type, purpose, and sentiment. If locations share similar activity semantic features, the mixture of urban functions in said locations will be highly correlated as urban functions can be regarded as the aggregation of similar types of human activities (Crooks et al. Citation2015; Zhong et al. Citation2014). Textual contents of geo-tagged social media tweets were used to extract activity semantic features with high quality because words express the topics and semantics of places. When the textual contents, topics, and sentiments in an area resemble those in another area, activity semantic features of these places are usually alike. This likeness can be detected by embedding methods in natural language processing.
We performed PV-DM model of doc2vec (Le and Mikolov Citation2014) to extract activity semantic features from social media texts. This model is an analogue to document embedding, where a location is treated as a document, and the words of the tweets are equivalent to the words in a document. To be specific, we assigned each place an identifier and a corresponding embedding vector. Then, the contextual words of a window (i.e.
with the window size
) in a tweet and the place identifier were fed to the PV-DM model to predict the current word
by maximizing the logarithm likelihood (Equation (5)):
(5)
(5) where
is the cardinality of places,
is the cardinality of words in the texts posted in place
. When the model traverses the whole corpus, it encodes topics, main content, and sentiments into the place vectors. These represent the semantic characteristics of human activities in different locations. Finally, we extracted the vectors as the representations of the activity semantic features.
3.2. Recognizing mixed urban functions
After extracting the embedding vectors of activity dynamics, mobility interactions, and activity semantics for a location, we aggregated them into a fused representation. Element-wise sum, average, or concatenation are reliable ways to combine several features, similar to how word embeddings are aggregated in natural language processing (Le and Mikolov Citation2014). We opted for concatenation as the aggregation function in this research, thus the size of the merged vector is the sum of the embedding sizes of the three features.
We assumed that the locations contained similar urban functions if they had similar human activities. Thus, the areas with comparable functions tended to aggregate in the vector space. Such patterns can be detected by clustering algorithms. We applied FCM clustering method (Bezdek, Ehrlich, and Full Citation1984) to the aggregated vectors to infer the proportions of mixed urban functions. FCM is an unsupervised soft clustering method that calculates the membership value of cluster prototypes for each sample, given the cluster number as a hyper parameter. We regarded each cluster prototype as an urban function, assuming that the proximity in vector space denoted the similarity of mixed urban functions. Accordingly, the membership value of a cluster was regarded as the proportion of the corresponding urban functions, as it indicates the likelihood of the area belonging to that function prototype. The sum of the membership values for each place was normalized to 1 so that the membership values were equivalent to the proportions of mixed urban functions.
The optimal value of cluster number is determined by the fuzzy partition coefficient (FPC, Equation (6)), which quantifies the fuzziness and quality of clustering:
(6)
(6) where
is the proportion of urban function
for place
,
is the total number of places. A larger FPC value meant that the samples had a more uneven distribution of membership values, denoting shorter distances to their nearest prototypes and less fuzziness of partitions. Silhouette score (Rousseeuw Citation1987) was also used as a reference metric for the best number
, with larger values indicating tighter clusters.
There was the possibility of FCM having a high dimensionality problem in large datasets where the centers of cluster prototypes tended to run into the centroid of the whole dataset (Winkler, Klawonn, and Kruse Citation2011). Thus, it was crucial to set the initial prototypes carefully. Given that K-means is more stable than FCM in high dimensionality spaces, K-means algorithm can help uncover the clusters of representation vectors. Therefore, we initialized the prototypes of FCM by performing K-means clustering to convergence.
To evaluate the recognition results, we investigated the correlation between the proportions of mixed urban functions and land use types. Mixed urban functions involve the actual human activities in an area, while land uses describe the physical characteristics. It can be assumed that the well-recognized urban functions would be significantly related to land uses. We measured the results by Pearson’s correlation coefficient. The urban function corresponding to a cluster was determined by the land use with a high positive correlation.
3.3. Analyzing mixing degree
We defined an index to measure the mixture of urban functions in a given area. This mixture index expressed the complexity and diversity of an area. A low value indicates that a few urban functions take the dominant place, while a large value shows an evenness of urban functions. Song, Merlin, and Rodriguez (Citation2013) reviewed the characteristics and applicability of various alternative indices of land use mix, which are also applicable to urban functions. Following their advice, Shannon’s Entropy Index was optimal in our research for more than two types of urban functions, defined as Equation (7):
(7)
(7) where
refers to the proportion of the
-th urban function from the clustering results,
refers to the number of urban functions in this research.
4. Results and analysis
4.1. Human activity features
We used the proposed model to extract activity dynamic, mobility interaction, and activity semantic features. The length of each feature vector was set to 32. For temporal convolutional networks, the time series of inflows and outflows were stacked in channel dimension so that the model could extract both inflow and outflow dynamic features simultaneously. Additionally, we set the number of convolutional blocks to 3. In order to reveal different mobility interaction features (i.e. homophily and structural equivalence) in the graph using diverse hyper parameters, we set two experiments with and
to extract the communities and roles of places. Two mobility interaction embeddings were then concatenated as the integrated feature of length 32. For the doc2vec model, we set the size of windows to 5, the number of negative samples per window to 5, and the training epoch to 40 for the sake of model convergence.
The three extracted urban features are represented in using t-SNE (van der Maaten and Hinton Citation2008), which projects high-dimensional feature vectors into a 2D plane while also maintaining the relations among them. The results supported the proposition that the three features reveal human activities and urban functions from different aspects. It showed that the embedding vectors of different locations were aggregated according to urban functions, hence the proposed activity features are all conducive to recognizing mixed urban functions. Generally speaking, activity dynamic features in different places were aggregated into several separate clusters, mobility interaction features scattered in vector space, while activity semantic features revealed certain activity topics and gathered around administrative districts.
Figure 3. The dimensionality reduction of three feature embeddings, (a) activity dynamic features, (b) mobility interaction features, (c) activity semantic features. See for the abbreviations of the places.
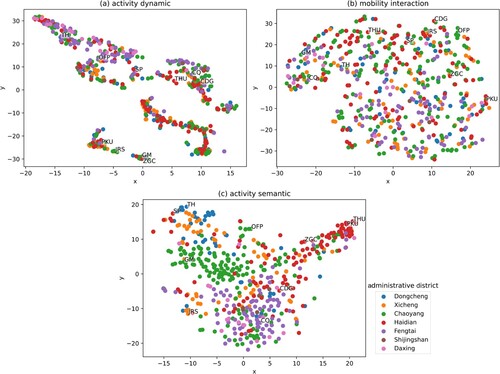
The activity dynamic features of central business districts (e.g. Zhongguancun, Guomao, and Jinrong Street) and residential areas (e.g. Chedaogou and Caoqiao) gathered into clusters ((a)), indicating that areas with analogous urban functions tend to be comparable in activity dynamic features, while areas with different functions are distinguishable by their temporal features. The phenomenon of short distances between recreation areas (e.g. the Summer Palace, Olympic Forest Park, and Temple of Heaven) in the vector space was consistent with the aforementioned results. The results validated that different classes of areas exhibit different temporal patterns (Liu et al. Citation2012). The proposed model with temporal convolutional network can extract activity dynamic features from taxi in–out flows and the extracted temporal patterns are advantageous for urban function recognition.
The results of mobility interaction features show that locations in different administrative districts scattered independently in the vector space ((b)). This suggests that there is a large amount of mobility interactions across administrative districts. Additionally, we found that adjacent TAZs (e.g. Peking University and Tsinghua University) tend to be scattered in vector space. We speculate that people usually walk or bicycle to nearby places, so the mobility interaction features of adjacent TAZs are pulled apart due to the small number of taxi trips.
The activity semantic features of universities and research institutes (mostly in Haidian District, e.g. Peking University and Tsinghua University), as well as the semantic resemblance of scenic spots (e.g. Temple of Heaven and the Summer Palace), aggregated closely in vector space ((c)). This illustrates that we are able to recognize urban functions from activity semantic features, especially education and tourism. We believe that young people and tourists are more likely to post on social media about campus life and sightseeing topics (Gao et al. Citation2022), so the activity semantic features of these two urban functions are more prominent in social media. We also detected that activity semantic features of places were distributed in line with their administrative districts. It is possible that social media covers the location-specific topics, such as local events or place names, leading to the semantic preference of administrative districts.
4.2. Proportions of mixed urban functions
The representation vectors of the three extracted urban features were aggregated by concatenation for each TAZ. We performed FCM clustering algorithm with the prototypes initialized by K-means. We set the weighting exponent because it is more reasonable for the exponent of membership value in the objective function to be equal to the exponent of distance without prior knowledge (Bezdek, Ehrlich, and Full Citation1984). Cosine distance was used as the distance metric between vector pairs since the similarities of urban features were measured by the dot product of the vectors in our model.
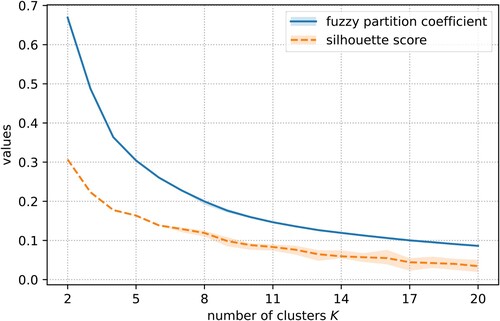
To test the performance of clustering and find the optimal cluster number , we set different trials of cluster numbers from 2 to 20. We repeated this 10 times for each cluster number. shows the gradually decreasing trend of mean FPC and the mean silhouette scores as
increased. Based on the elbow rule, we found a rapid change in the slope of FPC curve when
ranged from 4 to 8, implying a suitable prototype number was within this range. The silhouette score decreased more slowly when
and
, indicating slightly tighter distributions of urban features within each prototype. We selected the number of prototypes
for further experiments and analysis.
Figure 4. The change of average values and min-max intervals of fuzzy partition coefficient and silhouette score with the increases of cluster number K.
We analyzed the correlation between the proportion of five prototypes and urban land use so as to recognize their represented urban functions. The land use data were obtained from EULUC-China map (Gong et al. Citation2020). We merged and reclassified the land uses into eight types: residence, business, shopping, industry, transport, sport & cultural, park & greenspace, and public, and calculated the proportion of each land use in a TAZ. The Pearson’s correlation coefficients are shown in . We deduced the urban functions of the corresponding clusters based on the land use with the highest correlation coefficient. We were able to identify the five clusters as public, commercial, outdoor, residential, and recreational functions. illustrates the spatial distribution of the mixed urban functions. The clustering results are detailed as follows:
Figure 5. The Pearson’s correlation coefficients between the proportions of urban functions and land use types. *, **, *** denote p < 0.1, 0.01, 0.001, respectively.
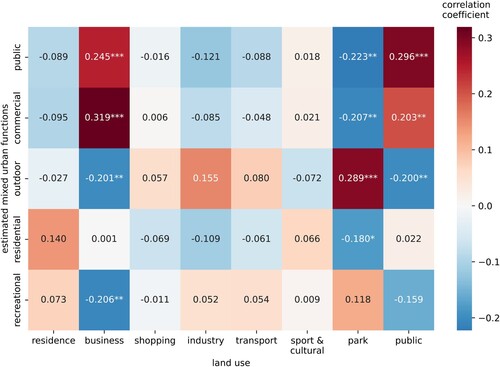
Figure 6. The spatial distribution of mixed urban functions. (a–e) the proportions of five urban functions, (a) public, (b) commercial, (c) outdoor, (d) residential, (e) recreational. (f) the dominant urban function in each zone.
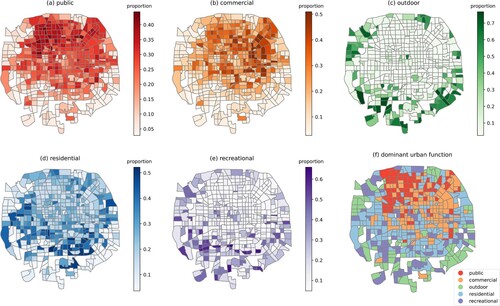
Public function. A cluster prototype is identified as a public function if its proportion is most correlated to public land use (i.e. educational, administrative, medical service, etc.) Public functions spread in the center and north part of Beijing, with large proportions in the northwest part of the city ((a)), where most universities and research institutes are located. We propose that the activity semantic features have a crucial role in recognizing this function because they are similar in universities. This is in accordance with the public urban function in the clustering result. The spatial distribution of a public function is significantly clustered, with Moran’s and
using the inverse Euclidean distance square between centroids as the spatial weight (Note that the settings are the same in following experiments), indicating the gathering pattern of a public function in Beijing.
Commercial function. We regard a cluster as a commercial function if it is most positively correlated with business land use. Commercial functions are mainly distributed in the east of Beijing ((b)). We have detected a large proportion of commercial functions in Guomao, Jinrong Street, and Zhongguancun, the city’s central business districts or sub-centers. We believe that activity dynamic features play a role in recognizing commercial function because of their proximity. The spatial distribution of a commercial function is significantly clustered (Moran’s ,
), indicating the agglomeration of commerce and business. Additionally, both public and commercial functions have similar correlations with land use types. Because both functions illustrate the major production activities in Beijing and they tend to be distributed in bustling areas, the zones with more working places may have greater proportions of both functions.
Outdoor function. Areas with high proportions of outdoor functions, such as sightseeing parks, golf courses, and urban forests and greenspaces, are mostly located on the edge of Beijing, ((c)). Outdoor functions are dominant in some parks in the city center (e.g. Temple of Heaven) and are significantly correlated with parks, while also having an insignificantly positive correlation with industrial land use. Since most factories in Beijing have been relocated outside the Fifth Ring Road and the remaining buildings have been abandoned or converted, industrial land uses do not match urban functions. Therefore, we only took the land use of the park and greenspace into account to determine outdoor function. The Moran’s with
indicates the large contiguous area of low-proportion outdoor function in the city center.
Residential function. Residential functions are distributed throughout the whole city, while there are greater proportions in southern Beijing ((d)). We believe that the proposed model leverages the information in activity dynamic features, as the residential districts (e.g. Caoqiao) tend to cluster in the feature space and the fuzzy clustering method produces large residential proportions in these districts. The spatial distribution of residential functions is less clustered than that of other urban functions, with Moran’s and
. Residential functions are likely to scatter in a moderate proportion across the city and are pronounced in certain densely populated communities.
Recreational function. Resembling the outdoor function, recreational functions are primarily located in outer Beijing. However, there are some scenic spots in the city center with high proportions ((e)). Compared to the outdoor function, the correlation between recreational functions and land use of parks is not significant. We suppose that recreational functions revolve around activities like sightseeing and leisure in parks, squares, and scenic spots. They are more associated with tourism than outdoor functions, and thus they are less correlated to the land use of parks. The Moran’s with
indicates a similar spatial pattern to the outdoor function.
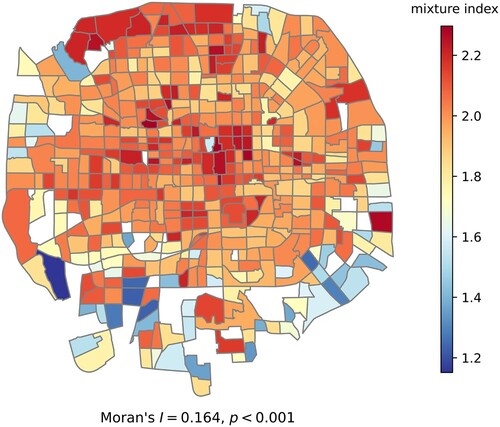
4.3. Mixture index of urban functions
As the metric of mixed urban functions, Shannon’s Entropies are calculated with respect to the proportions of five urban functions. The spatial distribution of entropy indices is displayed in . Generally, the entropies of most TAZs fall in the interval between 1.8 and 2.2, and the zones with mixture indices lower than 1.6 are mainly located in the outer city. The spatial autocorrelation is significantly positive (Moran’s ,
), indicating that the mixture index is continuously distributed in the TAZ scale, with middle and high values in the city center. We find high mixing degrees in city centers with alleys, pedestrian shopping streets, and scenic attractions in adjacent zones, as well as in northwest cities which contain parks, university campuses, and residence areas. Other highly mixed zones may be composed of similar mixed functions. We suppose that the identified communities should combine residential, working, commercial, and public infrastructures in appropriate proportions, providing diverse urban services for citizens. These highly mixed zones are considered to be developed communities or plaza complexes, which accommodate large populations and show much urban vibrancy.
Figure 7. The spatial distribution of mixture index.
5. Discussions
In this study, we propose a framework to recognize mixed urban functions. The framework successfully integrates activity dynamic, mobility interaction, and activity semantic features to comprehensively illustrate human activities. The results show that the proposed human activity features contain sufficient information for recognizing mixed functions. Our model efficiently recognizes the spatial structure of five urban functions and estimates their proportions in each TAZ. We found a high correlation between the proportions of urban functions and land use, so the recognition result is accurate. The mixture index analysis indicates that highly mixed zones are located in developed communities with proper ratios of accommodations, working opportunities, and public facilities. Compared to previous studies (Feng et al. Citation2021; Huang et al. Citation2020; Yao et al. Citation2017), we quantified the proportions of mixed urban functions and mixing degree rather than the dominant function of each location. Our study leveraged abundant information in multiple human activity features that were not simultaneously considered by previous studies (Huang et al. Citation2022; Wu et al. Citation2018; Zhang et al. Citation2021), acquiring accurate results. Our results contribute to downstream urban studies and applications, such as spatial optimization, resource allocation, and infrastructure construction.
We have enhanced the capability of representation learning methods to efficiently extract human activity features from geospatial big data. The experiment shows that the embedding vectors are close in feature space if these places have similar human activity patterns. For example, the cluster of embedding vectors in the upper right of (c) indicates the association of activity theme in universities and research institutes. The three models fit the data structure of human activities features well. Convolutional networks are suitable for time series and detect the tendency and periodicity of human activities. The model distinguishes different activity dynamic patterns in commercial areas, residential areas, and parks. The node2vec model extracts the homophily and structural equivalence of the nodes in mobility OD graph. These characteristics imply the communities and hubs in the city. The doc2vec model is expert in analyzing the semantics of textual contents, and captures the activity themes in different places from social media data. As a result, these models efficiently obtain useful knowledge of multiple human activities respectively.
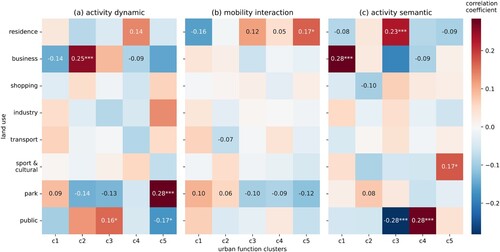
To verify the necessity and effectiveness of integrating activity dynamics, mobility interactions, and activity semantics, we conducted an ablation experiment on the embeddings of three human activity features. We performed FCM clustering algorithm on each of the features using the same options and parameters, then analyzed the Pearson’s correlation between the cluster prototypes and the urban land uses. The experiment showed that three activity features behave sensitively to different urban functions (). Activity dynamic features are capable of recognizing business districts and parks, while they have difficulty identifying residential and public areas ((a)). Mobility interaction features contribute to mapping different residential clusters, which may correspond to distinct residential communities ((b)). Activity semantic features are sensitive to residential, commercial, and public areas, but cannot detect parks and green space areas well ((c)). According to the results, each human activity feature is well-equipped to identify certain urban functions, while they failed to detect all functions and behave worse than the integrated place features. The proposed model efficiently leverages the information in the three human activity features. Hence, human activities with multiple features better recognize the mixed urban functions. It is necessary to consider all proposed human activity features.
Figure 8. The Pearson’s correlation coefficients between urban function clusters and land use types, using only one human activity feature, (a) activity dynamic features, (b) mobility interaction features, (c) activity semantic features. *, **, *** denote p < 0.1, 0.01, 0.001, respectively.
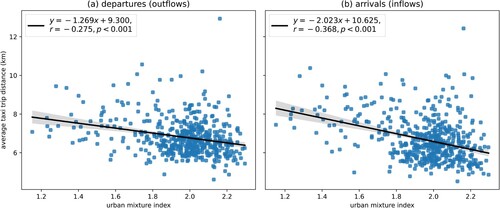
The mixture of urban functions has a significant influence on citizens’ daily life. Many studies have discovered that a place with multiple categories of retail stores or POIs has shorter trip distance (Cervero Citation1996; Zhang et al. Citation2021). Following these studies, we took the average distances of taxi trips to validate the mixture index and investigate its socioeconomic effect. We analyzed the correlation between the Shannon’s Entropy Index and trip distances by linear regression. The slopes of regressions for both departure and arrival distances are significantly negative (). This means that moderately increasing the mixing degree of urban functions can shorten the trip distance. We speculate that highly function-mixed places provide attractive services for local or neighborhood residents, heightening the ratio of taxi trips from nearby places. The result supports such finding in existing articles, validates the accuracy of the recognized mixed functions, and contributes to better urban planning and management. The sustainable development of cities should pursue the optimization of urban structure rather than urban sprawl and population growth (Chen, Liu, and Tao Citation2013). Our results indicate that the residents’ daily needs can be satisfied in a shorter distance if the degree of mixed functions increases. Therefore, constructing moderately mixed places improves people’s living quality and prevents disordered urban sprawl.
Figure 9. The linear regression between mixture index and average taxi trip distance, (a) departure (outflow) distance, (b) arrival (inflow) distance. The translucent bands denote 0.95 confidence intervals.
6. Conclusion
In this study, we proposed a framework to recognize mixed urban functions from the perspective of human activities. Activity dynamic, mobility interaction, and activity semantic features of a place are extracted by representation learning approaches, respectively, fusing the information in taxi OD data and social media tweets. Then the mixture of urban functions is revealed from the integrated deep features by a soft clustering method. In our case study in Beijing, China, we calculated the mixing degree of public, commercial, outdoor, residential, and recreational functions in each place, and found correlations between the mixing degree and socioeconomic features. The significance of our research is two-fold. In methodology domain, the proposed framework identifies the advantages of human activity perspective and representation learning methods in urban studies, providing guidelines for exploiting rich information in geospatial big data. In application domain, the research suggests that an urban structure with moderate mixed functions can alleviate traffic pressure, make the city more compact, and improve the quality of life of residents. Our study has significant implications to urban planning and management in making better urbanization strategies.
In future works, we plan to improve the research in the following aspects: First, the data applied in the experiment may affect the results. The human activity patterns derived from ODs of call detail records or even individual trajectories may be different, so further research can be conducted to compare results using these data. Second, we plan to expand the research area to other cities. We selected Beijing as the case study region in this research, which is dominated by tertiary industry. The spatial pattern and the socioeconomic effect of mixed urban functions may change in other cities. Third, further interpretations of place embeddings are required. As information is embedded in the whole vector space, it is wise to learn disentangled features and understand the meaning of each dimension. The explorations in these aspects will shed light on new discoveries and overcome the limitations of this study.
Acknowledgements
The authors would like to thank the editors and anonymous reviewers for the valuable comments, which helped improve this paper.
Disclosure statement
No potential conflict of interest was reported by the author(s).
Data availability statement
The Weibo tweet data can be obtained from https://open.weibo.com/. The EULUC-China map data can be obtained from http://data.ess.tsinghua.edu.cn/. The Didi taxi OD data are available from the corresponding author upon reasonable request.
Additional information
Funding
References
- Bai, S., J. Z. Kolter, and V. Koltun. 2018. “An Empirical Evaluation of Generic Convolutional and Recurrent Networks for Sequence Modeling.” arXiv preprint. http://arxiv.org/abs/1803.01271.
- Bengio, Y., A. Courville, and P. Vincent. 2013. “Representation Learning: A Review and New Perspectives.” IEEE Transactions on Pattern Analysis and Machine Intelligence 35 (8): 1798–1828. doi:10.1109/TPAMI.2013.50.
- Bezdek, J. C., R. Ehrlich, and W. Full. 1984. “FCM: The Fuzzy c-Means Clustering Algorithm.” Computers & Geosciences 10 (2–3): 191–203. doi:10.1016/0098-3004(84)90020-7.
- Burton, E., M. Jenks, and K. Williams, eds. 1996. The Compact City: A Sustainable Urban Form? Routledge. doi:10.4324/9780203362372
- Cervero, R. 1996. “Mixed Land-Uses and Commuting: Evidence from the American Housing Survey.” Transportation Research Part A: Policy and Practice 30 (5): 361–377. doi:10.1016/0965-8564(95)00033-X.
- Chen, M., W. Liu, and X. Tao. 2013. “Evolution and Assessment on China’s Urbanization 1960–2010: Under-Urbanization or Over-Urbanization?” Habitat International 38: 25–33. doi:10.1016/j.habitatint.2012.09.007.
- Crivellari, A., and E. Beinat. 2019. “From Motion Activity to Geo-Embeddings: Generating and Exploring Vector Representations of Locations, Traces and Visitors Through Large-Scale Mobility Data.” ISPRS International Journal of Geo-Information 8 (3): 1–23. doi:10.3390/ijgi8030134.
- Crooks, A., D. Pfoser, A. Jenkins, A. Croitoru, A. Stefanidis, D. Smith, S. Karagiorgou, A. Efentakis, and G. Lamprianidis. 2015. “Crowdsourcing Urban Form and Function.” International Journal of Geographical Information Science 29 (5): 720–741. doi:10.1080/13658816.2014.977905.
- Du, S., S. Du, B. Liu, and X. Zhang. 2019. “Context-Enabled Extraction of Large-Scale Urban Functional Zones from Very-High-Resolution Images: A Multiscale Segmentation Approach.” Remote Sensing 11 (16): 1902. doi:10.3390/rs11161902.
- Du, Z., X. Zhang, W. Li, F. Zhang, and R. Liu. 2020. “A Multi-Modal Transportation Data-Driven Approach to Identify Urban Functional Zones: An Exploration Based on Hangzhou City, China.” Transactions in GIS 24 (1): 123–141. doi:10.1111/tgis.12591.
- Feng, Y., Z. Huang, Y. Wang, L. Wan, Y. Liu, Y. Zhang, and X. Shan. 2021. “An SOE-Based Learning Framework Using Multisource Big Data for Identifying Urban Functional Zones.” IEEE Journal of Selected Topics in Applied Earth Observations and Remote Sensing 14: 7336–7348. doi:10.1109/JSTARS.2021.3091848.
- Franceschi, J.-Y., A. Dieuleveut, and M. Jaggi. 2019. “Unsupervised Scalable Representation Learning for Multivariate Time Series.” arXiv preprint. https://arxiv.org/abs/1901.10738.
- Gao, Y., Y. Chen, L. Mu, S. Gong, P. Zhang, and Y. Liu. 2022. “Measuring Urban Sentiments From Social Media Data: A Dual-Polarity Metric Approach.” Journal of Geographical Systems 24 (2): 199–221. doi:10.1007/s10109-021-00369-z.
- Gao, S., K. Janowicz, and H. Couclelis. 2017. “Extracting Urban Functional Regions From Points of Interest and Human Activities on Location-Based Social Networks.” Transactions in GIS 21 (3): 446–467. doi:10.1111/tgis.12289.
- Gong, P., B. Chen, X. Li, H. Liu, J. Wang, Y. Bai, J. Chen, and B. Xu. 2020. “Mapping Essential Urban Land Use Categories in China (EULUC-China): Preliminary Results for 2018.” Science Bulletin 65 (3): 182–187. doi:10.1016/j.scib.2019.12.007.
- Goodchild, M. F. 2011. “Formalizing Place in Geographic Information Systems.” In Communities, Neighborhoods, and Health, edited by L. M. Burton, S. A. Matthews, M. Leung, S. P. Kemp, and D. T. Takeuchi, 21–33. New York: Springer. doi:10.1007/978-1-4419-7482-2_2
- Grant, J. 2002. “Mixed Use in Theory and Practice: Canadian Experience with Implementing a Planning Principle.” Journal of the American Planning Association 68 (1): 71–84. doi:10.1080/01944360208977192.
- Grover, A., and J. Leskovec. 2016. “Node2vec: Scalable Feature Learning for Networks.” Proceedings of the 22nd ACM SIGKDD International Conference on Knowledge Discovery and Data Mining, 855–864. doi:10.1145/2939672.2939754.
- Hashim, M., N. Mohd Noor, and M. Marghany. 2011. “Modeling Sprawl of Unauthorized Development Using Geospatial Technology: Case Study in Kuantan District, Malaysia.” International Journal of Digital Earth 4 (3): 223–238. doi:10.1080/17538947.2010.494737.
- Hu, S., Z. He, L. Wu, L. Yin, Y. Xu, and H. Cui. 2020. “A Framework for Extracting Urban Functional Regions Based on Multiprototype Word Embeddings Using Points-of-Interest Data.” Computers, Environment and Urban Systems 80: 101442. doi:10.1016/j.compenvurbsys.2019.101442.
- Hu, S., Y. Xu, L. Wu, X. Wu, R. Wang, Z. Zhang, R. Lu, and W. Mao. 2021. “A Framework to Detect and Understand Thematic Places of a City Using Geospatial Data.” Cities 109: 103012. doi:10.1016/j.cities.2020.103012.
- Huang, W., L. Cui, M. Chen, D. Zhang, and Y. Yao. 2022. “Estimating Urban Functional Distributions with Semantics Preserved POI Embedding.” International Journal of Geographical Information Science 36 (10): 1905–1930. doi:10.1080/13658816.2022.2040510.
- Huang, Z., H. Qi, C. Kang, Y. Su, and Y. Liu. 2020. “An Ensemble Learning Approach for Urban Land Use Mapping Based on Remote Sensing Imagery and Social Sensing Data.” Remote Sensing 12 (19): 3254. doi:10.3390/rs12193254.
- Le, Q., and T. Mikolov. 2014. “Distributed Representations of Sentences and Documents.” Proceedings of the 31st International Conference on Machine Learning 32 (2): 1188–1196.
- Li, Y., T. Fei, and F. Zhang. 2019. “A Regionalization Method for Clustering and Partitioning Based on Trajectories From NLP Perspective.” International Journal of Geographical Information Science 33 (12): 2385–2405. doi:10.1080/13658816.2019.1643025.
- Liu, X., C. Andris, and S. Rahimi. 2019. “Place Niche and its Regional Variability: Measuring Spatial Context Patterns for Points of Interest with Representation Learning.” Computers, Environment and Urban Systems 75: 146–160. doi:10.1016/j.compenvurbsys.2019.01.011.
- Liu, P., and S. De Sabbata. 2021. “A Graph-Based Semi-Supervised Approach to Classification Learning in Digital Geographies.” Computers, Environment and Urban Systems 86: 101583. doi:10.1016/j.compenvurbsys.2020.101583.
- Liu, Y., X. Liu, S. Gao, L. Gong, C. Kang, Y. Zhi, G. Chi, and L. Shi. 2015. “Social Sensing: A New Approach to Understanding Our Socioeconomic Environments.” Annals of the Association of American Geographers 105 (3): 512–530. doi:10.1080/00045608.2015.1018773.
- Liu, Y., F. Wang, Y. Xiao, and S. Gao. 2012. “Urban Land Uses and Traffic ‘Source-Sink Areas’: Evidence From GPS-Enabled Taxi Data in Shanghai.” Landscape and Urban Planning 106 (1): 73–87. doi:10.1016/j.landurbplan.2012.02.012.
- Mawuenyegah, A., S. Li, and S. Xu. 2022. “Exploring Spatiotemporal Patterns of Geosocial Media Data for Urban Functional Zone Identification.” International Journal of Digital Earth 15 (1): 1305–1325. doi:10.1080/17538947.2022.2107099.
- Mikolov, T., K. Chen, G. Corrado, and J. Dean. 2013. “Efficient Estimation of Word Representations in Vector Space.” arXiv preprint. http://arxiv.org/abs/1301.3781.
- Rousseeuw, P. J. 1987. “Silhouettes: A Graphical Aid to the Interpretation and Validation of Cluster Analysis.” Journal of Computational and Applied Mathematics 20: 53–65. doi:10.1016/0377-0427(87)90125-7.
- Song, Y., L. Merlin, and D. Rodriguez. 2013. “Comparing Measures of Urban Land Use Mix.” Computers, Environment and Urban Systems 42: 1–13. doi:10.1016/j.compenvurbsys.2013.08.001.
- Tu, W., J. Cao, Y. Yue, S.-L. Shaw, M. Zhou, Z. Wang, X. Chang, Y. Xu, and Q. Li. 2017. “Coupling Mobile Phone and Social Media Data: A New Approach to Understanding Urban Functions and Diurnal Patterns.” International Journal of Geographical Information Science 31 (12): 2331–2358. doi:10.1080/13658816.2017.1356464.
- van der Maaten, L., and G. Hinton. 2008. “Visualizing Data Using t-SNE.” Journal of Machine Learning Research 9 (86): 2579–2605.
- Wang, Z., H. Li, and R. Rajagopal. 2020. “Urban2Vec: Incorporating Street View Imagery and POIs for Multi-Modal Urban Neighborhood Embedding.” Proceedings of the AAAI Conference on Artificial Intelligence 34 (01): 1013–1020. doi:10.1609/aaai.v34i01.5450.
- Winkler, R., F. Klawonn, and R. Kruse. 2011. “Fuzzy C-Means in High Dimensional Spaces.” International Journal of Fuzzy System Applications 1 (1): 1–16. doi:10.4018/ijfsa.2011010101.
- Wu, L., X. Cheng, C. Kang, D. Zhu, Z. Huang, and Y. Liu. 2018. “A Framework for Mixed-Use Decomposition Based on Temporal Activity Signatures Extracted From Big Geo-Data.” International Journal of Digital Earth 13 (6): 708–726. doi:10.1080/17538947.2018.1556353.
- Yan, B., K. Janowicz, G. Mai, and S. Gao. 2017. “From ITDL to Place2Vec: Reasoning About Place Type Similarity and Relatedness by Learning Embeddings From Augmented Spatial Contexts.” Proceedings of the 25th ACM SIGSPATIAL International Conference on Advances in Geographic Information Systems, 1–10. doi:10.1145/3139958.3140054.
- Yao, Y., X. Li, X. Liu, P. Liu, Z. Liang, J. Zhang, and K. Mai. 2017. “Sensing Spatial Distribution of Urban Land Use by Integrating Points-of-Interest and Google Word2Vec Model.” International Journal of Geographical Information Science 31 (4): 825–848. doi:10.1080/13658816.2016.1244608.
- Ye, C., F. Zhang, L. Mu, Y. Gao, and Y. Liu. 2021. “Urban Function Recognition by Integrating Social Media and Street-Level Imagery.” Environment and Planning B: Urban Analytics and City Science 48 (6): 1430–1444. doi:10.1177/2399808320935467.
- Zhai, W., X. Bai, Y. Shi, Y. Han, Z.-R. Peng, and C. Gu. 2019. “Beyond Word2vec: An Approach for Urban Functional Region Extraction and Identification by Combining Place2vec and POIs.” Computers, Environment and Urban Systems 74: 1–12. doi:10.1016/j.compenvurbsys.2018.11.008.
- Zhang, J., X. Li, Y. Yao, Y. Hong, J. He, Z. Jiang, and J. Sun. 2021. “The Traj2Vec Model to Quantify Residents’ Spatial Trajectories and Estimate the Proportions of Urban Land-Use Types.” International Journal of Geographical Information Science 35 (1): 193–211. doi:10.1080/13658816.2020.1726923.
- Zhong, C., X. Huang, S. M. Arisona, G. Schmitt, and M. Batty. 2014. “Inferring Building Functions From a Probabilistic Model Using Public Transportation Data.” Computers, Environment and Urban Systems 48: 124–137. doi:10.1016/j.compenvurbsys.2014.07.004.
- Zhou, Y., and Y. Huang. 2018. DeepMove: Learning Place Representations Through Large Scale Movement Data. 2018 IEEE International Conference on Big Data (Big Data), 2403–2412. doi:10.1109/BigData.2018.8622444.
- Zhu, X., and D. Guo. 2017. “Urban Event Detection With Big Data of Taxi OD Trips: A Time Series Decomposition Approach.” Transactions in GIS 21 (3): 560–574. doi:10.1111/tgis.12288.
- Zhu, A.-X., G. Lu, J. Liu, C.-Z. Qin, and C. Zhou. 2018. “Spatial Prediction Based on Third Law of Geography.” Annals of GIS 24 (4): 225–240. doi:10.1080/19475683.2018.1534890.
- Zhu, D., F. Zhang, S. Wang, Y. Wang, X. Cheng, Z. Huang, and Y. Liu. 2020. “Understanding Place Characteristics in Geographic Contexts Through Graph Convolutional Neural Networks.” Annals of the American Association of Geographers 110 (2): 408–420. doi:10.1080/24694452.2019.1694403.