
 ?Mathematical formulae have been encoded as MathML and are displayed in this HTML version using MathJax in order to improve their display. Uncheck the box to turn MathJax off. This feature requires Javascript. Click on a formula to zoom.
ABSTRACT
The downward shortwave radiation (DSR) is a key input parameter for land surface models and climate models. Based on the daily averaged Global Land Surface Satellite downward shortwave radiation (GLASS-DSR) dataset over the Yunnan-Kweichow Plateau (YKP) from 1984 to 2018, this paper analyzes variation trend and breakpoints of DSR. The results show that: annual averaged DSR decreases at a decreasing rate of −1.84 W·m−2·decade−1 over the YKP from 1984 to 2018; the overall distribution of interannual averaged DSR shows higher in the mid-west, and gradually decreasing from west to northeast over the YKP; the estimated averaged DSR is larger in spring than in summer due to the influence of the monsoon; monthly averaged DSR reaches its maximum in May and its minimum in December; breakpoints are found in the seasonal and trend components of daily averaged DSR. Eleven driving factors are examined for their effects on DSR variation, including annual average temperature, precipitation, 10 m wind speed, aerosol optical thickness (AOT), total cloud cover, elevation, slope, aspect, longitude, latitude, and climate zones. According to the findings, AOT predominates in the spatio-temporal distribution of DSR over the YKP. This study will contribute to studies related to climate change and highland radiation.
1. Introduction
In the energy budget, hydrological cycle, and carbon cycle (Saenz and Huang Citation2015; Hanrahan et al. Citation2017), DSR is a significant contributor as a source of energy for the exchange of heat (such as sensitive and latent) and gases (such as CO2, water vapor) between terrestrial-al/marine ecosystems and atmosphere. It controls to a substantial extent the use of solar energy by human life and ecosystems (Kioutsioukis et al. Citation2016; Fadlan et al. Citation2021). Therefore, it is essential to study the time-series variation characteristics and attribution analysis of DSR.
For applications on the land surface, several new DSR products with higher resolution have been created. In 2013, the first GLASS-DSR product with 5 km resolution was produced (Zhang et al. Citation2014). From 2000 until the present, a land surface DSR product (MCD18A1) with a spatial resolution of 1 km was produced using the Moderate Resolution Imaging Spectroradiometer (MODIS) (Wang et al. Citation2020). The Breathing Earth System Simulator (BESS) generates daily DSR products with a spatial resolution of 0.05◦ from 2000 to 2019 (Ryu et al. Citation2018). The Earth Polychromatic Imaging Camera (EPIC) data onboard the Deep Space Climate Observatory (DSCOVER/EPIC) were used to generate the first global land products of DSR with 0.1∘ resolution from June 2015 to June 2019 (Hao et al. Citation2020). The criteria of this investigation are met by the high spatial resolution and lengthy temporal period of GLASS-DSR (Jin et al. Citation2013; Li, Wang, and Liang Citation2021).
The scientific community has been paying particular attention to the global variability of DSR. Sanchez-Lorenzo et al. studied the trend of DSR over Europe for two time periods. Firstly, a trend analysis using annual average DSR revealed a slightly significant negative trend of −0.4 W·m−2·decade−1 from 1939 to 2012 (Sanchez-Lorenzo et al. Citation2015). Following that, a trend analysis showed a general increase in all-day DSR and an averaged increase in downward surface solar radiation of at least 2 W·m−2·decade−1 across Europe from 1983 to 2010 (Sanchez-Lorenzo et al. Citation2017). In South Asia, the net DSR had a trend of −0.54 W·m−2·yr−1 from 1979 to 2004. Net DSR decreased by −0.05 W·m−2·yr−1 under clear skies (Kambezidis et al. Citation2012). DSRs from four stations in Switzerland were used to examine trends from 1996 to 2015. The trend of all-sky DSR was 0.6–4.3 W·m−2·decade−1, while the trend of clear-sky DSR was −2.9–3.3 W·m−2·decade−1 (Nyeki et al. Citation2019). In China, the annual averaged SSR showed a fluctuating decreasing trend (−0.16 × 10⁻¹MJ·m−2·year−1) under all sky conditions from 1961 to 2014. The annual averaged SSR showed a darkening trend in mainland China from 1961 to 2005, and an increasing trend (0.02 × 10⁻¹MJ·m−2·year−1) from 2005 to 2014 for all sky conditions (Yang et al. Citation2021). Surface solar radiation (SSR) in Northwest China, the Qinghai-Tibet Plateau, and Inner Mongolia Plateau are higher than those in other parts of China (Yang et al. Citation2010; Peng et al. Citation2020).
In addition, the driving factors that influence the change of spatial distribution of DSR are also a hot topic of research. The pre-monsoon variability (from late April to early May) was characterized by increasing aerosols, decreasing clouds and precipitation, and increasing DSR in South Asia (Bollasina and Nigam Citation2009; Nyeki et al. Citation2019). Changes in AOT and aerosol-cloud interactions (rather than clouds) had a large impact on the interannual variability of DSR in China (Zhou et al. Citation2019; Wang, Ma et al. Citation2021). DSR increased along with the rise in precipitation, which was brought on by changes in cloud cover or cloud thickness (Wang et al. Citation2015). Cloudiness (low and total cloudiness) had a significant impact on DSR variation in China, showing some negative correlation. The variation of total cloud cover was the main factor affecting the increase or decrease of DSR (Duan and Zhong Citation2020). In comparison to other regions, DSR was higher in high altitude and low cloud cover areas (Peng et al. Citation2020). The Tibetan Plateau (TP) has a high transmission rate of shortwave radiation due to its high altitude, lack of aerosols, and low overall cloudiness (Yang et al. Citation2010; Peng et al. Citation2020). The significant increase of aerosols from India leads to the decrease of clear-sky surface solar radiation in the south of TP. And the decrease in clear-sky surface solar radiation across the Tibetan Plateau is positively impacted by the rise in water vapor influx from the southern boundary (Wang, Zhang et al. Citation2021; Yu et al. Citation2022). Based on some of the above, the variation of DSR is mainly attributed to the variation of cloud cover, solar altitude angle, altitude, monsoon, and aerosols (Perdigão et al. Citation2016; Zuluaga et al. Citation2021). In summary, although a lot of work has been done on the spatio-temporal variation, trend variation and attribution of DSR, the correlation analysis of DSR over the YKP has been rarely reported (Zhang et al. Citation2015; Wei et al. Citation2021).
Based on the GLASS-DSR dataset (reanalysis and fusion), an in-depth analysis of the time-series variation and attribution analysis of DSR is conducted over the YKP from 1984 to 2018. The main study includes analyzing the spatio-temporal variability and trend analysis of DSR at different time scales, monitoring the breakpoints of trend and seasonal components of daily averaged DSR, and exploring the driving factors of annual averaged DSRs over the YKP from 1984 to 2018. This paper is structured as follows. Section 2 describes the study area, dataset, and methodology. Section 3 presents the results of this study. Section 4 presents the general discussion and conclusions.
2. Materials and method
2.1. Study area
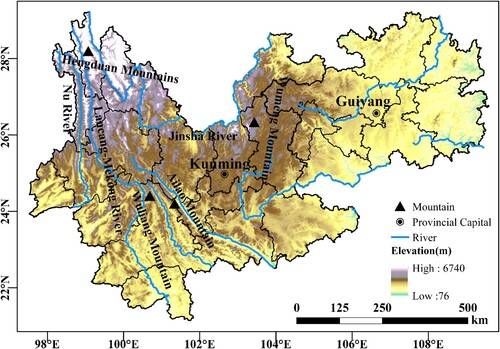
The Yunnan-Kweichow Plateau is one of the four major plateaus in China. It is located between 97°–110°E and 21°–30°N. The terrain is high in the northwest and low in the north. Yunnan-Kweichow Plateau, which is bounded by Wumeng Mountain, may be broadly separated into Guizhou Plateau and Yunnan Plateau. The YKP is a humid subtropical area with a subtropical monsoon climate in China. Due to different topographic characteristics and atmospheric circulation conditions, the climate in this region shows significant spatial variability (Lu et al. Citation2020). The YKP is divided into nine categories based on the Köppen climate classification. Many significant rivers, including the Lancang-Mekong River, the Jinsha River, and the Nu River, pass through the YKP. The Hengduan Mountains, which are close to the Qinghai-Tibet Plateau in the northwest, the Wumeng Mountain, which is in the middle, the Ailao Mountain, and the Wuliang Mountain, which are in the south central, are among the numerous mountains found in the YKP. The averaged elevation of YKP is 1640.44 meters, with a maximum of 6740 meters and a minimum of 76 meters. depicts the administrative territory of China's Yunnan Province and Guizhou Province, which is the YKP discussed in this research.
Figure 1. Study area scope and elevation.
2.2. Dataset
2.2.1. GLASS-DSR data
The global daily averaged DSR with a spatial resolution of 0.1°×0.1° is downloaded from the GLASS website (http://glcf.umd.edu/) of the University of Maryland. Several datasets from polar-orbiting and geostationary satellites were used to create the GLASS-DSR dataset using an improved look-up table (LUT) approach. The LUT algorithm mainly considers the influences of surface elevation, atmospheric water vapor, and bidirectional reflection distribution function (BRDF). Surface measured data from 34 stations are used to improve algorithm and validate GLASS-DSR dataset (Zhang et al. Citation2014; Zhang et al. Citation2016; Yang et al. Citation2018; Zhang et al. Citation2019).
2.2.2. Driving factors data
Monthly averaged temperature and precipitation data with a spatial resolution of 1 km are from National Earth System Science Data Center, National Science & Technology Infrastructure of China (http://www.geodata.cn). Based on the worldwide high-resolution climate dataset provided by WorldClim and the global 0.5° climate dataset published by the Climatic Research Unit (CRU), the datasets were created via the Delta spatial downscaling scheme in the Chinese region.
ERA5 provides hourly estimates for a large number of atmospheric, ocean-wave and land-surface quantities. To facilitate many climate applications, ECMWF publishes hourly data and monthly average data. 10 m wind speed band (band si10) and total cloud cover (band tcc) with a spatial resolution of 0.01° × 0.01° from the reanalysis-era5-single levels monthly means dataset published by the Climate Data Store (https://cds.climate.copernicus.eu/#!/home).
MERRA-2 has provided a variety of products on different time scales since 1980, including land surface processes, atmospheric composition and circulation, and ocean circulation. Aerosol optical thickness (band AOD ANA) with a spatial resolution of 0.625° × 0.5° is from the MERRA-2 in-stM_2d_gas_Nx: 2d, Monthly mean, Instantaneous, Single-Level, Assimilation, aerosol optical thickness Analysis V5.12.4 (M2IMNXGAS) dataset, which released by NASA EARTHDATA GES DISC (https://disc.gsfc.nasa.gov/datasets/M2IMNXGAS_5.12.4/summary).
The terrain data used in this paper mainly include elevation, slope and aspect. Slope analysis and aspect analysis are carried out to produce spatial distribution maps of slope and aspect in the YKP based on the NASA SRTM DEM data with a spatial resolution of 30 m.
The National Earth System Science Data Center, National Science & Technology Infrastructure of China (http://www.geodata.cn) is where the climate zone data is obtained. The global Köppen climate type spatial distribution dataset is compiled from temperature and precipitation data for 1901–1995, 1961–1990, and 1951–2000.
2.3. Methodology
2.3.1. GLASS-DSR data pre-processing
Firstly, the HDF format of the DSR raster pictures is converted to a geotif format including geographic data. Then transformed DSR dataset is clipped by using the shape file of YKP. Finally, the different time scales averaged DSR data from 1984 to 2018 over the YKP are obtained using daily averaged DSR, including yearly averaged DSR, seasonal averaged DSR, and monthly averaged DSR. The seasonal division criteria are March to May for spring, June to August for summer, September to November for autumn, and the remaining three months for winter.
2.3.2. Trend analysis
For the examination of spatio-temporal variation in long time series data, the Mann-Kendall test combined with the Theil-Sen median method is frequently utilized (Gocic and Trajkovic Citation2013; Atta-ur-Rahman and Dawood Citation2016).
The Theil-Sen Median method is calculated as follows (Sen Citation1968).
(1)
(1) where Median is the median value taken. xj and xi are DSR data at different time scales from 1984 to 2018.
The Mann-Kendall test is calculated as follows (Kendall Citation1975; Mann Citation1945).
(2)
(2)
(3)
(3) where n is the length of the long time series data; xj and xi are the values at time j and time i. S is used to calculate the test statistic Z, which is calculated as follows.
(4)
(4) where the variance Var(S) is calculated as:
(5)
(5) where n is the length of the long time series data; g is the number of knots (recurring datasets) in the time series; and tp is the number of repeated data in the pth set of repeated datasets ().
Table 1. Categories of trend significance for Mann-Kendall test.
2.3.3. Breakpoints detection
Verbesselt et al. first proposed the Breaks for Additive Seasonal and Trend algorithm (BFAST) in 2010. Iterative time series approaches are used to decompose the original time series data into trend, seasonal and remainder components, and then breakpoints in the trend and seasonal components are detected (Verbesselt et al. Citation2010). The additive decomposition model is given by.
(6)
(6) where Yt is the daily averaged DSR data at time t, Tt is the trend component at time t, St represents the seasonal component at time t and et is the remainder at time t.
The BFAST program provides three seasonal models (‘dummy’, ‘harmonic’, or ‘none’). Long time series remote sensing images have been proven to be easier to detect using harmonic models (DeVries et al. Citation2015). The seasonal component's breakpoints can happen at different times than those of the trend component. The BFAST algorithm is based on a least square moving summation test (OLS-MOSUM) to determine if there are breakpoints on the trend and seasonal components, uses a Bayesian information theory criterion to determine the optimal number of breakpoints, and estimates the position of the breakpoints in the time series by least squares. After initializing the seasonal component from the original time series data, the following process is iterated until the timing and number of breakpoints are constant (Tsutsumida et al. Citation2013).
2.3.4. Geodetector model
The Geodetector model is a tool to detect and exploit spatially stratified heterogeneity (SSH) proposed by Prof. Jinfeng Wang's team. It is a novel spatial statistical method based on factor detector, ecological detector, interaction detector and risk detector to detect the influence of factors on the spatial variability of the target and reveal its driving factors (Wang and Xu Citation2017). The factor detector of the Geodetector model identifies driving factors and detects their forces. The risk detector is used to determine if there is a significant difference in the mean values of the attributes between the two subregions. The interaction detector can explain the interaction between any two driving factors and dependent variable, showing great advantages in studying the driving mechanisms of complex geographical factors (Su et al. Citation2020; Wang, Samat et al. Citation2021). In this work, three main types of detectors (factor detector, risk detectors and interaction detector) are used.
Factor detector detects the spatial heterogeneity of DSR over the YKP, and thus determines the extent to which each influence factor explains the spatial variation of DSR. The calculation is as follows (Wang and Xu Citation2017).
(7)
(7) where Nh is the number of class h in A, h = 1, 2, ······, L; N is the total number of samples in the study area; A is one of the influence factors in X; L is the number of categories in A; σ2 is the discrete variance of the whole region; σ2h is the discrete variance of class h. The independent variable X is able to explain 100×q% of the dependent variable Y. A stronger value of q means that A has a better ability to explain the spatial distribution of DSR. The value of q varies from 0 to 1.
The risk detector detects areas where the difference between two subzones of a factor is more severe, where significance tests are performed using the t-statistic (Wang and Xu Citation2017).
(8)
(8) where
denotes the mean value of the attribute in subregion h; nh is the number of image elements in subregion h; Var denotes the variance.
The interaction detection identifies the interaction between two different driving factors, i.e. it assesses whether the factors X1 and X2 when acting together increase or decrease the explanatory power on Y, or whether the effects of these factors on Y are independent of each other. The evaluation is performed by first computing the independent q-values of the two components X1 and X2 on Y, q(X1) and q(X2), and then in the second step calculating the q-values of their interaction, q(X1∩X2), and then comparing q(X1), q(X2), and q(X1∩X2) ().
Table 2. Types of interaction between two different driving factors.
3. Results
The solar radiation may be absorbed and scattered by air molecules, water vapor, clouds and dust in the atmosphere before it reaches the ground. The part of the radiation that eventually reaches the ground is called DSR, which is determined by the altitude angle of the Sun and the transparency of the atmosphere (Letu, Shi et al. Citation2020). At low latitudes and high altitudes, the downward shortwave radiation is strong. This study examines the spatial distribution patterns and change rates of monthly, seasonal, and annual averaged DSR, the abrupt change analysis of daily averaged DSR, and the attribution analysis of annual averaged DSR over the YKP from 1984 to 2018.
3.1. Annual averaged spatio-temporal variation of DSR
The general distribution of annual averaged DSR exhibits lower in the northeast, higher in the northwest, and a progressive decline from the west to the northeast over the YKP, as can be seen in (a). From 1984 to 2018, the annual averaged DSR was 176.7 W·m−2. Between the Yunnan plateau and the Guizhou plateau, which is roughly located in the Wumeng Mountains, there is a distinct transition zone of annual averaged DSR. The Wumeng Mountains block the southwest and southeast monsoons, which has an impact on the distribution of precipitation and AOT. Both precipitation and aerosol optical thickness are the driving factors affecting the spatial distribution of annual averaged DSR. The above-average areas are mainly located in the Yunnan Plateau, accounting for 65.28% of the total study area. Due to the lower elevation, less precipitation, higher AOT and higher temperature in the northern of Guizhou Province, the annual averaged DSR reaches a minimum of 117.5 W·m−2. Due to the higher elevation, more precipitation, lower AOT and lower temperature in the northwestern of Yunnan Plateau, the annual averaged DSR reaches a maximum of 245 W·m−2.
Figure 2. (a) Spatial distribution and (b) change trend of annual averaged DSR over the YKP from 1984 to 2018.
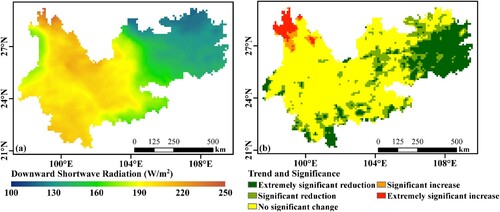
(b) illustrates the interannual DSR showed a significant reduced trend of 0.19 W·m−2 per year over the YKP from 1984 to 2018; 35.01% of the regions showed a significant reduced trend (β<0, 95% confidence level); while 4.27% showed a significant increased trend (β > 0, 95% confidence level). In the northwest of YKP, there is a substantial increase in interannual DSR with a maximum increase of 1.28 W·m−2·yr−1; in the east of YKP, there is a considerable decrease in interannual DSR with a maximum decrease of −0.83 W·m−2·yr−1.
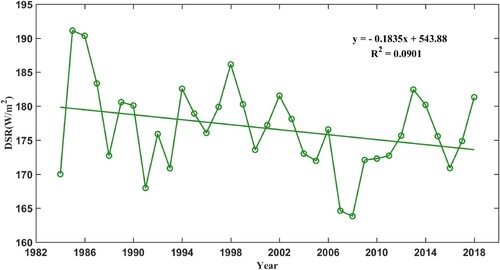
As seen in , the 35-year linear fit of the annual averaged DSR data showed a decreasing trend, where the annual averaged DSR decreased at a rate of −1.84 W·m−2·decade−1 over the YKP from 1984 to 2018. The annual averaged DSR fluctuates between 163.83 and 191.12 W·m−2. The annual averaged DSR reached its lowest value of 163.83 W·m−2 in 2008, due to the increase in annual averaged precipitation and decrease in annual averaged temperature in 2007 and 2008 (Lv, Liu, and Liu Citation2009).
Figure 3. Trends in mean values of annual averaged DSR over the YKP from 1984 to 2018.
3.2. Spatio-temporal variation of seasonal averaged DSR
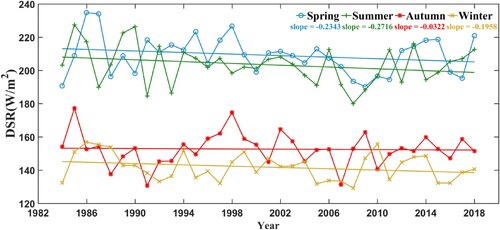
From the spatial distribution of the seasonal averaged DSR of the four seasons in , the seasonal averaged DSR shows the characteristics of Spring (209.113 W·m−2) > Summer (203.377 W·m−2) > Autumn (152.611 W·m−2) > Winter (141.789 W·m−2). Over the YKP, DSR does not peak in the summer when the solar altitude angle is at its highest, but instead peaks in the spring at 209.11 W·m−2. Frequent monsoons induce an increase in precipitation and water vapor concentration, which lowers AOT to a minimum of 0.184 and makes DSR reach the ground weaker in summer than it does in spring. In autumn and winter, the seasonal averaged DSR decreases with decreasing solar altitude angle, and reaches the minimum in winter.
Figure 4. The spatial distribution and variability trends of seasonal averaged DSR over the YKP from 1984 to 2018.
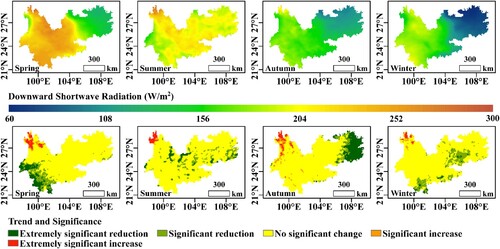
From 1984 to 2018, the spatial distribution of DSR intensity in different seasons was obviously different over the YKP, but the overall distribution trend was consistent, which presented a phenomenon that DSR intensity in the western part was greater than that in the eastern part over the YKP (). From the comparison of the four seasons, the intensity of DSR shows the characteristics of Spring > Summer > Autumn > Winter in the central and western of the study area. While in the eastern of the study area the characteristics is Summer > Spring > Autumn > Winter. The main reasons are as follows: (1) the central and western belong to the subtropical plateau monsoon climate with distinct dry and wet seasons in the YKP. Contrarily, the eastern belongs to the subtropical humid monsoon climate with uniform precipitation distribution throughout the year, resulting in a lower water vapor content in the atmosphere at the central and western than that at the eastern over the YKP. (2) The middle and western geography is higher in altitude and thinner in air compared with the eastern region, resulting in stronger DSR reaching the ground. (3) Aerosols have an impact on the DSR by directly absorbing and scattering solar energy, with the geographical distribution of AOT gradually increasing from the west to the east.
From the spatial distribution of seasonal averaged DSR variability trends in , we can see that the averaged DSR is decreasing throughout all seasons. From 1984 to 2018, 16.84% of the study area had a significant decrease in the seasonal averaged DSR and 4.17% had a significant increase in spring; 12.94% had a significant decrease in the seasonal averaged DSR and 2.17% had a significant increase in summer; 18.33% of the study areas had a significant decrease in the seasonal averaged DSR and 6.04% had a significant increase in autumn; 13.17% of the study areas had a significant decrease in the seasonal averaged DSR and 2.09% had a significant increase in winter. In summary, the most significant change in seasonal averaged DSR is happened in autumn.
The mean values of seasonal averaged DSR decrease at a rate of −2.34 W·m−2·decade−1 in spring, −2.72 W·m−2·decade−1 in summer, −0.32 W·m−2·decade−1 in autumn, and −1.96 W·m−2·decade−1 in winter. The rate of decline in seasonal averaged DSR is greatest in summer, mainly due to rainfall increasing at a rate of 3.705 mm·decade−1. The mean values of seasonal averaged DSR are most stable in autumn. Seasonal averaged DSR, precipitation, air temperature, wind speed, and aerosol optical thickness shows decreasing, increasing, increasing, decreasing, and increasing trends in spring, summer and winter, respectively. However, seasonal averaged precipitation and seasonal averaged wind speed showed opposite trends in autumn from 1984 to 2018 (i.e. decreasing seasonal averaged precipitation and increasing seasonal averaged wind speed), resulting in a slow rate of decrease in seasonal averaged DSR ().
Figure 5. Trends in mean values of seasonal averaged DSR over the YKP from 1984 to 2018.
3.3. Spatio-temporal variation of monthly averaged DSR
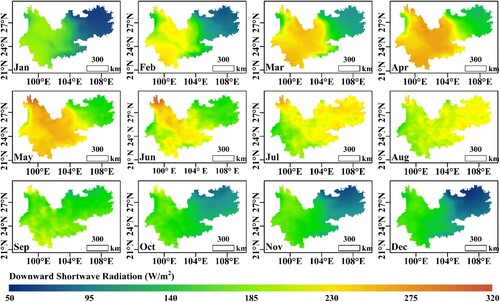
As can be seen from , the intra-annual variation of DSR shows a gradual increase from January with increasing solar altitude angle. The monthly averaged DSR reaches its maximum of 218.94 W·m−2 in May, which is mainly due to the onset of rainy season and the higher solar altitude angle (Tozuka and Oettli Citation2018). The monthly averaged DSR reaches its minimum of 125.81 W·m−2 in December. The small increase in the monthly averaged DSR is caused by the maximum monthly averaged precipitation (199.82 mm), the maximum monthly averaged temperature (21.58 °C) and the minimum aerosol optical thickness (0.1680) in July. The spatial distribution of monthly averaged DSR is generally greater in the central-west than in the east from January to December. However, it is obvious that the radiation is stronger in the eastern than in the central and western in July and August. This is mostly because July and August are summer months, the Yunnan plateau experiences rainy weather, the Guizhou plateau has a higher averaged temperature than the Yunnan plateau, and the solar altitude angle gradually decreases as the ground reaches its maximum in Yunnan plateau.
Figure 6. The spatial distribution of monthly averaged DSR over the YKP from 1984 to 2018.
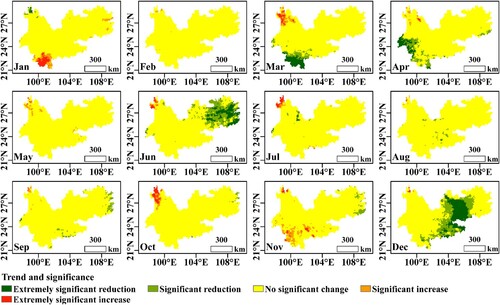
illustrates that, in comparison to other months, the area of significant change trend in monthly averaged DSR is minimal in February and is greatest in December. In December, 31.94% of the total study area shows a significant reduced trend. Next, 22.74% of the study area shows a significant reduced trend in June. In November, 6.75% of the study area shows a significant increasing trend. In February, 99.7% of the study area shows no significant increasing or reduced trends.
Figure 7. The change trend of monthly averaged DSR over the YKP from 1984 to 2018.
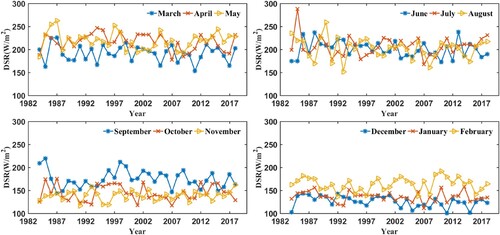
As shown in , the three months in winter have weaker monthly averaged DSR than the other three seasons, especially the weakest in December. In November, the mean values of monthly averaged DSR reaches a maximum increasing rate of 1.81 W·m−2·decade−1, with a significant increase trend in the area of 6.75% of the study area. In December, they reached a maximum decreasing rate of 4.75 W·m−2·decade−1, with a significant reduced trend in the area of 31.94% of the total study area. As the southwest monsoon begins to blow landward from the Indian Ocean in March, it causes a maximum of 2.38 m/s in monthly averaged wind speed, a maximum of 0.43 in the monthly averaged AOT and a maximum incremental rate of 0.0093 per year in the monthly averaged AOT over the YKP in March. The mean values of monthly averaged DSR decreases by 2.24 W·m−2·decade−1 in March. As the monthly averaged precipitation reaches a maximum incremental rate of 8.346 mm·decade−1 in June, the mean values of monthly averaged DSR reaches a decremental rate of 3.842 W·m−2·decade−1. The mean values of monthly averaged DSR are decreasing at a maximum decremental rate of 4.75 W·m−2·decade−1 in December from 1984 to 2018.
Figure 8. Trends in mean values of monthly averaged DSR over the YKP from 1984 to 2018, where the 12 months are shown separately by four seasons.
3.4. Mutation analysis of the daily averaged DSR
Over the YKP, daily averaged DSR reached a minimum of 7.84 W·m−2 on 27 June 1985 and a maximum of 373.667 W·m−2 on 12 June 2013 in the long time series from 1984 to 2018. There was a sinusoidal cycle in the daily average DSR variation.
The BFAST approach divides the daily averaged DSR into trend component, seasonal component and remainder component. The number of trend component breakpoints is higher than the number of seasonal component breakpoints, demonstrating that BFAST is far more sensitive to identify changes in trend components than changes in seasonal components during the experiment. Based on the BFAST algorithm, the daily averaged DSR is detected with five breakpoints on the trend component and two breakpoints on the seasonal component. This indicates that the trend of DSR is unstable. On the trend component, the daily averaged DSR suddenly decreased in July 1986, July 2007, March 2010 and July 2015, and suddenly increased in November 1993. The most striking discovery, which is shown in , is that the daily averaged DSR exhibits a rising trend from 1983 to 1986, a declining trend from 1986 to 2007, and an increasing trend from 2007 to 2018. This finding helps to understand the trend of the annual averaged DSR. In the seasonal component, breakpoints occurred in May 1986 and October 1994. In 1984 and 1985, there are two wave peaks throughout the year with the annual maximum in summer. There is only one wave peak throughout the year with the annual maximum in spring from 1986 to 1994. From 1995 to 2018, there are two wave peaks throughout the year with the annual maximum in spring.
Figure 9. Detecting structural changes in both trend and seasonal components of daily averaged DSR over the YKP from 1984 to 2018. The dashed lines represent the breakpoint occurred, and the date of the breakpoint is marked by Julius Day and year.
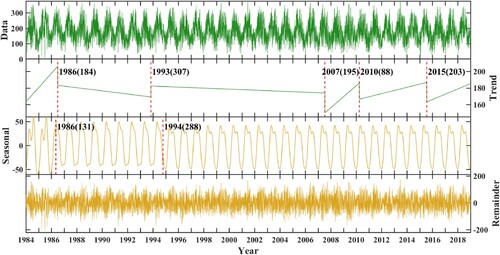
Historical El Niño/La Niña events are available from The Climate Prediction Center (https://origin.cpc.ncep.noaa.gov). The time periods when El Niño occurred are September 1984 to July 1985, August 1986 to January 1988, April 1991 to May 1992, August 1994 to February 1995, June 2009 to February 2010 and September 2014 to March 2016. The time periods when La Niña occurred are May 2007 to May 2008, May 2010 to April 2011. From , it can be found that the breakpoints in the trend and seasonal components occur before and after the occurrence of the two phenomena or when the phenomena occur. However, the breakpoints of the trend components which occurred in July 1986, November 1993, and March 2010 overlap with the Oceanic Nino Index (ONI) of about 0°C. The time periods when El Niño and La Niña occur are highly coincident with the occurrence of the breakpoints in the trend and seasonal components, suggesting that El Niño and La Niña may influence the variability of daily averaged DSR over the YKP (Hatzianastassiou et al. Citation2005; Cui, Wang, and Zhang Citation2021). Since the YKP is influenced by the southwest monsoon and southeast monsoon in summer and by the northwest monsoon and cold air from the north in winter, the DSR is highly susceptible to sudden changes before and after the monsoon over the YKP.
3.5. Driving analysis of annual averaged DSR
The effects of clouds and aerosols on scattering and absorption in the atmosphere have a significant impact on the DSR variable (Bao et al. Citation2019; Letu, Yang et al. Citation2020; Yu et al. Citation2022). Some studies have shown that latitude affects the spatial distribution of DSR (Duan and Zhong Citation2020). DSR influences climate change (reflected in temperature). Southwest monsoons, southeast monsoons, and cold air from the north all have a significant impact on YKP. YKP is characterized by complex terrain and significant climatic differences (Yang et al. Citation2021). In order to analyze the attribution analysis of the yearly mean DSR taking into account the characteristics of YKP and DSR, we chose 11 driving factors.
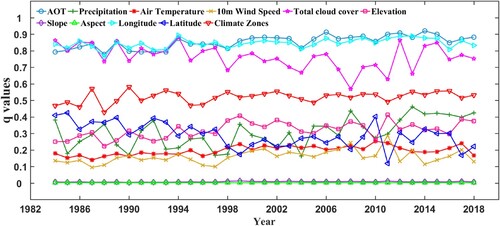
For 35 years, from 1984 to 2018, the Geodetector model is utilized to undertake an attribution analysis of the spatial heterogeneity in annual averaged DSR. displays the results of the factor detection. The q-values passed the significance test (p < 0.05). The averaged explanatory power of different factors on spatial heterogeneity of annual averaged DSR is ranked as AOT > Longitude > Total Cloud Cover > Climate Zones > Elevation > Precipitation > Latitude > Temperature > 10 m Wind Speed > Slope > Aspect. The q values of annual averaged precipitation have the largest variation with an annual effect rate of 0.47%. It can be seen that the q-values of AOT and longitude are the largest, and their explanatory power for the spatial heterogeneity of annual averaged DSR are 0.85 and 0.84, respectively. This indicates that AOT and longitude are the dominant factors affecting the spatial variation of DSR in YKP. Secondly, total cloud cover and climate zones have averaged q-value of 0.76 and 0.52, respectively, with explanatory power of over 50%, which indicates that they are important factors influencing the spatial variation of DSR. The averaged q-values of elevation, precipitation and latitude are 0.32, 0.30 and 0.29, respectively. It indicates that they are secondary factors influencing the spatial variation of DSR. The averaged q-values of air temperature and 10 m wind speed respectively are 0.20 and 0.16. Their explanatory power is more than 15%, which indicated that air temperature and 10 m wind speed have certain influence on the spatial variation of annual averaged DSR. Slope and aspect don't significantly affect the spatial variance of DSR in the YKP, as evidenced by the explanatory power of slope and aspect being less than 10%.
Figure 10. Interannual variations of q values of driving factors on the spatial heterogeneity of DSR over the YKP from 1984 to 2018.
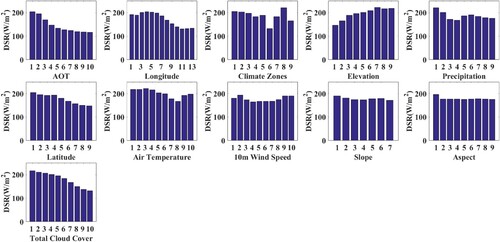
displays the findings from the risk detection analysis, which clearly demonstrates that DSR declines as AOT increases. The reaction of DSR to different classes of longitude exhibits a trend that rises initially, peaking in the study area around 100°–101°E, and then decelerates. DSR decreases with the increase of total cloud cover. Annual averaged DSR reaches a maximum at Dwb (i.e. temperate monsoon climate) and a minimum at Cfa (i.e. subtropical humid climate) in Köppen climate type spatial distribution. The annual averaged DSR first increases with increasing elevation, reaches a peak at 4464–5196 m (category 7). When the annual average precipitation is less than 5.31 cm, the DSR reaches its maximum. The reaction of DSR to different precipitation classes exhibits a tendency of decreasing, then increasing, and then decreasing. DSR decreases with the increase of latitude, which shows DSR is related to latitude, and the annual averaged DSR has a strong intensity at low latitude. At annual averaged temperatures below 1°C, DSR is greater than 215 W·m−2 (category 1, category 2, category 3, category 4) and the location is at high altitude, which again proves that high altitude leads to strong DSR. There is no obvious regularity in 10 m wind speed and slope. The annual averaged DSR takes a maximum when aspect is in the first category (i.e. no aspect and flat surface).
Figure 11. Risk detector of driving factors for spatial heterogeneity of DSR over the YKP from 1984 to 2018. The x-coordinate axis is the rank classification of the impact factors, and the y-coordinate axis is the averaged DSR of a factor category.
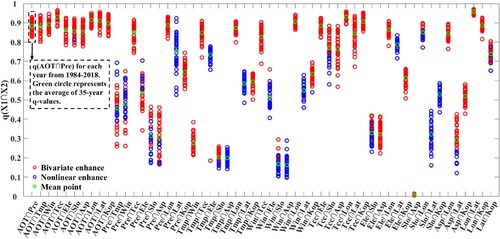
Frequently, a synergistic interaction of numerous driving factors determines the spatial variation in the annual averaged DSR rather than a single driving component alone. As can be seen in , the strongest interaction affecting the spatial distribution of the annual averaged DSR is between longitude and latitude in the YKP, and their q-value is 0.96. The slope and aspect interaction has the lowest q value of all the interactions. The q-values for the interactions of AOT with the other ten factors are all higher than 0.85, where it has the largest q-value for the interaction with total cloud cover.
Figure 12. Interaction Detection of driving factors for DSR heterogeneity over the YKP from 1984 to 2018. X-coordinate axis is X1∩X2. Y-coordinate axis is q(X1∩X2).
4. Discussion and conclusions
In this paper, the spatiotemporal distribution and variation characteristics of DSR at various time scales over the YKP were examined using a trend analysis method integrating the Theil-Sen median method and the Manna-Kendall test. The BFAST method was used to study the mutation analysis of daily averaged DSR over the YKP. To explore the attribution analysis of annual averaged DSR, the Geodetector model was employed.
The spatial distribution of the annual averaged DSR generally shows a higher central and western part and a gradual decrease from west to east over YKP, which is basically consistent with the elevation distribution in the study area. The annual averaged DSR decreases at a rate of 1.84 W·m−2·decade−1. The monsoon has an impact on the seasonal averaged DSR, making higher seasonal averaged DSR in spring than in summer. Due to the increased rainfall and AOT in summer, the decrease in DSR is also largest. Monthly averaged DSR steadily rises with rising solar altitude angle starting in January and reaches a maximum in May. Then, under the influence of the monsoon, it starts to decline and reaches a minimum in December.
With five and two breakpoints, respectively, the trend component and seasonal component of the daily averaged DSR are unstable. AOT predominates the variation of DSR out of the 11 driving components. Latitude, total cloud cover, and AOT all have a negative correlation with the annual averaged DSR. But DSR is positively correlated with elevation.
GLASS-DSR offers long-term, cost-free data to study DSR evolution anywhere. DSR is a primary driver of numerous terrestrial processes in addition to playing a significant part in surface radiation and energy balance. This paper presents firstly the spatio-temporal analysis and attribution analysis of DSR over the YKP from 1984 to 2018 using GLASS-DSR data to find the patterns. This study quantitatively analyzes the explanatory power of the driving factors on the spatial heterogeneity of DSR. Future work will investigate the precise cause-and-effect relationship between various factors and DSR.
Geolocation information
Yunnan-Kweichow Plateau.
Supplemental Material
Download MS Word (127.7 MB)Acknowledgements
We thank the GLASS product and the principal investigators who provided us with the dataset. We also thank NASA/GES DISC for providing STRM data and aerosol optical thickness dataset, Climate Data Store (CDS) for 10 m wind speed dataset. Acknowledgement for the data support from ‘National Earth System Science Data Center, National Science & Technology Infrastructure of China (http://www.geodata.cn)’.
Disclosure statement
No potential conflict of interest was reported by the author(s).
Additional information
Funding
References
- Atta-ur-Rahman, and Muhammad Dawood. 2016. “Spatio-Statistical Analysis of Temperature Fluctuation Using Mann–Kendall and Sen’s Slope Approach.” Climate Dynamics 48 (3–4): 783–797. doi:10.1007/s00382-016-3110-y.
- Bao, Shanhu, Husi Letu, Jun Zhao, Huazhe Shang, Yonghui Lei, Anmin Duan, Bing Chen, et al. 2019. “Spatiotemporal Distributions of Cloud Parameters and Their Response to Meteorological Factors over the Tibetan Plateau During 2003–2015 Based on MODIS Data.” International Journal of Climatology 39: 532–543. doi:10.1002/joc.5826.
- Bollasina, Massimo, and Sumant Nigam. 2009. “Absorbing Aerosols and Pre-Summer Monsoon Hydroclimate Variability Over the Indian Subcontinent: The Challenge in Investigating Links.” Atmospheric Research 94 (2): 338–344. doi:10.1016/j.atmosres.2009.06.008.
- Cui, Xiaolin, Qian Wang, and Shuai Zhang. 2021. “Correlation of the Downward Shortwave Radiation Changes and El Nino: A Case Study of Qinling-Huaihe Region.” Journal of Geomatics 46: 2095–6045. doi:10.14188/j.2095-6045.2018338.
- DeVries, Ben, Jan Verbesselt, Lammert Kooistra, and Martin Herold. 2015. “Robust Monitoring of Small-Scale Forest Disturbances in a Tropical Montane Forest Using Landsat Time Series.” Remote Sensing of Environment 161: 107–121. doi:10.1016/j.rse.2015.02.012.
- Duan, Guo, and Ruomei Zhong. 2020. “Study on the Characteristics of Downward Shortwave Radiation in China from 2007 to 2014.” Climate Change Research Letters 9 (4): 285–298. doi:10.12677/ccrl.2020.94032.
- Fadlan, Ahmad, Muchammad Rizki, Tomi Ilham Pahlewi, Mohammad Ridwan Nur Prasetyo, Fajar Masan Bali, Imelda Umiyatul Badriyah, and Muhammad Aldi Lukman. 2021. “Variations in Short Wave Radiation and Ocean Temperature in the Tropical Indian Ocean.” Buletin Oseanografi Marina 10 (2): 171–179. doi:10.14710/buloma.v10i2.36552.
- Gocic, Milan, and Slavisa Trajkovic. 2013. “Analysis of Changes in Meteorological Variables Using Mann-Kendall and Sen's Slope Estimator Statistical Tests in Serbia.” Global and Planetary Change 100: 172–182. doi:10.1016/j.gloplacha.2012.10.014.
- Hanrahan, Janel, Alexandria Maynard, Sarah Y. Murphy, Colton Zercher, and Allison Fitzpatrick. 2017. “Examining the Climatology of Shortwave Radiation in the Northeastern United States.” Journal of Applied Meteorology and Climatology 56 (10): 2869–2881. doi:10.1175/jamc-d-16-0420.1.
- Hao, Dalei, Ghassem R. Asrar, Yelu Zeng, Qing Zhu, Jianguang Wen, Qing Xiao, and Min Chen. 2020. “DSCOVR/EPIC-Derived Global Hourly and Daily Downward Shortwave and Photosynthetically Active Radiation Data at 0.1◦ × 0.1◦Resolution.” Earth System Science Data 12: 2209–2221. doi:10.5194/essd-12-2209-2020.
- Hatzianastassiou, N., C. Matsoukas, A. Fotiadi, K. G. Pavlakis, E. Drakakis, D. Hatzidimitriou, and I. Vardavas. 2005. “Global Distribution of Earth’s Surface Shortwave Radiation Budget.” Atmospheric Chemistry and Physics 5: 2847–2867. doi:10.5194/acp-5-2847-2005. www.atmos-chem-phys.org/acp/5/2847/.
- Jin, Huaan, Ainong Li, Jinhu Bian, Zhengjian Zhang, Chengquan Huang, and Mengxue Li. 2013. “Validation of Global Land Surface Satellite (GLASS) Downward Shortwave Radiation Product in the Rugged Surface.” Journal of Mountain Science 10 (5): 812–823. doi:10.1007/s11629-013-2543-6.
- Kambezidis, H. D., D. G. Kaskaoutis, Shailesh Kumar Kharol, K. Krishna Moorthy, S. K. Satheesh, M. C. R. Kalapureddy, K. V. S. Badarinath, Anu Rani Sharma, and M. Wild. 2012. “Multi-Decadal Variation of the Net Downward Shortwave Radiation Over South Asia: The Solar Dimming Effect.” Atmospheric Environment 50: 360–372. doi:10.1016/j.atmosenv.2011.11.008.
- Kendall, Maurice. 1975. Rank Correlation Methods. London: Griffin.
- Kioutsioukis, Ioannis, Alexander de Meij, Hermann Jakobs, Eleni Katragkou, Jean-Francois Vinuesa, and Andreas Kazantzidis. 2016. “High Resolution WRF Ensemble Forecasting for Irrigation: Multi-Variable Evaluation.” Atmospheric Research 167: 156–174. doi:10.1016/j.atmosres.2015.07.015.
- Letu, Husi, Jiancheng Shi, Ming Li, Tianxing Wang, Huazhe Shang, Yonghui Lei, Dabing Ji, Jianguang Wen, Kun Yang, and Liangfu Chen. 2020. “A Review of the Estimation of Downward Surface Shortwave Radiation Based on Satellite Data: Methods, Progress and Problems.” Science China Earth Sciences 63 (7): 774–789. doi:10.1007/s11430-0199589-0.
- Letu, Husi, Kun Yang, Takashi Y. Nakajima, Hiroshi Ishimoto, Takashi M. Nagao, Jérôme Riedi, Anthony J. Baran, et al. 2020. “High-Resolution Retrieval of Cloud Microphysical Properties and Surface Solar Radiation Using Himawari-8/AHI Next-Generation Geostationary Satellite.” Remote Sensing of Environment 239: 111583. doi:10.1016/j.rse.2019.111583.
- Li, Ruohan, Dongdong Wang, and Shunlin Liang. 2021. “Comprehensive Assessment of Five Global Daily Downward Shortwave Radiation Satellite Products.” Science of Remote Sensing 4: 100028. doi:10.1016/j.srs.2021.100028.
- Lu, Hanyu, Leiding Ding, Ziqiang Ma, Hongyi Li, Tianjian Lu, Manli Su, and Jintao Xu. 2020. “Spatiotemporal Assessments on the Satellite-Based Precipitation Products from Fengyun and GPM Over the Yunnan-Kweichow Plateau, China.” Earth and Space Science 7 (1). doi:10.1029/2019ea000857.
- Lv, Ning, Ronggao Liu, and Jiyuan Liu. 2009. “The Spatio-Temporal Variation of Downward Shortwave Radiation Over China from 1998 to 2002: The Spatio-Temporal Variation of Downward Shortwave Radiation Over China from 1998 to 2002.” Geo-Information Science 11: 623–630. doi:10.3724/SP.J.1047.2009.00623.
- Mann, H. B. 1945. “Non-Parametric Tests Against Trend.” Econometrica 13: 245–259. doi:10.2307/1907187.
- Nyeki, Stephan, Stefan Wacker, Christine Aebi, Julian Gröbner, Giovanni Martucci, and Laurent Vuilleumier. 2019. “Trends in Surface Radiation and Cloud Radiative Effect at Four Swiss Sites for the 1996–2015 Period.” Atmospheric Chemistry and Physics 19 (20): 13227–13241. doi:10.5194/acp-19-13227-2019.
- Peng, Zhong, Husi Letu, Tianxing Wang, Chong Shi, Chuanfeng Zhao, Gegen Tana, Naizhuo Zhao, et al. 2020. “Estimation of Shortwave Solar Radiation Using the Artificial Neural Network from Himawari-8 Satellite Imagery Over China.” Journal of Quantitative Spectroscopy & Radiative Transfer 240: 106672. doi:10.1016/j.jqsrt.2019.106672.
- Perdigão, João Carlos, Rui Salgado, Maria João Costa, Hari Prasad Dasari, and Arturo Sanchez-Lorenzo. 2016. “Variability and Trends of Downward Surface Global Solar Radiation Over the Iberian Peninsula Based on ERA-40 Reanalysis.” International Journal of Climatology 36 (12): 3917–3933. doi:10.1002/joc.4603.
- Ryu, Youngryel, Chongya Jiang, Hideki Kobayashi, and Matteo Detto. 2018. “MODIS-Derived Global Land Products of Shortwave Radiation and Diffuse and Total Photosynthetically Active Radiation at 5km Resolution from 2000.” Remote Sensing of Environment 204: 812–825. doi:10.1016/j.rse.2017.09.021.
- Saenz, Gerardo Andres, and Huei-Ping Huang. 2015. “Trends in Downward Solar Radiation at the Surface Over North America from Climate Model Projections and Implications for Solar Energy.” Advances in Meteorology 2015: 1–7. doi:10.1155/2015/483679.
- Sanchez-Lorenzo, Arturo, Aaron Enriquez-Alonso, Martin Wild, Jörg Trentmann, Sergio M. Vicente-Serrano, Alejandro Sanchez-Romero, Rebekka Posselt, and Maria Z. Hakuba. 2017. “Trends in Downward Surface Solar Radiation from Satellites and Ground Observations over Europe During 1983–2010.” Remote Sensing of Environment 189: 108–117. doi:10.1016/j.rse.2016.11.018.
- Sanchez-Lorenzo, A., M. Wild, M. Brunetti, J. A. Guijarro, M. Z. Hakuba, J. Calbó, S. Mystakidis, and B. Bartok. 2015. “Reassessment and Update of Long-Term Trends in Downward Surface Shortwave Radiation over Europe (1939–2012).” Journal of Geophysical Research: Atmospheres 120 (18): 9555–9569. doi:10.1002/2015jd023321.
- Sen, Pranab Kumar. 1968. “Estimates of the Regression Coefficient Based on Kendall's Tau.” Journal of the American Statistical Association 63 (324): 1379–1389. doi:10.1080/01621459.1968.10480934.
- Su, Ying, Tianxin Li, Shikun Cheng, and Xu Wang. 2020. “Spatial Distribution Exploration and Driving Factor Identification for Soil Salinisation Based on Geodetector Models in Coastal Area.” Ecological Engineering 156: 105961. doi:10.1016/j.ecoleng.2020.105961.
- Tozuka, Tomoki, and Pascal Oettli. 2018. “Asymmetric Cloud-Shortwave Radiation-Sea Surface Temperature Feedback of Ningaloo Niño/Niña.” Geophysical Research Letters 45: 9870–9879. doi:10.1029/2018GL079869.
- Tsutsumida, Narumasa, Izuru Saizen, Masayuki Matsuoka, and Reiichiro Ishii. 2013. “Land Cover Change Detection in Ulaanbaatar Using the Breaks for Additive Seasonal and Trend Method.” Land 2 (4): 534–549. doi:10.3390/land2040534.
- Verbesselt, Jan, Rob Hyndman, Achim Zeileis, and Darius Culvenor. 2010. “Phenological Change Detection While Accounting for Abrupt and Gradual Trends in Satellite Image Time Series.” Remote Sensing of Environment 114 (12): 2970–2980. doi:10.1016/j.rse.2010.08.003.
- Wang, Dongdong, Shunlin Liang, Yi Zhang, Xueyuan Gao, Meredith G. L. Brown, and Aolin Jia. 2020. “A New Set of MODIS Land Products (MCD18): Downward Shortwave Radiation and Photosynthetically Active Radiation.” Remote Sensing 12 (1): 168. doi:10.3390/rs12010168.
- Wang, Chunxiao, Yaoming Ma, Binbin Wang, Weiqiang Ma, Xuelong Chen, and Cunbo Han. 2021. “Analysis of the Radiation Fluxes over Complex Surfaces on the Tibetan Plateau.” Water 13 (21): 3084. doi:10.3390/w13213084.
- Wang, Wei, Alim Samat, Jilili Abuduwaili, and Yongxiao Ge. 2021. “Quantifying the Influences of Land Surface Parameters on LST Variations Based on GeoDetector Model in Syr Darya Basin, Central Asia.” Journal of Arid Environments 186: 104415. doi:10.1016/j.jaridenv.2020.104415.
- Wang, S.-Y. Simon, Joseph Santanello, Hailan Wang, Daniel Barandiaran, Rachel T. Pinker, Siegfried Schubert, Robert R. Gillies, et al. 2015. “An Intensified Seasonal Transition in the Central U.S. That Enhances Summer Drought.” Journal of Geophysical Research: Atmospheres 120 (17): 8804–8816. doi:10.1002/2014jd023013.
- Wang, Jinfeng, and Chengdong Xu. 2017. “Geodetector: Principle and Prospective.” Acta Geographica Sinica 72: 116–134. doi:10.11821/dlxb201701010.
- Wang, Ziyan, Ming Zhang, Lunche Wang, Lan Feng, Yingying Ma, Wei Gong, and Wenmin Qin. 2021. “Long-Term Evolution of Clear Sky Surface Solar Radiation and Its Driving Factors over East Asia.” Atmospheric Environment 262. doi:10.1016/j.atmosenv.2021.118661.
- Wei, Yu, Xiaotong Zhang, Wenhong Li, Ning Hou, Weiyu Zhang, Jiawen Xu, Chunjie Feng, et al. 2021. “Trends and Variability of Atmospheric Downward Longwave Radiation over China from 1958 to 2015.” Earth and Space Science 8 (2): e2020E–A001370. doi:10.1029/2020ea001370.
- Yang, Kun, Jie He, Wenjun Tang, Jun Qin, and Charles C.K. Cheng. 2010. “On Downward Shortwave and Longwave Radiations over High Altitude Regions: Observation and Modeling in the Tibetan Plateau.” Agricultural and Forest Meteorology 150: 38–46. doi:10.1016/j.agrformet.2009.08.004.
- Yang, Xuefang, Wenmin Qin, Lunche Wang, Ming Zhang, and Zigeng Niu. 2021. “Long-Term Variations of Surface Solar Radiation in China from Routine Meteorological Observations.” Atmospheric Research 260. doi:10.1016/j.atmosres.2021.105715.
- Yang, Lu, Xiaotong Zhang, Shunlin Liang, Yunjun Yao, Kun Jia, and Aolin Jia. 2018. “Estimating Surface Downward Shortwave Radiation Over China Based on the Gradient Boosting Decision Tree Method.” Remote Sensing 10 (2). doi:10.3390/rs10020185.
- Yu, Lan, Ming Zhang, Lunche Wang, Wenmin Qin, Daoyang Jiang, and Junli Li. 2022. “Variability of Surface Solar Radiation Under Clear Skies Over Qinghai-Tibet Plateau: Role of Aerosols and Water Vapor.” Atmospheric Environment 287. doi:10.1016/j.atmosenv.2022.119286.
- Zhang, Xiaotong, Shunlin Liang, Zhen Song, Hailin Niu, Guoxin Wang, Wenjun Tang, Zhuoqi Chen, and Bo Jiang. 2016. “Local Adaptive Calibration of the Satellite-Derived Surface Incident Shortwave Radiation Product Using Smoothing Spline.” IEEE Transactions on Geoscience and Remote Sensing 54 (2): 1156–1169. doi:10.1109/tgrs.2015.2475615.
- Zhang, Xiaotong, Shunlin Liang, Gongqi Zhou, Haoran Wu, and Xiang Zhao. 2014. “Generating Global Land Surface Satellite Incident Shortwave Radiation and Photosynthetically Active Radiation Products from Multiple Satellite Data.” Remote Sensing of Environment 152: 318–332. doi:10.1016/j.rse.2014.07.003.
- Zhang, Hailong, Xiaozhou Xin, Li Li, and Qinhuo Liu. 2015. “Estimating Global Solar Radiation Using a Hybrid Parametric Model from MODIS Data over the Tibetan Plateau.” Solar Energy 112: 373–382. doi:10.1016/j.solener.2014.12.015.
- Zhang, Xiaotong, Xiang Zhao, Wenhong Li, Shunlin Liang, Dongdong Wang, Qiang Liu, Yunjun Yao, et al. 2019. “An Operational Approach for Generating the Global Land Surface Downward Shortwave Radiation Product from MODIS Data.” IEEE Transactions on Geoscience and Remote Sensing 57 (7): 4636–4650. doi:10.1109/TGRS.2019.2891945.
- Zhou, Zhigao, Aiwen Lin, Lunche Wang, Wenmin Qin, Yang Zhong, and Lijie He. 2019. “Trends in Downward Surface Shortwave Radiation from Multi-Source Data over China During 1984–2015.” International Journal of Climatology 40 (7): 3467–3485. doi:10.1002/joc.6408.
- Zuluaga, Cristian Felipe, Alvaro Avila-Diaz, Flavio B. Justino, and Aaron B. Wilson. 2021. “Climatology and Trends of Downward Shortwave Radiation over Brazil.” Atmospheric Research 250: 105347. doi:10.1016/j.atmosres.2020.105347.