?Mathematical formulae have been encoded as MathML and are displayed in this HTML version using MathJax in order to improve their display. Uncheck the box to turn MathJax off. This feature requires Javascript. Click on a formula to zoom.
ABSTRACT
The combination of spatial distribution, semantic characteristics, and sometimes temporal dynamics of POIs inside a geographic region can capture its unique land use characteristics. Most previous studies on POI-based land use modeling research focused on one geographic region and select one spatial scale and semantic granularity for land use characterization. There is a lack of understanding on the impact of spatial scale, semantic granularity, and geographic context on POI-based land use modeling, particularly large-scale land use modeling. In this study, we developed a scalable POI-based land use modeling framework and examined the impact of these three factors on POI-based land use characterization using data from three geographic regions. We developed a unified semantic representation framework for POI semantics that can help fuse heterogeneous POI data sources. Then, by combining POIs with a neural network language model, we developed a spatially explicit approach to learn the embedding representation of POIs and AOIs. We trained multiple supervised classifiers using AOI embeddings as input features to predict AOI land use at different semantic granularities. The classification performance of different land use classes was analyzed and compared across three geographic regions to identify the semantic representativeness of POI-based AOI embedding and the impact of geographic context.
1. Introduction
With the rapid advancement of information and communication technologies, many different geospatial data sources have become available and been utilized for land use characterization, such as high-resolution remote sensing (RS) images (Zhong, Zhu, and Zhang Citation2015; Sanlang et al. Citation2021), demographic data, and socially sensed data (e.g. taxi GPS trajectory, social media check-ins, Points of Interest (POIs)) (Liu et al. Citation2017; Yuan, Zheng, and Xie Citation2012). However, at a larger scale (e.g. national or global scale), many data sources (e.g. high-resolution RS images) are difficult to access, if available at all. Moreover, land use analysis based on RS images can only utilize physical features of ground objects, such as spectral, shape, and textural features. As a result, the impact of human social-economic activities is difficult to detect from RS images. Since land use characteristics of an area of interest (AOI) are closely related to the social-economic activities inside, data sources such as POI data that can fill the semantic gap could offer valuable insights into how humans use the space. POIs within an AOI can capture how humans use the space and reflect land use characteristics of the AOI. The close link between POIs and land use, along with the extensive coverage and timeliness of big POI data, provide researchers with a unique opportunity to model land use dynamics based on POI attributes at different spatial scales and semantic granularity.
POI data have been widely used to extract regional land use functions due to their universal availability across different geographic regions, and essential roles in people’s daily activity planning (Zhai et al. Citation2019; Yao et al. Citation2017; Arsanjani et al. Citation2013; Andrade, Alves, and Bento Citation2020). Most existing studies on POI-based land use modeling focus on one geographic region and often select one spatial scale (e.g. traffic analysis zone) and semantic granularity for land use classification. There is a lack of understanding of the impact of spatial scale, semantic granularity on POI-based land use modeling, particularly large-scale land use modeling. Moreover, geographic context, i.e. the social, cultural, and economic status of a geographic region, could play an important role in POI distribution and land use characteristics. Spatial heterogeneity has always been an important factor in geographic analysis (Jiang Citation2015; Pickett and Cadenasso Citation1995). There is limited research on the variation of POI semantics across different geographic regions. McKenzie and Janowicz (Citation2017) explored the regional variation of thematic Latent Dirichlet Allocation (LDA) topic composition for different place types in major cities in the US. But there is no study that analyzes and compares the semantic representativeness and variation of POI embeddings trained for different geographic regions that have different levels of economic development, social and cultural norms.
In this study, we examined the impact of spatial scales and semantic granularities, and geographic context on POI-based land use modeling. Specifically, we would like to address the following research questions: (1), Can AOI embedding derived from POIs effectively characterize the land use of an AOI? (2), POIs in the geographic space can be grouped by different spatial units (e.g. grid cell, street block, traffic analysis zone), and the land use type of an AOI can be labeled at different semantic granularities (e.g. non-residential → civic → education). How do spatial scale and semantic granularity of the land use model impact the semantic representatives of AOI embeddings? (3), Are AOI embeddings for the same land use class similar across different geographic regions? What land use classes have the biggest variation across different geographic regions? Previous studies have demonstrated the effectiveness of combining POIs with a neural network language model (NNLM) to transform AOIs into characteristic vectors, which can be used as input for supervised classification of AOI land use (Yao et al. Citation2017; Zhai et al. Citation2019). We adopted the NNLM approach for AOI representation learning in this study, but we developed our own data fusion and semantic representation framework that augmented POI semantics and integrated spatial and semantic dimensions of POIs in the AOI representation learning process. A unified semantic representation framework for POI semantics was designed to harmonize heterogeneous POI semantics from different data sources, which was essential for handling large-scale and diverse data sources collected from different countries. What’s more, the unified semantic representation can also represent the semantics of non-POI geographic features (e.g. road segments), thus allowing the NNLM model to incorporate non-POI geographic features in the AOI representation learning process. To capture both the spatial distribution and semantic attributes of POIs inside an AOI into the AOI embedding, POIs were organized hierarchically according to the road network hierarchy and then used as input for AOI embedding learning. We used a supervised classification approach to analyze the effectiveness of AOI embeddings in capturing land use characteristics at different spatial and semantic granularities. Labeled land use polygon samples were collected from OSM and spatially aggregated with road network constraints. Both the original and aggregated land use polygon samples were transformed into characteristic vectors based on POIs inside and used as input for supervised classification model training. Two different land use classification schemes, one with 3 classes and one with 13 classes, were adopted for the supervised classification model training to test the semantic distinctiveness of different land use classes at different semantic granularities. We selected three different geographic regions (i.e. South Africa, South Korea, England) as study regions to understand the impact of geographic context on POI-based land use modeling. For each selected geographic region, eight supervised classifiers were trained with training samples with different spatial scales and labeled with different semantic granularities.
The rest of the paper is organized as follows: Section 2 discusses related work on land use modeling using different data sources, particularly POI data; Section 3 introduces the study regions and data sources selected for this study; Section 4 discusses in detail the representation learning of AOI for the purpose of land use class prediction; Section 5 analyzes the results of supervised classifiers trained with AOI embeddings of different spatial scales and land use classes with different semantic granularities for three geographic regions; Section 6 presents the conclusions and future work.
2. Related work
The rapid advancement of geospatial data collection techniques has made many data sources easily available for land use/land cover analysis. RS imagery is one of the most used data sources, however, low to moderate resolution RS images such as Landsat images cannot capture specific land use information of the geographic region. High-resolution RS images are being used more and more frequently to extract more detailed land use information, but RS images can only capture specific physical attributes of ground objects, e.g. shape, texture, and spectral. The social-economic activities within a geographic region, which are essential for understanding the land use characteristics, are challenging to detect from RS images (Yao et al. Citation2017). In response, researchers have tried to combine high-resolution RS images with other data sources such as LiDAR (Sanlang et al. Citation2021), social media data (Liu et al. Citation2017) to extract urban functional regions. To capture the human activity semantics on the ground, many different types of data sources, including POIs, cell phone records (Toole et al. Citation2012), taxi GPS trajectories (Qi et al. Citation2011), social media data (Frias-Martinez and Frias-Martinez Citation2014; Zhan, Ukkusuri, and Zhu Citation2014) have all been used for extracting useful information about land use characteristics of an AOI.
With its universal availability and open access on a large scale, POI data has been one of the most frequently used data sources for land use analysis. For example, online restaurant data has been used to estimate daytime and nighttime population, number of offices and consumption levels (Dong, Ratti, and Zheng Citation2019). With Volunteered Geographic Information (VGI) data being extensively utilized for land use and human dynamics analysis (Yao et al. Citation2017; Fan and Stewart Citation2021), the benefits of using VGI (e.g. data availability, cost-effectiveness, timeliness) for geographic dynamic research have been widely recognized. For a large-scale analysis such as this study, the benefits of using VGI are even more prominent. To mitigate the data quality and biases issues in VGI (Basiri et al. Citation2019; Chehreghan and Ali Abbaspour Citation2018; Wu et al. Citation2021), we collected and fused POI data from multiple different sources, including both commercial and crowd-sourced data sources, for our analysis. Many previous POI-based land use analyses only used POI category frequency information. Human mobility patterns and frequency of POI categories were combined to discover regions of different functions in an urban area (Yuan, Zheng, and Xie Citation2012). POI data was used to estimate business types at the census block level for Boston metropolitan area (Jiang et al. Citation2015). The frequency density and the term frequency-inverse document frequency (TF-IDF) indicator for POI were calculated to quantify the social-economic attributes of an urban functional zone (Chen, Zhang, and Yang Citation2021). Only relying upon POI category frequencies for land use characterization ignored the spatial layout of POIs within an AOI. Researchers tried to develop a land use classification model based on spatial features extracted from POI, e.g. distance to the nearest POI (Andrade, Alves, and Bento Citation2020). With the impressive advancement of natural language processing (NLP) and deep learning research, researchers started to combine POIs with NLP and NNLM to better integrate spatial and semantic information of POIs for land use characterization. Probabilistic topic models were adopted to extract semantic patterns that characterize place types from POIs (McKenzie and Janowicz Citation2017; Liu et al. Citation2017; Thakur and Fan Citation2021). Yao et al. (Citation2017) combined Google Word2Vec with POI data to classify urban land use at the TAZ level for an urban region in Southern China. Zhai et al. (Citation2019) used the Word2Vec approach to calculate embeddings for traffic analysis zones and used the K-means clustering approach to identify the cluster of vectors and manually labeled the clusters as undefined region, developed public service region, developed working and industrial region, emerging working and industrial region, emerging residential region, developed residential region, nature park, developed rural region. Most existing research focused on the land use characteristics of a single urban region and chose one specific spatial granularity and land use classification scheme. An in-depth discussion on the impact of spatial scale, semantic granularity, and geographic context on POI-based land use models is needed.
3. Study region and data
Three geographic regions from three different continents around the globe were selected as the study regions () to analyze the impact of geographic contexts on the proposed approach. The selected study regions, including South Africa, South Korea and England, have different levels of economic development, different social-cultural customs, and landscapes. We can analyze and compare the semantic salience of different land use types in different geographic regions as well as the regional variations of POI-based land use modeling by applying the same POI-based land use modeling approach to three different geographic regions.
Figure 1. Spatial distribution of POIs from three selected geographic regions (a) South Africa (b) Facebook (c) 4square (d) Here (e) OSM (f) Google (g) TomTom (h) Vkonta (i) Wikimap (j) South Korea (k) England.
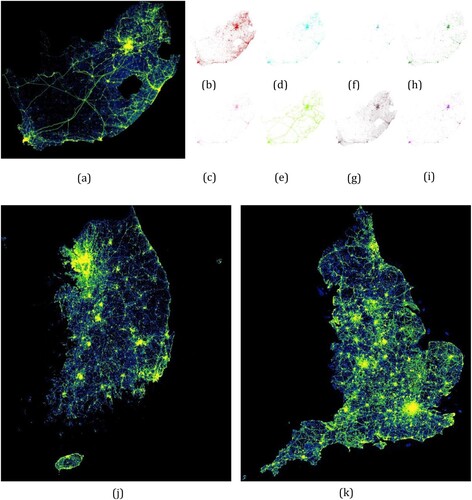
To account for data coverage differences of different data sources and capture as much land use characteristic information as possible, we collected and fused POI data from nine different data sources, including Facebook, Here, Vkontakte, Foursquare, OSM, Wikimapia, Google, TomTom, and WRI. Some POI data sources can be directly downloaded and POIs can be extracted from the downloaded database (e.g. OSM, Wikimapia); commercial POI data sources like Google and Facebook were collected through the official APIs. The POI data collection was supported by the PlanetSense project (Thakur et al. Citation2015). shows the spatial distributions of collected POIs for the three selected geographic regions. As shown in (b–i), POIs from different data sources have different coverage as they have different emphases on different types of POIs. Duplicates of the POI records could also exist in different data sources, and we will discuss in detail the data fusion process that is developed to fuse POIs from different data sources in section 4. In total, 1,883,176 POIs were collected for South Africa, 1,435,028 POIs were collected for South Korea, and 3,253,419 POIs were collected for England.
4. AOI representation learning
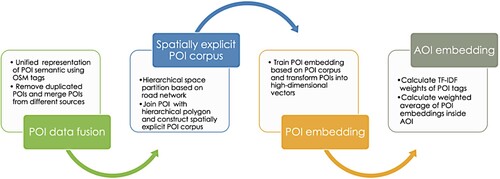
Characterizing land use of an AOI based on POIs inside the AOI requires good representation learning of AOI, i.e. learning representations of AOIs that can extract useful information when building a classifier to predict land use type of AOI. A good AOI representation should be able to capture the underlying explanatory factors from POIs inside and be useful as input to a supervised predictor (Bengio, Courville, and Vincent Citation2013). The spatial distribution and the semantic attributes of POIs inside an AOI are both important indicators of human activities inside and its land use characteristics. Effective representation of an AOI should integrate the spatial and semantic dimensions of POIs inside an AOI to capture its land use characteristics. In this study, we developed an AOI representation learning framework that transforms AOIs into high-dimensional embeddings using the NNLM approach. The AOI representation learning framework includes four components: (1) POI semantic augmentation through a unified representation of POI semantics based on OSM tags; (2) build spatially explicit POI corpus through the hierarchical partition of space based on four different levels of road network; (3) generate high-dimensional POI embedding based on the spatially explicit POI corpus; (4) calculate AOI embedding based on the weighted sum of the POI embeddings. The result AOI embeddings were then used as input for supervised land use classification model training to examine the effectiveness of AOI embeddings in characterizing land use ().
Figure 2. Framework for AOI embedding learning based on POI.
4.1. Unified representation of geographic feature semantics
The semantics of geographic features are largely captured by the category information assigned to it (Smith and Mark Citation1998). Different POI data sources often adopt different categorization schemes. POI categories from different data sources vary not only in number but also in semantic granularity. For example, general categories (e.g. grocery store, hospital) and more specific categories (e.g. asian grocery, children’s hospital) could coexist. For England, the Google Place POI data have 101 different categories, Facebook POI data have over 1300 different categories, and crowd-sourced Wikimapia POI data has several thousands of unique categories.
To harmonize POI categories with varying semantic granularities and fuse different POI data sources, a semantic ontology network, SONET, was developed to interlink different POI categories through OSM tags (Palumbo, Thompson, and Thakur Citation2019). Each POI category was translated into a collection of OSM tags that served as an intermediate semantic bridge to link different POI categories together. The SONET knowledge graph has 16,644 nodes and 113,024 links among them. For example, both Yucatecan Restaurant category from Foursquare and Mexican cuisine category from Wikimapia are translated into <amenity = restaurant; cuisine = mexican; building = retail>. showed an example of semantic translation from different category names to a unified collection of OSM tags.
Table 1. Example semantic translation from POI category to OSM tags.
In comparison with existing approaches that directly use category names to represent POI semantics, the semantic translation from original categories to OSM tags provided several benefits. First, the OSM tags representation allows us to unify different category names that have the same or similar semantics. For example, Mexican restaurant and Chaat Place are both categories representing restaurant type but do not have any words in common. The unified semantic representation will not only help remove duplicated POIs from different data sources but also can clean the noise in POI vocabulary, which will be a data augmentation for POI embedding training. Second, OSM tags can represent the POI semantics in a more granular fashion and capture nuanced semantic similarity that may not be reflected by original category names. The <amenity = restaurant; cuisine = mexican; building = retail> tags reveal more information about a POI than Yucatecan Restaurant.
4.2. Spatially explicit POI embedding
Word embedding is also known as the distributed representation of words. The word embedding training algorithms (e.g. Word2Vec) quantitatively capture the semantic meaning of a word by learning from the contextual words of the target word in a big corpus (Mikolov et al. Citation2013) and map each word in the corpus into a high-dimensional vector based on its contextual words. The training objective of Word2Vec model can be:
Based on this objective, the training process uses skip-gram mode and maximizes the conditional probability of word context c (the words before and after a word) given input word w. D is the set of all word and context pairs. The parameter θ that needs to be learned is a V × N weight matrix, i.e. a matrix with an N-dimensional vector representation for each word in the vocabulary with size V.
By modeling POI tags as words and the neighboring POI tags as the contextual words, the word embedding training algorithms can then map each POI tag into a high-dimensional vector that encodes both spatial contextual information and semantics of POIs, thus integrating the spatial and semantic dimension of POIs. Therefore, it is important to capture the spatial relationships among POI tags when building the POI corpus as input for embedding training algorithms.
4.2.1. Building spatially explicit POI tag corpus
Previous studies often adopted the nearest-neighbor approach to identify the contextual POIs (Yao et al. Citation2017) of a POI. The nearest-neighbor approach does not fully consider the road network hierarchy, which partitions the geographic space into organic spatial blocks that play an important role in shaping human activity and movement patterns. To capture the road network hierarchy information in the geographic context of a POI, we generated a hierarchical partition of space based on four different levels of the road network. The road network for each study region was downloaded from OSM and aggregated into four levels based on the hierarchy of road segments (). shows the number of polygons for three study regions after partitioning using different levels of road networks. After the hierarchical partition of space, POIs are spatially joined with partition results at four different levels. As a result, each POI is assigned four polygon IDs , one polygon ID at each level of partition.
is inside
that is contained by
, which is inside
.
Figure 3. Hierarchical space partition of three study regions.
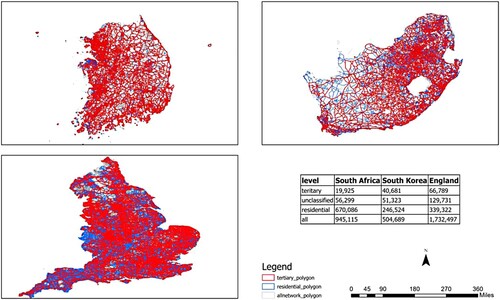
Table 2. Hierarchical space partition-based road network.
After translating different POI categories from different data sources into a unified semantic representation, i.e. OSM tags, the OSM tags associated with each POI are modeled as words. The POI tags are grouped hierarchically from lowest-level polygons to highest-level polygons. Level 4 aggregation, created by grouping POI tags with the same , groups all POI tags within the same street block and form a sentence of POI tags. Level 3 aggregation groups all the POI tag sentence with the same
and creates POI tag paragraph. Level 2 aggregation groups all the POI tag paragraph with the same
and creates POI tag document. After grouping all the POI tag documents with the same
, we created a POI tag corpus that captures both the semantics of POIs and the geographic contextual relationships among POIs.
4.2.2. Impact of geographic context on POI embedding
listed the top-5 most similar terms for 12 example geographic features based on the embedding learning results for 3 different geographic regions. These geographic features serve different functions in people’s daily lives, including food, education, healthcare, entertainment, transportation, and public services, etc. As we can see from , the spatially explicit POI embeddings capture both the unique semantics and spatial context of geographic features for the specific geographic region. In comparison with word embedding generated from regular text corpus such as Google News, the spatially explicit embedding results reflect the unique geospatial semantics of geographic features. For instance, the most semantically similar terms for mall are shopping mall and shopping plaza based on embeddings trained from google news corpus, whereas the spatially explicit embedding for mall has different semantics for different geographic regions and contains information about the different types of stores and merchandises that share the same geographic contexts with a mall.
Table 3. Spatially explicit POI embedding results for different geographic regions.
The semantic differences of the same feature type across different geographic regions reflect a certain extent the cultural and economic differences in different geographic regions. For example, the most similar term for grave-yard in South Korea is bongeunsa, which is a famous Buddhist temple in South Korea, whereas the most similar term for grave yard is church in South Africa and England. For playground, park and common are the most similar terms whereas common is not used in South Korea due to its language tradition. The semantic consistency of POI embedding results across different geographic regions varies a lot. For feature types like bar and casino, bar is similar to feature types such as pub, nightclub, and biergarten, and casino is similar to nightclub, cinema and bar across all three different geographic regions. On the other hand, the semantics of mall is quite different from each other in different geographic regions.
4.3. Generate AOI embedding from POI embedding
A geographic AOI is modeled as a document, and the POIs inside can be considered as words. Previous studies have demonstrated that document embeddings can be calculated from the weighted average of all word embeddings in the document (Yao et al. Citation2017). We use the TF-IDF score of each POI tag as the weight.
calculates the frequency of a POI tag p in a spatial block
,
takes the total number of spatial blocks and divides it by the number of spatial blocks that contain the POI tag
and calculates the logarithm. The TF-IDF score of each POI tag accounts for the frequency of a POI tag in an AOI and how common (uncommon) a POI tag is across the entire region. For common geographic features such as building, its TF-IDF score will normalize their weights in the AOI embedding calculation.
5. Land use classification modeling based on AOI embedding
5.1. Training sample preparation for land use classification
After mapping AOIs from geographic space into a high-dimensional semantic space and representing them as high-dimensional embeddings, we adopted a supervised classification approach to analyze the impact of different spatial and semantic granularities on the representativeness of the AOI embedding. AOIs with two different spatial granularities are created and labeled with two land use classification schemes with different semantic granularities. For each combination of spatial and semantic granularities, the high-dimensional AOI embeddings are calculated and used as input features X for the supervised classification model training. The classification model performance metric (e.g. f-score) of each land use class is used to gauge the impact of spatial scale and semantic granularity on the semantic representativeness of AOI embedding. The Random Forest algorithm was selected as the training algorithm for the supervised classification model due to its ability to handle overfitting and variable correlation in high-dimensional and non-linear classification (Louppe Citation2014).
For each study region, labeled land use polygon samples are collected from OSM as training data samples. A polygon is extracted from the OSM database if it has a landuse = * tag, e.g. <landuse = retail>. Polygons that are tagged with aeroway = * or public_transport = * are also included in the samples to add transportation land use samples. The crowd-sourced land use polygons are delineated and labeled by volunteers, and there are over 200 user-generated land use classes. However, many land use classes only occur once or twice in the database, and the vast majority of land use polygons are labeled by one of the top 30 land use class labels. Only land use class labels that are assigned to more than 5 polygon samples are included in the analysis, and they are grouped into 2 classification schemes, one with 3 classes and one with 13 classes (, ). listed the grouping of all the existing OSM land use classes in the training samples into 13 classes and listed the grouping of 13 classes into the 3-class classification scheme.
Table 4. Grouping of OSM land use classes (13 classes to 3 classes).
The three-class classification scheme includes residential, non-residential, and open space, which are general land use types (https://www.planning.org/lbcs/standards/) that are essential for human dynamics research such as population modeling. The 13-class classification scheme includes agricultural, cemetery, civic, commercial, industrial, military, natural, recreation, religious, residential, retail, transportation, and utility. The 13-class classification scheme also emphasizes on the human activity dimension of land use and different classes describe the type of activities inside an AOI. Two different classification schemes offer two levels of semantic granularity in land use classification, allowing us to compare the impact of semantic granularity on the AOI embedding.
Besides the semantic granularity of land use class labels of an AOI, the spatial granularity of an AOI and the number of POIs inside the AOI impact the semantic representativeness of the AOI embedding. The number of POIs inside an AOI determines how much information is captured by the AOI embedding. A parking lot alone cannot reveal the specific land use of an AOI if the parking lot is the only POI inside the AOI, but a parking lot along with other POIs such as restaurant, salon can be much more indicative of the land use characteristic of the AOI. Ideally, we would like an AOI to contain enough POIs to capture the unique land use characteristic but not all-encompassing such that the AOI loses its semantic coherence. In our experiment, we generated training land use polygon samples using two different spatial scales. One set of training samples uses the original user-generated boundary for all the labeled land use polygons. Another set of training samples was generated through constrained spatial aggregation, which aggregates the original polygons with the same land use class and are within 30 meters of each other. Before spatial aggregation, South Korea has 228,323 training samples, South Africa has 210,853 training samples and England has 2,355,539 training samples; after aggregation, South Korea has 113,934 training samples, South Africa has 97,688 training samples and England has 730,656 training samples.
In addition, POIs might not capture all the available land use characteristic information of an AOI. Non-POI geographic features such as roads inside an AOI also capture to a certain extent the land use characteristics of an AOI. We extended the proposed AOI representation learning framework to incorporate non-POI geographic features as input for AOI embedding training to examine the performance difference of AOI embedding with and without non-POI geographic features. In addition to POI data, road networks and non-POI buildings for the three study regions were extracted from the OSM database and transformed to point features by calculating the centroids of road segments and building polygons. The OSM tags associated with each individual road segment and building, e.g. <highway = footway>, were used as a semantic representation of the non-POI features. The non-POI features were directly combined with POIs after the spatial and semantic transformation and used as input for the AOI embedding training.
5.2. Land use classification model performance
We trained supervised classification models using eight different configurations (), including filtered sample vs. all sample, no agg vs. agg30, and poi vs. all feature. all sample uses all labeled training samples for model training, whereas filtered sample selects only training samples that have more than one geographic feature inside. no agg vs. agg30 indicates whether the labeled polygons have been spatially aggregated. no agg means the originally labeled polygons are used as training samples with no aggregation and agg30 means the labeled polygons have been spatially aggregated with 30 meters distance threshold. poi vs. all feature indicates whether the AOI embedding is trained only based on POI or the combination of POI and non-POI geographic features. The supervised classification model is trained using stratified 10-fold cross-validation to ensure the robustness of the performance score.
Table 5. F-score of three-class land use classification models.
5.2.1. Three-class land use classification modeling
listed the f-scores of the supervised classification models trained with eight configurations. F-score is the harmonic mean of recall and precision and can thus account for both precision and recall as a model performance metric. As we can see from , the {filtered sample, no agg, all feature} configuration has the best overall performance score for open space and residential land use across all three selected geographic regions. For non-residential land use, {filtered sample, no agg, poi} configuration has the best f-score. In other words, incorporating non-POI geographic features into AOI embedding does not help classify non-residential land use. The performance differences vary across different geographic regions, with England having the biggest performance difference after adding non-POI geographic features and South Korea having almost the same performance.
With respect to {all sample vs. filtered sample}, the classification model performance improves for residential and non-residential land use class after excluding training samples that contain only one geographic feature, whereas the performance of open space land use class has a slight decrease. This pattern holds true across all three geographic regions. The non-residential land use class in South Africa has the biggest performance increase after filtering training samples. Generally, increasing the number of geographic features inside an AOI can provide richer semantics and have better robustness in characterizing AOI land use. But the performance decrease for open space land use indicates that it is not only the existence of geographic features that characterize land use, sometimes the lack of geographic features can also reflect land use characteristics of an AOI.
When it comes to the impact of spatial granularity, i.e. {no agg vs. agg30}, the classification models trained on spatially aggregated training samples generally have worse performance for three land use classes across three geographic regions. Open space land use class has the biggest classification performance drop after spatial aggregation, whereas residential and non-residential land use classes see only a slight decrease in performance scores. The degradation of classification model performance after spatial aggregation demonstrates that the original boundary of land use samples contributed by the volunteer user community has better semantic coherence than the spatially aggregated boundary.
With respect to non-POI geographic features, i.e. {poi vs. all feature}, incorporating non-POI geographic features as additional input for AOI embedding training can improve the classification model performance for open space and residential land use classes, but actually, decrease the performance scores of non-residential land use class. This pattern holds true across all three different regions. Before adding non-POI geographic features, land use polygon samples with open space and residential class labels do not contain enough semantically salient geographic features that can capture their land use characteristics, and as a result have poor classification performance scores. After adding non-POI geographic features, the representativeness of training samples for open space and residential land use classes was augmented, particularly in South Africa. England and South Korea do not have as big performance change after incorporating non-POI geographic features. This could be because developed regions have more comprehensive and regular coverage of amenities and facilities such as bench and picnic tables in open space that is used for recreation. A three-class land use modeling result for the three geographic regions was generated using {filtered sample, no agg, all feature configuration} (Appendix 2).
These findings demonstrated the impact of geographic contexts in characterizing land use based on POI. For non-residential land use, POIs alone can provide a better characterization of the land use type of an AOI. This is because the majority of POIs are built for non-residential purposes. As a result, adding non-POI geographic features weaken the semantic coherence of AOI embedding. Generally, combining POIs and non-POI geographic features can increase the information captured by AOI embedding and help better characterize the land use characteristics of an AOI. Although non-POI features only have limited semantic attributes, the spatial layout of these geographic features that are learned by AOI embedding is an important part of the information.
5.2.2. 13-class land use classification modeling
To better understand the semantic representativeness of AOI embedding at a finer semantic granularity, we trained supervised classification models using a land use classification scheme that has 13 classes. Based on the results from three-class classification models, we selected the {filtered sample, no agg, all feature} configuration when training the 13-class classification models.
shows the precision and recall scores of 13 land use classes for the 3 selected geographic regions. For South Africa, agricultural, civic, and retail and utility are the land use classes that have the best performance. Religious, residential and transportation land use classes also have good performance scores, whereas commercial land use class has the lowest performance scores. From the confusion matrix for South Africa ((a)), we can see that the classification model most frequently misclassifies commercial land use to retail and industrial, and misclassifies agricultural with natural and residential, which is reasonable since farmyard is the mixture of farmland and residential land use.
Figure 4. Confusion matrix for 13-class classification models (a) South Africa (b) South Korea (c) England.
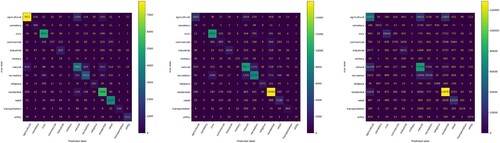
Table 6. Classification performance of land use classes of 13-class model.
For South Korea, the land use classes that have the best performances are civic, religious, residential and transportation. Industrial land use class has high classification precision scores. Cemetery land use class, which is often misclassified with natural and recreational land use classes, has the lowest performance scores. As shown in the confusion matrix for South Korea ((b)), recreation land use is most frequently misclassified as civic, and commercial land use is most frequently misclassified as residential in South Korea. This is an interesting revelation of the unique social-economic and demographic characteristics of the geographic region. Out of the three geographic regions, South Korea is the most mountainous and has the highest population density. There are lots of mixed residential/commercial land use.
For England, the land use classes that have the best performances are civic, natural, residential, and retail. Military and commercial land use classes have the lowest performance scores. Commercial land use is frequently misclassified as industrial, residential, and retail. Military land use class is most frequently misclassified as industrial and residential.
The similar classification accuracy of classification models trained for three different geographic regions demonstrated that AOI embedding can effectively capture the land use characteristics of an AOI. In comparison with the 3-class land use classification models, we found that some fine-grained land use classes in the 13-class schema (e.g. retail, civic) have about the same, if not better, classification performances, whereas some fine-grained land use classes (e.g. commercial) have worse performance scores. The three-class classification models generally have better classification performance. On the other hand, different geographic regions have different social-economic and cultural contexts. As a result, different land use classes have different performance scores in different geographic regions. The confusion matrix of classification models informed us about the semantic similarities among different land use classes in a geographic region and the mixed nature of certain land use classes, which in turn can facilitate the design of land use classification scheme that is most suitable for a geographic region.
6. Conclusion and future work
Land use characteristics of a geographic region are closely associated with socioeconomic activities inside. POIs, with their important roles in people’s daily activity routines, are crucial data sources that have been widely used to characterize land use in different geographic regions. With its open accessibility and wide availability across different geographic regions, POI data offer researchers an excellent opportunity to study the impact of spatial scale, semantic granularity, and geographic context on POI-based land use modeling. To our knowledge, this study is the first to examine these factors for large-scale POI-based land use modeling, which is critical for policy makers’ decision making, especially in regions that need rapid response and have limited official data. The results of this study provide a foundation for multi-scale POI-based land use modeling that is highly valuable for social scientists such as geographers, economists.
We developed an OSM-tag-based representation for the semantics of both POIs and non-POI geographic features. The flexibility and versatility of OSM tags simplified the data fusion process and augmented the semantics of geographic features, enhancing the effectiveness of neural network language modeling process. The AOI representation learning framework developed in this work, along with the flexible semantic representation of geographic features, made it easy to extend the framework and incorporate additional geographic features in the learning process to better characterize different land use types. We integrated road network hierarchy into the POI embedding training process by organizing POI tags based on road network hierarchy. The POI embedding results demonstrated that the high-dimensional semantic space encoded the geographic as well as semantic information of POIs. We trained different supervised land use classification models using training samples that have different spatial scales and semantic granularities. The comparison among classification models trained with eight different configurations demonstrated that the original land use boundary delineated by volunteers encloses a more semantically coherent land use than the aggregated boundary. In addition, combining non-POI geographic features with POIs can provide a more comprehensive characterization of the land use of AOI.
From the classification performance scores, we can observe that the same land use type in different geographic regions have different levels of semantic salience, and the social, cultural, demographic, and economic factors of different geographic regions shape the characteristic of different land use types. For all three geographic regions, residential land use is one of the most easily distinguishable land use types based on POIs. Agricultural, civic, religious, retail and transportation land use classes in South Africa, natural and transportation land use classes in South Korea, and civic and retail land use classes in England have the highest semantic salience. The differences reflected the interesting social-economic and development status differences among these geographic regions. Moreover, the classification performance of different land use classes of the 13-class classification model also revealed certain limits of POI-based AOI embedding in characterizing different land use classes in different geographic regions. The 13-class classification scheme is a top-down design, and it could be adjusted for different geographic regions.
POI-based land use modeling has shown great potential and could offer a cost-effective way to generate a large-scale land use map, but there are also limits in current research. In future work, we plan to address the following issues. First, most of the data used in this study are crowd-sourced, and the training samples for certain land use types could be limited in number. Augmenting the training data samples either manually or with auxiliary data sources could help improve the AOI representation learning framework to learn the characteristic vector of some land use classes with limited samples. Second, the temporal dynamics of POIs (e.g. opening hours) could provide valuable insights into the land use dynamics of an AOI. Incorporating temporal dynamics of POIs in the land use modeling process could be an exciting research direction.
Acknowledgements
This manuscript has been authored by UT-Battelle, LLC, under contract DE-AC0500OR22725 with the US Department of Energy (DOE). The US government retains and the publisher, by accepting the article for publication, acknowledges that the US government retains a nonexclusive, paid-up, irrevocable, worldwide license to publish or reproduce the published form of this manuscript, or allow others to do so, for US government purposes. DOE will provide public access to these results of federally sponsored research in accordance with the DOE Public Access Plan (http://energy.gov/downloads/doe-public-access-plan).
Disclosure statement
No potential conflict of interest was reported by the author(s).
Data availability statement
The data that support the findings of this study are available from PlanetSense project. Restrictions apply to the availability of these data, which were used under license for this study. Data are available from the authors with the permission of PlanetSense project (https://planetsense.ornl.gov/webps/). The OSM data used in this study can be openly accessed at https://www.openstreetmap.org/export.
References
- Andrade, R., A. Alves, and C. Bento. 2020. “POI Mining for Land Use Classification: A Case Study.” ISPRS International Journal of Geo-Information 9 (9): 493. doi:10.3390/ijgi9090493.
- Arsanjani, J. J., M. Helbich, M. Bakillah, J. Hagenauer, and A. Zipf. 2013. “Toward Mapping Land-Use Patterns from Volunteered Geographic Information.” International Journal of Geographical Information Science 27 (12): 2264–2278. doi:10.1080/13658816.2013.800871.
- Basiri, A., M. Haklay, G. Foody, and P. Mooney. 2019. “Crowdsourced Geospatial Data Quality: Challenges and Future Directions.” International Journal of Geographical Information Science 33 (8): 1588–1593. doi:10.1080/13658816.2019.1593422.
- Bengio, Y., A. Courville, and P. Vincent. 2013. “Representation Learning: A Review and New Perspectives.” IEEE Transactions on Pattern Analysis and Machine Intelligence 35 (8): 1798–1828. doi:10.1109/TPAMI.2013.50.
- Chehreghan, A., and R. Ali Abbaspour. 2018. “An Evaluation of Data Completeness of VGI Through Geometric Similarity Assessment.” International Journal of Image and Data Fusion 9 (4): 319–337. doi:10.1080/19479832.2018.1504825.
- Chen, S., H. Zhang, and H. Yang. 2021. “Urban Functional Zone Recognition Integrating Multisource Geographic Data.” Remote Sensing 13 (23): 4732. doi:10.3390/rs13234732.
- Dong, L., C. Ratti, and S. Zheng. 2019. “Predicting Neighborhoods’ Socioeconomic Attributes Using Restaurant Data.” Proceedings of the National Academy of Sciences of the United States of America 116 (31): 15447–15452. doi:10.1073/pnas.1903064116.
- Fan, J., and K. Stewart. 2021. “Understanding Collective Human Movement Dynamics During Large-Scale Events Using Big Geosocial Data Analytics.” Computers, Environment and Urban Systems 87: 101605. doi:10.1016/j.compenvurbsys.2021.101605.
- Frias-Martinez, V., and E. Frias-Martinez. 2014. “Spectral Clustering for Sensing Urban Land Use Using Twitter Activity.” Engineering Applications of Artificial Intelligence 35: 237–245. doi:10.1016/j.engappai.2014.06.019.
- Jiang, B. 2015. “Geospatial Analysis Requires a Different Way of Thinking: The Problem of Spatial Heterogeneity.” GeoJournal 80 (1): 1–13. doi:10.1007/s10708-014-9537-y.
- Jiang, S., A. Alves, F. Rodrigues, J. Ferreira, and F. C. Pereira. 2015. “Mining Point-of-Interest Data from Social Networks for Urban Land Use Classification and Disaggregation.” Computers, Environment and Urban Systems 53: 36–46. doi:10.1016/j.compenvurbsys.2014.12.001.
- Liu, X., J. He, Y. Yao, J. Zhang, H. Liang, H. Wang, and Y. Hong. 2017. “Classifying Urban Land Use by Integrating Remote Sensing and Social Media Data.” International Journal of Geographical Information Science 31 (8): 1675–1696. doi:10.1080/13658816.2017.1324976.
- Louppe, G. 2014. “Understanding Random Forests: From Theory to Practice.” http://arxiv.org/abs/1407.7502
- McKenzie, G., and K. Janowicz. 2017. “The Effect of Regional Variation and Resolution on Geosocial Thematic Signatures for Points of Interest.” In Lecture Notes in Geoinformation and Cartography, edited by A. Bregt, T. Sarjakoski, R. van Lammeren, and F. Rip, 237–256. Cham: Springer.
- Mikolov, T., I. Sutskever, K. Chen, G. Corrado, and J. Dean. 2013. “Distributed Representations of Words and Phrases and Their Compositionality.” In NIPS'13: Proceedings of the 26th International Conference on Neural Information Processing Systems - Volume 2, 3111–3119. Curran Associates.
- Palumbo, R., L. Thompson, and G. Thakur. 2019. “SONET: A Semantic Ontological Network Graph for Managing Points of Interest Data Heterogeneity.” In Proceedings of the 3rd ACM SIGSPATIAL International Workshop on Geospatial Humanities – GeoHumanities ‘19. New York: ACM Press.
- Pickett, S. T., and M. L. Cadenasso. 1995. “Landscape Ecology: Spatial Heterogeneity in Ecological Systems.” Science 269 (5222): 331–334. doi:10.1126/SCIENCE.269.5222.331.
- Qi, G., X. Li, S. Li, G. Pan, Z. Wang, and D. Zhang. 2011. “Measuring Social Functions of City Regions from Large-Scale Taxi Behaviors.” In 2011 IEEE International Conference on Pervasive Computing and Communications Workshops, PERCOM Workshops 2011, 384–388.
- Sanlang, S., S. Cao, M. Du, Y. Mo, Q. Chen, and W. He. 2021. “Integrating Aerial LiDAR and Very-High-Resolution Images for Urban Functional Zone Mapping.” Remote Sensing 13 (13): 2573. doi:10.3390/RS13132573.
- Smith, B., and D. M. Mark. 1998. “Ontology and Geographic Kinds.” In Proceedings. 8th International Symposium on Spatial Data Handling (SDH’98), 267–282.
- Thakur, G. S., B. L. Bhaduri, J. O. Piburn, K. M. Sims, R. N. Stewart, and M. L. Urban. 2015. “Planetsense: A Real-Time Streaming and Spatio-Temporal Analytics Platform for Gathering geo-Spatial Intelligence from Open Source Data.” In Proceedings of the 23rd SIGSPATIAL International Conference on Advances in Geographic Information Systems, SIGSPATIAL ‘15. New York: Association for Computing Machinery.
- Thakur, G., and J. Fan. 2021. “MapSpace: POI-Based Multi-Scale Global Land Use Modeling.” GIScience Conference 2021. http://energy.gov/downloads/doe-public-access-plan
- Toole, J. L., M. Ulm, M. C. Gonźalez, and D. Bauer. 2012. “Inferring Land Use from Mobile Phone Activity.” In Proceedings of the ACM SIGKDD international Conference on Knowledge Discovery and Data Mining, 1–8.
- Wu, H., A. Lin, K. C. Clarke, W. Shi, A. Cardenas-Tristan, and Z. Tu. 2021. “A Comprehensive Quality Assessment Framework for Linear Features from Volunteered Geographic Information.” International Journal of Geographical Information Science 35 (9): 1826–1847. doi:10.1080/13658816.2020.1832228.
- Yao, Y., X. Li, X. Liu, P. Liu, Z. Liang, J. Zhang, and K. Mai. 2017. “Sensing Spatial Distribution of Urban Land use by Integrating Points-of-Interest and Google Word2Vec Model.” International Journal of Geographical Information Science 31 (4): 825–848. doi:10.1080/13658816.2016.1244608.
- Yuan, J., Y. Zheng, and X. Xie. 2012. “Discovering Regions of Different Functions in a City Using Human Mobility and POIs.” In Proceedings of the 18th ACM SIGKDD International Conference on Knowledge Discovery and Data Mining – KDD ’12, 186. New York: ACM Press.
- Zhai, W., X. Bai, Y. Shi, Y. Han, Z. R. Peng, and C. Gu. 2019. “Beyond Word2vec: An Approach for Urban Functional Region Extraction and Identification by Combining Place2vec and POIs.” Computers, Environment and Urban Systems 74: 1–12. doi:10.1016/j.compenvurbsys.2018.11.008.
- Zhan, X., S. V. Ukkusuri, and F. Zhu. 2014. “Inferring Urban Land Use Using Large-Scale Social Media Check-in Data.” Networks and Spatial Economics 14 (3): 647–667. doi:10.1007/S11067-014-9264-4.
- Zhong, Y., Q. Zhu, and L. Zhang. 2015. “Scene Classification Based on the Multifeature Fusion Probabilistic Topic Model for High Spatial Resolution Remote Sensing Imagery.” IEEE Transactions on Geoscience and Remote Sensing 53 (11): 6207–6222. doi:10.1109/TGRS.2015.2435801.
Appendices
Appendix 1. Grouping of land use classes
Table A1. Grouping of OSM land use classes.
Appendix 2. Example land use modeling result