
 ?Mathematical formulae have been encoded as MathML and are displayed in this HTML version using MathJax in order to improve their display. Uncheck the box to turn MathJax off. This feature requires Javascript. Click on a formula to zoom.
ABSTRACT
To avoid crowd evacuation simulations depending on 2D environments and real data, we propose a framework for crowd evacuation modeling and simulation by applying deep reinforcement learning (DRL) and 3D physical environments (3DPEs). In 3DPEs, we construct simulation scenarios from the aspects of geometry, semantics and physics, which include the environment, the agents and their interactions, and provide training samples for DRL. In DRL, we design a double branch feature extraction combined actor and critic network as the DRL policy and value function and use a clipped surrogate objective with polynomial decay to update the policy. With a unified configuration, we conduct evacuation simulations. In scenarios with one exit, we reproduce and verify the bottleneck effect of congested crowds and explore the impact of exit width and agent characteristics (number, mass and height) on evacuation. In scenarios with two exits and a uniform (nonuniform) distribution of agents, we explore the impact of exit characteristics (width and relative position) and agent characteristics (height, initial location and distribution) on agent exit selection and evacuation. Overall, interactive 3DPEs and unified DRL enable agents to adapt to different evacuation scenarios to simulate crowd evacuation and explore the laws of crowd evacuation.
1. Introduction
The emergency evacuation of crowds usually does not cause a large number of casualties. However, sometimes deaths do occur, especially in scenarios with relatively small spaces and dense populations. Therefore, to study crowd evacuation behavior, researchers in various fields have used many methods (Haghani and Sarvi Citation2018), such as accident investigations (Fahy and Proulx Citation2005; Zhao et al. Citation2008; Brscic et al. Citation2013), animal experiments (Saloma et al. Citation2003; Zuriguel et al. Citation2016), real crowd experiments (Von Krüchten and Schadschneider Citation2017; Xie et al. Citation2020), and virtual crowd experiments (Kinateder, Comunale, and Warren Citation2018; Huang, Gong, and Li Citation2021). However, due to the lack of real data, the difficulties in experimental organization and the large costs, it is difficult for the above methods to reproduce the laws and phenomena that arise during the interaction between crowds and their environment (Zheng, Zhong, and Liu Citation2009). Thanks to the progress of computer technology, virtual geographic environments (VGEs), which are often used to explore geographical phenomena, processes and laws, have emerged and can be applied to environments of different scales, such as national, urban and indoor environments (Lin et al. Citation2013; Lin, Chen, and Lu Citation2013; Lü et al. Citation2018). Disaster management is an essential branch of VGEs’ research interest. Particularly efficient spatiotemporal modeling and visualization propel disaster management from structured measures to unstructured strategies, which promotes risk communication among various stakeholders and ensures the effectiveness of disaster decision-making processes (Yin et al. Citation2017; Macchione et al. Citation2019; Zhang et al. Citation2020; Li, Zhu, Fu, Zhu, Guo, et al. Citation2021; Li, Zhu, Fu, Zhu, Xie, et al. Citation2021). VGEs focus not only on macroscopic disasters (e.g. floods and debris flows) but also on microscopic phenomena (e.g. crowd evacuation). Conducting crowd simulations in VGEs is a practical method to address the above problems and to study the interaction between crowds and their environments. Therefore, crowd simulations, especially crowd evacuation models, are not only an important branch of crowd evacuation research, but are also the research hotspot and frontier for VGEs (or geographic information systems, GISs).
In terms of crowd evacuation models, microscopic models with individuals as the basic unit have received more attention than macroscopic models that can only model the overall behavior of crowds, because microscopic models can express crowd behavior by simulating the motions of individuals and the interactions between individuals. At present, traditional microscopic models can be roughly divided into three categories according to different basic approaches: (1) Rule-based models determine how individuals respond to changes in their environment according to simple or complex rules set in advance. The cellular automata model (CAM) is a typical representative of this kind of model (Varas et al. Citation2007). (2) Force-based models interpret the motion or behavior of individuals in the crowd by using forces or force-format effects. The social force model (SFM), in which dynamic equations are constructed by introducing attraction and repulsion, is a typical representative of such models (Helbing and Molnar Citation1995). (3) Velocity-based models aim to control the motion of individuals by using velocity (vector) and seek the relatively optimal forward velocity of individuals with the goal of avoiding collisions between individuals and between individuals and obstacles. The typical representative of this kind of model is optimal reciprocal collision avoidance (ORCA) (Berg et al. Citation2011).
With the rapid development of artificial intelligence (AI), AI-based models have emerged and flourished by using machine learning methods such as deep learning (DL) (Yuksel Citation2018; Yao et al. Citation2020; Zhao et al. Citation2020), inverse reinforcement learning (IRL) (Henry et al. Citation2010), and (deep) reinforcement learning (RL or DRL). Compared with other methods of AI, the interaction between the agent and environment in RL (DRL) is the most similar to that between humans and the environment. Therefore, RL (DRL) is generally considered to be the AI method closest to the human learning style and has attracted more attention from researchers. Torrey used a crowd simulation method based on multiagent reinforcement learning to simulate students’ behavior between classes and concluded that RL-based agents produce more unpredictable and diversified behavior than rule-based agents (Torrey Citation2010). Martinez-Gil proposed the multiagent reinforcement-learning-based pedestrian simulation framework (MARL-Ped), and the effectiveness of the framework was demonstrated by experiments (Martinez-Gil, Lozano, and Fernández Citation2014). Through additional experiments, Martinez-Gil further evaluated the robustness of the framework and its capability to generate emergent collective behavior after increasing the number of agents (Martinez-Gil, Lozano, and Fernández Citation2017). To improve the efficiency of crowd evacuation models, Wang combined the improved SFM with the improved multiagent reinforcement learning method (IMARL) (Wang et al. Citation2019). In IMARL, Wang used crowd trajectory data to address the RL dimension disaster problem and to improve the convergence speed. To address the problem of low evacuation efficiency caused by a large number of pedestrians and complex environments, Li proposed a hierarchical evacuation method combining the efficient multiagent deep deterministic policy gradient (E-MADDPG) algorithm and the relative velocity obstacle (RVO) algorithm (Li, Liu, et al. Citation2021). This method uses E-MADDPG to plan the optimal path and uses RVO to manage obstacle avoidance and evacuation of agents. Zhang developed a deep reinforcement learning algorithm combining particle dynamics environments and SFM to train agents to find the fastest evacuation path and demonstrated through experiments that the method can effectively handle the modeling of emergency evacuation in complex environments (Zhang, Chai, and Lykotrafitis Citation2021).
However, the above methods still have many drawbacks. Traditional microscopic models, which can be regarded as mathematical (or physical) models, must explain and model the evacuation behavior of crowds mechanistically. This makes them reliant on 2D environments (computing environments) for crowd evacuation simulations, which greatly limits the simulations of crowd behavior in real 3D environments. More seriously, because the whole simulation process takes place in the computing environment, models need to quantitatively express the impact of various factors on crowd evacuation based on data or experience. Therefore, the lack of data and experience seriously restricts the development of traditional microscopic models, and it is also difficult to judge whether existing data or experience is applicable to new evacuation scenarios (Low Citation2000). Because AI-based agents can adapt to different situations through learning, they can produce more unpredictable and diversified behaviors than traditional microscopic models. However, at present, AI technology still encounters difficulties when dealing with unknown or congested scenarios due to the limitation of computing power (Godoy et al. Citation2020). In 2D computing environments, the combination of AI technology, especially RL (DRL), with traditional microscopic models or observation data has become a widely used scheme in AI-based models. This makes it difficult for AI-based models to avoid the above drawbacks of traditional microscopic models, which greatly limits the ability of AI-based agents to reproduce crowd evacuation behavior through learning.
In this paper, we propose a framework for crowd evacuation modeling and simulation by applying deep reinforcement learning (DRL) and 3D physical environments (3DPEs), which includes two functional modules (DRL and 3DPEs) and two working modes (learning mode and simulation mode). In 3DPEs, we build crowd evacuation simulation scenarios from the three aspects of geometry, semantics and physics. These simulation scenarios not only can provide training samples for DRL but are also closer to the scenarios of real crowd evacuations (especially the scenarios of real crowd experiment). This approach overcomes the drawback in which crowd evacuation simulations rely on 2D computing environments. In DRL, we design a double branch feature extraction combined actor and critic network (DFECAC-net) as the DRL policy and value function and use a clipped surrogate objective with polynomial decay to control the policy update. The powerful learning ability of DRL enables agents to adapt to different evacuation scenarios, which effectively alleviates the dependence of crowd evacuation simulations on real data or known experience. Moreover, under the unified configuration of networks and parameters, we conduct a series of crowd evacuation simulations to explore the impact of various factors on crowd evacuation and demonstrate that our method can be used for crowd evacuation research. The remainder of this paper is organized as follows: Section 2 introduces our models and methods in detail; Section 3 presents crowd evacuation simulations and the analysis and discussion of the simulation results; and Section 4 presents the conclusions of this study.
2. Models and methods
2.1. Framework
shows our framework for crowd evacuation modeling and simulation, that is mainly composed of 3D physical environments (3DPEs) and deep reinforcement learning (DRL). In our framework, 3DPEs are responsible for generating, controlling and managing unified three-dimensional virtual evacuation scenarios. These include the basic RL (DRL) components, such as the environment, the agent and the interactions between them, and can provide DRL with the required training samples (transitions). By using these samples from 3DPEs for training (learning), DRL can generate or update the corresponding crowd evacuation model (policy), which is used to control the evacuation behavior of agents in 3DPEs.
Figure 1. Framework for crowd evacuation modeling and simulation by using deep reinforcement learning and 3D physical environments.
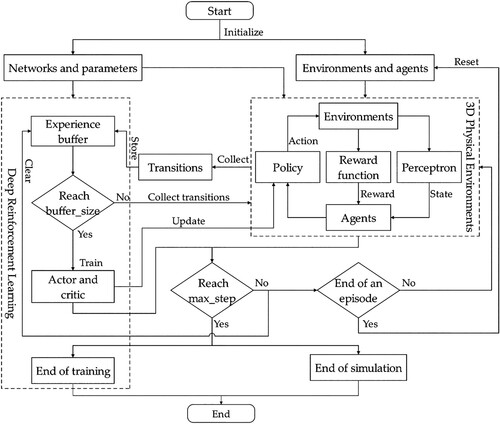
Our framework has two working modes: learning mode and simulation mode. In the learning mode, 3DPEs and DRL are parallel, that is, the generation of samples (transitions) in 3DPEs is synchronized with the update of the model (policy) in DRL to generate or update the corresponding crowd evacuation model (policy). In the simulation mode, DRL does not need to generate or update the model (policy), and 3DPEs conduct crowd evacuation simulations by only using the model (policy) trained in the learning mode.
2.2. 3D physical environments (3DPEs)
In this paper, we build crowd evacuation scenarios based on 3DPEs that include three basic DRL components: environment, agent and interactions. In these scenarios, learners or decision-makers participating in crowd evacuation modeling or simulation are collectively called agents. In terms of an agent, all objects (including other agents) that can interact with it are collectively called the environment. There are three main types of interactions between agents and the environment: state, reward and action.
2.2.1. Environment and agent
Previous microscopic models have generally used a highly abstract method to model crowd evacuation scenarios, that is, 2D particle dynamics environments composed of points, lines and surfaces are used to represent these scenarios. Different from the above method, as shown in , we construct the crowd evacuation scenarios from three aspects: geometric environment, semantic environment and physical environment, which are closer to the scenarios of real crowd evacuations (especially the scenarios of real crowd experiments).
Figure 2. Modeling of crowd evacuation scenarios.
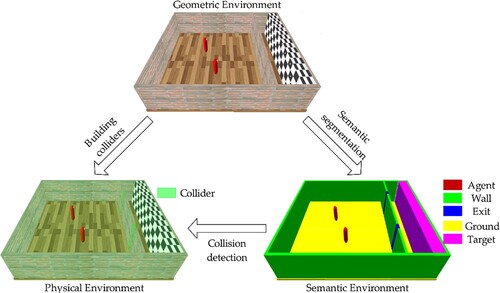
In our method, the geometric environment, which is composed of a large number of triangular surfaces or polyhedrons with different materials, is an intuitive representation of crowd evacuation scenarios. It not only visually represents the structure and appearance of evacuation scenarios but also provides the corresponding basic information for the construction of the semantic environment and physical environment of these scenarios. According to the requirements of crowd evacuation simulations, we need to build a geometric environment with appropriate precision to reduce the difficulty of building semantic and physical environments.
The semantic information of the environment plays an extremely important role in the process of humans perceiving the external environment. Similar to human perception, the semantic information of the environment in 3DPEs can help agents obtain a more enriched and accurate environmental state. Therefore, according to the type of objects, we perform semantic segmentation on the geometric environment of crowd evacuation scenarios, that is, we give each object a corresponding type label to construct the semantic environment of these scenarios. In 3DPEs, the semantic environment not only can help agents perceive the external environment but can also help judge whether certain types of collisions can occur in the physical environment and trigger some specific events or feedback related to collisions. The size of the semantic space in the semantic environment needs to be determined according to the specific situation. If the size of the semantic space is too large, the environmental state perceived by agents may be too complex, and if the size is too small, agents may not obtain enough useful information. In this paper, the semantic space of the crowd evacuation scenarios is .
The physical environment is the basis of the interactions between agents and their environment, and it can also directly affect the evacuation behavior of agents. Therefore, we set up a collider with the same spatial characteristics (including location, size and shape) for each object in the geometric environment to build the physical environment of crowd evacuation scenarios. In addition to conventional gravity and friction, to simulate the interactions between evacuees and their environment, we design three types of collisions in the physical environment: those between agents, those between agents and other objects, and those between perceptual rays and objects (including agents). Agents can collide with each other, and in the process of collision, agents with large mass can more easily move agents with low mass. According to the semantic information, agents can collide (or not collide) with other objects (static objects) in the environment which can hinder (or not hinder) the motion of the agents. For example, the agents cannot pass through walls but can pass through exits. The agents can also obtain external environment information, such as the classes of objects and the distances between the agent and objects, through collision detection of perceptual rays. In addition, the triggering of specific events or feedback related to collisions in the simulation process also depends on the physical environment. For example, agents reaching the target constitutes a specific event.
In terms of agents, we also model them from three aspects: geometry, semantics and physics. In this paper, the agent is regarded as a capsule with direction, which can be abstractly expressed as . Here,
,
,
,
and
represent the position, radius, direction, height and mass of the agent, respectively. According to the typical size of the human body (Wang et al. Citation2019; Li, Liu, et al. Citation2021; Zhang et al. Citation2022), we set
,
and
to
,
and
, respectively; we set the eyes of the agent at a height of
, and the direction of the eyes is the positive direction of the agent. We also give the type label of ‘agent’ to agents and set the collider with the same spatial characteristics (including position, size, shape) for agents to interact with the environment.
2.2.2. Interactions
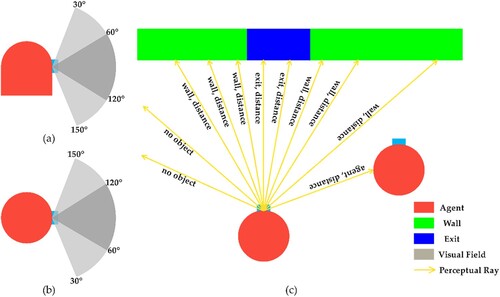
In crowd evacuation simulations, agents must use a certain perceptron to observe the environment and obtain the environmental state . In this paper, we use a vision-like ray perceptron (VLRP) (Zhang et al. Citation2022), which is similar to the way that humans perceive the environment through vision. As shown in (a) and (b), in the VLRP, the perceptual rays are only distributed within the vertical and horizontal fields of agents’ vision (
), and more perceptual rays are distributed within the sensitive field of agents’ vision (
). We can set the number of perceptual rays in the vertical and horizontal directions according to the complexity of the environment. In this paper, the VLRP includes a total of twenty-seven perceptual rays, with angles of
,
and
in the vertical direction and
,
,
,
,
,
,
,
and
in the horizontal direction. As shown in (c), by using perceptual rays, agents obtain two types of information: the classes of objects and the distances between the agent and objects, which are encoded into a three-dimensional matrix to represent the external state
. In the matrix, the vertical and horizontal dimensions represent the relative position of the perceptual ray in the vertical and horizontal directions, and the channel dimension represents the type of environment information. We also encode the position, direction, speed and relevant known environment information of the agent into a one-dimensional vector to represent the internal state
. Therefore,
is the state acquired by the agent at time
.
Figure 3. Modeling of agents’ perceptron. (a) Vertical field of the agents’ vision; (b) horizontal field of the agents’ vision; (c) schematic diagram of the vision-like ray perceptron. Only perceptual rays in the horizontal plane are shown.
In this paper, to shorten the training time and accelerate the convergence, we use a discrete action , that is, the behavior taken by the agent at time
. Here,
is the rotation angle of the agent at time
, its action space is
, and the rotation speed is
.
is the forward velocity of the agent at time
, and its discrete interval and value range are
and
(unit:
), respectively.
In DRL, reward is usually used to evaluate the behavior decisions of the agents. In this paper,
is the reward obtained by the agent in each time step. To avoid sparse rewards, agents obtain a time reward
(
) at each time step, which also urges agents to constantly select an action in the scenario. When an agent reaches the target, that is, the agent collides with the target, the agent obtains a target reward
(
) to enable the agent to learn to move toward the target. At the same time, the agent is also temporarily removed from the scenario to prevent it from interfering with other agents that have not reached the target. In this paper, we use a simple and unified reward configuration for different crowd evacuation scenarios; that is,
and
are
and
, respectively, to show the strong learning ability and adaptability of our method.
Based on the above modeling of the environment, agent and interactions, we can build crowd evacuation scenarios in 3DPEs to enable the modeling or simulating of crowd evacuation behaviors and to provide corresponding training samples for DRL, that is, transition . In the 3DPEs, the specific steps of agent simulation (or learning) are as follows:
Step 1: Initialize the environment, agents and related parameters;
Step 2: Agents perceive the environment to obtain the state ;
Step 3: Agents select a certain action according to the state
;
Step 4: The environment changes so that the agents can obtain a new state and receive a certain reward
;
Step 5: If an episode is completed, that is, all agents have completed evacuation, the environment and agents are reset;
Step 6: Repeat Steps 2 to 5 until the maximum step () is reached.
2.3. Deep reinforcement learning (DRL)
The deep reinforcement learning (DRL) algorithm is the core algorithm of our framework for crowd evacuation modeling and simulation, and it directly determines the evacuation behavior of agents. Compared with other DRL algorithms, the proximal policy optimization (PPO) algorithm has better sample complexity and is easy to implement and adjust. Therefore, we take PPO as the basic algorithm of DRL in our framework. In this paper, PPO based on policy and value has two kinds of neural networks: two actors and one critic. The actor acts as policy to select action
, while the critic acts as value function
to evaluate action
selected by policy
. The inputs of the actor and the critic are both the state
, and their parameters are
and
. As shown in , we use transitions
from 3DPEs to iteratively update the actor (policy) and critic (value function).
Figure 4. Training-learning mode of PPO.
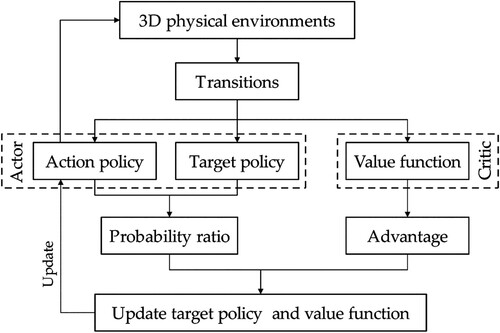
In PPO, to control the update of the actor (policy) in the gradient direction, we use the critic (value function) to estimate the advantage . It can measure the degree of advantages and disadvantages of selecting a specific action
under a certain state
, and the larger its value is, the greater the return is that can be obtained when action
is selected. The generalized advantage estimator (GAE) (Schulman et al. Citation2015) is a highly applicable method to estimate the advantage
. Applying GAE to the policy gradient method can effectively reduce the variance of the gradient estimation, thus reducing the number of samples required for training. In this paper, we use a truncated version of GAE to estimate advantage
(Equation 1) (Schulman et al. Citation2017):
(1)
(1) Here,
and
are hyperparameters.
is a discount factor for future rewards.
is a parameter of GAE.
is the temporal difference error (TD error), as shown in Equation (2):
(2)
(2) In this paper, we set up two actors with exactly the same network structure to act as action policy
and target policy
with parameters
and
, respectively. The action policy
is the policy for an agent to take a specific action
according to the state
in 3DPEs, which implements the mapping between the state
and the action
and is used to generate transitions. The target policy
is the policy that needs to be optimized and updated in DRL, which does not participate in the behavior decisions of agents in 3DPEs and is not used to generate transitions. In RL (DRL), transitions are extremely important and valuable because they are the basis for agents to learn a better policy. To address the problem that the policy gradient method cannot reuse transitions, PPO uses the method of importance sampling when updating the actor (policy), which achieves the transformation of RL (DRL) from on-policy to off-policy. The improvement objective function of the actor (policy) is shown in Equation (3):
(3)
(3) Here,
is the advantage based on the critic (value function) and the GAE;
represents the probability ratio of target policy
and action policy
to select a specific action
under the same state
, as shown in Equation (4):
(4)
(4)
PPO uses transitions generated by action policy to iteratively update target policy
. When target policy
has completed one round of iterative updates, action policy
can be updated by assigning
to
. Then, agents in 3DPEs use the updated action policy
to generate new transitions for the next round of iterative updates. To ensure the stability of the update process, we must restrict the probability ratio
(Equation 4) to prevent the difference between the target policy
and the action policy
from being too large, which is also the premise of using the importance sampling method. According to different restriction methods, there are two main variants of PPO, and the objective functions of their actors are
and
, as shown in Equations (5) (Heess et al. Citation2017) and (6) (Schulman et al. Citation2017):
(5)
(5)
(6)
(6) Compared with
(Equation 5), which increases the adaptive KL penalty coefficient, the clipped surrogate objective
(Equation 6) is simpler and more intuitive, but it produces a better training effect. Therefore, we take
as the objective function of the actor (policy). Here,
is a hyperparameter used to limit the probability ratio
within the range of
, and the larger
is, the larger the update range of the target policy
is that is allowed. In PPO, agents find the optimal policy by learning transitions. In the early stage of training, the gap between the actors (both target policy and action policy) and the optimal policy is large, so PPO needs to be explored more fully, that is, a larger
is needed. As the training continues, the actors become increasingly closer to the optimal policy, so PPO needs to use a smaller
to ensure stable updating of the actors. Therefore, in the training process, we use polynomial decay to assign ϵ, as shown in Equation (7):
(7)
(7) Here,
and
represent the maximum and minimum values of ϵ,
and
represent the current and maximum (
) steps of training, and
is the power of the polynomial.
In DRL, a deep neural network (DNN) with powerful feature extraction and decision ability is often used as the approximation function of the actor (policy) and the critic (value function) to address the problem that RL has difficulty dealing with complex environments (the very large space of the state and action). Since the inputs of the actor and critic are both state , we design a double branch feature extraction combined actor and critic network (DFECAC-net) to approximate the optimal policy
and value function
, where the parameters
and
share partial weights, as shown in :
Figure 5. Double branch feature extraction combined actor and critic network.
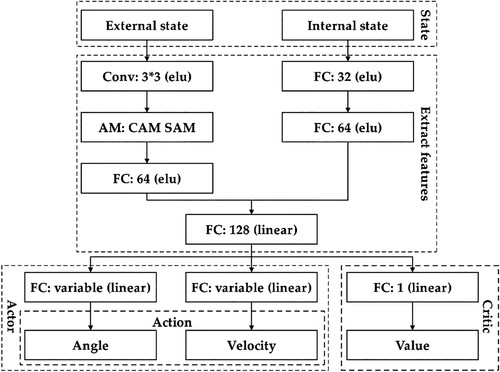
In DFECAC-net, the state as input is composed of two parts: the external state
of the environment and the internal state
of the agent. The state
first passes through a double branch feature extraction network to extract all key features and to aggregate them into a feature vector. In this network, according to the type of state, the external state
and the internal state
pass through separate branches. One branch consists of a convolutional layer (Conv), an attention mechanism (AM, including a channel attention mechanism (CAM) and a spatial attention mechanism (SAM)) (Woo et al. Citation2018; Zhang et al. Citation2022) and a fully connected layer (FC). The other branch consists of only two FCs. Then, this feature vector passes through the critic network and actor network to obtain the value and the action
(including the rotation angle
and the forward velocity
), respectively. Here, the critic network contains only one FC. The actor network consists of two branches, each of which contains only one FC, to generate the rotation angle
and the forward velocity
.
In PPO, since we use a neural network structure (DFECAC-net) that shares parameters between the policy and value function, it is necessary to use a loss function that combines the policy surrogate and a value function error term. We use a loss function as shown in EquationEquation (8(8)
(8) )(Schulman et al. Citation2017):
(8)
(8) Here,
and
are coefficients,
is the objective function of the actor (Equation 6),
is a squared-error loss
, and
represents an entropy bonus to ensure more full exploration by PPO. We use the
optimizer to maximize this loss function (Equation 8). To make full use of the obtained transitions, all transitions in the experience buffer are used
times during each update. In the crowd evacuation simulations, the specific settings of each parameter are shown in , and the specific steps of training-learning in DRL are as follows:
Step 1: Initialize the networks and parameters;
Step 2: Obtain transitions from 3DPEs and save them to the experience buffer;
Step 3: If the number of transitions reaches the maximum capacity of the experience buffer (), go to step 4. Otherwise, repeat step 2;
Step 4: Train the actor and critic (DFECAC-net), that is, update the weight of the network (DFECAC-net);
Step 5: If the maximum step () is reached, the training (learning) process in DRL is over. Otherwise, clear the experience buffer and repeat steps 2 to 5.
Table 1. Configuration of parameters.
3. Experiments and discussion
In this section, we conduct a series of crowd evacuation simulations in different scenarios to explore the impact of various factors on crowd evacuation. Our evacuation simulation scenarios follow the above models and methods (Section 2) and are built by using the Unity 3D engine (Juliani et al. Citation2018). To verify the effectiveness, strong learning ability and adaptability of our method, we use a simple and unified reward setting in all simulations, that is, and
are set to
and
, and the same network structure () and parameter settings () are also used.
3.1. Simulations in the scenarios with one exit (S1E)
As one of the common scenarios of real crowds, the scenario with one exit (S1E) frequently exists in public places, such as markets, schools and stations. The S1E is not only a typical case for which to study the evacuation behavior of congested crowds but also a common scenario for which to evaluate the effectiveness of a crowd evacuation model. Therefore, referring to the real crowd experiment (Adrian et al. Citation2018), we build the S1E with a size of and conduct crowd evacuation simulations to verify the effectiveness of our method in simulating the evacuation behavior of congested crowds.
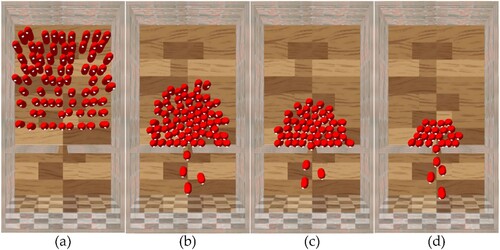
shows our simulation results of crowd evacuation in S1E. During evacuation, seventy-five agents with uniform distribution and random directions actively adjust their directions and move toward the exit ((a)). The narrow exit () makes it impossible for all agents arriving at the exit to pass through the exit at the same time, thus leading to most agents gathering at the exit ((b)). As a whole, the agents gathering at the exit always present an arch shape ((c) and (d)) until the end of the simulation, that is, until all agents pass through the exit. The simulation results are consistent with the bottleneck effect of congested crowds, which is a typical crowd self-organization phenomenon.
Figure 6. Simulation in the scenario with one exit. (a-d) stills of the simulation results. The temporal sequence of these stills is labeled alphabetically.
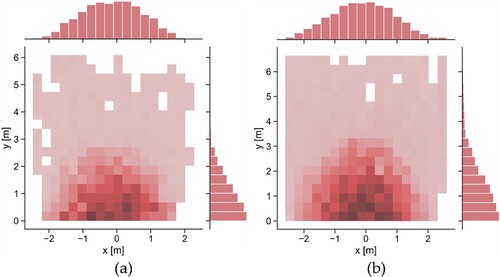
To verify the effectiveness of the above simulation results, we analyze the motion laws of evacuees (agents) by using the density map. As a basic method to describe the characteristics of pedestrian flow, a density map visually shows the occupation of physical space by evacuees (agents) and further reveals the motion patterns of evacuees (agents) (Martinez-Gil, Lozano, and Fernández Citation2014). In S1E, the density maps generated by the real crowd experiment and our simulation are shown in (a) and (b). In density maps, the densities near the exit are considerably higher than those in other places, which indicates that evacuees or agents have obvious congestion at the exit. Moreover, with the exit as the center, the densities on the x-axis are higher in the middle and lower at both ends and gradually decrease along the positive direction of the y-axis. The distribution pattern of the densities basically conforms to the geometric characteristics of the arch, which verifies the arch congestion phenomenon of evacuees or agents at the exit. The density map generated by our simulation ((b)) is highly similar to that generated by the real crowd experiment ((a)), which also shows the effectiveness of our method in simulating the bottleneck effect of congested crowds.
Figure 7. Density maps of crowd evacuations. (a) Density map generated by the real crowd experiment; (b) density map generated by our simulation.
As an important method to test whether a crowd evacuation model is suitable for describing pedestrian flow, the fundamental diagram can show the relationship between the density and velocity of pedestrians (Seyfried et al. Citation2005). Therefore, we use the fundamental map to analyze the relationship between the density and velocity of evacuees (agents) in the area near the exit. In S1E, the fundamental diagrams generated by the real crowd experiment and our simulation are shown in (a) and (b). In the fundamental diagrams, the higher the density is, the lower the velocity will be, that is, the density and velocity are negatively correlated as a whole. Moreover, with increasing density, the decrease in velocity gradually becomes slower. These results are consistent with the basic characteristics of congested crowd evacuation (Seyfried et al. Citation2010).
Figure 8. Fundamental diagrams of crowd evacuations. (a) fundamental diagram generated by the real crowd experiment; (b) fundamental diagram generated by our simulation.
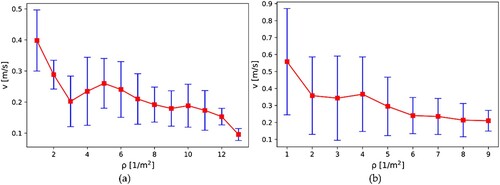
There are some differences between the fundamental diagrams. On the one hand, in the case of high congestion, the presence of colliders makes it impossible for agents to squeeze each other, while evacuees can, so that the maximum density in (b) is lower than that in (a). On the other hand, the velocity in (b) is slightly larger than that in (a) under the same density. The mean and standard deviation of the velocity difference between the fundamental diagrams are and
(unit:
), which indicates that the agents in our simulation are slightly faster than the evacuees in the real crowd experiment. The level of evacuation sense of urgency in agents or evacuees may be the main reason for this phenomenon. Due to factors such as personnel safety and the environmental atmosphere, it is difficult for real crowd experiments to reproduce the dynamics of crowd evacuation in emergency situations, and evacuees’ sense of urgency for evacuation is generally low. However, in our simulation, the presence of time reward
gives agents higher motivations to evacuate.
3.2. Impact of various factors on crowd evacuation in S1Es
Based on the above simulation of the bottleneck effect, we conduct further crowd evacuation simulations in S1Es to explore the impact of various factors on crowd evacuation. On the premise that only the exit width is changed, we set the exit width in S1E as ,
and
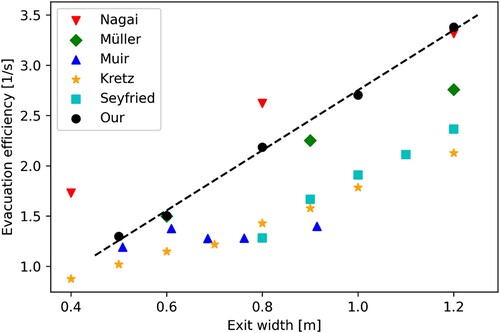
and conduct crowd evacuation simulations. As shown in (a), when the number of agents (seventy-five agents) is the same, the wider the exit width is, the shorter the time needed for all agents to complete evacuation. In the evacuation process, the slopes of the three curves (red, green and blue) are basically unchanged, which indicates that the evacuation efficiency (the number of evacuated agents per unit time) of exits with different widths remains stable. shows the evacuation efficiency of exits with different widths in real crowd experiments (Müller Citation1981; Muir, Bottomley, and Marrison Citation1996; Kretz, Grünebohm, and Schreckenberg Citation2006; Nagai, Fukamachi, and Nagatani Citation2006; Seyfried et al. Citation2010) and in our simulation. In different real crowd experiments, the evacuation efficiency basically increases linearly with increasing exit width, but due to various factors, the evacuation efficiency of exits with the same width is also quite different (Seyfried et al. Citation2010). In our simulation, the evacuation efficiency also basically increases linearly with increasing exit width. Compared with real crowd experiments, the evacuation efficiency of exits with different widths in our simulation is relatively high, but still within a reasonable range. The evacuation sense of urgency in the agents (in our simulation) or in the evacuees (in real crowd experiments) may also be the main reason for this phenomenon.
Figure 9. Impact of various factors on crowd evacuation in S1Es. (a) width of exit; (b) number of agents; (c) mass of agents; (d) height of agents. (a-b) represent the relationship between the number of evacuated agents and the evacuation time.
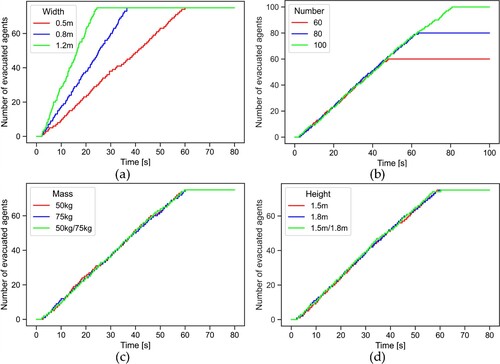
Figure 10. Relationship between evacuation efficiency and exit width.
On the premise of only changing the number of agents, we also conduct separate crowd evacuation simulations with sixty, eighty and one hundred agents. As shown in (b), with the same exit width (), the greater the number of agents is, the more time it takes for all agents to complete evacuation. Moreover, in the evacuation process, the same exit width causes the slopes of the three curves (red, green and blue) to basically remain stable and equal, that is, the evacuation efficiency of exits with the same width is basically equal under the condition of different numbers of agents. The exit width is the key factor affecting the exit evacuation efficiency, while the number of agents (evacuees) does not affect the exit evacuation efficiency. It should be noted that a precondition for these conclusions is that the change in exit width or the number of agents (evacuees) does not cause a change in the sense of urgency (or panic level) among the agents (evacuees); thus, we use a unified reward configuration in this paper.
In addition to environmental factors such as the width of the exit and the number of agents, we also explore the impact of heterogeneous crowds on crowd evacuation in S1E. On the premise of only changing the mass of agents, we conduct crowd evacuation simulations with the mass of agents set as ,
and
(half of the agents are
and the other half are
) to explore the impact of individual mass on crowd evacuation. As shown in (c), when only the mass of the agents is changed, the three curves (red, green and blue) basically coincide, that is, the time required for all agents to complete evacuation is basically equal, and the evacuation efficiency basically remains stable and equal. These results indicate that the change in individual mass does not affect the overall evacuation of the agents (including evacuation time and evacuation efficiency), which is consistent with the findings of previous studies (Zhang, Chai, and Lykotrafitis Citation2021). The height of the individual determines the height of the individual visual field, which directly affects the individual's observation of the environment. Therefore, under the condition of only changing the height of the agents, we conduct crowd evacuation simulations with the height of agents set as
,
and
(half of the agents are
and the other half are
) to explore the impact of individual height on crowd evacuation, which is difficult to achieve in crowd evacuation simulations based on 2D environments. As shown in (d), when only the height of agents is changed, the three curves (red, green and blue) also basically coincide, that is, the evacuation time and evacuation efficiency are basically stable and equal. These results indicate that the change in individual height has no impact on the overall evacuation of agents (including evacuation time and evacuation efficiency).
3.3. Simulations in scenarios with two exits and a uniform distribution of agents (S2E)
In crowd evacuation, there may be more than one exit in the evacuation scenarios, and evacuees will need to choose between two or more exits. The scenario with two exits (S2E) is also one of the common scenarios of real crowds that also frequently exists in public places such as schools and markets. Therefore, we build an S2E (S2E:L0.5-R0.5) with a size of in which both of the exits are
, and we conduct crowd evacuation simulations to explore the factors affecting the selection of crowd evacuation exits.
Similar to the simulation results in S1E (), in S2E:L0.5-R0.5, one hundred agents with a uniform initial distribution and random directions move toward the exits, and the blocked agents show arch congestion at the exits ((a)), that is, the bottleneck effect of congested crowds appears. Moreover, the size of the arches formed near the two exits is intuitively the same, which indicates that the congestion of agents at the two exits is basically similar. In the density map ( (a)), the similar arch distribution of the density near the two exits also verifies the effectiveness of the above conclusions. In addition, we further analyze the evacuation exit selection of agents in S2E:L0.5-R0.5. As shown in , when the widths of the two exits () are equal, the number of agents choosing the left exit and the right exit accounts for
and
, respectively, with a difference of
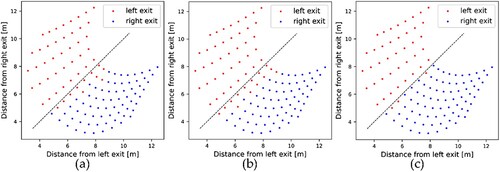
, which indicates that two exits with the same width have basically the same attraction to the agents (evacuees). Moreover, as shown in (a), when the width of the two exits is equal, agents generally choose the exit that is closer to their initial position, which is consistent with the principle of nearby evacuation (Liao et al. Citation2014).
Figure 11. Simulations in the scenarios with two exits and a uniform distribution of agents. (a–c) Stills of the simulation results in different S2Es. (a) S2E:L0.5-R0.5; (b) S2E:L0.8-R0.5; (c) S2E:L0.5-R0.8.
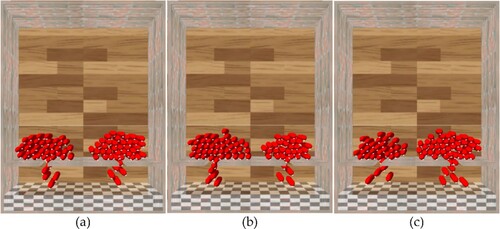
Figure 12. Density maps of simulation results in different S2Es. (a) S2E:L0.5-R0.5; (b) S2E:L0.8-R0.5; (c) S2E:L0.5-R0.8.
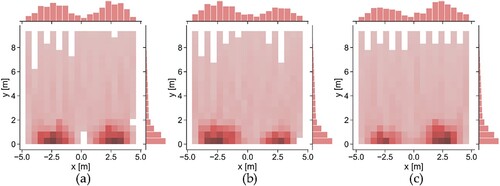
Figure 13. Relationship between the initial position and evacuation exit in different S2Es. (a) S2E:L0.5-R0.5; (b) S2E:L0.8-R0.5; (c) S2E:L0.5-R0.8. (a–c) The black dotted lines indicate that the distances to the left and right exits are equal.
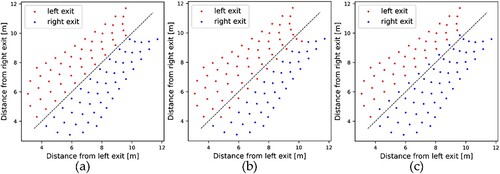
Table 2. Evacuation statistics of two exits in S2Es.
Due to various factors, the width of each exit in public places is not necessarily equal. Since the width of the exit can affect the evacuation efficiency of the crowd, we only adjust the exit width of S2E:L0.5-R0.5 to construct two S2Es with different exit widths: S2E:L0.8-R0.5 and S2E:L0.5-R0.8. In S2E:L0.8-R0.5, the widths of the left exit and right exit are and
, respectively; in S2E:L0.5-R0.8, the widths of the left exit and right exit are
and
, respectively. We use exactly the same methods and configurations as the simulation in S2E:L0.5-R0.5 and conduct crowd evacuation simulations in S2E:L0.8-R0.5 and S2E:L0.5-R0.8 to explore the impact of exit width on the selection of crowd evacuation exits.
As shown in (b), in S2E:L0.8-R0.5, the arch congestion phenomenon of agents also appears at the left and right exits. However, in contrast to the simulation result in S2E:L0.5-R0.5 ((a)), in S2E:L0.8-R0.5, the size of the arch that forms near the left exit (with a larger width) is substantially larger than that near the right exit (with a smaller width). In the density map ((b)), the arch density distributions near the two exits are significantly different, that is, the densities near the left exit are significantly greater than those near the right exit, which effectively verifies the above conclusions. As shown in , in S2E:L0.8-R0.5, more agents choose the left exit () than the right exit (
), and the difference is relatively large (
). The width of the exit determines its evacuation efficiency, that is, the wider the exit is, the higher the evacuation efficiency is, so agents (evacuees) tend to choose the wider exit, which is consistent with previous research (Bode, Kemloh Wagoum, and Codling Citation2015). In terms of the initial position of agents, compared with S2E:L0.5-R0.5 ((a)), in S2E:L0.8-R0.5 ((b)), the left exit (with a larger width) prompts the agents that are relatively close to it to change the choice of evacuation exit. Visual occlusion and motion obstruction between agents may be the main reasons for this phenomenon. Compared with the agents that are relatively close to the left exit (with a larger width), the agents that are relatively far away from the left exit have more serious visual occlusion and motion obstruction when selecting the left exit, so the exit width hardly affects their selection of evacuation exits.
In S2E:L0.5-R0.8 ((c) and (c)), the arch congestion phenomenon of agents at the two exits is similar to that in S2E:L0.8-R0.5 ((b) and (b)), that is, the size of the arch formed near the wider exit (right exit) is substantially larger than that formed near the narrower exit (left exit). As shown in , compared with the difference () in S2E:L0.5-R0.5, the variations in S2E:L0.8-R0.5 and S2E:L0.5-R0.8 are very close, at
and
, respectively. Moreover, as shown in , in S2E:L0.8-R0.5 ((b)) and S2E:L0.5-R0.8 ((c)), the wider exits only prompt the agents that were relatively close to them to change their evacuation exits, and the initial distributions of these agents are also very similar. Overall, compared with the simulation in S2E:L0.5-R0.5, the changes in exit width in S2E:L0.8-R0.5 and S2E:L0.5-R0.8 have basically the same impact on the selection of agent evacuation exits, that is, under the condition of a symmetrical distribution of exits, the relative positions of exits with different widths do not affect the tendency of agents (evacuees) to choose the wider exit.
3.4. Simulations in scenarios with two exits and a nonuniform distribution of agents (NS2E)
In the above simulations, the initial positions of the agents are uniformly distributed. However, affected by various factors, the distribution of real crowds in public places is often not uniform, that is, there are more people gathered in some places and fewer in others. Therefore, we build an NS2E (NS2E:L0.5-R0.5) with a size of , both of whose exits are
. In this scenario, there are one hundred and twenty agents with random initial directions, of which forty are closer to the left exit and eighty are closer to the right exit. We conduct crowd evacuation simulations in this scenario to explore the impact of the initial distribution on the selection of agent evacuation exits.
As shown in (a), in NS2E:L0.5-R0.5, the arch congestion phenomenon of agents appears at both exits. However, different from the simulation results in S2E:L0.5-R0.5 ((a)), when the exit widths are equal, the size of the arch formed near the right exit is obviously larger than that near the left exit, which is also effectively verified by the density map ((a)). The nonuniform distribution of agents (initial positions) is the main reason for this phenomenon. Affected by visual occlusion and motion obstruction between agents, most agents tend to choose the closer exit, which leads to uneven use of evacuation exits. This phenomenon is consistent with the conformity behavior of evacuees (Low Citation2000). As shown in , the number of agents evacuating from the left exit and the right exit accounts for and
, respectively, and their difference is
, which indicates that some agents choose evacuation exits that are relatively far away. Because the degree of agent congestion at the right exit is obviously greater than that at the left exit, some agents closer to the right exit choose a relatively far left exit to complete evacuation faster, which is consistent with the findings of previous research results (Martinez-Gil, Lozano, and Fernández Citation2014; Liao, Kemloh Wagoum, and Bode Citation2017). Moreover, as shown in (a), the difference in the congestion degree between exits mainly urges the agents that are relatively close to the left exit to choose a farther left exit. However, due to the more serious visual occlusion and motion obstruction between agents, the agents that are relatively far from the left exit still choose the closer right exit.
Figure 14. Simulations in the scenarios with two exits and a nonuniform distribution of agents. (a-c) Stills of the simulation results in different NS2Es. (a) NS2E:L0.5-R0.5; (b) NS2E:L0.8-R0.5; (c) NS2E:L0.5-R0.8.
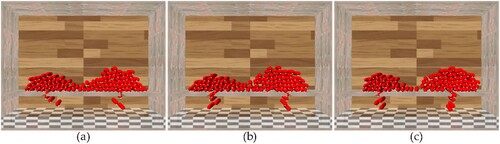
Figure 15. Density maps of simulation results in NS2Es. (a) NS2E:L0.5-R0.5; (b) NS2E:L0.8-R0.5; (c) NS2E:L0.5-R0.8.
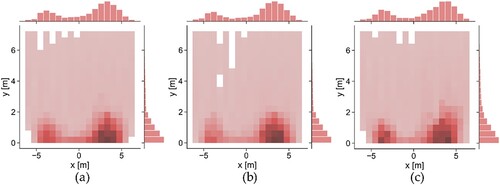
Table 3. Evacuation statistics of two exits in NS2Es.
In the case of only changing the height of the agents (half of the agents are and the other half are
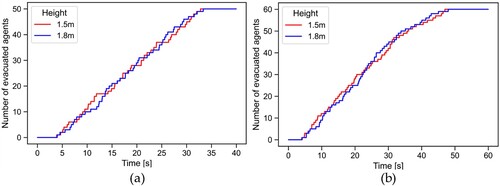
), we explore the impact of agent height on evacuation in the scenarios with two exits. In the scenario with two exits and a uniform distribution of agents (S2E:L0.5-R0.5 in Section 3.3) and the scenario with two exits and a nonuniform distribution of agents (NS2E:L0.5-R0.5), the simulation results still follow the evacuation laws of the corresponding scenario. In addition, as shown in , although the taller agents (
) evacuate faster in some evacuation periods, compared with the shorter agents (
), the taller agents (
) do not show an obvious advantage in the overall evacuation process, that is, the taller agents do not evacuate faster in the scenarios with two exits. Theoretically, the taller the agent is, the higher its field of vision will be. However, in congested scenarios, a higher visual field makes it difficult to ensure faster evacuation of agents due to various factors (e.g. motion obstruction between agents).
Figure 16. Impact of agent height on evacuation in the scenarios with two exits. (a) S2E:L0.5-R0.5; (b) NS2E:L0.5-R0.5. (a-b) represent the relationship between the number of evacuated agents and the evacuation time.
To explore the impact of exit width on evacuation exit selection in the case of a nonuniform distribution of agents, we only adjust the exit width of NS2E:L0.5-R0.5 to build two NS2Es with different exit widths: NS2E:L0.8-R0.5 and NS2E:L0.5-R0.8. In NS2E:L0.8-R0.5, the widths of the left and right exits are and
, respectively; in NS2E:L0.5-R0.8, the widths of the left and right exits are
and
, respectively. We use exactly the same methods and configurations as the simulation in NS2E:L0.5-R0.5 and conduct crowd evacuation simulations in NS2E:L0.8-R0.5 and NS2E:L0.5-R0.8.
Similar to the simulation results in NS2E:L0.5-R0.5 ((a) and (a)), in NS2E:L0.8-R0.5 ((b) and (b)) and NS2E:L0.5-R0.8 ((c) and (c)), the arch congestion of agents appears at both exits, and the arches formed near the right exits are all substantially larger than those near the left exits, which is different from the simulation results in S2Es ( and ). As shown in , the number of agents choosing the right exit in these two scenarios is greater than that choosing the left exit ( and
), which also verifies the above phenomenon of nonuniform arch congestion. In terms of their variations (,
and
) in NS2E:L0.8-R0.5 and NS2E:L0.5-R0.8, in the case of a nonuniform distribution of agents, the relative positions of exits with different widths can affect the tendency of agents to choose wider exits, that is, compared with the wider exit near the area of relative sparseness of agents, the wider exit near the relatively dense area can cause more agents to change their evacuation exit, which is different from the simulation and analysis results in S2Es (Section 3.3). Moreover, as shown in , compared with the simulation result in NS2E:L0.5-R0.5 ((a)), in NS2E:L0.8-R0.5 ((b)) and NS2E:L0.5-R0.8 ((c)), the wider exits mainly cause the agents who are relatively close to them to change their evacuation exit, which is the same as the simulation and analysis results in S2Es (Section 3.3).
Figure 17. Relationship between the initial position and evacuation exit in different NS2Es. (a) NS2E:L0.5-R0.5; (b) NS2E:L0.8-R0.5; (c) NS2E:L0.5-R0.8. (a-c) The black dotted lines indicate that the distances to the left and right exits are equal.
Based on the above simulations in NS2Es, we further analyze the impact of the relative positions of exits with different widths on the evacuation time under the condition of a nonuniform distribution of agents. As shown in , in NS2E:L0.5-R0.5, NS2E:L0.8-R0.5 and NS2E:L0.5-R0.8, the evacuation times needed for all agents to complete the evacuation are ,
and
, respectively. Compared with the simulation in NS2E:L0.5-R0.5, the evacuation times needed for all agents to complete the evacuation in NS2E:L0.8-R0.5 and NS2E:L0.5-R0.8 are shortened by
and
, respectively. Overall, compared with the wider exit near the area of relative sparseness of agents, the wider exit near the relatively dense area can better improve the evacuation effect of the agents, that is, it reduces the evacuation time more significantly.
Table 4. Evacuation times in NS2Es.
4. Conclusions
In this paper, to overcome the disadvantage of current crowd evacuation simulations depending on 2D environments and real data (or known experience), we propose a framework for crowd evacuation modeling and simulation by using deep reinforcement learning (DRL) and 3D physical environments (3DPEs), which includes two functional modules (DRL and 3DPEs) and two working modes (learning mode and simulation mode). In 3DPEs, we build crowd evacuation simulation scenarios from the three aspects of geometry, semantics and physics, which include the environment, the agents and the interactions between the agents and the environment and provide training samples for DRL. In DRL, we design a double branch feature extraction combined actor and critic network (DFECAC-net) as the DRL policy and value function and use a clipped surrogate objective with polynomial decay to control the policy update. Through a series of crowd evacuation simulations, we demonstrate that the interactive 3DPEs and unified DRL enable agents to adapt to different evacuation scenarios to simulate crowd evacuation and explore the laws of crowd evacuation. Here, the interactive 3DREs are reflected in two aspects: (1) agents can actively obtain the environmental state through a perceptron and take corresponding actions based on policy; (2) according to the actions of the agents, the environment changes accordingly and triggers certain specific events or feedback so that agents can not only obtain new states but also receive certain rewards. The unified DRL is reflected in three aspects: (1) the unified configuration of state, action and reward; (2) the unified network structure (including actor and critic); and (3) the unified configuration of hyperparameters.
In crowd evacuation simulations, we reproduce some typical phenomena of crowd evacuation, and find some valuable crowd evacuation laws through comparative analysis. In S1E, we reproduce the bottleneck effect of congested crowds and verify the effectiveness of our simulation by comparing it with a real crowd experiment. Through further simulations and analysis in S1Es, we demonstrate that the width of the exit is the key factor affecting the exit evacuation efficiency, while the number, mass and height of agents do not affect the exit evacuation efficiency. In S2Es, we verify the principle of nearby evacuation and the tendency to choose a wider exit. Through further comparative analysis, we also demonstrate that the relative positions of exits with different widths do not affect the tendency of the crowd to choose a wider exit when the crowd is uniformly distributed. The wider exit mainly induces the part of the crowd that is relatively close to it to change its evacuation exit. In NS2Es, we reproduce the blind conformity behavior of the crowd, that is, the uneven use of exits due to the nonuniform distribution of the crowd, and the behavior of some evacuees choosing exits that have relatively sparse densities and far distances. Through further comparative analysis, we also draw the following conclusions: the taller evacuees do not evacuate faster in the scenarios with two exits; the relative positions of exits with different widths can affect the tendency of the crowd to choose a wider exit when the crowd has a nonuniform distribution; and the wider exit near the relatively dense place of the crowd can better improve the evacuation effect.
It should be mentioned that avoiding crowd evacuation simulations that rely on 2D environments does not mean that crowd evacuation simulations based on 3D environments are always better. Because it is easier and faster to simulate crowd evacuation behavior in some scenarios by using 2D environments, 2D environments are still widely used at present. Crowd evacuation simulation based on 3D (physical) environments provides new insights for crowd evacuation simulation, which can compensate for some shortcomings of crowd evacuation simulation based on 2D environments. In this paper, we initially perform crowd simulations in virtual 3D physical environments, and they effectively alleviate the dependence on real data (or known experience), but there are still areas that can be improved and perfected. Compared with the previous crowd evacuation simulations, although the crowd evacuation scenarios we built from the three aspects of geometry, semantics and physics are closer to the scenarios of real crowd evacuations in terms of dimension and mechanism, the scenarios we used for crowd evacuation simulations are still relatively simple. They are very similar to the scenarios of real crowd experiments, but there is still a certain gap between them and the scenarios of real crowd evacuations. Compared with the scenarios of real crowd experiments, the spatial structure and semantic information of real crowd evacuation scenarios are more complex and diverse, which makes the convergence of DRL more difficult. The evacuation simulations in the scenarios of real crowd evacuations bring us greater challenges, which is also a common problem faced by current crowd evacuation simulations. Therefore, on the basis of building more realistic and complex 3D evacuation scenarios based on 3DPEs, using DRL for crowd evacuation modeling and simulation has become the main goal of our future work.
Acknowledgements
The authors would like to thank anonymous reviewers and editors for their valuable comments on the manuscript.
Data availability statement
The data that support the findings of this study can be obtained from the corresponding author upon reasonable request.
Disclosure statement
No potential conflict of interest was reported by the author(s).
Additional information
Funding
References
- Adrian, Juliane, Maik Boltes, Stefan Holl, Anna Sieben, and Armin Seyfried. 2018. “Crowding and Queuing in Entrance Scenarios: Influence of Corridor Width in Front of Bottlenecks.” Paper presented at the 9th International Conference on Pedestrian and Evacuation Dynamics (PED2018), Lund, Sweden.
- Berg, Jur van den, Stephen J. Guy, Ming Lin, and Dinesh Manocha. 2011. “Reciprocal n-Body Collision Avoidance.” In Robotics Research: The 14th International Symposium ISRR, edited by Cédric Pradalier, Roland Siegwart and Gerhard Hirzinger, 3–19. Berlin: Springer Berlin Heidelberg.
- Bode, Nikolai W. F., Armel U. Kemloh Wagoum, and Edward A. Codling. 2015. “Information Use by Humans During Dynamic Route Choice in Virtual Crowd Evacuations.” Royal Society Open Science 2 (1): 140410. doi:10.1098/rsos.140410.
- Brscic, D., T. Kanda, T. Ikeda, and T. Miyashita. 2013. “Person Tracking in Large Public Spaces Using 3-D Range Sensors.” IEEE Transactions on Human-Machine Systems 43 (6): 522–534. doi:10.1109/THMS.2013.2283945.
- Fahy, R. F., and G. Proulx. 2005. Analysis of Published Accounts of the World Trade Center Evacuation. Washington, DC: US Department of Commerce, Technology Administration, National Institute of Standards and Technology.
- Godoy, Julio, Stephen J. Guy, Maria Gini, and Ioannis Karamouzas. 2020. “C-Nav: Distributed Coordination in Crowded Multi-Agent Navigation.” Robotics and Autonomous Systems 133: 103631. doi:10.1016/j.robot.2020.103631.
- Haghani, Milad, and Majid Sarvi. 2018. “Crowd Behaviour and Motion: Empirical Methods.” Transportation Research Part B: Methodological 107: 253–294. doi:10.1016/j.trb.2017.06.017.
- Heess, Nicolas, Dhruva Tb, Srinivasan Sriram, Jay Lemmon, Josh Merel, Greg Wayne, Yuval Tassa, Tom Erez, Ziyu Wang, and S. M. Eslami. 2017. “Emergence of Locomotion Behaviours in Rich Environments.” arXiv preprint arXiv:1707.02286.
- Helbing, D., and P. Molnar. 1995. “Social Force Model for Pedestrian Dynamics.” Physical Review E 51 (5): 4282–4286. doi:10.1103/PhysRevE.51.4282.
- Henry, Peter, Christian Vollmer, Brian Ferris, and Dieter Fox. 2010. “Learning to Navigate Through Crowded Environments.” Paper presented at the 2010 IEEE International Conference on Robotics and Automation, Anchorage, AK, USA.
- Huang, Lin, Jianhua Gong, and Wenhang Li. 2021. “A Perception Model for Optimizing and Evaluating Evacuation Guidance Systems.” ISPRS International Journal of Geo-Information 10 (2): 54. doi:10.3390/ijgi10020054.
- Juliani, Arthur, Vincent-Pierre Berges, Ervin Teng, Andrew Cohen, Jonathan Harper, Chris Elion, Chris Goy, Yuan Gao, Hunter Henry, and Marwan Mattar. 2018. “Unity: A General Platform for Intelligent Agents.” arXiv preprint arXiv:1809.02627.
- Kinateder, Max, Brittany Comunale, and William H. Warren. 2018. “Exit Choice in an Emergency Evacuation Scenario is Influenced by Exit Familiarity and Neighbor Behavior.” Safety Science 106: 170–175. doi:10.1016/j.ssci.2018.03.015.
- Kretz, Tobias, Anna Grünebohm, and Michael Schreckenberg. 2006. “Experimental Study of Pedestrian Flow Through a Bottleneck.” Journal of Statistical Mechanics: Theory and Experiment 2006 (10): P10014. doi:10.1088/1742-5468/2006/10/P10014.
- Li, Xinjin, Hong Liu, Junqing Li, and Yan Li. 2021. “Deep Deterministic Policy Gradient Algorithm for Crowd-Evacuation Path Planning.” Computers & Industrial Engineering 161: 107621. doi:10.1016/j.cie.2021.107621.
- Li, Weilian, Jun Zhu, Lin Fu, Qing Zhu, Yukun Guo, and Yuhang Gong. 2021. “A Rapid 3D Reproduction System of Dam-Break Floods Constrained by Post-Disaster Information.” Environmental Modelling & Software 139: 104994. doi:10.1016/j.envsoft.2021.104994.
- Li, Weilian, Jun Zhu, Lin Fu, Qing Zhu, Yakun Xie, and Ya Hu. 2021. “An Augmented Representation Method of Debris Flow Scenes to Improve Public Perception.” International Journal of Geographical Information Science 35 (8): 1521–1544. doi:10.1080/13658816.2020.1833016.
- Liao, Weichen, Armel U. Kemloh Wagoum, and Nikolai W. F. Bode. 2017. “Route Choice in Pedestrians: Determinants for Initial Choices and Revising Decisions.” Journal of the Royal Society Interface 14 (127): 20160684. doi:10.1098/rsif.2016.0684.
- Liao, Weichen, Xiaoping Zheng, Lisheng Cheng, Ying Zhao, Yuan Cheng, and Yafei Wang. 2014. “Layout Effects of Multi-Exit Ticket-Inspectors on Pedestrian Evacuation.” Safety Science 70: 1–8. doi:10.1016/j.ssci.2014.04.015.
- Lin, Hui, Min Chen, and Guonian Lu. 2013. “Virtual Geographic Environment: A Workspace for Computer-Aided Geographic Experiments.” Annals of the Association of American Geographers 103 (3): 465–482. doi:10.1080/00045608.2012.689234.
- Lin, Hui, Min Chen, Guonian Lu, Qing Zhu, Jiahua Gong, Xiong You, Yongning Wen, Bingli Xu, and Mingyuan Hu. 2013. “Virtual Geographic Environments (VGEs): A new Generation of Geographic Analysis Tool.” Earth-Science Reviews 126: 74–84. doi:10.1016/j.earscirev.2013.08.001.
- Low, David J. 2000. “Following the Crowd.” Nature 407 (6803): 465–466. doi:10.1038/35035192.
- Lü, Guonian, Min Chen, Linwang Yuan, Liangchen Zhou, Yongning Wen, Mingguan Wu, Bin Hu, Zhaoyuan Yu, Songshan Yue, and Yehua Sheng. 2018. “Geographic Scenario: A Possible Foundation for Further Development of Virtual Geographic Environments.” International Journal of Digital Earth 11 (4): 356–368. doi:10.1080/17538947.2017.1374477.
- Macchione, Francesco, Pierfranco Costabile, Carmelina Costanzo, and Rosa De Santis. 2019. “Moving to 3-D Flood Hazard Maps for Enhancing Risk Communication.” Environmental Modelling & Software 111: 510–522. doi:10.1016/j.envsoft.2018.11.005
- Martinez-Gil, Francisco, Miguel Lozano, and Fernando Fernández. 2014. “MARL-Ped: A Multi-Agent Reinforcement Learning Based Framework to Simulate Pedestrian Groups.” Simulation Modelling Practice and Theory 47: 259–275. doi:10.1016/j.simpat.2014.06.005.
- Martinez-Gil, Francisco, Miguel Lozano, and Fernando Fernández. 2017. “Emergent Behaviors and Scalability for Multi-Agent Reinforcement Learning-Based Pedestrian Models.” Simulation Modelling Practice and Theory 74: 117–133. doi:10.1016/j.simpat.2017.03.003.
- Muir, Helen C., David M. Bottomley, and Claire Marrison. 1996. “Effects of Motivation and Cabin Configuration on Emergency Aircraft Evacuation Behavior and Rates of Egress.” The International Journal of Aviation Psychology 6 (1): 57–77. doi:10.1207/s15327108ijap0601_4.
- Müller, Klaus. 1981. “Zur Gestaltung und Bemessung von Fluchtwegen für die Evakuierung von Personen aus Bauwerken auf der Grundlage von Modellversuchen.” PhD diss., Technische Hochschule Magdeburg.
- Nagai, Ryoichi, Masahiro Fukamachi, and Takashi Nagatani. 2006. “Evacuation of Crawlers and Walkers from Corridor Through an Exit.” Physica A: Statistical Mechanics and its Applications 367: 449–460. doi:10.1016/j.physa.2005.11.031.
- Saloma, C., G. J. Perez, G. Tapang, M. Lim, and C. Palmes-Saloma. 2003. “Self-organized Queuing and Scale-Free Behavior in Real Escape Panic.” Proceedings of the National Academy of Sciences 100 (21): 11947–11952. doi:10.1073/pnas.2031912100.
- Schulman, John, Philipp Moritz, Sergey Levine, Michael Jordan, and Pieter Abbeel. 2015. “High-Dimensional Continuous Control Using Generalized Advantage Estimation.” arXiv preprint arXiv:1506.02438.
- Schulman, John, Filip Wolski, Prafulla Dhariwal, Alec Radford, and Oleg Klimov. 2017. “Proximal Policy Optimization Algorithms.” arXiv preprint arXiv:1707.06347.
- Seyfried, Armin, Maik Boltes, Jens Kähler, Wolfram Klingsch, Andrea Portz, Tobias Rupprecht, Andreas Schadschneider, Bernhard Steffen, and Andreas Winkens. 2010. “Enhanced Empirical Data for the Fundamental Diagram and the Flow Through Bottlenecks.” In Pedestrian and Evacuation Dynamics 2008, edited by Wolfram W. F. Klingsch, Christian Rogsch, Andreas Schadschneider and Michael Schreckenberg, 145–156. Berlin: Springer Berlin Heidelberg.
- Seyfried, Armin, Bernhard Steffen, Wolfram Klingsch, and Maik Boltes. 2005. “The Fundamental Diagram of Pedestrian Movement Revisited.” Journal of Statistical Mechanics: Theory and Experiment 2005 (10): P10002. doi:10.1088/1742-5468/2005/10/P10002.
- Torrey, L. 2010. “Crowd Simulation Via Multi-Agent Reinforcement Learning.” Paper presented at the Proceedings of the Sixth AAAI Conference on Artificial Intelligence and Interactive Digital Entertainment, Stanford, California, USA.
- Varas, A., M. D. Cornejo, D. Mainemer, B. Toledo, J. Rogan, V. MunOz, and J. A. Valdivia. 2007. “Cellular Automaton Model for Evacuation Process with Obstacles.” Physica A: Statistical Mechanics and its Applications 382 (2): 631–642. doi:10.1016/j.physa.2007.04.006.
- Von Krüchten, Cornelia, and Andreas Schadschneider. 2017. “Empirical Study on Social Groups in Pedestrian Evacuation Dynamics.” Physica A: Statistical Mechanics and its Applications 475: 129–141. doi:10.1016/j.physa.2017.02.004.
- Wang, Qingqing, Hong Liu, Kaizhou Gao, and Le Zhang. 2019. “Improved Multi-Agent Reinforcement Learning for Path Planning-Based Crowd Simulation.” IEEE Access 7: 73841–73855. doi:10.1109/ACCESS.2019.2920913.
- Woo, Sanghyun, Jongchan Park, Joon-Young Lee, and In So Kweon. 2018. “Cbam: Convolutional Block Attention Module.” Paper presented at the the European Conference on Computer Vision (ECCV), Munich, Germany.
- Xie, Wei, Eric Wai Ming Lee, Yanying Cheng, Meng Shi, Ruifeng Cao, and Yuchun Zhang. 2020. “Evacuation Performance of Individuals and Social Groups Under Different Visibility Conditions: Experiments and Surveys.” International Journal of Disaster Risk Reduction 47: 101527. doi:10.1016/j.ijdrr.2020.101527
- Yao, Zhenzhen, Guijuan Zhang, Dianjie Lu, and Hong Liu. 2020. “Learning Crowd Behavior from Real Data: A Residual Network Method for Crowd Simulation.” Neurocomputing 404: 173–185. doi:10.1016/j.neucom.2020.04.141.
- Yin, Lingzhi, Jun Zhu, Yi Li, Chao Zeng, Qing Zhu, Hua Qi, Mingwei Liu, Weilian Li, Zhenyu Cao, and Weijun Yang. 2017. “A Virtual Geographic Environment for Debris Flow Risk Analysis in Residential Areas.” ISPRS International Journal of Geo-Information 6 (11): 377. doi:10.3390/ijgi6110377.
- Yuksel, Mehmet Erkan. 2018. “Agent-based Evacuation Modeling with Multiple Exits Using NeuroEvolution of Augmenting Topologies.” Advanced Engineering Informatics 35: 30–55. doi:10.1016/j.aei.2017.11.003.
- Zhang, Yihao, Zhaojie Chai, and George Lykotrafitis. 2021. “Deep Reinforcement Learning with a Particle Dynamics Environment Applied to Emergency Evacuation of a Room with Obstacles.” Physica A: Statistical Mechanics and its Applications 571: 125845. doi:10.1016/j.physa.2021.125845.
- Zhang, Guoyong, Jianhua Gong, Yi Li, Jun Sun, Bingli Xu, Dong Zhang, Jieping Zhou, Ling Guo, Shen Shen, and Bingxiao Yin. 2020. “An Efficient Flood Dynamic Visualization Approach Based on 3D Printing and Augmented Reality.” International Journal of Digital Earth 13 (11): 1302–1320. doi:10.1080/17538947.2019.1711210.
- Zhang, Dong, Wenhang Li, Jianhua Gong, Lin Huang, Guoyong Zhang, Shen Shen, Jiantao Liu, and Haonan Ma. 2022. “HDRLM3D: A Deep Reinforcement Learning-Based Model with Human-Like Perceptron and Policy for Crowd Evacuation in 3D Environments.” ISPRS International Journal of Geo-Information 11 (4): 255. doi:10.3390/ijgi11040255.
- Zhao, C. M., S. M. Lo, S. P. Zhang, and M. Liu. 2008. “A Post-Fire Survey on the Pre-Evacuation Human Behavior.” Fire Technology 45 (1): 71–95. doi:10.1007/s10694-007-0040-6.
- Zhao, Xuedan, Long Xia, Jun Zhang, and Weiguo Song. 2020. “Artificial Neural Network Based Modeling on Unidirectional and Bidirectional Pedestrian Flow at Straight Corridors.” Physica A: Statistical Mechanics and its Applications 547: 123825. doi:10.1016/j.physa.2019.123825.
- Zheng, Xiaoping, Tingkuan Zhong, and Mengting Liu. 2009. “Modeling Crowd Evacuation of a Building Based on Seven Methodological Approaches.” Building and Environment 44 (3): 437–445. doi:10.1016/j.buildenv.2008.04.002.
- Zuriguel, I., J. Olivares, J. M. Pastor, C. Martín-Gómez, L. M. Ferrer, J. J. Ramos, and A. Garcimartín. 2016. “Effect of Obstacle Position in the Flow of Sheep Through a Narrow Door.” Physical Review E 94 (3): 032302. doi:10.1103/PhysRevE.94.032302.