
 ?Mathematical formulae have been encoded as MathML and are displayed in this HTML version using MathJax in order to improve their display. Uncheck the box to turn MathJax off. This feature requires Javascript. Click on a formula to zoom.
ABSTRACT
Data processing and climate characterisation to study its impact is becoming difficult due to insufficient and unavailable data, especially in developing countries. Understanding climate's impact on burnt areas in Ghana (Guinea-savannah (GSZ) and Forest-savannah Mosaic zones (FSZ)) leads us to opt for machine learning. Through Google Earth Engine (GEE), rainfall (PR), maximum temperature (Tmax), minimum temperature (Tmin), average temperature (Tmean), Palmer Drought Severity Index (PDSI), relative humidity (RH), wind speed (WS), soil moisture (SM), actual evapotranspiration (ETA) and reference evapotranspiration (ETR) have been acquired through CHIRPS (Climate Hazards group Infrared Precipitation with Stations), FLDAS dataset (Famine Early Warning Systems Network (FEWS NET) Land Data Assimilation System) and TerraClimate platform from 1991 to 2021. The objective is to analyse the link and the contribution of climatic and environmental parameters on wildfire spread in GSZ and FSZ in Ghana. Variables were analysed (area burnt and the number of active fires) through Spearman correlation and the cross-correlation function (CCF) (2001 to 2021). The tests (Mann-Kendall and Sens's slope trend test, Pettitt test and the Lee and Heghinian test) showed the overall decrease in rainfall and increase in temperature respectively (−0.1 mm; + 0.8°C) in GSZ and (−0.9 mm; + 0.3°C) in FSZ. In terms of impact, PR, ETR, FDI, Tmean, Tmax, Tmin, RH, ETA and SM contribute to fire spread. Through the codes developed, researchers and decision-makers could update them at different times easily to monitor climate variability and its impact on fires.
1. Introduction
The ever-changing global climate has repercussions on many things such as the world's population, natural resources and their various ecosystems thus contributing to the increase in risks and disasters around the world (Trenberth, Fasullo, and Shepherd Citation2015; Thomas et al. Citation2018; WMO Citation2021; Kushawaha et al. Citation2021; Wentz Citation2015) for example between 2000 and 2019 over 475,000 people lost their lives as a direct result of more than 11,000 extreme weather events globally and losses amounted to around US$ 2.56 trillion (CIR Citation2021). This change is based on the assessment of multiple lines of evidence, global warming of 2°C (IPCC Citation2021). To this end, concerns have become great in recent decades about the increase in this global surface temperature (Ham Citation2018; IPCC Citation2021; CIR Citation2021; United Nations Environment Programme Citation2022), Many changes in the climate system become larger in direct relation to increasing global warming. They include increases in the frequency and intensity of hot extremes, marine heatwaves, heavy precipitation, and, in some regions, agricultural and ecological droughts; an increase in the proportion of intense tropical cyclones; and reductions in Arctic Sea ice, snow cover and permafrost (Cai et al. Citation2021; Donat, Angélil, and Ukkola Citation2019; IPCC Citation2021). For example, every additional 0.5°C of global warming causes discernible increases in the intensity and frequency of hot extremes, including heatwaves (very likely), and heavy precipitation (high confidence), as well as agricultural and ecological droughts in some regions (high confidence) (IPCC Citation2021). This situation makes countries and areas vulnerable depending on their specific climatic conditions. For example, the countries most affected in 2019 were Mozambique, Zimbabwe as well as the Bahamas and for the period from 2000 to 2019 Puerto Rico, Myanmar and Haiti rank highest (CIR Citation2021). To this end, the Global Climate Risk Index indicates a level of exposure and vulnerability to extreme weather events, which countries should understand as warnings to be prepared for more frequent and/or more severe events in the future (CIR Citation2021). This global phenomenon of climate change and its components hardly spares any component of life on Earth (Smith and Hitz Citation2003; Almer, Laurent-Lucchetti, and Oechslin Citation2017; Baez et al. Citation2017). Observed climate changes may have already influenced wildfire potential over parts of the globe (Stocks et al. Citation1998; Gillett et al. Citation2004; Westerling et al. Citation2006), and projected changes in climate over the next century are hypothesised to significantly alter global wildfire regimes (Flannigan et al. Citation2009). Weather conditions that are favourable for the start and spread of wildfires are brought on by climate change (Jones et al. Citation2022). Combining adverse land use and land cover shifting patterns with particular climate zones makes them more susceptible to forest fires (Angra and Sapountzaki Citation2022). The Australian bushfires of 2019/2020, for example, happened during fire weather conditions that were significantly more likely owing to climate change. Additionally, several large wildfires that have occurred in recent years have done so (Jones et al. Citation2022). Weather conditions, including ambient air temperature, relative humidity, and wind direction and velocity affect fire behaviour (Trollope Citation1984; Trollope and Trollope Citation2002). According to Bilgili and Saglam (Citation2003), wind conditions have a dominant influence on fire behaviour; particularly, wind speed affects the rate of fire spread and flame height. Also, relative air humidity and air temperature affect fire behaviour indirectly through their effect on the moisture content of vegetation and litter (Bond and van Wilgen Citation1996; Bond and Keeley Citation2005).
Africa in general, and West Africa in particular, which is largely made up of developing countries, is increasingly exposed to climatic hazards (Wascal Citation2021; Tarif Citation2022; Trisos et al. Citation2022), making its efforts to combat them difficult (Maino and Emrullahu Citation2022). Local climate variability or climate change is causing severe disruption resulting in drought, and famine due to insufficient agricultural production (ECOWAS Citation2021). In tropical savanna ecosystems, the fuel load is mainly composed of herbaceous vegetation that makes up 75–90% of total annual biomass (Garnier and Dajoz Citation2001) with high amounts of standing dead fuel, resulting in high combustibility and fire risk (Hennenberg et al. Citation2006). In addition to this favourable predisposition of vegetation cover to wildfires, climatic constraints contribute greatly to their spread (Hanan et al. Citation2021; Jones et al. Citation2022; Kays and Ward Citation2021). Additionally, the various future climatic scenarios predict that flame length would rise by 4.6% to 15.69% (Molina, González-Cabán, and Rodríguez y Silva Citation2019). Therefore, as a result of the increased frequency and intensity of fire weather, climate change is placing constant upward pressure on fire around the globe. This upward pressure will get stronger with each degree of global warming (Jones et al. Citation2022).
At a time of great climatic upheavals that cause floods, droughts and disastrous fires in forest areas, for example, Ghana is hardly spared but is also confronted with the impacts of extreme climate events. Thus, three major physical impacts of climate change have been identified in Ghana: temperature change, changes in rainfall and sea level rise (EPA). Some impact studies carried out in Ghana showed increased temperatures and evapotranspiration, decreased and highly variable rainfall patterns and more frequent and pronounced dry spells in the selected representative river basins of the country (CSIRWRI Citation2000; Kasei, Barnabas, and Ampadu Citation2014). In the analysis of historical records of Ghana, the observed rate of change in minimum temperature for the period 1960–2010 was 37% for the northern part (Guinea Savannah Zones). The mean minimum temperature over the Savannah Zone is projected to increase by 1.10°C by 2040 and the mean monthly maximum temperature is expected to increase by 1.2°C and 2.1°C by 2040 and 2060, respectively (Issahaku, Campion, and Edziyie Citation2016; Incoom, Adjei, and Odai Citation2020). Also, according to Laux, Kunstmann, and Bárdossy (Citation2008); Armah et al. (Citation2011) and Laube, Schraven, and Awo (Citation2012), Climate variability is the basis for the decrease in rainfall and the increase in temperature in the ecological zones of the Guinean savannah of northern Ghana. However, the research done by Baidu et al. Citation2017 revealed that the transition zone (forest-savannah mosaic zone), recorded almost quite stable rainfall amounts for all seasons. The majority of the research mentioned a proven variability of climatic parameters (precipitation and temperature). These parameters influence in one way or another the parameters like Palmer Drought Severity Index (PDSI), relative humidity (RH), wind speed (WS), soil moisture (SM), actual evapotranspiration (ETA) and reference evapotranspiration (ETR). Analysing their contribution to fire spread is essential given the importance of fire in the agricultural and non-agricultural activities of the population, to alert them to the job in real-time. However, access to climate data is difficult in tropical environments (Dinku Citation2019; Overpeck et al. Citation2011; Dinku et al. Citation2018), which leads us to adopt new programming and machine learning technologies (Google Earth Engine and R language) in this study. These increasingly used approaches (Yang et al. Citation2022; Mutanga and Kumar Citation2019; Sazib, Mladenova, and Bolten Citation2018; Sidhu, Pebesma, and Câmara Citation2018; Xing et al. Citation2022) allowed us to initially analyse and characterise the aforementioned variables in the Guinea-Savannah and Forest-Savannah mosaic zone in Ghana (1991–2021). After conducting Spearman correlation analyses and using the cross-correlation function (CCF) with fire data (area burnt and active fires) to highlight the parameters that contribute most to the spread of wildfires in the study areas. The emergence of cloud computing platforms such as Google Earth Engine (GEE) is an important advance that facilitates remote sensing applications (Gorelick et al. Citation2017). Computationally intensive methods are executed using parallel processing in the Google Cloud, allowing the processing of massive satellite datasets over large areas in settings with limited computational and internet resources. Because of these advantages, GEE has been widely used to develop remote sensing applications in a variety of fields (Tamiminia et al. Citation2020).
2. Materials and methods
2.1. Study sites
The districts considered in Guinea-savannah (West Gonja, West Mamprusi) for this research are located between 10° 27′0″ and 8°92′0″ N latitude and 0°28′0″ and 2°18′0″ W longitude with an area of 13,880.41 km2 (). Guinea-savannah is occupied by extensive wooded savannahs characteristic of the Guinean region, and the Open Guinean Savanna (OGS), characterised by natural wooded savannahs, is invaded by cultivated land CILSS (Citation2016). According to Menczer and Quaye (Citation2006), the Guinean-Savannah zone consists of tall grasses growing between widely spaced trees.
Figure 1. Geographic situation of the studies zones and districts.
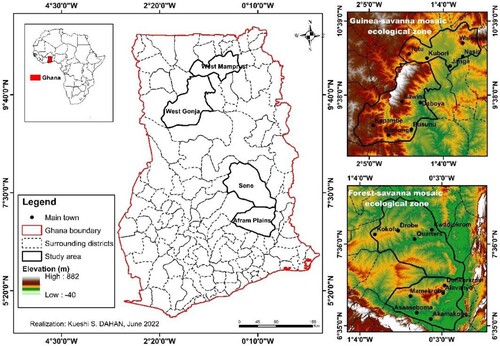
About Forest-Savannah, the districts considered (Sene, Afram Plain), for this research are located between 6°35′0″ and 8°9′0″ N latitude and 1°40′W and 0°31′0″ E longitude with an area of 13,880.41 km2. Structured into several sub-zones, the Forest-Savannah zone is located in central Ghana and composed of the Main, Eastern and Central Transitional Zones (MTZ, ETZ and CTZ) with an intermediate climate with two rainy seasons.
2.2. Material and data processing
To assess and analyse the link between climatic, and environmental parameters and wildfires (burned area and active fires), the present study has focused on certain parameters, namely for the study period (1991–2021) for climate characterisation and from 2001 to 2021 for correlation analysis between the latter and fire data; rainfall (PR), maximum temperature (Tmax), minimum temperature (Tmin), average temperature (Tmean), Palmer Drought Severity Index (PDSI), relative humidity (RH), wind speed (WS), soil moisture (SM), actual evapotranspiration (ETA) and reference evapotranspiration (ETR). Regarding the fire data, they are derived from Modis images (MCD64A1 for burned area and MCD14ML for active fires) treated and processed according to the methodology used by Oliveras et al. (Citation2014), (see data availability statement). These parameters are generally considered to be the climate environment components that most influence the behaviour of wildfires (Guiguindibaye, Belem, and Boussim Citation2013). The availability of field observation data is a major challenge in less developed countries, and this was also revealed in this research, also by other authors as well (Dinku Citation2019; Overpeck et al. Citation2011; Dinku et al. Citation2018; Cervigni et al. Citation2015; Dinku et al. Citation2014; Kasei Citation2010). For this purpose, the data used is retrieved through platforms that host satellite data through machine learning approaches using Google Earth Engine (GEE) (). GEE (https://code.earthengine.google.com), provides a scalable, cloud-based, geospatial retrieval and processing platform (Yang et al. Citation2022; Mutanga and Kumar Citation2019; Kumar and Mutanga Citation2018) and is free for in-cloud data access, processing and management (Tamiminia et al. Citation2020).
Table 1. Characteristics of the data used in this research and their references
Through this modern approach of remote sensing (RS), which plays an important role in data collection in many statistical areas (Yang et al. Citation2022), we were able to obtain the expected data. Also, GEE improves the accessibility and usability of the earth observation data and related tools by making them available to a wide range of researchers and the public (Sazib, Mladenova, and Bolten Citation2018). Its strength is based on the combination of petabyte-scale satellite imagery and geospatial data with worldwide analysis capabilities, providing easy global analysis and mapping, with easy access to data, and ‘unrestricted’ and stable processing power (Hu and Dong Citation2018; Chen et al. Citation2021). In addition to the above parameters, indices such as the Standardised Precipitation Index (SPI), Rainfall Anomaly Index (RAI), Standardised Anomaly Index (SAI), Ångström Indice (AI), Lowveld Fire Danger Index (FDI) have been applied to certain parameters to better characterise them. Statistical analysis was done using the R software.
2.3. Method of the link between fire and climatic parameter assessment
2.3.1. Data characteristics and assessment
Precipitation, Standardised Precipitation Index (SPI) and Palmer Drought Severity Index (PDSI)
To emphasise the periods of water deficit in the study area, the dynamic of rainfall has been assessed from 1991 to 2021 using the Standardised Precipitation Index or Nicholson Index (SPI) () and also PDSI has been assessed. The calculation of this index makes it possible to determine the degree of humidity or dryness of the environment (Bergaoui and Alouini Citation2001). The Standardised Precipitation Index (SPI) was developed by McKee, Doesken, and Kleist (Citation1993). It is a statistical indicator used for the characterisation of local or regional droughts. Based on a long-term precipitation history (minimum 30 years), it quantifies the deviation of the precipitation of a period, deficit or surplus, from the historical average precipitation of the period. It can be normal, wet or dry. It also makes it possible to interpret the dynamics of the vegetation cover with the evolution of rainfall (McKee, Doesken, and Kleist Citation1993). Other tests (Pettitt and Mann-Kendall stationarity tests) were carried out to better assess trends. The SPI has been evaluated through the following equation:
(1)
(1) SPI = Rainfall index for the year i; Pi = is the total rainfall for a year i; Pmean = annual average of rainfall observed over the whole series; σ = Standard deviation of annual rainfall observed for a given series.
The interpretation of the results of the SPI calculation was made according to the SPI classes and their degree of dryness or humidity (). Negative values of the SPI correspond to a dry year, whereas positive values indicate wet years.
Palmer Drought Severity Index (PDSI)
Table 2. Drought classification according to the SPI values (McKee, Doesken, and Kleist (Citation1993))
Table 3. PDSI categorisation of drought severity (Palmer Citation1965).
2.3.2. Time series change detection and trend analysis
Pettit test
We use the variable to test Ho such as
=
In addition to the Pettitt test, which was applied to three of the parameters considered (PR, SM and RH), the Lee and Heghinian (Hubert and Carbonnel Citation1993) test was also applied because of its strength in analysing the change in a time series. The test is based on the assumption that the series is normally distributed. The tests are Bayesian procedures, which assume an evolution of the series as follows:
(5)
(5) With
are independent and normally distributed with a mean equal to zero and a variance equal to
is the position in time and is the scope of the possible change in the mean (Bougara et al. Citation2020; Hubert and Carbonnel Citation1993; Traore et al. Citation2014).
Mann-Kendall test
distribution as in the following equation:
(8)
(8) With
is the variance of statistic S. Thus, a positive Z value indicates an increasing trend, whereas a negative value indicates that the trend is decreasing.
Temperature and Wind speed
Relative humidity
Thus, from Clausius–Clapeyron:
(11)
(11) Knowing
and
Relative Humidity (RH) is:
(12)
(12)
Evapotranspiration (ET)
Soil Moisture
2.3.3. Anomalies assessment in the time series data (RAI and SAI)
In addition to SPI and PDSI, the anomalies were calculated in the rainfall time series to better identify the periods of pejoration and majoration. For this purpose, the Rooy (Rooy Citation1965) Rainfall Anomaly Index (RAI) was calculated monthly and classified to analyse the frequency and intensity of the rainfall (). RAI, developed and first used by Rooy (Citation1965) and adapted by Freitas (Citation2005), constitutes the following equations:
(14)
(14)
(15)
(15)
Table 4. Designation of variables used in for computing of RH.
Table 5. Data requirements for application of the SWB model (Finkelstein et al. Citation2022).
Table 6. Designation of variables used in for computing of ETR (ASCE-EWRI Citation2005).
Table 7. Rainfall Anomalies Index classification (Freitas Citation2005).
With: = current monthly/yearly rainfall (mm);
= average monthly/yearly rainfall (mm) of the historical series (mm);
= average of the 10 highest monthly/yearly precipitations of the historical series (mm); = average of the 10 lowest monthly/yearly precipitations of the historical series (mm); and positive anomalies have their values above average and negative anomalies have their values below average.
Therefore, for mean temperature, relative humidity and soil moisture, the Standardised Anomaly Index (SAI) (Koudahe et al. Citation2017) was performed to evaluate the changes and fluctuations that occurred and monthly calculated.
SAI is expressed as follows:
(16)
(16) With:
: annual mean observation values during time t;
: long-term mean of the series considered throughout the observation
: standard deviation of the time series considered throughout the observation.
2.3.4. Estimating of fire risk indices
To evaluate the risk of fire as a function of specific climatic parameters over the study period (2001–2021), the following will be used: Ångström and Lowveld Indices.
Ångström Indice (AI)
It has been used in some parts of Scandinavia for indicating expected fire starts on a given day (Chandler et al. Citation1983). The Angström index is estimated by the equation:
(17)
(17) with Tmean (°C), the average temperature and RH (%) the relative humidity. If:
AI > 4, fire occurrence is unlikely
2.5 < AI < 4.0, fire conditions are unfavourable
2.0 < AI < 2.5, fire conditions are favourable
AI < 2, fire occurrence very likely
• Lowveld Fire Danger Index (FDI)
The FDI categories are as follows:
0 < FDI < 20, very low risk;
21 < FDI < 45, moderate risk;
46 < FDI < 60, high risk;
61 < FDI < 75, very high risk;
76 < FDI < 100, extremely high risk.
2.3.5. Statistics analysis on the assessment of the link between fires, climatic and environmental parameters
2.3.5.1. Assessment of the link between fires, climatic and environmental parameters
Correlation analysis between variables was done to assess the degree of association between burnt areas, active fires and the considered climatic and environmental parameters. Thus, non-parametric Spearman correlation (Ramsey Citation1989) and cross-correlation analysis (equation) were carried out in R software respectively to evaluate the correlation between the variables and those who influence the fires (burnt areas and the active fires) over the period studied (2001–2021) in the studies zones. The cross-correlation function (CCF) allows the statistical analysis of the relationship between two variables in a system, provided that both variables are time series data and are assumed to be stationary in terms of mean and variance (Shumway and Stoffer Citation2011). It is expressed as follows:
CCF between is called the
order cross-correlation of X and Y. The sample estimate of this cross-correlation, called
is calculated using the formula:
(19)
(19)
called the time index is allowed to be either positive or negative. The large sample standard error of the sample cross-correlation is
so that large sample confidence limits are
.
Concerning Spearman correlation, it is expressed by the following equation:
(20)
(20)
= Spearman’s rank correlation coefficient;
= difference between the two ranks of each observation;
= number of observations.
3. Results
3.1. Variability of parameters and trends
This section characterises the climate and environmental parameters from 1991 to 2021. This characterisation has been done through the analysis of their variability as well as the evaluation of trends in certain parameters, without forgetting the probable breaks and their spatial presentation ().
3.2. Climate and environmental variability
3.2.1. Rainfall variability and evapotranspiration and soil moisture
The variation of precipitation, evapotranspiration (ETA, ETR) and soil moisture data show an oscillating pattern () over the study period considered (1991–2021).
Figure 2. Monthly rainfall variation in Guinea-savannah (a) and Forest-savannah mosaic (b) zones.
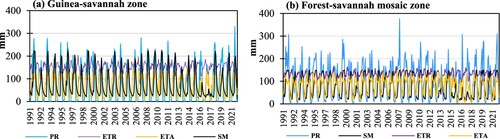
Monthly rainfall amounts range from 0 mm to 332 mm per month in the Guinea savannah zone, and 0 mm to 377 mm per month in the forest-savannah mosaic zone. The ATE, REE and SM vary respectively from 4 mm to 150 mm, 91–204, and 20 mm to 223 mm per month in the Guinea savannah zone while in the forest-savannah mosaic zone, they are respectively, 6–148 mm/month (ATE), 85–165 mm/month (REE) and 15–149 (SM) mm/month. The annual average is 1257.8 mm/year in the forest-savannah mosaic zone, with June, July and September being the wettest months, while in the Guinean savannah zone, it is 1017.9 mm/year, with June, August and September being the wettest months.
3.2.2. Variability of climatic and hydrological drought periods
The analysis of drought periods was assessed by considering climatic drought (SPI) and hydrological drought (PSDI). This assessment allowed us to highlight wet and dry periods in general.
An examination of the climatic drought periods (DPSs) over the period 1991–2021 in the Guinea Savannah area generally shows two main periods: the dry period and the wet period. However, the period is characterised by a situation dominated by moderate humidity followed by a moderate drought after which comes the severe drought period ( and ). Thus, over the whole study period, the years of severe drought and moderate humidity have the same proportions 19.4%, i.e. 6 (six) years in the series studied. Concerning drought periods, they are dominated by moderate and high drought periods with respectively 25.8% and 19.4% of the time series. There are also periods of extreme drought in recent years such as in 2018 and 2019. The hydrological drought ( and ) is more pronounced in this ecological zone. It is marked by periods of extreme drought (3%) without a period of extreme moisture (0). The period is however dominated by periods of Moderate Drought (16.1%); Mild Drought (29%); Incipient Dry Spell (19.4%).
Figure 3. Annual variation of SPI and PDSI in Guinea-Savannah (a) and Forest-savannah mosaic (b) zones.
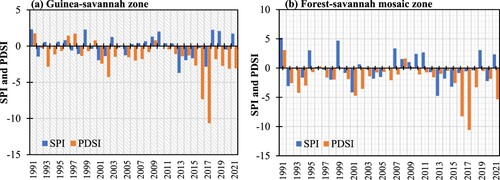
Table 8. Variation in climatic (SPI) (a) and hydrological (PDSI) (b) drought in Guinea-Savannah and Forest-savannah mosaic zones.
As for the Forest-savannah mosaic zone, over the entire study period, extreme humidity and moderate humidity years are dominant (25.8%, i.e. 8 (eight) years each in the series studied. Regarding drought periods, the area also experienced periods of extreme climatic drought (16.1%) and moderate drought (16.1%). There was also a period of high humidity during the 200. The hydrological drought is no less in this ecological zone. It is marked by periods of extreme drought (16.1% or 5 years) with one Very Wet year (3.2%) (1991). The period is however dominated by periods of Mild Drought (25.8%); Incipient Dry Spell (22.6%).
To this end, on a temporal scale, the SPI and PDSI (), indicate the irregular character of rainfall and soil moisture, and thus highlight climatic and hydrological (dry and wet) episodes.
3.2.3. Thermometric variability
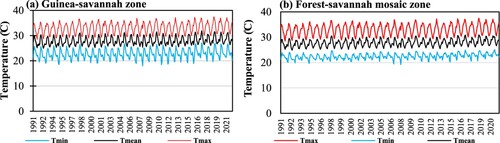
The monthly temperature trend according to the ecoregion () shows that average temperatures (Tmean) vary from 25°C to 31.9°C in the Guinea-savannah zone. These temperatures vary from 24.8°C to 30.9°C in the forest-savanna mosaic zone. Observations of thermal extremes show that:
The maxima (Tmax) varied from 28.5°C to 37.7°C in the two zones (Guinea-savannah and forest-savannah mosaic).
Minima (Tmin) increased from 18°C to 24.7°C in the Guinea Savannah zone, and from 19.2°C to 25°C in the forest-savannah mosaic zone. The year 2019 was the hottest in both ecological zones with average temperatures above 30°C during the dry season with March and April as the hottest months.
Figure 4. Monthly temperature variation in Guinea-Savannah (a) and Forest-savannah mosaic (b) zones.
3.2.4. Relative humidity variability and wind speed
The variation of relative humidity (RH) and wind speed (WS) show an oscillating pattern () over the whole study period (1991–2021).
Monthly relative humidity varies between 12.6% and 82.6% per month in the Guinea-savannah zone, 39.1% to 84.4% per month in the forest-savannah mosaic zone, while wind speed varies between 0.8–2.6 m/s and 0.7–1.8 m/s respectively. The annual average is 56% in the Guinean savannah zone for RH with August and September being the wettest months, 2018 being the wettest year and 2001 the least wet. In the forest-savanna mosaic zone, it is 70.1% (annual average) with July and August as the wettest months, 1995 as the wettest year and 1993 as the least wet. The velocity peaks at 2.6 m/s in the Guinean savannah and 1.8 m/s in the forest-savannah mosaic zone ( and ).
Figure 5. Monthly variation of relative humidity and wind speed in Guinea-Savannah (a) and Forest-savannah mosaic (b) zones.
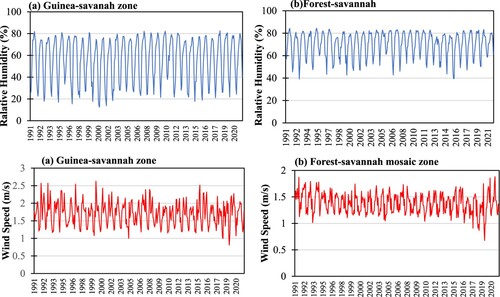
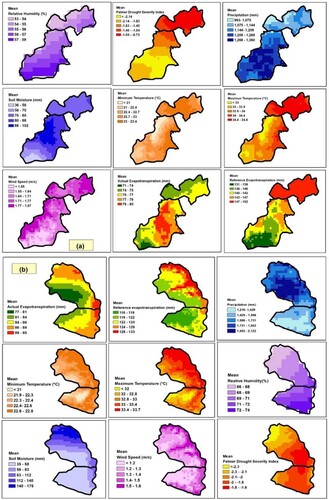
Figure 6. Monthly spatial presentation of climatic and environmental parameters in Guinea-Savannah (a) and Forest-Savannah mosaic (b) zones.
3.3. Trends in climate and environmental time series data
3.3.1. Anomalies and fire risk indicators
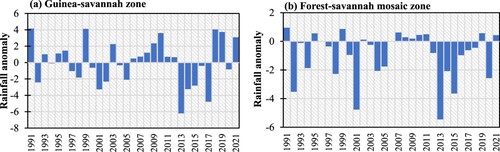
3.3.1.1. Rainfall anomaly
The monthly rainfall anomalies oscillate on either side of the normal (1991–2021) with increasing and decreasing trends. They ranged from −6.2 to +4.1 mm in the Guinean savannah zone, while the forest-savannah mosaic zone recorded anomalies ranging from −3.04 to +2.06 mm. In the forest-savanna mosaic zone, a significant decrease in annual rainfall was identified during the period 2012–2020, preceded by a slight improvement in rainfall from 2007 to 2011. From 2013 to 2017, a significant deterioration in rainfall conditions was recorded, followed by a significant recovery in rainfall from 2018 in the Guinean savannah ().
Figure 7. Annual rainfall anomaly in Guinea-Savannah (a) and Forest-savannah Mosaic (b) zones.
3.3.1.2. Thermometric anomaly
The graphs () show the magnitude of the thermometric anomalies from 1991 to 2021.
Figure 8. Annual thermometric anomaly in Guinea-Savannah (a) and Forest-Savannah mosaic (b) zones.
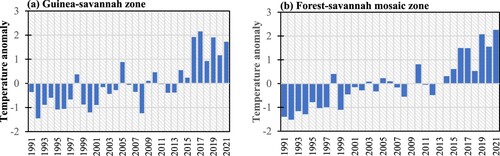
In general, the average monthly temperature is higher than normal (1991–2021) showing an upward trend. The magnitude of monthly temperatures varies from −1.8 to +2.6°C in the Guinean savannah area, while the forest-savannah mosaic area recorded anomalies varying from −2.2 to +2.4°C. These values show a slight increase in temperature in these areas (positive anomaly). This increase is most noticeable during the period 2014–2021 in the Guinean savannah and from 2016 to 2021 in the forest-savannah mosaic zone.
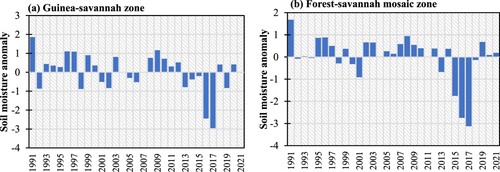
3.3.1.3. Soil moisture anomaly
The graphs () show the anomalies within the soil moisture data series from 1991 to 2021. In general, soil moisture is lower than normal (1991–2021) showing a downward trend. The average monthly moisture varies from −0.96 to +2.3 mm in the Guinean savannah zone, while the forest-savannah mosaic zone recorded anomalies varying from −0.92 to +1.2 mm. These values show an overall decrease in humidity at the level. This is reflected in the mean annual variation with deficits (2013–2017) in both ecological zones with a slight increase in the forest-savanna mosaic zone from 2019 onwards. These phases were preceded by non-uniform periods where oscillations were noticeable in both zones with periods of decline (1992, 1998, 2001, 2002, 2005 and 2006) in the Guinean savannah zone while in the forest-savannah mosaic zone, few deficits were observed (1998, 2000, 2001).
Figure 9. Annual soil moisture anomaly in Guinea-Savannah (a) and Forest-Savannah mosaic (b) zones.
3.3.1.4. Humidity anomaly
Relative humidity, expressed as a percentage, is the ratio of the amount of water in the air to the absorption capacity at a given temperature ().
Figure 10. Annual moisture anomaly in Guinea-Savannah (a) and Forest-Savannah mosaic (b) areas.
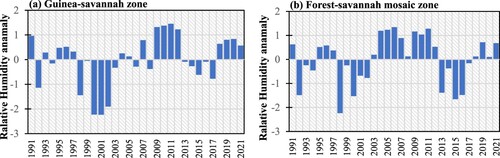
The hygrometric anomalies for this parameter varied from −2.2% to +1.3% in the Guinea-Savannah zone, and from −2.8% to +1.3% in the forest-savannah mosaic zone. The average monthly anomalies are +0.337% and +0.97% in the Guinea-Savannah and Forest-Savannah mosaic zones respectively. From 1991 to 2021, the monthly mean relative humidity varied between 51.2% (January) and 80.95% (July) in the forest-savannah mosaic zone while in the Guinea savannah, it varied from 25.6% (January) to 77.8% (August). Seasonal variations in hygrometry are similar to those of rainfall with maximum rainfall observed in the same months. These hygrometric variations over time, in duration and length, are an indicator of climate change.
3.3.1.5. Fire risk indices (AI and FDI)
The calculated indices were used to assess the fire risk in the two ecological zones considered. Thus different approaches taking into account the same components (relative humidity and precipitation) were evaluated. Thus, in both zones, the indices are opposite in terms of risk. The FDI in both zones shows a higher fire risk in the last 8 years (2013–2021) as well as from 1998 to 2004 interspersed with periods of low fire risk ()
Figure 11. Annual variation of fire risk indices in Guinea-Savannah (a) and Forest-Savannah mosaic (b) areas.
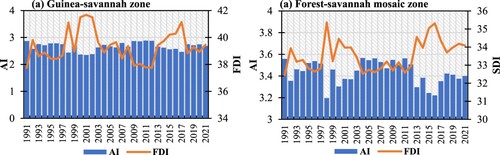
These indices are then correlated with the parameters used as well as the fire parameters (burnt area, active fires) to highlight their capacity to warn about fire danger.
3.3.2. Trends in variables and breaks in rainfall and relative humidity time series data
3.3.2.1. Break in rainfall and humidity series
The detection of breaks in stationarity of rainfall and hygrometry by the Pettitt and Lee-Heighinian tests made it possible to observe a change in the evolution of relative humidity and rainfall from 1982 and 1998 (). The application of the Pettitt test () on the rainfall and relative humidity series did not, however, detect any break in the two ecological zones (statically insignificant test at 95%). On the other hand, the Lee-Heighinian test identified a significant break in 2017 and 2003 respectively for rainfall (PR) and relative humidity in the Guinean savannah zone. In the forest-savanna mosaic zone, 1991 (RP) and 2002 (RH) were detected as break years.
Table 9. Period of HR and SM breakdown in Guinea-Savannah (a) and Forest-Savannah mosaic (b) areas.
3.3.3. Trends of the variables
3.3.3.1. Mann kendall test
The table below shows the results of the Mann-Kendall test applied to the data set.
The Mann-Kendall test () shows a significant increasing trend at the 100% threshold (Z-test > 0) within the minimum (Tmax), maximum (Tmean) and mean (Tmin) temperature data in both ecoregions, except for ETA, PR, RH, WS (Guinea-Savannah zone) and ETA, PR, PDSI, RH, SM (Forest-Savannah mosaic zone), where both non-significant decreasing and increasing trends were identified. The WS shows a significant downward trend in both zones but with a non-significant downward trend detected in the Guinean savannah zone. Across the two ecoregions, ETR showed a significant upward trend, while PDSI showed a significant downward trend in the Guinean zone but not in the Savannah Forest Mosaic zone. ETA, however, shows a significant downward trend (Guinea-Savannah zone) and an upward trend (Forest-Savannah zone). Only SM in the Guinea-Savannah zone and WS in the Forest-Savannah zone are significant at the 10% and 5% levels respectively.
Table 10. Trend of different variables in Guinea-Savannah (a) and Forest-Savannah mosaic (b) areas.
3.3.4. Correlation between fire variables, climatic and environmental variables
3.3.4.1. Spearman correlation between variables, climatic and environmental variables
The correlation matrix () gives a first idea of the associations between variables and climatic variables according to the phytogeographical zone. The correlation between climatic indices, hazard indices and variables was calculated using monthly data. Both negative and positive correlations were significant at p < 0.0.5, p < 0.01 and p < 0.001.
Figure 12. Spearman's correlation matrix in Guinea-Savannah (a) and Forest-savannah mosaic (b) areas (Significant at *p < 0.05; ** p < 0.01; and *** p < 0.001).
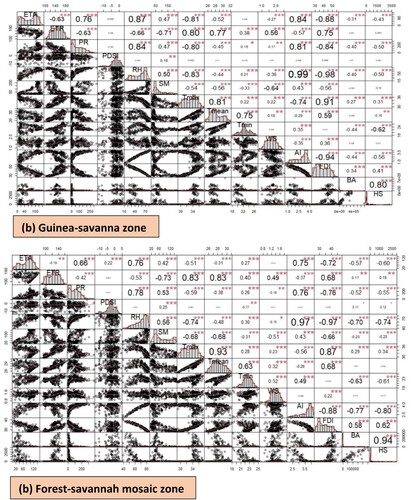
The correlation matrix gives a first idea of the existing relationship between the different climatic, environmental and variables according to the ecoregions. These parameters are relatively well correlated with each other () according to the matrix. In the Guinea-Savannah zone, the statistically insignificant variables (p > 0.05) are WS, Tmean, PDSI, and ETR for the burnt area (BA) and WS, SM, PDSI, ETR for active fires (HS), while for the forest-savannah zone, we have WS, Tmean, PDSI for the two variables (BA and HS). The other variables are highly significant (p < 0.001) except for ETR (p < 0.01) in the forest-savannah zone.
The most correlated variables for BA and HS are Tmin (negative correlation; rho = −0.44 and −0.62), and the fire risk index FDI (positive correlation; rho = 0.34 and 0.41), AI (negative correlation; rho = −0.44 and −0.56) for the Guinean savannah while in the forest-savannah zone, we have: Tmin (negative correlation; rho = −0.63 and −0.61), and the fire risk indices FDI (positive correlation; rho = 0.58 and 0.62), AI (negative correlation; rho = −0.77 and −0.80), RH (negative correlation; rho = −0.74 and −0.74).
In addition, all ecoregions show a proportional negative correlation with precipitation (PR) and a positive correlation with maximum temperature (Tmax).
3.3.4.2. Cross-correlation of fire variables, climatic and environmental variables
Exploratory analyses revealed a strong correlation between certain climatic variables and fire variables. However, correlation does not necessarily lead to causality. To investigate which factors, impact fire dynamics, an intercorrelation was used for the time series. Therefore, cross-correlation functions (CCFs) were calculated between the data series with different lags (−21 to +21 months).
3.3.4.3. CCF between the variables and the burned area
In the Guniea-Savannah area, it is noted that the CCF () reached its maximum at lag 12, −12, and 13 for the variables RH, AI and FDI. The results show that the variables decrease and increase simultaneously, while ETA, ETR, PDSI, SM, and WS evolve oppositely to the burnt areas. CCF peaked at time h = 10 for Tmax, Tmean and Tmin while PR peaked at time h = 0, which shows that temperature and rainfall recorded respectively at month t + 10 and t + 0 are associated with area burnt at month t + 10 and t, thus showing that temperature takes effect from month 10 while the impact of rainfall is noticeable at time t or it is in deficit. On the other hand, the variables SM, ETR, ETA and PDSI reached a peak at lag −3, −1 and −7. These results indicate that these factors influence the area burned about 3 (SM, ETR), 1 (ETA) and 7 (PDSI) months before their occurrence.
Table 11. Cross-correlation function between climatic, environmental and burned area variables in Guinea-Savannah (a) and Forest-Savannah mosaic (b) zones.
For the Forest-Savannah mosaic area, the CCF peaked at lag 12, −2, and 11 for the variables AI, Tmean and FDI. The same variables decrease and increase simultaneously, while PR, PDSI, SM, WS, and AI evolve oppositely to the burnt areas. The CCF in this area peaked at time h = −2 for Tmax and PR peaked at time h = 0, which shows that temperature and rainfall recorded respectively in month t – 2 and t + 0 are associated with the number of areas burnt in month t – 2 and t, thus showing that the impact of temperature takes effect from the second month (vegetation drying) while the impact of rainfall is perceptible at time t where it is deficient. In contrast, the variables SM, ETR, ETA and PDSI peaked at lag −3, −19. These results indicate that these factors influence the area burned about 3 (SM, ETR), and 19 (ETA, PDSI) months before their occurrence (favourable condition).
In general, PDSI does not significantly impact the area burned in the two ecological zones. The rest of the variables contribute to the spread of wildfires.
However, ETR, Tmax, Tmean, Tmin and FDI are the positively correlated variables that influence the area burnt in the Guinea Savannah zone. The other negatively correlated variables show an opposite relationship, while in the Forest-Savannah mosaic zone, ETA, ETR, RH, Tmax, Tmean, Tmin and FDI are the variables that are positively correlated with fire damage.
3.3.4.4. CCF between the variables and the active fires
Concerning the contribution of the variables on the persistence of active fires, it appears that in the Guniea-Savannah area, the CCF () reached its maximum at lag 11, 10 and −1 for the variables ETA, FDI and Tmean. ETA, PR, and WS evolve oppositely to the area burnt. The CCF reached a peak at lag for Tmean (h = 10) and PR (h = −12), which shows that temperature and rainfall recorded respectively at month t + 10 and t-12 are associated with the number of active fires detected at month t + 10, and t-12, thus showing that the impact of temperature takes effect from the tenth month onwards while the impact of rainfall is perceptible at time t – 12 (the twelfth month before the possible passage of fire action). In contrast, the variables SM, ETR, ETA and PDSI peaked at lag –21, −3, 11 and 17. These results indicate that these factors influence active fires about −3 (ETR), −21 (SM), and 11 (ETA) months before and 17 (PDSI) months after their occurrence.
Table 12. Cross-correlation function between climatic, environmental and active fires variables in Guinea-Savannah (a) and Forest-Savannah mosaic (b) zone.
For the Forest-savannah mosaic zone, the CCF peaked at lag −2 and −1 for the variables Tmean and FDI. The correlation is not uniform, as PR, PDSI, SM, WS, and AI evolve in opposite ways to active fires. The CCF in this area peaked at time h = −2 for Tmean, which shows that the temperature recorded in month t–2 is associated with the number of fires detected in month t – 2, thus showing that the impact of temperature takes effect from the second (drying of vegetation) month before it worsens. The variables PR, SM, ETR, ETA and PDSI peaked at lag 0, 9, −3, 8 and 17 respectively. These results indicate that these factors influence or favour active fires about, 9 (SM), 8 (ETA) and 17 (PDSI) before and −3 (ETR) their occurrence, on the other hand, PR does not show a septic month.
In general, PDSI does not significantly impact active fires in the two ecological zones. However, ETR, RH, SM, Tmax, Tmean, Tmin, and FDI are the positively correlated variables influencing area burned in the Guinea savannah zone and the other negatively correlated variables show an opposite relationship, while in the Forest- Savannah mosaic zone, ETA, ETR, RH, Tmax, Tmean, Tmin, and FDI are the variables that positively contribute to fire starts.
4. Discussion
4.1. Variability and trends of climate variables in ecological zones
The study of climatic parameters showed that the study areas face climatic variability during the study period (1991–2021). However, the intensity of the variation was not uniform across the ecological zones. Temperatures have increased over the study period. Average temperatures increased by about +0.8°C (Guinea-Savannah) and +0.2°C (Forest-savannah mosaic zone) over the period (i.e. 0.02° and 0.01°C/year respectively). This increase could be explained by ongoing global changes (IPCC Citation2021). The results of the identified mean temperature trends remain lower in the transition zone but higher in the Guinean savannah to the north than those observed over the whole of Ghana by Abbam et al. Citation2018. They observed that mean decadal temperature has increased by (0.6°C from 26.8°C (1900–1910) to 27.4°C (2006–2015) which according to their research pointed to a national mean temperature increase of 1.6°C over the period 1961–2010 (i.e. 0.03°C/year). However, this value remains in line with the average increase of 0.85°C over the period 1885–2012 (or 0.01°C/year) observed by the IPCC at the global level (IPCC Citation2014) or 0.18°C/decade over the period 1979–2010 (or 0.02°C/year) recorded at the West African level (MoFa Citation2015; Sultan, Defrance, and Iizumi Citation2019). These temperature increases are particularly pronounced during the period 2016–2021 according to the results and will be seen to increase by 0.5°C under RCP 2.6 and 2.5°C under RCP 8.5. Maximum air temperatures are likely to increase by 1°C under RCP 2.6 and 2°C under RCP 8.5 by the year 2080 (Klutse, Owusu, and Boafo Citation2020). The period 2016–2021 is thus recorded nationally as a hot period, corroborating the results found at the local level (Guinea-Savannah and Forest-Savannah mosaic zone) (Issahaku, Campion, and Edziyie Citation2016; Asante and Amuakwa-Mensah Citation2014; Bessah et al. Citation2022). These thermometric increases negatively impact the immediate environment, thus contributing to the spread of wildfires. Thus, the variability of rainfall and temperature recorded in the two ecological zones may have an impact on some parameters that have recorded a downward trend such as SM PDSI. However, the overall HR showed an upward but not significant trend. This result corroborates the results of Dwamena, Tawiah, and Akuoko Kodua Citation2022 which show an increase in RH in the Forest-Savannah zone. However, there was a decrease in overall rainfall in the guinea-Savannah and Forest-Savannah mosaic zones of −0.6 mm and −0.70 mm respectively, which was also linked to global warming (IPCC Citation2021). Similar results were found in West Africa by Nicholson, Funk, and Fink (Citation2018). Similarly, several studies on rainfall and temperature variability at the Ghanaian level (Lacombe, McCartney, and Forkuor Citation2012; Nkrumah et al. Citation2022; Oduro-Afriyie & Adukpo Citation2009; Owusu and Waylen Citation2009; Paeth and Hense Citation2004) and in the different ecological zones (Issahaku, Campion, and Edziyie Citation2016) are consistent with the previous subnational analysis of decreasing rainfall and increasing temperature. The year 1998 was identified as the warmest year within the ecological zones during the first decade of the series studied (1991–2000). Previous observations have shown that 1998 was the warmest year of the twentieth century and had the strongest El Niño Southern Oscillation, resulting in an increase in mean air temperature of 0.5–1°C during the 1997–1998 dry season in Africa (Lean and Rind Citation2009). Extreme climatic conditions would thus favour the occurrence of vegetation fires, which are becoming increasingly frequent on a national scale.
4.2. Climate variability and fire dynamics
Analysis of the relationships between climatic, environmental parameters and indices using Spearman and CCF correlations showed that the best predictors of the number of fires and area burned were ETR, FDI, Tmean, Tmin, Tmax in the Guinea-Savannah zone and ETA, ETR, RH, Tmean, Tmin, Tmax and FDI in the Forest-Savannah mosaic zone. The other covariates were inversely correlated with fire activity. These findings confirm several previous works assessing the impact of climate on wildfires (Kays and Ward Citation2021; Barbero et al. Citation2015; Hanan et al. Citation2021). The increase in temperature and vapour pressure deficit combined with the lack of precipitation has significantly increased the load and aridity of the fuel (vegetation) (Turco et al. Citation2016; Abatzoglou et al. Citation2016). Hanan et al. (Citation2021) have shown that climate change was the key driver of increasing burn probability and the frequency of large fires. Thus, the climate components especially those considered in this research influence the behaviour of wildfires differently. The drier Guinea-Savannah area, for example, does not have the same response to fire events as the wetter Forest-Savannah area because of its proximity to the lake. These different realities have also been highlighted by other authors when considering ecological conditions, such as fire regimes vary over space and time across the globe, and while climate change is a major factor increasing the frequency of large wildfires (Mouillot et al. Citation2003; Abatzoglou and Williams Citation2016). However, it must be emphasised that the increase in humidity is not significant over the study period. Similar results were demonstrated by Guiguindibaye, Belem, and Boussim (Citation2013) who showed that flame heights were inversely correlated with relative humidity in Tanzania. Relative humidity had a strong impact on fire occurrence. Some covariates such as SM and PR, also provide information on their contribution to fire spread. Their negative correlation shows that their decrease favours the start of fires and that their increase limits fires, but the results show a decreasing trend. Thus, we can be sure in this case that they are the second key factors after Tmean, Tmax, Tmin and RH in the study areas (Jones et al. Citation2022).
Long days of low humidity in a month tend to dry out all forest fuels. Even a few days of low humidity can increase fire risk (Xiao, Zhang, and Ji Citation2015). Although AI is not an indicator of fire activity in this research, they indicate the vulnerability of areas to fire as it is well correlated according to Spearman's correlation, which could give an idea of the influence of fire on microclimate (Strydom and Savage Citation2016). Archibald et al. (Citation2009), showed that rainfall and dry season length are determinants of burnt areas in southern Africa. However, in the correlation analyses, FDSI was found to be weakly correlated, despite being the variable that informs on hydrological drought. In addition, the DM shows a negative correlation, which indicates that its decrease would set the stage for the passage of fires. It is correlated with the same CCFmax in both ecological zones. Therefore, it favours the spread of fires in both ecological zones.
It can be difficult to disentangle the impacts of individual drivers on fire activity because fire is the result of the simultaneous occurrence of three factors: a stock of fuel; fire weather conditions that are sufficiently dry to desiccate the fuel; and a human or natural ignition source (Abram et al. Citation2021; Bistinas et al. Citation2014; Forkel et al. Citation2019; Kelley et al. Citation2019; Pausas and Ribeiro Citation2013; Teckentrup et al. Citation2019) Therefore, the influences of climatic variables on the number of fires should not be generalised to other regions of the country or another area of fire activity. Krawchuk et al. (Citation2009) examined global fire occurrence with climatic variables and showed that the average temperature of the warmest month, annual precipitation and the average temperature of the wettest month are the most important explanatory variables. However, this nexus of drivers and constraints on fire leads to debate about the causes of major wildfire events and the contributions of bioclimatic and human factors to those events (Jones et al. Citation2022). Thus, the potential benefits to mitigating avoided fire risk of meeting the 1.5°C ambitious targets of the Paris Agreement rather than the 2.0°C commitment, our results further indicate that weather-related fire risks could also rise substantially if the 2.0°C commitment is not achieved (Jones et al. Citation2022).
5. Conclusion
In the present study, the analysis of climatic and environmental parameters crossed with fire variables allowed us to confirm the effective existence of a relationship between climate variability and fire in the ecological zones considered (Guinea-Savannah and Forest-Savannah mosaic zone) by this research. Indeed, the objective is to find probable correlations and this was done by Spearman's correlation. This correlation was then evaluated and analysed through cross-correlation function (CCF) to detect the most relevant parameters in terms of impact on the fire. The result of this research is that ETR, FDI, Tmean, Tmax, Tmin, RH, ETA and SM are the major influences on fire spread in both ecological zones but with some differences in terms. Mostly temperature is increasing with a decrease in rainfall in both zones as a result of the variability analysis. This study used the Google Earth Engine platform for climate data acquisition. Currently very promising as it can process a very large amount of data in a short time. It is also essential for data storage and is accessible at any time. This should be adopted especially in developing countries as it will allow the data to be updated as the written codes will be preserved and can be updated easily. The innovative aspect of this research is the use of data from artificial intelligence platforms like GEE. This option is one of the few options used in Ghana and will make monitoring less complex in the near or distant future. Thus, in this study, the code can be updated at different times easily to update climate data in the study areas for long-term monitoring of climate variability and its impact not only on fires but on many aspects such as agriculture, flood monitoring and other extreme weather events. This research could lead to the prediction of wildfires using machine learning techniques.
Acknowledgements
The authors are particularly grateful to the University for Development Studies, West African Center for Water, Irrigation and Sustainable Agriculture (WACWISA) for providing logistics to facilitate the completion of this paper.
Disclosure statement
No potential conflict of interest was reported by the author(s).
Data availability statement
Data (climatic and environmental data) used in this paper are respectively available at https://code.earthengine.google.com/fa9846d34c532e5f6d043ad4f7376640; https://code.earthengine.google.com/0eba04b7ded613d5a05e811ea2b5ee36 for Guinea-Savannah zone and Forest-savannah zone and fire data on https://doi.org/10.5281/zenodo.7749206.
Additional information
Funding
References
- Abatzoglou, J. T., S. Z. Dobrowski, S. A. Parks, and K. C. Hegewisch. 2018. “TerraClimate, a High-Resolution Global Dataset of Monthly Climate and Climatic Water Balance from 1958–2015.” Scientific Data 5 (1): 170191. doi:10.1038/sdata.2017.191.
- Abatzoglou, J. T., and A. P. Williams. 2016. “Impact of Anthropogenic Climate Change on Wildfire Across Western US Forests.” Proceedings of the National Academy of Sciences 113 (42): 11770–11775. doi:10.1073/pnas.1607171113.
- Abbam, T., F. A. Johnson, J. Dash, and S. S. Padmadas. 2018. “Spatiotemporal Variations in Rainfall and Temperature in Ghana Over the Twentieth Century, 1900-2014.” Earth and Space Science 5 (120e): 132. doi:10.1002/2017EA000327.
- Abram, N. J., B. J. Henley, A. S. Gupta, T. J. R. Lippmann, H. Clarke, A. J. Dowdy, J. J. Sharples, et al. 2021. “Connections of Climate Change and Variability to Large and Extreme Forest Fires in Southeast Australia.” Communications Earth & Environment 2 (1): 8. doi:10.1038/s43247-020-00065-8.
- Alley, W. M. 1984. “The Palmer Drought Severity Index: Limitations and Assumptions.” J. Climate Appl. Meteor 23 (7): 1100–1109. doi:10.1175/1520-0450(1984)023<1100:TPDSIL>2.0.CO;2
- Alley, W. M. 1985. “The Palmer Drought Severity Index as a Measure of Hydrologic Drought.” Journal of the American Water Resources Association 21 (1): 105–114. doi:10.1111/j.1752-1688.1985.tb05357.x.
- Almer, C., J. Laurent-Lucchetti, and M. Oechslin. 2017. “Water Scarcity and Rioting: Disaggregated Evidence from Sub-Saharan Africa.” Journal of Environmental Economics and Management 86: 193–209. doi:10.1016/j.jeem.2017.06.002
- Angra, D., and K. Sapountzaki. 2022. “Climate Change Affecting Forest Fire and Flood Risk—Facts, Predictions, and Perceptions in Central and South Greece.” Sustainability 14: 13395. doi:10.3390/su142013395.
- Ångström, A. 1949. “Swedish Meteorological Research 1939–1948.” Tellus 1: 60–64. doi:10.3402/tellusa.v1i3.8503
- Archibald, S., D. P. Roy, B. W. Van Wilgen, and R. J. Scholes. 2009. “What Limits Fire? An Examination of Drivers of Burnt Area in Southern Africa.” Global Change Biology 15 (3): 613–630. doi:10.1111/j.1365-2486.2008.01754.x.
- Armah, F. A., J. O. Odoi, Y. G. Tambang, S. Obiri, D. O. Yawson, and E. K. A. Afrifa. 2011. “Food Security and Climate Change in Drought-Sensitive Savanna Zones of Ghana.” Mitigation Adapt. Global Change 16 (3): 291–306. doi:10.1007/s11027-010-9263-9
- Asante, F., and F. Amuakwa-Mensah. 2014. “Climate Change and Variability in Ghana: Stocktaking.” Climate 3 (1): 78–99. doi:10.3390/cli3010078.
- ASCE-EWRI. 2005. “The ASCE Standardized Reference Evapotranspiration Equation.” In Environmental and Water Resources Institute (EWRI) of the American Society of Civil. Engineers, ASCE, Standardization of Reference Evapotranspiration Task Committee Final Report, 213 pp., edited by R. G. Allen, I. A. Walter, and R. L. Elliot. Reston: American Society of Civil Engineers (ASCE).
- Baez, J., G. Caruso, V. Mueller, and C. Niu. 2017. “Heat Exposure and Youth Migration in Central America and the Caribbean.” American Economic Review 107 (5): 446–450. doi:10.1257/aer.p20171053
- Baidu, M., L. K. Amekudzi, J. N. A. Aryee, and T. Annor. 2017. “Assessment of Long-Term Spatio-Temporal Rainfall Variability over Ghana Using Wavelet Analysis”. 1–24. https://doi.org/10.3390/cli5020030.
- Barbero, R., J. T. Abatzoglou, N. K. Larkin, C. A. Kolden, and B. Stocks. 2015. “Climate Change Presents Increased Potential for Very Large Fires in the Contiguous United States.” International Journal of Wildland Fire 24 (7): 892. doi:10.1071/WF15083.
- Bergaoui, M., and A. Alouini. 2001. “Caractérisation de la Sécheresse Météorologique et Hydrologique: Cas du Bassin Versant de Siliana, en Tunisie.” Sécheresse 12 (4): 205–213.
- Bessah, E., W. Amponsah, S. O. Ansah, A. Afrifa, B. Yahaya, C. S. Wemegah, M. Tanu, L. K. Amekudzi, and W. A. Agyare. 2022. “Climatic Zoning of Ghana Using Selected Meteorological Variables for the Period 1976–2018.” Meteorological Applications 29 (1): 1–15. doi:10.1002/met.2049.
- Bilgili, E., and B. Saglam. 2003. “Fire Behaviour in Maquis Fuels in Turkey.” Forest Ecology and Management 184: 201–207. doi:10.1016/S0378-1127(03)00208-1
- Bistinas, I., S. P. Harrison, I. C. Prentice, and J. M. C. Pereira. 2014. “Causal Relationships Versus Emergent Patterns in the Global Controls of Fire Frequency.” Biogeosciences (online) 11 (18): 5087–5101. doi:10.5194/bg-11-5087-2014.
- Bond, W., and J. Keeley. 2005. “Fire as a Global ‘Herbivore’: The Ecology and Evolution of Flammable Ecosystems.” Trends in Ecology & Evolution 20 (7): 387–394. doi:10.1016/j.tree.2005.04.025.
- Bond, W. J., and B. W. van Wilgen. 1996. “Why and How Do Ecosystems Burn?” In Fire and Plants, edited by M. B. Uscher, D. L. DeAngelis, and B. F. J. Manly, 16–33. London: Chapman and Hall.
- Bougara, H., K. B. Hamed, C. Borgemeister, B. Tischbein, and N. Kumar. 2020. “Analyzing Trend and Variability of Rainfall in The Tafna Basin (Northwestern Algeria).” Atmosphere 11 (4): 347. doi:10.3390/atmos11040347.
- Cai, W., K. Yang, L. Wu, G. Huang, A. Santoso, B. Ng, G. Wang, and T. Yamagata. 2021. “Opposite Response of Strong and Moderate Positive Indian Ocean Dipole to Global Warming.” Nature Climate Change 11 (1): 27–32. doi:10.1038/s41558-020-00943-1.
- Cervigni, R., R. Liden, J. E. Neumann, and K. M. Strzepek. 2015. Enhancing the Climate Resilience of Africa’s Infrastructure: The Power and Water Sectors. The World Bank, doi:10.1596/978-1-4648-0466-3.
- Chandler, C., P. Cheney, P. Thomas, L. Trabaud, and D. Williams. 1983. “Fire in Forestry. v.1: Forest Fire Behavior and Effects. – v. 2: Forest Fire Management and Organisation”. https://agris.fao.org/agris-search/search.do?recordID = XF2016009795.
- Chen, Y., D. M. Romps, J. T. Seeley, S. Veraverbeke, W. J. Riley, Z. A. Mekonnen, and J. T. Randerson. 2021. “Future Increases in Arctic Lightning and Fire Risk for Permafrost Carbon.” Nature Climate Change 11 (5): 404–410. doi:10.1038/s41558-021-01011-y.
- CILSS. 2016. “Landscapes of West Africa – A Window on a Changing World”. U.S. Geological Survey EROS, United States.
- CIR (Global Climate Risk Index). . 2021. “Who Suffers Most from Extreme Weather Events? Weather-Related Loss Events in 2019 and 2000-2019”. David Eckstein, Vera Künzel, Laura Schäfer, Global Climate Risk Index … GERMANWATCH, 16th Edition (2021), 52.
- Clapeyron, ÉBP. 1834. “Mémoire sur la Puissance Motrice du feu.” Journal de L’École Royal Polytechnique XXIII (XIV): 153–190.
- Clausius, R. J. E. 1850. “Über die bewegende Kraft der Wärme und die Gesetze, welche sich daraus für die Wärmelehre selbst ableiten lassen.” Annalen der Physik und Chemie 79: 368–397., 500–524. [English trans: Id., On the Motive Power of Heat and on the Laws Which Can be Deduced from it for the Theory of Heat Itself. In: Mendoza, E. (ed) (1960). Refections on the Motive Power of Fre and Other Papers on the Second Law of Thermodynamics by E Clapeyron and R Clausius (73–74, 109–152). New York: Dover]. doi:10.1002/andp.18501550306
- Córdova, M., G. Carrillo-Rojas, P. Crespo, B. Wilcox, and R. Célleri. 2015. “Evaluation of the Penman-Monteith (FAO 56 PM) Method for Calculating Reference Evapotranspiration Using Limited Data.” Mountain Research and Development 35 (3): 230. doi:10.1659/MRD-JOURNAL-D-14-0024.1.
- CSIR-WRI. 2000. “Climate Change Vulnerability and Adaptation Assessment on Water Resources of Ghana”. CSIR-Water Research Institute, Accra. 221 pp.
- Dinku, T. 2019. “Challenges with Availability and Quality of Climate Data in Africa.” In Extreme Hydrology and Climate Variability, edited by Assefa M. Melesse, Wossenu Abtew, and Gabriel Senay, 71–80. Elsevier. doi:10.1016/B978-0-12-815998-9.00007-5.
- Dinku, T., P. Block, J. Sharoff, K. Hailemariam, D. Osgood, J. del Corral, R. Cousin, and M. C. Thomson. 2014. “Bridging Critical Gaps in Climate Services and Applications in Africa.” Earth Perspectives 1 (1): 15. doi:10.1186/2194-6434-1-15.
- Dinku, T., M. C. Thomson, R. Cousin, J. del Corral, P. Ceccato, J. Hansen, and S. J. Connor. 2018. “Enhancing National Climate Services (ENACTS) for Development in Africa.” Climate and Development 10 (7): 664–672. doi:10.1080/17565529.2017.1405784.
- Donat, M. G., O. Angélil, and A. M. Ukkola. 2019. “Intensification of Precipitation Extremes in the World’s Humid and Water-Limited Regions.” Environmental Research Letters 14 (6): 065003. doi:10.1088/1748-9326/ab1c8e.
- Dwamena, H. A., K. Tawiah, and A. S. Akuoko Kodua. 2022. “The Effect of Rainfall, Temperature, and Relative Humidity on the Yield of Cassava, Yam, and Maize in the Ashanti Region of Ghana.” International Journal of Agronomy 2022: 1–12. doi:10.1155/2022/9077383.
- ECOWAS. 2021. “ECOWAS Hydromet Initiative: Strengthening Weather, Climate and Water Services in West Africa – Analytical Report”. Abuja.
- Environmental Protection Agency (EPA). 2011. . “Ghana’s Second National Communication (GSNC)” to the UNFCCC; United Nations Development Programme: New York, NY, USA.
- Ficklin, D. L., J. T. Abatzoglou, S. M. Robeson, and A. Dufficy. 2016. “The Influence of Climate Model Biases on Projections of Aridity and Drought.” Journal of Climate 29 (4): 1269–1285. doi:10.1175/JCLI-D-15-0439.1.
- Finkelstein, J. S., J. Monti, J. P. Masterson, and D. A. Walter. 2022. “Application of a Soil-Water-Balance Model to Estimate Annual Groundwater Recharge for Long Island”. New York, 1900–2019: U.S. Geological Survey Scientific Investigations Report 2021–5143, 25 p., https://doi.org/10.3133/sir20215143.
- Flannigan, M. D., M. A. Krawchuk, W. J. de Groot, B. M. Wotton, and L. M. Gowman. 2009. “Implications of Changing Climate for Global Wildland Fire.” International Journal of Wildland Fire 18 (5): 483. doi:10.1071/WF08187.
- Forkel, M., N. Andela, S. P. Harrison, G. Lasslop, M. van Marle, E. Chuvieco, W. Dorigo, et al. 2019. “Emergent Relationships with Respect to Burned Area in Global Satellite Observations and Fire-Enabled Vegetation Models.” Biogeosciences (online) 16 (1): 57–76. doi:10.5194/bg-16-57-2019.
- Freitas, Mas. 2005. “Um sistema de suporte à decisão para o monitoramento de secas meteorológicas em regiões semi- áridas.” Rev. Tecnol 19 (1): 84–95. doi:10.5020/23180730.1998.1175.
- Fristch, J. M., J. M. Masson, and B. Marieu. 1998. “Identification, caractérisation et conséquences d’une variabilité hydrologique en Afrique de l’Ouest et Centrale”. In: Water Resources Variability in Africa during the XXth Century ed. by E. Servat, D. Hughes, J.M. Fritsch & M. Hulme) (Proc. Abidjan’98 Conference), 323-337, IAHS Publ. no. 252.
- Funk, C., P. Peterson, M. Landsfeld, D. Pedreros, J. Verdin, S. Shukla, G. Husak, et al. 2015. “The Climate Hazards Infrared Precipitation with Stations—A new Environmental Record for Monitoring Extremes.” Scientific Data 2 (1): 150066. doi:10.1038/sdata.2015.66.
- Garnier, L. K. M., and I. Dajoz. 2001. “The Influence of Fire on the Demography of a Dominant Grass Species of West African Savannas, Hyparrhenia diplandra.” Journal of Ecology 89: 200–208. doi:10.1046/J.1365-2745.2001.00532.X.
- Gillett, N. P., A. J. Weaver, F. W. Zwiers, and M. D. Flannigan. 2004. “Detecting the Effect of Climate Change on Canadian Forest Fires.” Geophysical Research Letters 31: L18211. doi:10.1029/2004GL020876.
- Gorelick, N., M. Hancher, M. Dixon, S. Ilyushchenko, D. Thau, and R. Moore. 2017. “Google Earth Engine: Planetary-Scale Geospatial Analysis for Everyone.” Remote Sensing of Environment 202: 18–27. doi:10.1016/j.rse.2017.06.031
- Guiguindibaye, M., M. O. Belem, and J. I. Boussim. 2013. “Caractéristiques des feux dans un incendie en savane soudanienne au Tchad.” International Journal of Biological and Chemical Sciences 7 (3): 1147. doi:10.4314/ijbcs.v7i3.21.
- Ham, Y.-G. 2018. “El Niño Events Will Intensify Under Global Warming.” Nature 564: 192–193. https://www.nature.com/articles/d41586-018-07638-w#ref-CR3 (20 Oct 2019). doi:10.1038/d41586-018-07638-w
- Hanan, E. J., J. Ren, C. L. Tague, C. A. Kolden, J. T. Abatzoglou, R. R. Bart, M. C. Kennedy, M. Liu, and J. C. Adam. 2021. “How Climate Change and Fire Exclusion Drive Wildfire Regimes at Actionable Scales.” Environmental Research Letters 16 (2): 024051. doi:10.1088/1748-9326/abd78e.
- Hatfield, J. L., and J. H. Prueger. 2015. “Temperature Extremes: Effect on Plant Growth and Development.” Weather and Climate Extremes 10: 4–10. doi:10.1016/J.WACE.2015.08.001.
- Hegewisch, K. C., and J. T. Abatzoglou. 2020. “Data Download’ Web Tool”. Climate Toolbox (https://climatetoolbox.org/), version 2020-04-17.
- Hennenberg, K. J., F. Fischer, K. Kouadio, D. Goetze, B. Orthmann, K. E. Linsenmair, F. Jeltsch, and S. Porembski. 2006. “Phytomass and Fire Occurrence Along Forest–Savanna Transects in the Comoe National Park, Ivory Coast.” Journal of Tropical Ecology 22: 303–311. doi:10.1017/S0266467405003007.
- Hu, Y., and Y. Dong. 2018. “An Automatic Approach for Land Change Detection and Land Updates Based on Integrated NDVI Timing Analysis and the CVAPS Method with GEE Support.” Isprs Journal of Photogrammetry and Remote Sensing 146: 347–359. doi:10.1016/j.isprsjprs.2018.10.008.
- Hubert, P., and J. P. Carbonnel. 1993. “Segmentation Annual Series of Major African Rivers Flow.” Bulletin de Liaison du Comite Interafricain d'Etudes Hydrauliques (CIEH). ISSN: 0379-3478; 3-10.
- Incoom, A. B. M., K. A. Adjei, and S. N. Odai. 2020. “Rainfall Variabilities and Droughts in the Savannah Zone of Ghana from 1960-2015.” Scientific African 10: e00571. doi:10.1016/j.sciaf.2020.e00571.
- IPCC. 2014. “Climate Change”. Synthesis Report. Contribution of Working Groups I, II and III to the Fifth Assessment Report of the Intergovernmental Panel on Climate Change; Pachauri, R.K., Meyer, L.A., Eds; IPCC: Geneva, Switzerland, 2014.
- IPCC. 2021. “Summary for Policymakers. In: Climate Change 2021: The Physical Science Basis”. Contribution of Working Group I to the Sixth Assessment Report of the Intergovernmental Panel on Climate Change [Masson-Delmotte, V., P. Zhai, A. Pirani, S.L. Connors, C. Péan, S. Berger, N. Caud, Y. Chen, L. Goldfarb, M.I. Gomis, M. Huang, K. Leitzell, E. Lonnoy, J.B.R. Matthews, T.K. Maycock, T. Waterfield, O. Yelekçi, R. Yu, and B. Zhou (eds.)]. In Press.
- Issahaku, A.-R., B. B. Campion, and R. Edziyie. 2016. “Rainfall and Temperature Changes and Variability in the Upper East Region of Ghana: CLIMATE CHANGE AND VARIABILITY.” Earth and Space Science 3 (8): 284–294. doi:10.1002/2016EA000161.
- Jones, M. W., J. T. Abatzoglou, S. Veraverbeke, N. Andela, G. Lasslop, M. Forkel, A. J. P. Smith, et al. 2022. “Global and Regional Trends and Drivers of Fire Under Climate Change.” Reviews of Geophysics 60 (3): 1–76. doi:10.1029/2020RG000726.
- Jury, M. R. 2002. “Economic Impacts of Climate Variability in South Africa and Development of Resource Prediction Models.” Journal of Applied Meteorology 41 (1): 46–55.
- Karl, T., and R. W. Knight. 1985. “Atlas of Monthly Palmer Hydrological Drought Indices (1931–1983) for the Contiguous United States”. National Climatic Data Centre, 319 pp.
- Kasei, R. A. 2010. “Modelling Impacts of Climate Change on Water Resources in the Volta Basin, West Africa”. ZEF Bonn, 195.
- Kasei, R. A., A. Barnabas, and B. Ampadu. 2014. “The Nexus of Changing Climate and Impacts on Rainfed Water Supply and Fresh Water Availability for the Inhabitants of Densu Basin and Parts of Accra—Ghana”, West Africa. 13.
- Kays, L., and R. Ward. 2021. “Wildland Fire and Climate Change Impacts in the Southern United States”. NC State Climate Office, North Carolina State University, 5.
- Kelley, D. I., I. Bistinas, R. Whitley, C. Burton, T. R. Marthews, and N. Dong. 2019. “How Contemporary Bioclimatic and Human Controls Change Global Fire Regimes.” Nature Climate Change 9 (9): 690–696. doi:10.1038/s41558-019-0540-7.
- Kendall, M. 1975. Rank Correlation Methods. London: Charles Griffin. 4ème édition.
- Klutse, N. A. B., K. Owusu, and Y. A. Boafo. 2020. “Projected Temperature Increases Over Northern Ghana.” SN Applied Sciences 2 (8): 1339. doi:10.1007/s42452-020-3095-3.
- Koudahe, K., A. J. Kayode, A. O. Samson, A. A. Adebola, and K. Djaman. 2017. “Trend Analysis in Standardized Precipitation Index and Standardized Anomaly Index in the Context of Climate Change in Southern Togo.” Atmos. Clim. Sci 7: 401. doi:10.4236/acs.2017.74030.
- Krawchuk, M. A., M. A. Moritz, M. A. Parisien, J. Van Dorn, and K. Hayhoe. 2009. “Global Pyrogeography: The Current and Future Distribution of Wildfire.” PLoS ONE 4 (4): e5102. doi:10.1371/journal.pone.0005102.
- Kumar, L., and O. Mutanga. 2018. “Google Earth Engine Applications Since Inception: Usage, Trends, and Potential.” Remote Sensing 10 (10): 1509. doi:10.3390/rs10101509.
- Kushawaha, J., S. Borra, A. K. Kushawaha, G. Singh, and P. Singh. 2021. “Climate Change and its Impact on Natural Resources.” In Water Conservation in the Era of Global Climate Change, edited by Binota Thokchom, Pengpeng Qiu, Pardeep Singh, and Parameswar K. Iyer, 333–346. Elsevier. doi:10.1016/B978-0-12-820200-5.00002-6
- Lacombe, G., M. McCartney, and G. Forkuor. 2012. “Drying Climate in Ghana Over the Period 1960–2005: Evidence from the Resampling-Based Mann-Kendall Test at Local and Regional Levels.” Hydrological Sciences Journal 57: 1594–1609. doi:10.1080/02626667.2012.728291
- Lall, S., and B. Mathibela. 2016. “The Application of Artificial Neural Networks for Wildfire Riskprediction, in: 2016, International Conference on Robotics and Automation for Humanitarian Applications (RAHA).” In: Presented at the 2016 International Conference on Robotics and Automation for Humanitarian Applications (RAHA), pp. 1–6. https://doi.org/10.1109/RAHA.2016.7931880.
- Laube, W., B. Schraven, and M. Awo. 2012. “Smallholder Adaptation to Climate Change: Dynamics and Limits in Northern Ghana.” Climatic Change 111: 753–774. doi:10.1007/10584-011-01991.
- Laux, P., H. Kunstmann, and A. Bárdossy. 2008. “Predicting the Regional Onset of the Rainy Season in West Africa.” Int. J. Climatol 28 (3): 329–342. doi:10.1002/joc.1542
- Lean, J. L., and D. H. Rind. 2009. “How Will Earth’s Surface Temperature Change in Future Decades?” Geophysical Research Letters 36 (15): L15708. doi:10.1029/2009GL038932.
- Legras, O. 2014. “Evolution du bilan hydrique à l’échelle de bassins-versantsen contexte de changement climatique, Mise en place d’une méthodologie”. Mémoire de fin d’études, Formation Ingénieur à AgroSup Dijon, Formation Continue, Institut national supérieur des sciences agronomiques de l’alimentation et de l’environnement, 114 p.
- Lyon, Z. D., P. Morgan, C. S. Stevens-Rumann, A. M. Sparks, R. F. Keefe, and A. M. S. Smith. 2018. “Fire Behaviour in Masticated Forest Fuels: Lab and Prescribed Fire Experiments.” International Journal of Wildland Fire 27 (4): 280. doi:10.1071/WF17145.
- Maino, R., and D. Emrullahu. 2022. “Climate Change in Sub- Saharan Africa’s Fragile States.” 31. Mann, H.B. Nonparametric tests against trend. Econometrica. 1945 13 (3): 245. doi:10.2307/1907187.
- Mann, H. B. 1945. “Nonparametric Tests Against Trend.” Econometrica 13 (3): 245. doi:10.2307/1907187.
- McKee, T. B., N. J. Doesken, and J. Kleist. 1993. “The Relationship of Drought Frequency and Duration to Time Scale.” In Proceedings of the Eighth Conference on Applied Climatology, Anaheim, California, 17-22 January 1993, 179–184. Boston: American Meteorological Society.
- Mcnally, A., K. Arsenault, S. Kumar, S. Shukla, P. Peterson, S. Wang, C. Funk, C. D. Peters-Lidard, and J. P. Verdin. 2017. “A land data assimilation system for sub-Saharan Africa food and water security applications.” Scientific Data 4. 170012.
- Meikle, S., and J. Heine. 1987. “A Fire Danger Index System for the Transvaal Lowveld and Adjoining Escarpment Areas.” South African Forestry Journal 143 (1): 55–56. doi:10.1080/00382167.1987.9630304
- Menczer, K., and E. Quaye. 2006. “Environmental Threats and Opportunities Assessment”. (FAA 118/9 Assessment). USAID/Ghana, (September), 1–86.
- MoFa, . 2015. “Ministry of Agriculture”, https://mofa.gov.gh/site/sports/district-directorates/upper-east-region/267-kassena-nankana-west.
- Molina, J. R., A. González-Cabán, and F. Rodríguez y Silva. 2019. “Potential Effects of Climate Change on Fire Behavior, Economic Susceptibility and Suppression Costs in Mediterranean Ecosystems: Córdoba Province, Spain.” Forests 10: 679. doi:10.3390/f10080679.
- Mouillot, F., J. P. Ratte, R. Joffre, J. M. Moreno, and S. Rambal. 2003. “Some Determinants of the Spatio-Temporal Fire Cycle in a Mediterranean Landscape (Corsica, France).” Landscape Ecology 18: 665–674. doi:10.1023/B:LAND.0000004182.22525.A9.
- Mutanga, O., and L. Kumar. 2019. “Google Earth Engine Applications.” Remote Sensing 11 (5): 591. doi:10.3390/rs11050591.
- Nicholson, S. E., C. Funk, and A. H. Fink. 2018. “Rainfall Over the African Continent from the 19th Through the 21st Century.” Global and Planetary Change 165: 114–127. doi:10.1016/j.gloplacha.2017.12.014.
- Nkrumah, F., K. A. Quagraine, K. T. Quagraine, C. Wainwright, G. M. L. D. Quenum, A. Amankwah, and N. A. B. Klutse. 2022. “Performance of CMIP6 HighResMIP on the Representation of Onset and Cessation of Seasonal Rainfall in Southern West Africa.” Atmosphere 13 (7): 999. doi:10.3390/atmos13070999.
- Oduro-Afriyie, K., and D. Adukpo. 2009. “Spectral Characteristics of the Annual Mean Rainfall Series in Ghana”. West Afr.” J. Appl. Ecol 9: 15–18. doi:10.4314/wajae.v9i1.45687.
- Oliveras, I, L.O. Anderson, and Y. Malhi. 2014. “Application of remote sensing to understanding fire regimes and biomass burning emissions of the tropical Andes.” Global Biogeochemical Cycles 28 (4): 480–496. doi:10.1002/2013GB004664.
- Overpeck, J. T., G. A. Meehl, S. Bony, and D. R. Easterling. 2011. “Climate Data Challenges in the 21st Century.” Science 331 (6018): 700–702. doi:10.1126/science.1197869.
- Owusu, K., and P. Waylen. 2009. “Trends in Spatio-Temporal Variability in Annual Rainfall in Ghana (1951-2000).” Weather 64 (5): 115–120. doi:10.1002/wea.255.
- Paeth, H., and A. Hense. 2004. “SST Versus Climate Change Signals in West African Rainfall: 20th-Century Variations and Future Projections.” Clim. Chang 65: 179–208. doi:10.1023/B:CLIM.0000037508.88115.8a.
- Palmer, W. C. 1965. “Meteorological Drought. U. S. Weather Bureau Res. Paper No. 45.
- Pausas, J. G., and E. Ribeiro. 2013. “The Global Fire-Productivity Relationship: Fire and Productivity.” Global Ecology and Biogeography 22 (6): 728–736. doi:10.1111/geb.12043.
- Penman, H. L. 1948. “Natural Evaporation from Open Water, Bare Soil and Grass.” Proc. R. Soc. A 193: 120–145.
- Pettitt, A. 1979. “A non-Parametric Approach to the Change Point Problem.” Applied Statistics 28 (2): 126–135. doi:10.2307/2346729
- Ramsey, P. H. 1989. “Critical Values for Spearman’s Rank Order Correlation.” J. Educ. Stat 14: 245–253.
- Rooy, M.P. van. 1965. “A Rainfall Anomaly Index Independent of Time and Space.” Notos 14: 43p.
- Sazib, N., I. Mladenova, and J. Bolten. 2018. “Leveraging the Google Earth Engine for Drought Assessment Using Global Soil Moisture Data.” Remote Sensing 10 (8): 1265. doi:10.3390/rs10081265.
- Shumway, R. H., and D. S. Stoffer. 2011. Time Series Analysis and Its Applications with R Examples Third Edition, 202. USA: Springer.
- Sidhu, N., E. Pebesma, and G. Câmara. 2018. “Using Google Earth Engine to Detect Land Cover Change: Singapore as a use Case.” European Journal of Remote Sensing 51 (1): 486–500. doi:10.1080/22797254.2018.1451782.
- Siraj, K. T., A. Mohammed, S. Bam, and S. Addisu. 2013. “Long Years Comparative Climate Change Trend Analysis in Terms of Temperature, Coastal Andhra Pradesh, India.” Abhinav Natl. Mon. Refereed J. Res. Sci. Technol 2: 1177–2274.
- Smith, J., and S. Hitz. 2003. “Background Paper: Estimating Global Impacts from Climate Change”. 101.
- Stocks, B. J., M. A. Fosberg, T. J. Lynham, L. Mearns, B. M. Wotton, Q. Yang, J. Z. Jin, et al. 1998. “Climate Change and Forest Fire Potential in Russian and Canadian Boreal Forests.” Climatic Change 38 (1): 1–13. doi:10.1023/A:1005306001055.
- Strydom, S., and M. J. Savage. 2016. “A Spatio-Temporal Analysis of Fires in South Africa.” South African Journal of Science 112 (11-12): 1–8. doi:10.17159/sajs.2016/20150489.
- Sultan, B., D. Defrance, and T. Iizumi. 2019. “Evidence of Crop Production Losses in West Africa due to Historical Global Warming in two Crop Models.” Scientific Reports 9 (1): 12834. doi:10.1038/s41598-019-49167-0.
- Svoboda, M., and B. Fuchs. 2016. “Handbook of Drought Indicators and Indices” (Issue 1173). https://doi.org/10.1201/9781315265551-12.
- Tamiminia, H., B. Salehi, M. Mahdianpari, L. Quackenbush, S. Adeli, and B. Brisco. 2020. “Google Earth Engine for geo-big Data Applications: A Meta-Analysis and Systematic Review.” ISPRS Journal of Photogrammetry and Remote Sensing 164: 152–170. doi:10.1016/j.isprsjprs.2020.04.001
- Tarif, K. 2022. “Climate Change and Violent Conflict in West Africa: Assessing the Evidence.” Stockholm International Peace Research Institute No. 2022/3. doi:10.55163/VHIY5372.
- Teckentrup, L., S. P. Harrison, S. Hantson, A. Heil, J. R. Melton, M. Forrest, F. Li, et al. 2019. “Response of Simulated Burned Area to Historical Changes in Environmental and Anthropogenic Factors: A Comparison of Seven Fire Models.” Biogeosciences (online) 16 (19): 3883–3910. doi:10.5194/bg-16-3883-2019.
- Thomas, J., A. J. G, K. D. Ametsitsi, C. Murray, S. Adu-Bredu, I. Oliveras, E. T. A. Mitchard, and E. M. Veenendaal. 2018. “Extending the Baseline of Tropical dry Forest Loss in Ghana (19842015) Reveals Drivers of Major Deforestation Inside a Protected Area.” Biological Conservation 218: 163–172. doi:10.1016/j.biocon.2017.12.004
- Thornthwaite, C. W., and J. R. Mather. 1955. ““The Water Balance: Centerton” N.J., Laboratory of Climatology.” Publications in Climatology, v 8 (1): 1–104.
- Traore, S. B., A. Ali, S. H. Tinni, M. Samake, I. Garba, I. Maigari, A. Alhassane, et al. 2014. “AGRHYMET: A Drought Monitoring and Capacity Building Center in the West Africa Region.” Weather Climatic Extremes 3: 22–30. doi:10.1016/j.wace.2014.03.008.
- Trenberth, K., J. Fasullo, and T. Shepherd. 2015. “Attribution of Climate Extreme Events.” Nature Climate Change 5: 725–730. doi:10.1038/nclimate2657
- Trisos, C. H., I. O. Adelekan, E. Totin, A. Ayanlade, J. Efitre, A. Gemeda, K. Kalaba, et al. 2022. “Africa. In: Climate Change: Impacts, Adaptation and Vulnerability”. Contribution of Working Group II to the Sixth Assessment Report of the Intergovernmental Panel on Climate Change [H.-O. Pörtner, D.C. Roberts, M. Tignor, E.S. Poloczanska, K. Mintenbeck, A. Alegría, M. Craig, S. Langsdorf, S. Löschke, V. Möller, A. Okem, B. Rama (eds.)]. Cambridge University Press, Cambridge, UK and New York, NY, USA, pp. 1285–1455, https://doi.org/10.1017/9781009325844.011.
- Trollope, W. S. W. 1984. ““Fire in Savanna”.” In Ecological Effects of Fire in South African Ecosystems. Ecological Studies, vol 48, edited by P. V. de Booysen, and N. M. Tainton. Berlin, Heidelberg: Springer. doi:10.1007/978-3-642-69805-7_7
- Trollope, W. S. W., and L. A. Trollope. 2002. “Fire Behaviour a Key Factor in the Fire Ecology of African Grassland and Savannas.” In Forest Fire Research and Wildland Fire Safety, edited by DX Viegas, 1–15. Rotterdam, the Netherlands: Millpress.
- Turco, M., J. Bedia, F. Di Liberto, P. Fiorucci, J. von Hardenberg, N. Koutsias, M.-C. Llasat, F. Xystrakis, and A. Provenzale. 2016. “Decreasing Fires in Mediterranean Europe.” PLOS ONE 11 (3): e0150663. doi:10.1371/journal.pone.0150663.
- United Nations Environment Programme. 2022. “Spreading like wildfire – The rising threat of extraordinary landscape fires”. A UNEP Rapid Response Assessment. https://www.unep.org/resources/report/spreading-wildfire-rising-threat-extraordinary-landscape-fires.
- Wang-Erlandsson, L., W. G. M. Bastiaanssen, H. Gao, J. Jägermeyr, G. B. Senay, A. I. J. M. van Dijk, J. P. Guerschman, P. W. Keys, L. J. Gordon, and H. H. G. Savenije. 2016. “Global Root Zone Storage Capacity from Satellite-Based Evaporation.” Hydrology and Earth System Sciences 20 (4): 1459–1481. doi:10.5194/hess-20-1459-2016.
- Wascal. 2021. “Climate change and food security in west Africa”. Edited by Ahmadou Aly Mbaye, Joachim von Braun, Alisher Mirzabaev and Fatou Gueye. Retreived from proceedings-conference-on-climate-change-and-food-security-in-west-africa-1-1.pdf (wascal.org) (consulted 19/10/2022).
- Wentz, J. 2015. “Considering the Effects of Climate Change on Natural Resources in Environmental Review and Planning Documents”. 72.Sabin Center for Climate Change Law Columbia Law School 435 West 116th Street New York, NY 10027
- Werick, W. J., G. E. Willeke, N. B. Guttman, J. R. M. Hosking, and J. R. Wallis. 1994. “National Drought Atlas Developed.” Eos, Trans. Amer. Geophys. Union 75: 89–90. doi:10.1029/94EO00706.
- Westenbroek, S. M., V. A. Kelson, W. R. Dripps, R. J. Hunt, and K. R. Bradbury. 2010. “SWB-A modified Thornthwaite-Mather Soil-Water-Balance code for estimating groundwater recharge.” U.S. Geological Survey Techniques and Methods 6–A31. 60 p.
- Westerling, A. L., H. G. Hidalgo, D. R. Cayan, and T. W. Swetnam. 2006. “Warming and Earlier Spring Increase Western US Forest Wildfire Activity.” Science 313: 940–943. doi:10.1126/SCIENCE.1128834.
- Willis, C., B. Van Wilgen, K. Tolhurst, C. Everson, P. D’Abreton, L. Pero, and G. Fleming. 2001. "Development of a National Fire Danger Rating System for South Africa; Pretoria, South Africa"Report number: ENV-P-C 2000-073Affiliation: CSIR Water, Environment and Forestry Technology doi:10.13140/RG.2.1.4562.7760
- Wimberly, M., C. Dwomoh, F. K. Numata, I. Mensah, F. Amoako, J. D. M. Nekorchuk, and A. McMahon. 2022. “Historical Trends of Degradation, Loss, and Recovery in the Tropical Forest Reserves of Ghana.” International Journal of Digital Earth 15 (1): 30–51. doi:10.1080/17538947.2021.2012533.
- World Meteorological Organisation (WMO). 2021. “State of the Global Climate 2020 (WMO-No. 1264)”. WMO.
- Xiao, Y., X. Zhang, and P. Ji. 2015. “Modeling Forest Fire Occurrences Using Count-Data Mixed Models in Qiannan Autonomous Prefecture of Guizhou Province in China”.” PLoS ONE 10 (3): e0120621. doi:10.1371/journal.pone.0120621.
- Xing, H., L. Zhu, B. Chen, J. Niu, X. Li, Y. Feng, and W. Fang. 2022. “Spatial and Temporal Changes Analysis of air Quality Before and After the COVID-19 in Shandong Province, China.” Earth Science Informatics 15 (2): 863–876. doi:10.1007/s12145-021-00739-7.
- Yang, L., J. Driscol, S. Sarigai, Q. Wu, H. Chen, and C. D. Lippitt. 2022. “Google Earth Engine and Artificial Intelligence (AI): A Comprehensive Review.” Remote Sensing 14 (14): 3253. doi:10.3390/rs14143253.