ABSTRACT
Surface incident shortwave radiation (Rs) can promote the circulation of substance and energy, and the accuracy of its estimation is of great significance for climate studies. The Rs can be acquired from satellite retrievals, reanalysis predictions and general circulation model (GCM) simulations. Although Rs estimates have been evaluated and compared in previous studies, most of them focus on evaluating the Rs estimates over specific regions using ground measurements from limited stations. Therefore, it is essential to comprehensively validate Rs estimates from multiple data sources. In this study, ground measurements of 690 stations from BSRN, GEBA, CMA, GC-NET and buoys were employed to validate the Rs estimates from seven representative products (GLASS, GEWEX-SRB, CERES-EBAF, ERA5, MERRA2, CFSR and CMIP6). The validation results indicated that the selected products overestimated Rs globally, with biases ranged from 0.48 to 21.27 W/m2. The satellite retrievals showed relatively better accuracy among seven datasets compared to ground measurements at the selected stations. Moreover, the selected seven products were all in poor accuracy at high-latitude regions with RMSEs greater than 50 W/m2. The long-term variation trends were also analyzed in this study.
1. Introduction
As an indispensable energy source received at the surface, surface incident shortwave radiation (Rs) contributes to the balance of global energy budget (Liang et al. Citation2019; Wild et al. Citation2012). It also drives the processes of biosphere, hydrosphere, and geochemical cycle by promoting the exchange of possible substances (e.g. energy, water, and so on.) among the surface and atmosphere (Letu et al. Citation2020; Zhou et al. Citation2018). Thus, precise estimation of Rs is of vital importance for the related researches and applications, such as the primary productivity of ecosystem (Sakamoto et al. Citation2011), hydrological cycle (Huang, Li, Ma, et al. Citation2016), solar photovoltaic applications (Cai et al. Citation2021; Mellit and Kalogirou Citation2008; Qiu et al. Citation2022), and others (Yang et al. Citation2022).
So far, approaches for obtaining Rs include the ground-based measurements, simulations from GCMs, reanalysis datasets, and retrievals from satellite observations (Baldocchi et al. Citation2001; Decker et al. Citation2012; Hou et al. Citation2020; Ma and Pinker Citation2012; Wild Citation2008; Zhang et al. Citation2014; Zhang et al. Citation2019; Zhang et al. Citation2020). The stations from various networks can provide high temporal Rs measurements with high accuracy. The ground observations are sparsely distributed, and the ground observations may also stopped or missed owing to technique problems and other probable reasons. Therefore, it cannot match the requirements of the spatiotemporal continuous data well on regional scales, let alone on global scales (Yan et al. Citation2011; Zhang et al. Citation2015b). Thus, ground observations are usually used for evaluating the Rs estimates from other data sources.
The GCMs is indispensable for the examination and analysis of previous and future climate change. The Coupled Model Intercomparison Project (CMIP) organizes the design and distribution of GCMs, and the Rs estimates are provided with long time series (Eyring et al. Citation2019). Over the past decades, global Rs simulations of CMIP3, CMIP5, and CMIP6 GCMs have been successively developed, but uncertainties exist in a quantity of sources (such as solar spectral irradiance variability, observational estimation and model formulation) while designing GCMs, which may result in the uncertainty of Rs simulations (Hood et al. Citation2015). The comparison between different version of CMIP Rs estimates and the validations against observations at ground stations have been attempted to assess the performance of GCMs (Allen, Norris, and Wild Citation2013; Jiao et al. Citation2022; Li et al. Citation2013; Ma, Wang, and Wild Citation2015; Mackie et al. Citation2020; Wild Citation2008; Wild Citation2017; Wild et al. Citation2012; Wild et al. Citation2014). As reported by Song, Chung, and Shahid (Citation2022), the performance capabilities of CMIP3, CMIP5 and CMIP6 GCM simulations were continuously improved. The mean biases of global average CMIP5 Rs estimates were reduced by about 32% in comparison with CMIP3 (Li et al. Citation2013), and the CMIP6 GCMs were remarkably improved in spatial resolution, representation of physical parameters and supplementary earth system processes compared to past generations (Eyring et al. Citation2019). However, they still inclined to overestimate the Rs. The CMIP3 GCMs performed the obvious overestimation of the Rs by about 6 W/m2 (Wild Citation2008), then, some individual models of CMIP5 GCMs Rs estimates were found deviating from the best estimate of CERES-EBAF by up to 6 W/m2, and the majority of models were tended to overestimate Rs compared to ground measurements (Wild et al. Citation2012; Wild et al. Citation2014). The similar overestimation tendency of CMIP6 Rs estimates were found by Jiao et al. (Citation2022). These evaluation results further indicated that the overestimation phase of Rs is still a common issue in the latest CMIP6 Rs estimates. In addition, researches also showed that the performance of CMIP Rs estimates differ in regions, such as land, ocean and other divided areas (Li et al. Citation2013; Zou et al. Citation2019).
Besides GCMs, reanalysis datasets are also feasible sources to obtain Rs. The reanalysis merges available measurements (to provide the best simulation of the state of the atmosphere in which they are taken and constrain the calculation of the model) and the atmospheric geophysical fluid-dynamical model to achieve the optimization of the forecasts of variables (Betts et al. Citation2006; Zhao, Lee, and Liu Citation2013). The obvious characteristic of reanalysis data is that they not only have high temporal resolution, but also have long-term complete data with global coverage, which is beneficial for long-term analysis, though their spatial resolution is relatively coarse (Huang et al. Citation2019; Jiang et al. Citation2019). The ERA-Interim, ECMWF Reanalysis v5 (ERA5), Modern-Era Retrospective Analysis for Research and Applications (MERRA), MERRA-2, Climate Forecast System Reanalysis (CFSR), the Japanese 55-year Reanalysis (JRA-55) and the Global Land Data Assimilation System (GLDAS) are all widely used reanalysis data. Similar to the GCMs Rs estimates, the predictions of Rs from these reanalysis were also evaluated using ground-based observations from different networks (Decker et al. Citation2012; Feng and Wang Citation2018; Jia et al. Citation2013; Ladd Citation2002; Wang, Wang, and Xue Citation2021b; Zhang et al. Citation2016). The quality of reanalysis is largely dependent on the key variables in model, especially cloud and aerosol (Decker et al. Citation2012; Yu et al. Citation2021). This may lead to the deficiencies in Rs estimates of reanalysis, and the deviations were also exhibited in many studies (Feng and Wang Citation2019; Kennedy et al. Citation2012; Xia et al. Citation2006). The Rs data from National Center for Environmental Prediction (NCEP)/National Center for Atmospheric Research (NCAR) were found higher than observations of buoys by 70–80 W/m2 at two sites in Bering Sea, while overestimated Rs by 20 W/m2 at one site in northeast Pacific (Ladd Citation2002). On account of the underestimation of cloud fraction, all the five reanalysis predictions (ERAI, JRA-55, CFSR, MERRA and MERRA-2) overestimated the mutiyear mean Rs by 24.1–40W/m2 over China (Feng and Wang Citation2019). Kennedy et al. (Citation2012) using Barrow and Ny-Alesund surface stations at Arctic to access Rs of MERRA2, CFSR, NOAA’s Twentieth Century Reanalysis Project (20CR), NCEP-Department of Energy (DOE)’s Reanalysis II (R2) and ERA-Interim, and found that the monthly Rs of R2 showed considerable bias over 90 W/m2 in June. The evaluation of five reanalysis products over the Qinghai-Tibet Plateau, Antarctic and Arctic also proved that performance of reanalysis Rs predictions also differ from regions (Wang, Wang, and Xue Citation2021).
As the technology of satellite and remote sensing becomes more and more advanced, the satellite retrievals have grown into one of the most significant methods for estimating Rs (Babar, Graversen, and Boström Citation2019; Hou et al. Citation2020). The competence of capturing spatial distribution and dynamic evolution of elements such as clouds gives satellites opportunities of deriving regional or global Rs on the basis of physical or statistical models (Huang et al. Citation2019; Yu et al. Citation2021). Over the past few decades, a quantity of remotely sensed Rs products including the International Satellite Cloud Climatology Project-Flux Data (ISCCP-FD), the Clouds and Earth’s Radiant Energy System (CERES)-Synoptic Radiative Fluxes and Clouds (SYN) and Energy Balanced and Filled (EBAF), the Moderate Resolution Imaging Spectroradiometer (MODIS) level-3 products (MOD18, MYD18 and MCD18), the Global Energy and Water Cycle Experiments-Surface Radiation Budget (GEWEX-SRB) and the Global LAnd Surface Satellite (GLASS) products that based on the retrieving methods have been generated and evaluated (Gui et al. Citation2010; Huang et al. Citation2013; Huang et al. Citation2016a; Jia et al. Citation2013; Li, Wang, and Liang Citation2021; Sun et al. Citation2018; Tang et al. Citation2016; Tang et al. Citation2021; Wang et al. Citation2021a; Xia et al. Citation2006; Yan et al. Citation2011; Yu, Wang, and Shi Citation2018; Zhang et al. Citation2015a; Zhang et al. Citation2019). Though some satellite-based Rs products were generally consistent with observations and spatial patterns of ground stations, uncertainties still exist in certain regions (Gui et al. Citation2010; Zhang, Liang, et al. Citation2015). Sun et al. (Citation2018) concluded that the GEWEX-SRB, ISCCP-FD and CERES-SYN Rs were less accurate in Arctic, given the root mean square errors (RMSEs) and mean absolute errors (MAEs) were far over 20 W/m2 at most of the stations. Similarly, a comparison of five satellite retrievals (BESS, MCD18A1, GLASS, CLARA-A2 and CERES-SYN) showed the accuracy of these Rs products were about 7 W/m2 lower over high-latitude regions (Li, Wang, and Liang Citation2021). Besides, researchers also found some satellite retrievals tended to overestimate the Rs in China, and the mean bias over southern China increased to 17–29 W/m2, about two or three times higher than that in northern areas (Jia et al. Citation2013; Xia et al. Citation2006). The performance of satellite retrievals rests with the theory of retrieving methods and state of surface and atmosphere (Wang, Wang, and Xue Citation2021), thus, the Rs products and region chosen to study lead to the deviation of results.
Global Rs products which have been developed and released provided foundation for relevant large-scale studies, but before application, they still required extensive assessments. Previous evaluation mostly focused on single type of data source individually, or the region and the number of validating stations were limited. A systematic review and comparison specialized in typical Rs datasets including satellite retrievals, reanalysis data and GCM simulations is still lacking. This study initially conducted comprehensive verification and comparison of diverse and representative Rs datasets through abundant stations as possible. The Rs estimates from seven representative global products, including three derived from satellites (GLASS, GEWEX-SRB and CERES-EBAF), three reanalysis predictions (ERA5, MERRA2 and CFSR) and CMIP6 GCM simulations were evaluated using Rs measurements collected from a total of 690 stations from five independent ground measurement networks (the Baseline Surface Radiation Network [BSRN], the Global Energy Balance Archive [GEBA], the China Meteorological Administration [CMA], buoys and the Greenland Climate Network [GC-NET]). Additionally, these products are further compared through spatial distributions, annual means and long-term variation trends of Rs to assess the disparities and consistencies. The remainder of this paper is constructed as follows: the Rs we used from ground measurements, satellite retrievals, reanalysis predictions and CMIP6 GCM simulations are briefly depicted in Section 2. Section 3 introduces the evaluating results based on ground measurements and presents the corresponding analysis about spatial distribution, annual means and long-term trends of Rs. At last, the summary and conclusions are discussed in Section 4.
2. Data
The twelve datasets used in this study include ground measurements, satellite retrievals, reanalysis and GCM simulations. summaries the detailed information of selected Rs products from different data sources.
Table 1. The detailed information of various Rs products used in this study.
2.1. Ground measurements
The surface observations of stations we used to assess the Rs estimates were derived from five data sources: BSRN, GEBA, CMA, buoys and GC-NET.
The GEBA is a database that centrally records the energy fluxes that are measured on a global scale at the surface, which is developed and preserved at ETH Zurich (Gilgen and Ohmura Citation1999; Gilgen, Wild, and Ohmura Citation1998). The Rs of GEBA is the most widely measured component, which has been measured by pyranometers and widely used for the evaluation of Rs estimates (Wild et al. Citation2017). The BSRN is a new radiometric global network established by the World Climate Research Programme (WCRP), which is aiming at providing high-quality and high-temporal-resolution radiation ground measurements (Ohmura et al. Citation1998). The Rs of BSRN is directly measured using pyranometers and has been converted into daily and monthly data. The China Meteorological Administration (CMA) releases daily and monthly meteorological measurements at 122 stations, and the daily radiation data has gone through the check of the spatial and temporal consistency and manual inspection and correction (Tang et al. Citation2010; Zhang et al. Citation2015a). The buoy networks located in tropical oceans including the Prediction and Research Moored Array in the Tropical Atlantic (PIRATA) (Bourlès et al. Citation2008), the Tropical Atmosphere Ocean/Triangle Trans-Ocean Buoy Network (TAO/TRITON) (McPhaden et al. Citation1998) and the Research Moored Array for African-Asian-Australian Monsoon Analysis and Prediction (RAMA) (McPhaden et al. Citation2009). These buoys vary from 25°S to 25°N in latitudes and the corresponding data has undergone rigorous quality control procedures (Medovaya Citation2002). Additionally, we also used three buoys located over relatively high-latitude oceans in our research, including the KEO, Papa and ARC buoys. The stations of GC-NET distribute over the Greenland and provide records such as radiation observations on the ice sheet from 2000 to the present (Li, Wang, and Liang Citation2021). These measurements at high-latitude regions have been calibrated and make it possible to study the performance of products under particular conditions (Li et al. Citation2022).
2.2. Satellite retrievals
The GLASS products are remote sensing inversion products with long-term temporal coverage, high precision and high spatial resolution (Liang et al. Citation2021). There are two GLASS Rs products derived from different data sources and methods. The GLASS-MODIS Rs was derived on the basis of hybrid algorithm utilizing the MODIS top-of-atmosphere reflectance (Zhang et al. Citation2019), but only covering the global land. The GLASS-AVHRR Rs was estimated based on the improved look-up table algorithm using the AVHRR top of atmosphere radiance and other ancillary datasets (Zhang et al. Citation2014). To keep the consistency of coverage with Rs products from other data sources, we chose the GLASS-AVHRR as the research data. The latest GEWEX-SRB Rs released by NASA is the version 3.0, which is achieved by radiative transfer model modified by updated shortwave algorithm from the University of Maryland (Pinker and Laszlo Citation1992; Wu and Fu Citation2011). The major inputs of GEWEX-SRB 3.0 include spectral albedo, cloud optical depth, cloud cover, temperature, moisture and other atmospheric compositions (Pinker and Laszlo Citation1992). The CERES-EBAF products were improved on the basis of CERES-SYN and applied for the energy budget estimation and climate evaluation (Di Biagio et al. Citation2021; Ham et al. Citation2018; Loeb et al. Citation2018). The Rs of CERES-EBAF was calculated using the cloud and aerosol properties derived from instruments on the A-train constellation, based on the radiative transfer model with k-distribution and correlated-k for radiation (Kato et al. Citation2013). Other input parameters include the humidity, temperature, ozone amounts, TOA albedo and emissivity (Zhang, Liang, et al. Citation2015).
2.3. Reanalysis products
The ERA5 is the fifth generation of ECMWF and the successor of ERA-Interim, which combines plenty of historical observations and provide various types of global reanalysis datasets such as atmospheric and surface data with diverse temporal and spatial resolution (Hersbach et al. Citation2020). The ERA5 applied the updated Integrated Forecasting System ‘cycle 41r2’ and increased an amount of assimilated data based on the 12-hourly 4DVar assimilation model, reaching the increase of spatial grid, time resolution and vertical levels (Hersbach et al. Citation2020; Urraca et al. Citation2018). The MERRA2 released by NASA’s GMAO is the improvement of MERRA, updating the observing system and solving the limitations in the assimilation of the newest sources of satellite data (Gelaro et al. Citation2017). The substantial upgrades of MERRA2 were the use of a new version of the GEOS-5 atmospheric model and the assimilation of aerosol data (Molod et al. Citation2015). The MERRA2 had enhanced the accuracy of simulation and performed more validation efforts (Jiang et al. Citation2015; Molod et al. Citation2015). The calculation and processes of Rs from MERRA2 was specifically described by Suarez and Chou (Citation1999). The CFSR developed by the National Centers for Environmental Prediction (NCEP) is an updated dataset (Saha et al. Citation2010). Compared with previous reanalysis data released by NCEP, it has higher spatial resolution and take the guess fields in use (Tahir et al. Citation2021). The radiative transfer model used in CFSR uses an advanced cloud-radiation interaction scheme, and the water vapor, ozone, carbon dioxide and atmospheric aerosols have been incorporated in the model. The Rs of CFSR was parameterized using random cloud overlap according to the NASA approach (Chou et al. Citation1998).
2.4. CMIP6 GCMs
The CMIP6 provides numerous GCM simulations developed and maintained by different institutions globally, and the climate models are driven by a new set of scenarios. The Rs was simulated considering natural and anthropogenic forcing such as aerosol loadings and land use (Wild Citation2020). The monthly mean Rs of 52 GCMs used in this research were all selected from CMIP6, and their details were displayed in . The historical simulations were available with the ensemble member ‘r1i1p1f1’ in 1850–2014, and we chose the period of 1983–2014 to match others products. Given the disparity of spatial resolution from each CMIP6 GCMs, we unified all the models into 1°×1° with bilinear interpolation method, just like existing studies (Kim et al. Citation2020; Yuan et al. Citation2022; Zhou et al. Citation2022) so that subsequent analysis could be performed by averaging the individual models.
Table 2. The detailed information of CMIP6 GCMs used in this study.
3. Results and analysis
The seven selected Rs estimates from multiple data sources were assessed using ground measurements gathered from five networks during the period of 2001–2010. Since the spatial resolution of the selected Rs products ranged from 0.05°×0.05° to 2.8°×2.8°, they were all resampled into 1°×1° using bilinear interpolation method to ensure their consistency. All these Rs products provided the monthly mean values except GLASS Rs products. The GLASS monthly mean Rs were calculated by averaging the original daily Rs values.
3.1. Evaluation using ground measurements
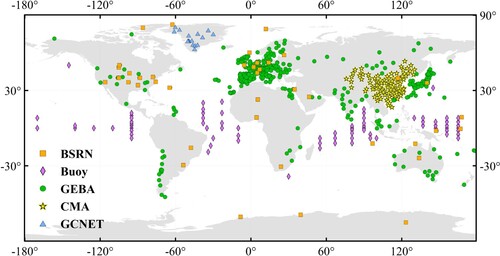
For the purpose of evaluating and analyzing the selected seven global representative Rs products, measurements of a total of 690 stations (showed in ) were collected to achieve the validation, including 43 stations from BSRN, 455 stations from GEBA, 96 stations from CMA, 79 buoys and 17 stations from GC-NET.
Figure 1. Spatial distributions of the observation stations.
presents the scatterplots of estimated Rs from seven representative monthly products against the records at 690 stations. The scatterplots of Rs estimates against each network are also plotted and the statistical information of five networks is recapitulated in . For all networks, the range of correlation coefficient (R), RMSE and bias were 0.93–0.97, 20.28–36.14 and 0.48–21.27 W/m2, respectively. The GLASS and CERES-EBAF Rs performed better, with highest R (0.96 and 0.97), lowest bias (0.48 and 5.90 W/m2) and lowest RMSE (21.11 and 20.28 W/m2). In contrast, the Rs estimates from MERRA2 and CFSR were less accurate with RMSEs of 36.14 and 34.49 W/m2. All of these products displayed overestimation of Rs, and the MERRA2 was especially significant with a bias of 21.27 W/m2.
Figure 2. Evaluation results of monthly Rs estimates from seven products against the ground measurements from BSRN, CMA, GEBA, GC-NET and buoys.
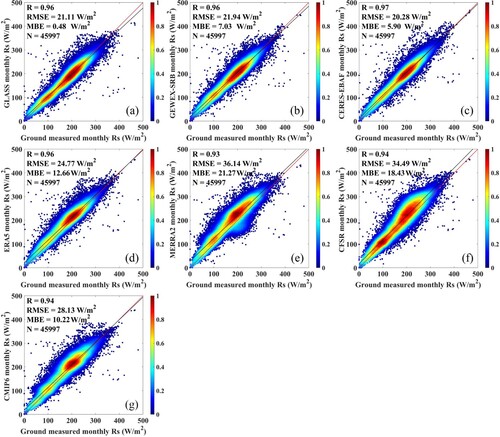
Table 3. Summary of performance statistics for surface measurements of five networks and seven monthly Rs estimates from 2001 to 2010. The units of Bias and RMSE are W/m2.
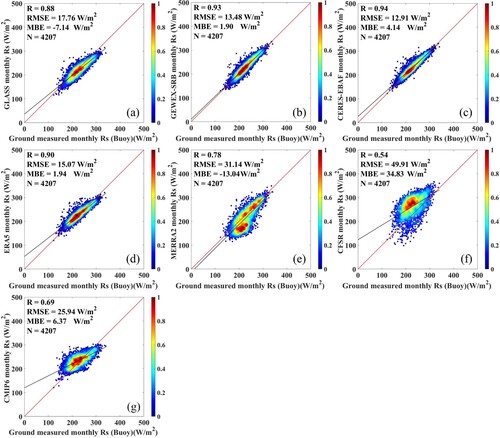
We could see that for different networks, the R of the observed Rs versus estimated monthly Rs varied from 0.54 to 0.99, the bias varied from −23.54 to 36.63 W/m2 and the RMSE varied from 12.91 to 68.36 W/m2, which exhibited substantial differences. Among these products, the GLASS Rs had the minimum RMSE in CMA (18.89 W/m2) and GEBA (19.46 W/m2), while the CERES-EBAF Rs had the minimum RMSE in BSRN (14.07 W/m2), GC-NET (55.68 W/m2) and buoys (12.91 W/m2). The maximum RMSE at BSRN, CMA and GEBA stations was 23.70, 45.99 and 32.80 W/m2 for MERRA2, and the GLASS and CFSR showed the maximum RMSE at GC-NET and buoys with values of 68.36 and 49.91 W/m2. All of the highest RMSE (over than 50 W/m2) of Rs products. This suggested that the Rs at high-latitude areas may be less accurate, which was consistent with the result found by Sun et al. (Citation2018). Obviously, all the Rs estimates presented the positive bias at CMA and GEBA stations, especially the reanalysis predictions including ERA5, MERRA2 and CFSR, showing apparent overestimation of Rs. But at stations of GC-NET, the Rs products underestimated Rs with the negative bias ranged from −23.54 to −1.71 W/m2, with an exception of CERES-EBAF and CFSR. The lower R, higher values of RMSE at buoys indicated relatively higher uncertainty of MERRA2 and CFSR Rs over the ocean compared to other products.
Besides the evaluation at multiple stations, and illustrate the RMSE and bias of monthly Rs from seven products for each station. The RMSEs of Rs from satellite retrievals were lower (less than 20 W/m2) at more than 65% of the stations (510, 467 and 512 stations for CERES-EBAF, GEWEX-SRB and GLASS). The ERA5 Rs showed higher RMSEs over China but displayed similarities over other regions compared to satellite retrievals. By contrast, 469 (68.0%), 546 (79.1%) and 450 (65.2%) stations had RMSEs greater than 20 W/m2 for CMIP6 GCMs, MERRA2 and CFSR Rs, respectively (), and their higher RMSEs were mainly found at stations distributed in China, Europe and ocean. It is apparent that the RMSEs of reanalysis and CMIP6 were overall higher than satellite retrievals.
Figure 3. Spatial distributions of RMSEs of (a) GLASS; (b) ERA5; (c) GEWEX-SRB; (d) MERRA2; (e) CERES-EBAF; (f) CFSR; (g) CMIP6 Rs against ground measurements on monthly scale.
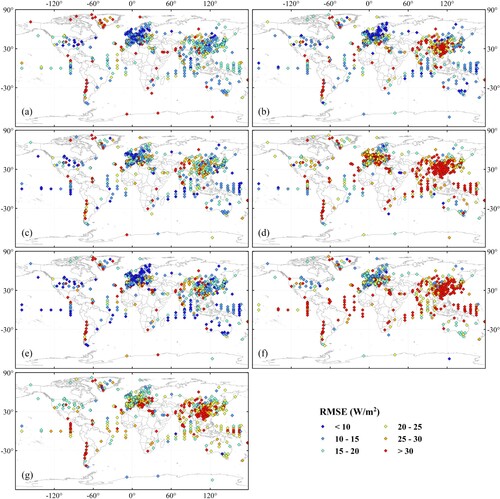
Figure 4. Spatial distributions of biases of (a) GLASS; (b) ERA5; (c) GEWEX-SRB; (d) MERRA2; (e) CERES-EBAF; (f) CFSR; (g) CMIP6 Rs against ground measurements on monthly scale.
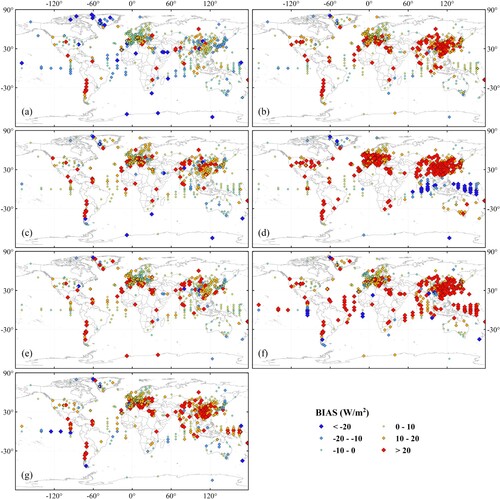
Among the selected seven Rs products, only GLASS showed negative bias over half of the stations (370 stations accounting for 53.6%), which tended to underestimate Rs. But the absolute values of biases were lower (less than 10 W/m2) at most of the stations (67.2%), which indicated the higher accuracy at these stations. Other six Rs estimates were overestimated at more than 70% of the stations. For CERES-EBAF and GEWEX-SRB, 284 (41.1%) and 268 (38.8%) stations showed positive bias which is lower than 10 W/m2. For Rs from reanalysis and CMIP6 GCMs, positive bias lower than 10 W/m2 was found at a small part of stations. But 38.7% (267 out of 690) and 53.2% (367 out of 690) stations displayed bias greater than 20 W/m2 for CFSR and MERRA2 as shown in , and most of the serious overestimations or underestimations were found in low-latitude and mid-latitude regions.
3.2 Spatial distributions
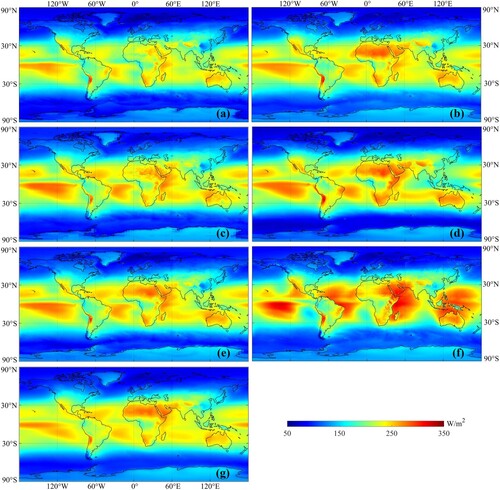
The comparison of globally distributed multiyear (2001–2010) mean Rs estimates from seven products are exhibited in . It is clear that the values of Rs at low-latitude regions were generally higher than that at high-latitude regions. The maximum values of the South Pole were found larger than that of the North Pole, which may owing to the relatively smaller Earth-Sun distance, lesser cloud cover and drier atmosphere (Hatzianastassiou et al. Citation2005). In low-latitude regions, all of the products yield higher Rs over central Pacific Ocean, the western coastline of South America, central Atlantic Ocean, the coastal area of Africa and most of Australia. The comparison among these Rs estimates also reveals several differences. The GLASS almost showed the lower Rs at all latitudinal zones. In contrast, the CFSR produced the highest Rs within the low-latitude oceans. Overall, the high value of Rs of reanalysis predictions, especially for MERRA2 and CFSR, were higher than that of satellite retrievals.
Figure 5. Spatial distribution of ten-year (2001–2010) mean Rs of (a) GLASS; (b) ERA5; (c) GEWEX-SRB; (d) MERRA2; (e) CERES-EBAF; (f) CFSR; (g) CMIP6.
3.3 Annual mean and long-term trends
depicts the box plots of annual mean Rs of seven products during the period of 2001–2010, and the detailed values over globe, land and ocean are summarized in . As seen, the annual mean Rs of GLASS was the lowest over the globe, land and ocean, with values of 177.1, 179.3 and 175.5 W/m2, respectively. The CFSR displayed the highest mean Rs, which is 191.3 and 191.5 W/m2 in globe and ocean, while MERRA2 was the highest of 196.0 W/m2 in land. The maximum, minimum and mean Rs estimates over land of most of the products tended to be higher than those over ocean, except for the CERES-EBAF and CFSR. For ERA5, CERES-EBAF and CMIP6 GCMs, the maximum and minimum values of Rs were close, which means that the differences in annual mean Rs of these products were minor.
Figure 6. Box plots of ten-year (2001–2010) annual mean Rs in (a) global; (b) land; (c) ocean of the selected seven products. For each box, the blue point is the mean Rs, and the circle is the outliers. The central line represents the median value, while the lower and upper edge symbolize the 25th (v1) and 75th (v3) percentiles, respectively. The top line is calculated by [v3 + 1.5 × (v3 − v1)] while the bottom line is [v1 − 1.5 × (v3− v1)].
![Figure 6. Box plots of ten-year (2001–2010) annual mean Rs in (a) global; (b) land; (c) ocean of the selected seven products. For each box, the blue point is the mean Rs, and the circle is the outliers. The central line represents the median value, while the lower and upper edge symbolize the 25th (v1) and 75th (v3) percentiles, respectively. The top line is calculated by [v3 + 1.5 × (v3 − v1)] while the bottom line is [v1 − 1.5 × (v3− v1)].](/cms/asset/be0c09fc-2852-487c-9e75-d690fe1c4b0f/tjde_a_2198262_f0006_oc.jpg)
Table 4. Overview of the maximum, minimum and mean value of Rs over globe, land and ocean of the seven products during 2001–2010 (Units are W/m2).
For a better inter-comparison of these Rs estimates, the annual mean Rs of each product at different latitude zones were also calculated and listed in . Obviously, the mean Rs decreased gradually from low-latitude zones to high-latitude zones, and the mean values of the South Pole were significantly higher than that of the North Pole, which were consistent with the results in Section 3.2. For all these selected products, the minimum mean Rs were found in the latitude span of 60°N to 90°N, while the maximums were found in the latitude span of 0°S to 30°S. The average Rs of CFSR was the highest at low latitude zones, while the highest at middle latitude zones were average Rs of MERRA2 and ERA5, and the average Rs of GLASS were the lowest at different latitude zones except in 60°S to 90°S.
Table 5. The average Rs of seven products under different latitude zones during 2001–2010 (Units are W/m2).
The annual Rs anomaly of each product over globe, land and ocean is displayed in , and the variation trends of these datasets in two different phases are summarized in . Apparently, diverse trends were shown for these dissimilar Rs products during different phases. Significant decreasing trends of Rs were found for GLASS from 1984 to 2018 (−2.3, −1.5 and −3.1 W/m2 per decade) and from 2001 to 2010 (−2.5, −2.4 and −3.1 W/m2 per decade) over globe, land and ocean. Some NOAA satellites, such as NOAA-14/15/16, show significant orbital drifts (changes of local equator crossing time) over time, which may affect the long-term Rs trend derived using AVHRR data. This may be the reason why the annual mean Rs of GLASS changed greater. But the long-term analysis conducted in this study was on the basis of daily integrated data and the missing data were filled with climatology data, which might also contribute to mitigate the inconsistency. The MERRA2 Rs also had remarkable decreasing trends in two phases over globe, but the slope over land and ocean were different during two phases. By contrast, the Rs estimates from CERES-EBAF, ERA5 and CMIP6 both had flat trends, though some may not significant. All of these Rs products were decreasing during 2001–2010 in globe and land, while for ocean, only the Rs of GEWEX-SRB and CFSR showed weak brightening trends but not significant.
Figure 7. Annual Rs anomaly in (a) globe; (b) land; (c) ocean of the GLASS, GEWEX-SRB, CERES-EBAF, ERA5, MERRA2, CFSR and CMIP6 GCMs.
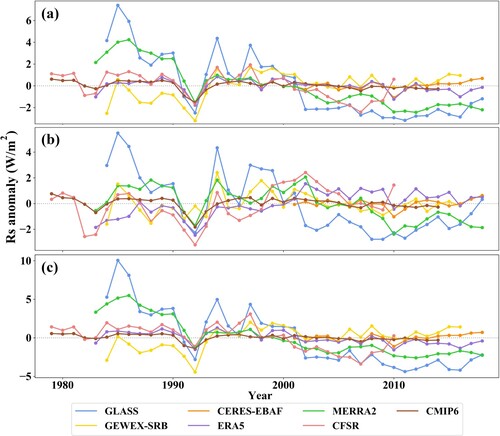
Table 6. Trend comparison of annual mean Rs from seven products over globe, land and ocean during the whole time series of each product and the period of 2001–2010.
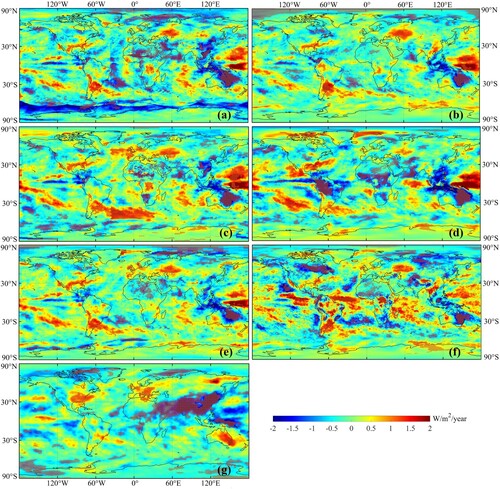
depicts the spatial pattern of variation trends at each grid of seven Rs products during 2001–2010. Most of the regions over globe showed slight variation trends (not significant) for all these Rs datasets. Annual mean Rs significantly decreased mainly in the northeast of Australia for all the satellite retrievals and reanalysis predictions, while the significant upward trends of Rs occurred in the western Pacific. Though there were similarities, the great differences among these products still couldn’t be neglected, which indicated that these Rs datasets may not be suitable for long-term analysis.
Figure 8. Spatial distribution of multi-year (2001–2010) trends of Rs for (a) GLASS; (b) ERA5; (c) GEWEX-SRB; (d) MERRA2; (e) CERES-EBAF; (f) CFSR; (g) CMIP6. The solid dots indicate grids at 95% confidence.
4 Summary and conclusions
Having collected the available measurements of Rs at 690 stations from BSRN, GEBA, CMA, GC-NET and Buoys during 2001–2010, this study evaluated the global estimates of Rs from seven representative datasets (GLASS, GEWEX-SRB, CERES-EBAF, ERA5, MERRA2, CFSR and CMIP6) including satellite retrievals, reanalysis predictions and GCM simulations at monthly scales. The performance of these Rs products was compared with each other, and the inter-comparison about spatial distribution, annual means and long-term trends during 2001–2010 were also provided in this study.
The spatial resolution of the selected products varied from 0.05°×0.05° to 2.8°×2.8°, thus, all the Rs products were aggregated to 1°×1° resolution to ensure their consistency. Overall, these positive biases at 690 stations of seven Rs products meant that they all tended to overestimate the Rs, and the relatively higher RMSEs occurred in MERRA2 and CFSR Rs, which meant their lower accuracy. Besides the proposed methods for estimating Rs, many other factors would affect the accuracy of Rs assessment. First of all, the input data used in the process of estimating Rs for different models is one of the important factors. As is known to all, the cloud and aerosol datasets are the inputs of retrieving algorithms, prediction models and simulation models normally (Li, Wang, and Liang Citation2021; Stubenrauch et al. Citation2013; Xia et al. Citation2006; Zhang et al. Citation2016). Other atmospheric inputs such as water vapor, total precipitable water and snow are also the influencing factors about Rs (Hatzianastassiou et al. Citation2005; Huang et al. Citation2019). Secondly, the quality of the ground Rs observations are also one of the potential error sources of the evaluation results (Lu, Wang, et al. Citation2023a; Lu, Zhang, et al. Citation2023). It was reported that the uncertainty of the equipment and problems of operation, and the quality control before releasing Rs observations might achieve the quality assurance (Song et al. Citation2020). Additionally, the deviations between observations and the Rs products may also be caused by the lack of the spatial representativeness of in-situ stations (Hakuba et al. Citation2013; Qin et al. Citation2020). The spatial nature of ground-based measurements and that of Rs products are totally different, the former is point-specific and the latter is grid-level scale. The spatial and temporal averaging may be a possible solution to address the issues of spatial representativeness (Hakuba et al. Citation2013; Huang et al. Citation2016a).
According to the validation results, all of these selected Rs products exhibited much higher RMSEs (over than 50 W/m2) at GC-NET stations. It directly indicated the lower accuracy of the selected Rs products at high-latitude regions. The possible reasons for this phenomenon are as follows. Firstly, most of the radiative transfer models assume that the atmosphere is plane-parallel, which leads to the low accuracy of Rs at high latitudes owing to the large solar zenith. Meanwhile, the snow and clouds are both the bright target in remote sensing images. Most of the high latitudes are snow-covered areas, thus the difficulty in distinguishing snow from clouds may result in the error in inversion parameters, and further lead to the lower accuracy of Rs (Sun et al. Citation2018). In addition, the surface observations at high latitudes we used were mainly from GC-NET. The difficulty of maintaining the instrument and the quality control of the measurements at high latitude areas may also affect the verification accuracy of the Rs. It was also found that the Rs of most of the selected products showed higher biases at CMA stations than that at stations from other networks. The quality of measurements at CMA stations or the underestimation of clouds and aerosols in China are potential error sources of this issue (Urraca et al. Citation2018; Zhang, Liang, et al. Citation2015). For Rs predictions from reanalysis data, the biases of monthly mean Rs estimates at CMA stations were greater that 20 W/m2. We also validated the monthly Rs at individual stations, and the RMSEs of satellite retrievals at most of the stations were lower than those of reanalysis predictions and GCM simulations, indicating the accuracy of satellite retrievals was relatively higher. The higher biases of reanalysis predictions also proved that they overestimated the Rs to a larger extent compared to the satellite retrievals and GCM simulations.
Geographical distribution of ten-year (2001–2010) mean Rs from seven products were displayed for comparison. Higher Rs values over globe mainly distributed in low-latitude regions while lower values were found in high-latitude regions. The selected seven datasets also showed similar characteristics in spatial distribution of Rs, but some differences existed among their mean values. The multi-year mean Rs of these products varied from 177.1 to 191.3 W/m2, from 179.3 to 196.0 W/m2 and from 175.5 to 191.5 W/m2 over globe, land and ocean, respectively. The lowest mean values of Rs were seen from GLASS except in southern high-latitudes, while the highest Rs were found from ERA5, MERRA2 and CFSR at low latitudes and middle latitudes.
The long-term variation trends of Rs estimates were also analyzed. The Rs of GLASS and MERRA2 were significantly decreased (over 1.5 W/m2 per decade) over globe, while the trends of other products were relatively flat (not significant). Over half of the Rs products displayed clearly decreased trends over land in the period of 2001–2010, but only GLASS showed the same over ocean. For specific region, the spatial distribution of multi-year (2001–2010) trends also indicated great differences among these products. Overall, these Rs products may not suitable for long-term analysis.
We comprehensively reviewed and compared seven selected representative Rs products. It would be desirable to obtain the accurate input datasets of these Rs products such as cloud, aerosol and other atmospheric parameters in the future, which would be beneficial to enhance the precision of Rs estimates. Meanwhile, it also provides a chance of further exploring the reasons of the accuracy difference between different Rs products.
Acknowledgements
The authors sincerely thank the institutions and researchers who provided the data used in this study and made them available to the public. The authors also sincerely thank the anonymous reviewers and editors for their valuable suggestions.
Disclosure statement
No potential conflict of interest was reported by the author(s).
Data availability statement
The ground measurements collected from BSRN, GEBA, CMA, GC-NET and Buoys in this study are downloaded at https://bsrn.awi.de/, https://geba.ethz.ch/, https://data.cma.cn/, http://cires1.colorado.edu/science/groups/steffen/gcnet/ and https://www.pmel.noaa.gov/tao/drupal/disdel/, respectively. The GEWEX-SRB and CERES-EBAF data are available at https://science.larc.nasa.gov/gewex-srb/ and https://ceres.larc.nasa.gov/data/. The reanalysis datasets are available at https://www.ecmwf.int/en/forecasts/datasets/reanalysis-datasets/era5, https://disc.gsfc.nasa.gov/datasets?project=MERRA-2 and https://climatedataguide.ucar.edu/climate-data/climate-forecast-system-reanalysis-cfsr. The Rs simulations from CMIP6 GCMs are available at https://esgf-node.llnl.gov/search/cmip6/.
Additional information
Funding
References
- Allen, R. J., J. R. Norris, and M. Wild. 2013. “Evaluation of Multidecadal Variability in CMIP5 Surface Solar Radiation and Inferred Underestimation of Aerosol Direct Effects Over Europe, China, Japan, and India.” Journal of Geophysical Research: Atmospheres 118 (12): 6311–6336. doi:10.1002/jgrd.50426.
- Babar, Bilal, Rune Graversen, and Tobias Boström. 2019. “Solar Radiation Estimation at High Latitudes: Assessment of the CMSAF Databases, ASR and ERA5.” Solar Energy 182: 397–411. doi:10.1016/j.solener.2019.02.058.
- Baldocchi, Dennis, Eva Falge, Jose Fuentes, Allen Goldstein, Gabriel Katul, Beverly Law, Xuhui Lee, et al. 2001. “FLUXNET: A New Tool to Study the Temporal and Spatial Variability of Ecosystem-Scale Carbon Dioxide, Water Vapor, and Energy Flux Densities.” Bulletin of the American Meteorological Society 82 (11): 2415–2434. doi:10.1175/1520-0477(2001)082<2415:FANTTS>2.3.CO;2.
- Betts, Alan K., Mei Zhao, P. A. Dirmeyer, and A. C. M. Beljaars. 2006. “Comparison of ERA40 and NCEP/DOE Near-Surface Data Sets with Other ISLSCP-II Data Sets.” Journal of Geophysical Research 111 (D22), doi:10.1029/2006jd007174.
- Bourlès, Bernard, Rick Lumpkin, Michael J. McPhaden, Fabrice Hernandez, Paulo Nobre, Edmo Campos, Lisan Yu, et al. 2008. “The Pirata Program.” Bulletin of the American Meteorological Society 89 (8): 1111–1125. doi:10.1175/2008BAMS2462.1.
- Cai, Hong, Wenmin Qin, Lunche Wang, Bo Hu, and Ming Zhang. 2021. “Hourly Clear-Sky Solar Irradiance Estimation in China: Model Review and Validations.” Solar Energy 226: 468–482. doi:10.1016/j.solener.2021.08.066.
- Chou, Ming-Dah, Max J. Suarez, Chang-Hoi Ho, Michael M. H. Yan, and Kyu-Tae Lee. 1998. “Parameterizations for Cloud Overlapping and Shortwave Single-Scattering Properties for Use in General Circulation and Cloud Ensemble Models.” Journal of Climate 11 (2): 202–214. doi:10.1175/1520-0442(1998)011<0202:PFCOAS>2.0.CO;2.
- Decker, Mark, Michael A. Brunke, Zhuo Wang, Koichi Sakaguchi, Xubin Zeng, and Michael G. Bosilovich. 2012. “Evaluation of the Reanalysis Products from GSFC, NCEP, and ECMWF Using Flux Tower Observations.” Journal of Climate 25 (6): 1916–1944. doi:10.1175/JCLI-D-11-00004.1.
- Di Biagio, C., J. Pelon, Y. Blanchard, L. Loyer, S. R. Hudson, V. P. Walden, J.-C Raut, S. Kato, V. Mariage, and M. A. Granskog. 2021. “Toward a Better Surface Radiation Budget Analysis Over Sea Ice in the High Arctic Ocean: A Comparative Study Between Satellite, Reanalysis, and Local-Scale Observations.” Journal of Geophysical Research: Atmospheres 126 (4). doi:10.1029/2020JD032555.
- Eyring, Veronika, Sandrine Bony, Gerald A. Meehl, Catherine A. Senior, Bjorn Stevens, Ronald J. Stouffer, and Karl E. Taylor. 2016. “Overview of the Coupled Model Intercomparison Project Phase 6 (CMIP6) Experimental Design and Organization.” Geoscientific Model Development 9 (5): 1937–1958. doi:10.5194/gmd-9-1937-2016.
- Eyring, Veronika, Peter M. Cox, Gregory M. Flato, Peter J. Gleckler, Gab Abramowitz, Peter Caldwell, William D. Collins, et al. 2019. “Taking Climate Model Evaluation to the Next Level.” Nature Climate Change 9 (2): 102–110. doi:10.1038/s41558-018-0355-y.
- Feng, Fei, and Kaicun Wang. 2018. “Merging Satellite Retrievals and Reanalyses to Produce Global Long-Term and Consistent Surface Incident Solar Radiation Datasets.” Remote Sensing 10 (1): 115. doi:10.3390/rs10010115.
- Feng, Fei, and Kaicun Wang. 2019. “Determining Factors of Monthly to Decadal Variability in Surface Solar Radiation in China: Evidences from Current Reanalyses.” Journal of Geophysical Research: Atmospheres 124 (16): 9161–9182. doi:10.1029/2018JD030214.
- Gelaro, Ronald, Will McCarty, Max J. Suárez, Ricardo Todling, Andrea Molod, Lawrence Takacs, Cynthia Randles, et al. 2017. “The Modern-Era Retrospective Analysis for Research and Applications, Version 2 (MERRA-2).” Journal of Climate 30 (14): 5419–5454. doi:10.1175/JCLI-D-16-0758.1.
- Gilgen, H., and A. Ohmura. 1999. “The Global Energy Balance Archive.” Bulletin of the American Meteorological Society 80 (5): 831–850. doi:10.1175/1520-0477(1999)080<0831:TGEBA>2.0.CO;2.
- Gilgen, H., M. Wild, and A. Ohmura. 1998. “Means and Trends of Shortwave Irradiance at the Surface Estimated from Global Energy Balance Archive Data.” Journal of Climate 11 (8): 2042–2461. doi:10.1175/1520-0442-11.8.2042.
- Gui, Sheng, Shunlin Liang, Kaicun Wang, Lin Li, and Xiaotong Zhang. 2010. “Assessment of Three Satellite-Estimated Land Surface Downwelling Shortwave Irradiance Data Sets.” IEEE Geoscience and Remote Sensing Letters 7 (4):776-780. doi:10.1109/LGRS.2010.2048196.
- Hakuba, M. Z., D. Folini, A. Sanchez-Lorenzo, and M. Wild. 2013. “Spatial Representativeness of Ground-Based Solar Radiation Measurements.” Journal of Geophysical Research: Atmospheres 118 (15): 8585–8597. doi:10.1002/jgrd.50673.
- Ham, Seung-Hee, Wenying Su, William L. Smith, Xianglei Huang, David R. Doelling, Norman G. Loeb, Tyler J. Thorsen, David A. Rutan, Fred G. Rose, and Seiji Kato. 2018. “Surface Irradiances of Edition 4.0 Clouds and the Earth’s Radiant Energy System (CERES) Energy Balanced and Filled (EBAF) Data Product.” Journal of Climate 31 (11): 4501–4527. doi: 10.1175/jcli-d-17-0523.1.
- Hatzianastassiou, N., Christos Matsoukas, A. Fotiadi, K. Pavlakis, Emmanuel Drakakis, Despina Hatzidimitriou, and I. Vardavas. 2005. “Global Distribution of Earth's Surface Shortwave Radiation Budget.” Atmospheric Chemistry and Physics 5: 2847–2867. doi:10.5194/acp-5-2847-2005.
- Hersbach, Hans, Bill Bell, Paul Berrisford, Shoji Hirahara, András Horányi, Joaquín Muñoz-Sabater, Julien Nicolas, et al. 2020. “The ERA5 global reanalysis.” Quarterly Journal of the Royal Meteorological Society 146 (730): 1999–2049. doi:10.1002/qj.3803.
- Hood, L. L., S. Misios, D. M. Mitchell, E. Rozanov, L. J. Gray, K. Tourpali, K. Matthes, et al. 2015. “Solar Signals in CMIP-5 Simulations: The Ozone Response.” Quarterly Journal of the Royal Meteorological Society 141 (692): 2670–2689. doi:10.1002/qj.2553.
- Hou, N., X. Zhang, W. Zhang, J. Xu, C. Feng, S. Yang, K. Jia, Y. Yao, J. Cheng, and B. Jiang. 2020. “A New Long-Term Downward Surface Solar Radiation Dataset Over China from 1958 to 2015.” Sensors (Basel) 20 (21). doi:10.3390/s20216167.
- Huang, Guanghui, Xin Li, Chunlin Huang, Shaomin Liu, Yanfei Ma, and Hao Chen. 2016a. “Representativeness Errors of Point-Scale Ground-Based Solar Radiation Measurements in the Validation of Remote Sensing Products.” Remote Sensing of Environment 181: 198–206. doi:10.1016/j.rse.2016.04.001.
- Huang, Guanghui, Zhanqing Li, Xin Li, Shunlin Liang, Kun Yang, Dongdong Wang, and Yi Zhang. 2019. “Estimating Surface Solar Irradiance from Satellites: Past, Present, and Future Perspectives.” Remote Sensing of Environment 233: 111371. doi:10.1016/j.rse.2019.111371.
- Huang, Guanghui, Xin Li, Mingguo Ma, Hongyi Li, and Chunlin Huang. 2016b. “High Resolution Surface Radiation Products for Studies of Regional Energy, Hydrologic and Ecological Processes Over Heihe River Basin, Northwest China.” Agricultural and Forest Meteorology: 67–78. doi:10.1016/j.agrformet.2016.04.007.
- Huang, Guanghui, Weizhen Wang, Xiaotong Zhang, Shunlin Liang, Shaomin Liu, Tianbao Zhao, Jinming Feng, and Zhuguo Ma. 2013. “Preliminary Validation of GLASS-DSSR Products Using Surface Measurements Collected in Arid and Semi-Arid Regions of China.” International Journal of Digital Earth 6 (sup1): 50–68. doi:10.1080/17538947.2013.825655.
- Jia, Binghao, Zhenghui Xie, Aiguo Dai, Chunxiang Shi, and Feng Chen. 2013. “Evaluation of Satellite and Reanalysis Products of Downward Surface Solar Radiation Over East Asia: Spatial and Seasonal Variations.” Journal of Geophysical Research: Atmospheres 118 (9): 3431–3446. doi:10.1002/jgrd.50353.
- Jiang, Bo, Shunlin Liang, Aolin Jia, Jianglei Xu, Xiaotong Zhang, Zhiqiang Xiao, Xiang Zhao, Kun Jia, and Yunjun Yao. 2019. “Validation of the Surface Daytime Net Radiation Product from Version 4.0 GLASS Product Suite.” IEEE Geoscience and Remote Sensing Letters 16 (4): 509–513. doi:10.1109/lgrs.2018.2877625.
- Jiang, Jonathan H., Hui Su, Chengxing Zhai, Longtao Wu, Kenneth Minschwaner, Andrea M. Molod, and Adrian M. Tompkins. 2015. “An Assessment of Upper Troposphere and Lower Stratosphere Water Vapor in MERRA, MERRA2, and ECMWF Reanalyses Using Aura MLS Observations.” Journal of Geophysical Research: Atmospheres 120 (22): 11468– 11485. doi:10.1002/2015JD023752.
- Jiao, Boyang, Qingxiang Li, Wenbin Sun, and Wild Martin. 2022. “Uncertainties in the Global and Continental Surface Solar Radiation Variations: Inter-Comparison of in-Situ Observations, Reanalyses, and Model Simulations.” Climate Dynamics. doi:10.1007/s00382-022-06222-3.
- Kato, Seiji, Norman G. Loeb, Fred G. Rose, David R. Doelling, David A. Rutan, Thomas E. Caldwell, Lisan Yu, and Robert A. Weller. 2013. “Surface Irradiances Consistent with CERES-Derived Top-of-Atmosphere Shortwave and Longwave Irradiances.” Journal of Climate 26 (9): 2719–2740. doi:10.1175/JCLI-D-12-00436.1.
- Kennedy, Aaron, Baike Xi, Xiquan Dong, and Behnjamin J. Zib. 2012. “Evaluation and Intercomparison of Cloud Fraction and Radiative Fluxes in Recent Reanalyses Over the Arctic Using BSRN Surface Observations.” Journal of Climate 25 (7): 2291–2305. doi: 10.1175/jcli-d-11-00147.1.
- Kim, Yeon-Hee, Seung-Ki Min, Xuebin Zhang, Jana Sillmann, and Marit Sandstad. 2020. “Evaluation of the CMIP6 Multi-Model Ensemble for Climate Extreme Indices.” Weather and Climate Extremes 29: 100269. doi:10.1016/j.wace.2020.100269.
- Konrad, Steffen, Houtz Derek, Vandecrux Baptiste, Abdalati Waleed, Bayou Nicolas, Box Jason, Colgan William, et al. 2020. “Greenland Climate Network (GC-Net) Data.” doi:10.16904/envidat.1.
- Ladd, Carol. 2002. “Evaluation of the NCEP/NCAR Reanalysis in the NE Pacific and the Bering Sea.” Journal of Geophysical Research 107 (C10). doi:10.1029/2001jc001157.
- Letu, Husi, Jiancheng Shi, Ming Li, Tianxing Wang, Huazhe Shang, Yonghui Lei, Dabin Ji, Jianguang Wen, Kun Yang, and Liangfu Chen. 2020. “A Review of the Estimation of Downward Surface Shortwave Radiation Based on Satellite Data: Methods, Progress and Problems.” Science China Earth Sciences 63 (6): 774–789. doi:10.1007/s11430-019-9589-0.
- Li, J. L. F., D. E. Waliser, G. Stephens, Seungwon Lee, T. L'Ecuyer, Seiji Kato, Norman Loeb, and Hsi-Yen Ma. 2013. “Characterizing and Understanding Radiation Budget Biases in CMIP3/CMIP5 GCMs, Contemporary GCM, and Reanalysis.” Journal of Geophysical Research: Atmospheres 118 (15): 8166–8184. doi:10.1002/jgrd.50378.
- Li, Ruohan, Dongdong Wang, and Shunlin Liang. 2021. “Comprehensive Assessment of Five Global Daily Downward Shortwave Radiation Satellite Products.” Science of Remote Sensing 4: 100028. doi:10.1016/j.srs.2021.100028.
- Li, Ruohan, Dongdong Wang, Shunlin Liang, Aolin Jia, and Zhihao Wang. 2022. “Estimating Global Downward Shortwave Radiation from VIIRS Data Using a Transfer-Learning Neural Network.” Remote Sensing of Environment 274: 112999. doi:10.1016/j.rse.2022.112999.
- Liang, Shunlin, Jie Cheng, Kun Jia, Bo Jiang, Qiang Liu, Zhiqiang Xiao, Yunjun Yao, et al. 2021. “The Global Land Surface Satellite (GLASS) Product Suite.” Bulletin of the American Meteorological Society 102 (2): E323–E337. doi:10.1175/BAMS-D-18-0341.1.
- Liang, Shunlin, Dongdong Wang, Tao He, and Yunyue Yu. 2019. “Remote Sensing of Earth’s Energy Budget: Synthesis and Review.” International Journal of Digital Earth 12 (7): 737–780. doi:10.1080/17538947.2019.1597189.
- Loeb, Norman G., David R. Doelling, Hailan Wang, Wenying Su, Cathy Nguyen, Joseph G. Corbett, Lusheng Liang, Cristian Mitrescu, Fred G. Rose, and Seiji Kato. 2018. “Clouds and the Earth’s Radiant Energy System (CERES) Energy Balanced and Filled (EBAF) Top-of-Atmosphere (TOA) Edition-4.0 Data Product Energy Balanced and Filled (EBAF) Top-of-Atmosphere (TOA) Edition-4.0 Data Product.” Journal of Climate 31 (2): 895–918. doi:10.1175/JCLI-D-17-0208.1.
- Lu, Yunbo, Lunche Wang, Canming Zhu, Ling Zou, Ming Zhang, Lan Feng, and Qian Cao. 2023a. “Predicting Surface Solar Radiation Using a Hybrid Radiative Transfer–Machine Learning Model.” Renewable and Sustainable Energy Reviews 173: 113105. doi:10.1016/j.rser.2022.113105.
- Lu, Y., R. Zhang, L. Wang, X. Su, M. Zhang, H. Li, S. Li, and J. Zhou. 2023b. “Prediction of Diffuse Solar Radiation by Integrating Radiative Transfer Model and Machine-Learning Techniques.” Science of The Total Environment 859 (Pt 1):160269. doi:10.1016/j.scitotenv.2022.160269.
- Ma, Y., and R. T. Pinker. 2012. “Modeling Shortwave Radiative Fluxes from Satellites.” Journal of Geophysical Research: Atmospheres 117 (D23): n/a. doi:10.1029/2012JD018332.
- Ma, Qian, Kaicun Wang, and Martin Wild. 2015. “Impact of Geolocations of Validation Data on the Evaluation of Surface Incident Shortwave Radiation from Earth System Models.” Journal of Geophysical Research: Atmospheres 120 (14): 6825–6844. doi:10.1002/2014JD022572.
- Mackie, Anna, Martin Wild, Helen Brindley, Doris Folini, and Paul I. Palmer. 2020. “Observed and CMIP5-Simulated Radiative Flux Variability Over West Africa.” Earth and Space Science (Hoboken, N.J.) 7 (5): n/a. doi:10.1029/2019EA001017.
- McPhaden, Michael J., Antonio J. Busalacchi, Robert Cheney, Jean-René Donguy, Kenneth S. Gage, David Halpern, Ming Ji, et al. 1998. “The Tropical Ocean-Global Atmosphere Observing System: A Decade of Progress.” Journal of Geophysical Research: Oceans 103 (C7): 14169–14240. doi:10.1029/97JC02906.
- McPhaden, M. J., G. Meyers, K. Ando, Y. Masumoto, V. S. N. Murty, M. Ravichandran, F. Syamsudin, J. Vialard, L. Yu, and W. Yu. 2009. “RAMA: The Research Moored Array for African–Asian–Australian Monsoon Analysis and Prediction*.” Bulletin of the American Meteorological Society 90 (4): 459–480. doi:10.1175/2008BAMS2608.1.
- Medovaya, M. 2002. “Assessing Ocean Buoy Shortwave Observations Using Clear-sky Model Calculations.” Journal of Geophysical Research 107 (C2), doi:10.1029/2000jc000558.
- Mellit, Adel, and Soteris A. Kalogirou. 2008. “Artificial Intelligence Techniques for Photovoltaic Applications: A Review.” Progress in Energy and Combustion Science 34 (5): 574–632. doi:10.1016/j.pecs.2008.01.001.
- Molod, A., L. Takacs, M. Suarez, and J. Bacmeister. 2015. “Development of the GEOS-5 Atmospheric General Circulation Model: Evolution from MERRA to MERRA2.” Geoscientific Model Development 8 (5): 1339–1356. doi:10.5194/gmd-8-1339-2015.
- Ohmura, A., E. G. Dutton, R. Philipona, R. Pinker, C. H. Whitlock, K. Dehne, M. Wild, et al. 1998. “Baseline Surface Radiation Network (BSRN/WCRP): New Precision Radiometry for Climate Research.” Bulletin of the American Meteorological Society 79 (10): 2115–21136. doi:10.1175/1520-0477(1998)079<2115:BSRNBW>2.0.CO;2.
- Pinker, R. T., and I. Laszlo. 1992. “Modeling Surface Solar Irradiance for Satellite Applications on a Global Scale.” Journal of Applied Meteorology 31 (2): 194–211. doi:10.1175/1520-0450(1992)031<0194:MSSIFS>2.0.CO;2.
- Qin, Wenmin, Lunche Wang, Christian A. Gueymard, Muhammad Bilal, Aiwen Lin, Jing Wei, Ming Zhang, and Xuefang Yang. 2020. “Constructing a Gridded Direct Normal Irradiance Dataset in China During 1981–2014.” Renewable and Sustainable Energy Reviews 131: 110004. doi:10.1016/j.rser.2020.110004.
- Qiu, Tianzhi, Lunche Wang, Yunbo Lu, Ming Zhang, Wenmin Qin, Shaoqiang Wang, and Lizhe Wang. 2022. “Potential Assessment of Photovoltaic Power Generation in China.” Renewable and Sustainable Energy Reviews 154: 111900. doi:10.1016/j.rser.2021.111900.
- Saha, Suranjana, Shrinivas Moorthi, Hua-Lu Pan, Xingren Wu, Jiande Wang, Sudhir Nadiga, Patrick Tripp, et al. 2010. “The NCEP Climate Forecast System Reanalysis.” Bulletin of the American Meteorological Society 91 (8): 1015–1058. doi:10.1175/2010BAMS3001.1.
- Sakamoto, Toshihiro, Anatoly A. Gitelson, Brian D. Wardlow, Shashi B. Verma, and Andrew E. Suyker. 2011. “Estimating Daily Gross Primary Production of Maize Based Only on MODIS WDRVI and Shortwave Radiation Data.” Remote Sensing of Environment 115 (12): 3091–3101. doi:10.1016/j.rse.2011.06.015.
- Song, Y. H., E. S. Chung, and S. Shahid. 2022. “Uncertainties in Evapotranspiration Projections Associated with Estimation Methods and CMIP6 GCMs for South Korea.” Science of The Total Environment 825: 153953. doi:10.1016/j.scitotenv.2022.153953.
- Song, Zhe, Zhigang Ren, Qinli Deng, Xin Kang, Mi Zhou, Daoru Liu, and Xin Chen. 2020. “General Models for Estimating Daily and Monthly Mean Daily Diffuse Solar Radiation in China's Subtropical Monsoon Climatic Zone.” Renewable Energy 145: 318–332. doi:10.1016/j.renene.2019.06.019.
- Stubenrauch, C. J., W. B. Rossow, S. Kinne, S. Ackerman, G. Cesana, H. Chepfer, L. Di Girolamo, et al. 2013. “Assessment of Global Cloud Datasets from Satellites: Project and Database Initiated by the GEWEX Radiation Panel.” Bulletin of the American Meteorological Society 94 (7): 1031–1049. doi:10.1175/bams-d-12-00117.1.
- Suarez, Max J., and Ming-Dah Chou. 1999. “A Solar Radiation Parameterization for Atmospheric Studies.” NASA Technical Memorandum 15: 40–42.
- Sun, Daozhong, Changdong Ji, Wenxiao Sun, Yikun Yang, and Haosen Wang. 2018. “Accuracy Assessment of Three Remote Sensing Shortwave Radiation Products in the Arctic.” Atmospheric Research 212: 296–308. doi:10.1016/j.atmosres.2018.01.003.
- Tahir, Zia ul Rehman, Muhammad Asim, Muhammad Azhar, Ghulam Moeenuddin, and Muhammad Farooq. 2021. “Correcting Solar Radiation from Reanalysis and Analysis Datasets with Systematic and Seasonal Variations.” Case Studies in Thermal Engineering 25: 100933. doi:10.1016/j.csite.2021.100933.
- Tang, Wenjun, Jun Qin, Kun Yang, Shaomin Liu, Ning Lu, and Xiaolei Niu. 2016. “Retrieving High-Resolution Surface Solar Radiation with Cloud Parameters Derived by Combining MODIS and MTSAT Data.” Atmospheric Chemistry and Physics 16 (4): 2543–2557. doi:10.5194/acp-16-2543-2016.
- Tang, Wenjun, Kun Yang, Jie He, and Jun Qin. 2010. “Quality Control and Estimation of Global Solar Radiation in China.” Solar Energy 84 (3): 466–475. doi:10.1016/j.solener.2010.01.006.
- Tang, Wenjun, Kun Yang, Jun Qin, Jun Li, and Jiangang Ye. 2021. “How Accurate Are Satellite-Derived Surface Solar Radiation Products Over Tropical Oceans?” Journal of Atmospheric and Oceanic Technology 38 (2): 283–291. doi:10.1175/JTECH-D-20-0099.1.
- Urraca, Ruben, Thomas Huld, Ana Gracia-Amillo, Francisco Javier Martinez-de-Pison, Frank Kaspar, and Andres Sanz-Garcia. 2018. “Evaluation of Global Horizontal Irradiance Estimates from ERA5 and COSMO-REA6 Reanalyses Using Ground and Satellite-Based Data.” Solar Energy 164: 339–354. doi:10.1016/j.solener.2018.02.059.
- Wang, Dongdong, Shunlin Liang, Ruohan Li, and Aolin Jia. 2021a. “A Synergic Study on Estimating Surface Downward Shortwave Radiation from Satellite Data.” Remote Sensing of Environment 264: 112639. doi:10.1016/j.rse.2021.112639.
- Wang, Gaofeng, Tianxing Wang, and Huazhu Xue. 2021b. “Validation and Comparison of Surface Shortwave and Longwave Radiation Products Over the Three Poles.” International Journal of Applied Earth Observation and Geoinformation 104: 102538. doi:10.1016/j.jag.2021.102538.
- Wang, Wanqiu, Pingping Xie, Soo-Hyun Yoo, Yan Xue, Arun Kumar, and Xingren Wu. 2011. “An Assessment of the Surface Climate in the NCEP Climate Forecast System Reanalysis.” Climate Dynamics 37 (7–8): 1601–1620. doi:10.1007/s00382-010-0935-7.
- Wild, Martin. 2008. “Short-wave and Long-Wave Surface Radiation Budgets in GCMs: A Reviewbased on the IPCC-AR4/CMIP3 Models.” Tellus A: Dynamic Meteorology and Oceanography 60 (5): 932–945. doi:10.1111/j.1600-0870.2008.00342.x.
- Wild, Martin. 2017. “Changes in Shortwave and Longwave Radiative Fluxes as Observed at BSRN Sites and Simulated with CMIP5 Models.” AIP Conference Proceedings 1810: 090014. doi:10.1063/1.4975554.
- Wild, Martin. 2020. “The Global Energy Balance as Represented in CMIP6 Climate Models.” Climate Dynamics 55 (3–4): 553–577. doi:10.1007/s00382-020-05282-7.
- Wild, Martin, Doris Folini, Maria Z. Hakuba, Christoph Schär, Sonia I. Seneviratne, Seiji Kato, David Rutan, Christof Ammann, Eric F. Wood, and Gert König-Langlo. 2014. “The Energy Balance Over Land and Oceans: An Assessment Based on Direct Observations and CMIP5 Climate Models.” Climate Dynamics 44 (11–12): 3393–3429. doi:10.1007/s00382-014-2430-z.
- Wild, Martin, Doris Folini, Christoph Schär, Norman Loeb, Ellsworth G. Dutton, and Gert König-Langlo. 2012. “The Global Energy Balance from a Surface Perspective.” Climate Dynamics 40 (11–12): 3107–3134. doi:10.1007/s00382-012-1569-8.
- Wild, Martin, Atsumu Ohmura, Christoph Schär, Guido Müller, Doris Folini, Matthias Schwarz, Maria Zyta Hakuba, and Arturo Sanchez-Lorenzo. 2017. “The Global Energy Balance Archive (GEBA) Version 2017: A Database for Worldwide Measured Surface Energy Fluxes.” Earth System Science Data 9 (2): 601–613. doi:10.5194/essd-9-601-2017.
- Wu, Futing, and Congbin Fu. 2011. “Assessment of GEWEX/SRB Version 3.0 Monthly Global Radiation Dataset Over China.” Meteorology and Atmospheric Physics 112 (3–4): 155–166. doi:10.1007/s00703-011-0136-x.
- Xia, X. A., P. C. Wang, H. B. Chen, and F. Liang. 2006. “Analysis of Downwelling Surface Solar Radiation in China from National Centers for Environmental Prediction Reanalysis, Satellite Estimates, and Surface Observations.” Journal of Geophysical Research 111 (D9), doi:10.1029/2005jd006405.
- Yan, Hongru, Jianping Huang, Patrick Minnis, Tianhe Wang, and Jianrong Bi. 2011. “Comparison of CERES Surface Radiation Fluxes with Surface Observations Over Loess Plateau.” Remote Sensing of Environment 115 (6): 1489–1500. doi:10.1016/j.rse.2011.02.008.
- Yang, Shuyue, Xiaotong Zhang, Jiawen Xu, Chunjie Feng, Shikang Guan, Yunjun Yao, and Kun Jia. 2022. “Quantification of the Urbanization Impacts on Solar Dimming and Brightening Over China.” Environmental Research Letters 17 (8):084001. doi: 10.1088/1748-9326/ac7e61.
- Yu, Yue-Chi, Jiancheng Shi, Tianxing Wang, Husi Letu, and Changjun Zhao. 2021. “All-Sky Total and Direct Surface Shortwave Downward Radiation (SWDR) Estimation from Satellite: Applications to MODIS and Himawari-8.” International Journal of Applied Earth Observation and Geoinformation 102: 102380. doi:10.1016/j.jag.2021.102380.
- Yu, Y., T. Wang, and J. Shi. 2018. “Assessment of two Satellite-Based Land Surface Shortwave Downward Radiation Datasets Over the Tibetan Plateau.” IEEE International Geoscience and Remote Sensing Symposium: 1180–1182, doi:10.1109/IGARSS.2018.8519578.
- Yuan, Kunxiaojia, Qing Zhu, William J. Riley, Fa Li, and Huayi Wu. 2022. “Understanding and Reducing the Uncertainties of Land Surface Energy Flux Partitioning Within CMIP6 Land Models.” Agricultural and Forest Meteorology 319: 108920. doi:10.1016/j.agrformet.2022.108920.
- Zhang, Xiaotong, Shunlin Liang, Guoxin Wang, Yunjun Yao, Bo Jiang, and Jie Cheng. 2016. “Evaluation of the Reanalysis Surface Incident Shortwave Radiation Products from NCEP, ECMWF, GSFC, and JMA Using Satellite and Surface Observations.” Remote Sensing 8 (3): 225. doi:10.3390/rs8030225.
- Zhang, Xiaotong, Shunlin Liang, Martin Wild, and Bo Jiang. 2015a. “Analysis of Surface Incident Shortwave Radiation from Four Satellite Products.” Remote Sensing of Environment 165: 186–202. doi:10.1016/j.rse.2015.05.015.
- Zhang, Xiaotong, Shunlin Liang, Gongqi Zhou, Haoran Wu, and Xiang Zhao. 2014. “Generating Global Land Surface Satellite Incident Shortwave Radiation and Photosynthetically Active Radiation Products from Multiple Satellite Data.” Remote Sensing of Environment 152: 318–332. doi:10.1016/j.rse.2014.07.003.
- Zhang, Taiping, Paul W. Stackhouse, Shashi K. Gupta, Stephen J. Cox, and J. Colleen Mikovitz. 2015b. “The Validation of the GEWEX SRB Surface Longwave Flux Data Products Using BSRN Measurements.” Journal of Quantitative Spectroscopy and Radiative Transfer 150: 134–147. doi:10.1016/j.jqsrt.2014.07.013.
- Zhang, Weiyu, Xiaotong Zhang, Yu Wei, Ning Hou, Jiawen Xu, Chunjie Feng, and Kun Jia. 2020. “Evaluation of Downward Shortwave Radiation Estimations Over Tropical Ocean Surface Based on Bayesian Model Averaging Method.” IGARSS 2020 - 2020 IEEE International Geoscience and Remote Sensing Symposium 6686–6689. doi:10.1109/igarss39084.2020.9323506.
- Zhang, Xiaotong, Xiang Zhao, Wenhong Li, Shunlin Liang, Dongdong Wang, Qiang Liu, Yunjun Yao, et al. 2019. “An Operational Approach for Generating the Global Land Surface Downward Shortwave Radiation Product from MODIS Data.” IEEE Transactions on Geoscience and Remote Sensing 57 (7): 4636–4650. doi:10.1109/TGRS.2019.2891945.
- Zhao, Lei, Xuhui Lee, and Shoudong Liu. 2013. “Correcting Surface Solar Radiation of two Data Assimilation Systems Against FLUXNET Observations in North America.” Journal of Geophysical Research: Atmospheres 118 (17): 9552–9564. doi:10.1002/jgrd.50697.
- Zhou, Bingqian, Shujuan Hu, Yongli He, Siyi Wang, Deqian Li, and Guolin Feng. 2022. “Quantitative Evaluations of Subtropical Westerly Jet Simulations Over East Asia Based on Multiple CMIP5 and CMIP6 GCMs.” Atmospheric Research 276: 106257. doi:10.1016/j.atmosres.2022.106257.
- Zhou, Yingji, Guangjian Yan, Jing Zhao, Qing Chu, Yanan Liu, Kai Yan, Yiyi Tong, Xihan Mu, Donghui Xie, and Wuming Zhang. 2018. “Estimation of Daily Average Downward Shortwave Radiation Over Antarctica.” Remote Sensing 10 (3): 422. doi:10.3390/rs10030422.
- Zou, Ling, Lunche Wang, Jiarui Li, Yunbo Lu, Wei Gong, and Ying Niu. 2019. “Global Surface Solar Radiation and Photovoltaic Power from Coupled Model Intercomparison Project Phase 5 Climate Models.” Journal of Cleaner Production 224: 304–324. doi:10.1016/j.jclepro.2019.03.268.
Appendix
Figure A1. Evaluation results of monthly Rs estimates from seven products against the ground measurements from BSRN.
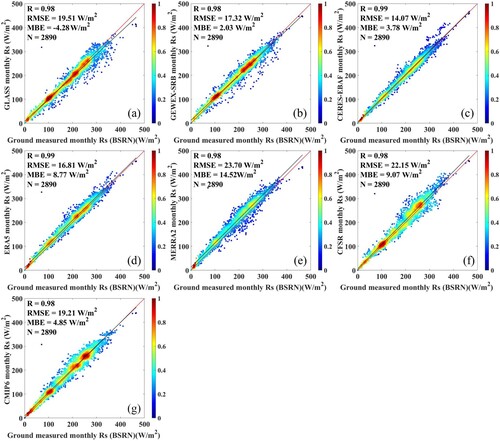
Figure A2. Evaluation results of monthly Rs estimates from seven products against the ground measurements from CMA.
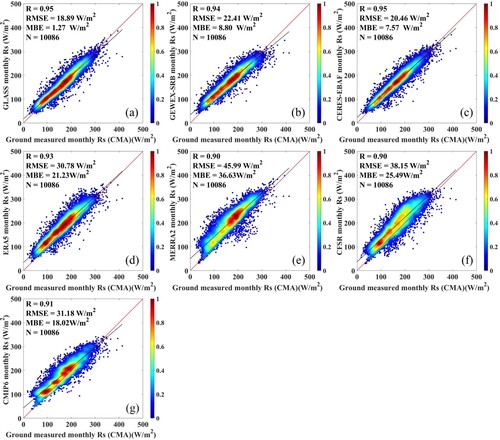
Figure A3. Evaluation results of monthly Rs estimates from seven products against the ground measurements from GEBA.
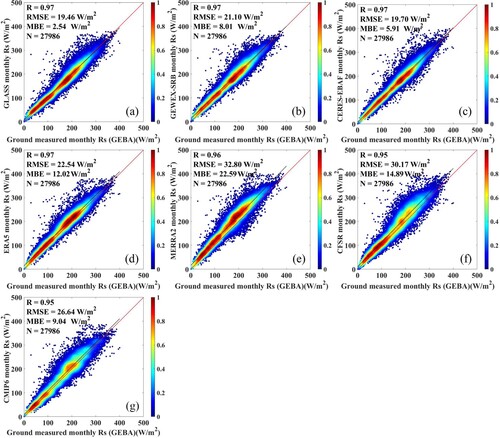
Figure A4. Evaluation results of monthly Rs estimates from seven products against the ground measurements from GC-NET.
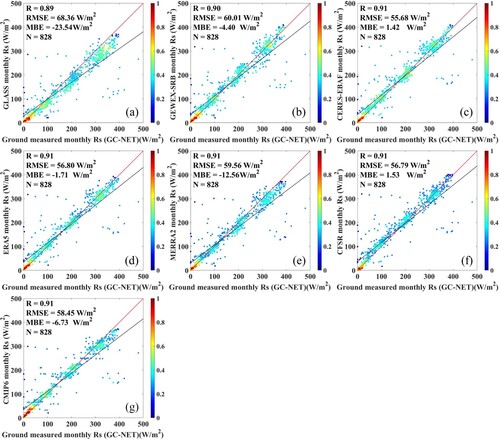
Figure A5. Evaluation results of monthly Rs estimates from seven products against the ground measurements from buoys.