
 ?Mathematical formulae have been encoded as MathML and are displayed in this HTML version using MathJax in order to improve their display. Uncheck the box to turn MathJax off. This feature requires Javascript. Click on a formula to zoom.
ABSTRACT
Shortwave radiation is an influential driver of global hydrological cycle, as its variation will alter evapotranspiration (ET). While climate change discussion extensively examined ET response to temperature, wind speed and land use/cover variations, little is known about the contribution of shortwave radiation balance on ET partly because of data availability. In this study, we applied the newly-released Global LAnd Surface Satellite (GLASS) products to detect changes in shortwave radiation and albedo for 2003–2018 over China, and quantified their contributions on potential evapotranspiration (PET) which is the upper limit of ET and generally the basis to estimate it. The results showed that downward shortwave radiation declined, together with a slight decrease in albedo, causing a decrease of net shortwave radiation. While climate change affected PET, the decreased net shortwave radiation reduced PET during the period. We identified a hotspot area in the north China plain that is one of the main agricultural production regions, as the radiation balance induced a contrasting effect on PET for the warm and the cold seasons. Our study indicates that it is important to consider shortwave radiation balance when estimating PET and ET to make reliable evaluation of climate change on hydrological cycle and ecosystem response.
Highlights
Changes in shortwave radiation balance over China were detected for the period of 2003–2018.
The decreased net shortwave radiation reduced PET over China.
Considering shortwave radiation balance is important when estimating PET and associated ET.
1. Introduction
Evapotranspiration (ET) is a key process within the Earth's surface water and energy balance (Hupet and Vanclooster Citation2001; Oki and Kanae Citation2006). The increase in ET could disturb surface and subsurface runoff, groundwater storage and consequently result in water management issues (Maček, Bezak, and Šraj Citation2018). Spatio-temporal information of ET helps to better understand the evaporative depletion and to establish links between land use, water allocation and water use (Bastiaanssen et al. Citation2005). However, since ET is difficult to be measured directly in the field (McMahon, Finlayson, and Peel Citation2016), another closely related concept, i.e. potential evapotranspiration (PET), is generally applied to document changes in climatic conditions that constrain the actual ET process (McVicar et al. Citation2005).
The term "potential evapotranspiration" was first introduced by Thornthwaite (Citation1948) and well defined by Penman (Citation1956) as "a measure of the transpiration rate from an extensive short green cover completely shading the ground and adequately supplied with water". PET is not only linked to the climate system, but also to the physical characteristics of the evaporative surfaces (e.g. bare soil, water surface and crop) (Katerji and Rana Citation2011). There is another related concept, i.e. reference crop evapotranspiration (ET0), which is generally assumed as a surrogate of PET for agricultural crop systems (McMahon, Finlayson, and Peel Citation2016; Xiang et al. Citation2020). Applications of PET or ET0 are not only in the hydrological and meteorological studies, but also in irrigation planning and crop water requirements (Anabalón and Sharma Citation2017; Yao et al. Citation2020; Feng et al. Citation2019). Therefore, the response of PET to the varying environments (e.g. radiation balance) has become increasingly important.
The ET process consumes approximately 80% of the net radiation absorbed by the land surface, which determines the spatio-temporal pattern of water cycle. Any alterations in the available radiative energy may induce changes in the water fluxes (Wild and Liepert Citation2010). The downward shortwave radiation has undergone great changes: it declined extensively during 1950-1980s (dimming) and then recovered globally (brightening) (Wild Citation2016). There is no exception of China where solar radiation has been incremental since 1990s (Yang, Wang, and Wild Citation2018). Moreover, land surface albedo influences hydrological cycle through reshaping the absorption of radiational energy. During the early twentieth century, albedo decreased in the north hemisphere, while increased in the south hemisphere (Zhang et al. Citation2010). Similarly, it had different trends in different regions in China due to ecological restorations and urbanizations (Yan et al. Citation2021; Jiang et al. Citation2021, Citation2022). Nevertheless, existing studies are primarily based on reanalysis datasets and/or in-situ data due to the difficulty of obtaining continuous and long-term radiative datasets.
Detecting trends in ET0 has attracted extensive attention. Due to global warming, caused by the incremental amount of greenhouse gas emissions (Pachauri et al. Citation2014), it is expected that the atmospheric evaporative demand would increase as well. However, the decrease in ET0 has been extensively reported in many areas of the world before 1990s whose major interpretation was the decrease in wind speed in some regions (Jhajharia et al. Citation2012; Yin et al. Citation2010; McVicar et al. Citation2012). After then, ET0 had an increasing trend in some regions, such as Iran (Dinpashoh et al. Citation2019), China (Li, Qin, and Rong Citation2022), the United States (Ficklin, Robeson, and Knouft Citation2016), and was usually most sensitive to air temperature (Guo, Westra, and Maier Citation2017). Nevertheless, fewer studies focuse on the changes in PET that is slightly different from ET0, and little is known about the effect of energy availability on PET, which may cause substantial uncertainties in quantification of hydrological cycle and in evaluation of ecosystem response.
There are many methods available for PET estimations, which generally can be grouped into four categories: radiation-based, temperature-based, mass-transfer, and their combination methods (Li et al. Citation2016). These methods behave differently because of their diverse assumptions and input variables (McMahon, Finlayson, and Peel Citation2016). How to select an appropriate PET model is based on the regional climate conditions and underlying surface types. The performance of PET models over China has been evaluated in a few studies, which reported that the combination methods (e.g. the Penman model) had their special advantages in representing the energy distribution and the atmospheric evaporative demand (Li et al. Citation2016; Yang et al. Citation2021).
To isolate the response of PET to radiation factors over the entire China, a differentiation equation method (Jiang et al. Citation2021) is used based on the Penman model in this study. Radiation factors include surface albedo, downward shortwave radiation, and their integrated effect, i.e. net shortwave radiation. In this study, we focus on the contributions of radiation factors on PET, and our objectives are: (1) to detect the changes in the radiation factors; (2) to quantify spatio-temporal variations in PET; and (3) to reveal the role of radiation factors in the PET process. The findings from this study would be useful for understanding the role of radiation balance in hydrological cycle.
2. Data and methods
2.1. Data
Land surface radiation balance data used in this study included albedo and downward shortwave radiation, and they were available from the Global LAnd Surface Satellite (GLASS) product suite (http://www.geodata.cn/) (Liang et al. Citation2021). The GLASS albedo product was generated by using an angular bin algorithm together with a statistics-based temporal filter algorithm (Liu et al. Citation2013), which was the 8-day composite data and then linearly interpolated into a daily resolution. The GLASS downward shortwave radiation product was estimated by using a direct estimation method based on the top atmosphere spectral reflectance of MODIS (Zhang et al. Citation2014). These data were attractive due to their reliable accuracy. The GLASS provided products for the period since the year of 2000, but there was a great deal of missing data for the years from 2000 to 2002; thus, the study focused the period of 2003–2018. Besides these radiation balance variables, daily meteorological records (mean, maximum and minimum temperature, wind speed, and relative humidity) of 2481 national meteorological stations from 2003 to 2018 were obtained from China Meteorological Administration (http://data.cma.cn/) and interpolated into grid format with a spatial resolution of 0.25°. The data interpolation might introduce uncertainties and consequently impacted the PET calculation. However, we obtained the most available stations of data in interpolation, and the gridded meteorological data from the interpolation have been successfully used in a few studies (Jiang et al. Citation2022; Meng et al. Citation2020; Wang et al. Citation2020). All these data were included to calculate PET.
2.2. Method
Numerous methods can be used to calculate PET, among which the Penman model gives satisfactory performance in various climatic conditions in China (Yang et al. Citation2021). The Penman model is physically based and explicitly incorporated in both energy balance and aerodynamic aspects (Penman Citation1963), and it avoids calculating complicated parameters, e.g. various conductance in the Penman-Monteith model (Monteith Citation1965). As mentioned above, PET has to be calculated based on meteorological records and radiation data in this study. The Penman model (Penman Citation1963) is expressed in the form as
(1)
(1) where ETp is the PET (mm day−1); Δ is the slope of the vapor pressure curve (kPa °C−1); γ is the psychrometric constant (kPa °C−1); λ is the latent heat of vaporization (MJ kg−1); Rn is the net radiation (MJ m−2 d−1), which is derived from the GLASS radiative products in this study; G is the soil heat flux density (MJ m−2 d−1), which can be neglected at a daily time step; uz is wind speed at Z meter high (m s−1); eZs and eZa are saturation and actual vapor pressure at Z meter high (kPa).
The net radiation (Rn) in Equation (1) is the sum of net shortwave and longwave radiation, which is expressed as
(2)
(2) where Rns is the net shortwave radiation (W m−2), Rnl is the net longwave radiation (W m−2), α is the surface albedo, Rs is the downward shortwave radiation (W m−2), Rl is the downward longwave radiation (W m−2).
A differentiation equation method (Jiang et al. Citation2021) is used to attribute the change in PET. Following the Penman model, contributions of radiation factors (i.e. albedo, shortwave radiation and net shortwave radiation) to PET can be expressed as
(3)
(3)
(4)
(4)
(5)
(5) where
and
are the albedo-induced PET and shortwave radiation-induced PET, respectively;
is the net shortwave radiation-induced PET, which is the combined effect of albedo and shortwave radiation to PET;
,
and
are the changes in albedo, shortwave radiation and net shortwave radiation, respectively, and these trends and PET changes can be calculated from long-term remote sensing products using the Mann-Kendall test and the Sen’s slope estimator (Mohammad et al. Citation2022). The differential method is simple but effective, and has been successfully applied in other studies, such as the attribution of climate factors on ET0 trends (Liu et al. Citation2011) and the control of vegetation on energy fluxes (Forzieri et al. Citation2020).
3. Results
3.1 Spatial–temporal patterns of radiation factors
To understand the intrinsic causal mechanism of radiation to PET changes, the variations in radiation factors were detected for the warm (from May to September) and cold (from October to April) seasons. The radiation factors used in this study include surface albedo, shortwave radiation, and their combined effect, namely, net shortwave radiation. illustrates seasonal spatial distributions of surface albedo and shortwave radiation over China. The differences in magnitudes between the both seasons can be observed. For the vegetation growing season (i.e. the warm season), significant upward trends of albedo appear in the southeast of China, and most significant downward trends are shown in the northwest of China, especially in the Loess Plateau ((a,e)). Comparatively, for the vegetation withering season (i.e. the cold season), the variations in albedo are higher, especially in the NE region (>0.0035 mm yr−1) and the strip between NW and NC regions (<−0.0035 mm yr−1) ((b,f)). Generally, China is dominated by decreasing albedo in the two seasons during 2003–2018 ((e)). In contrast, decreasing trends in the downward shortwave radiation are overwhelming during the two seasons, particularly in the SE region ((f)). An interesting point to be noted is that the changes in the NC region are totally different in the two seasons, i.e. an increasing trend (0.52 W m−2 yr−1) in the warm season and a decreasing trend (−0.25 W m−2 yr−1) in the cold season ((c,d)). Overall, the dominance of shortwave radiation reduction can be found over the entire China ((e,f)).
Figure 1. Trends of surface albedo (α) in the (a) warm and (b) cold seasons, and shortwave radiation (Rs) in the (c) warm and (d) cold seasons; the trends of α and Rs averaged in six sub-regions and China in the (e) warm and (f) cold seasons. The area of China (CH) is divided into six subregions: the southeast (SE), the southwest (SW), the north China (NC), the Tibet Plateau (TP), the northeast (NE) and the northwest (NW). The black cross (+) and asterisk (*) denote statistical significance at P < 0.05.
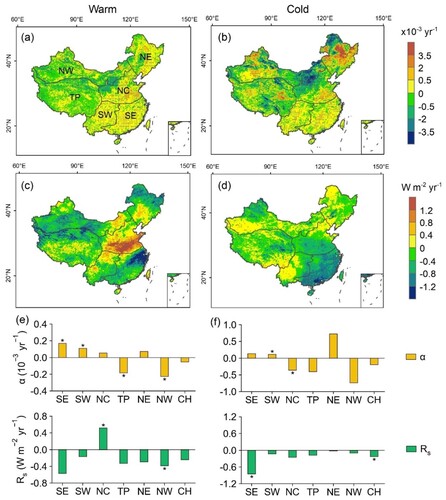
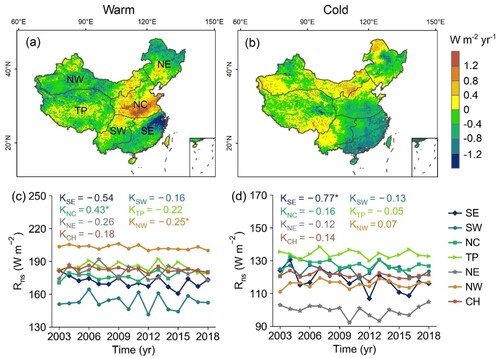
Based on the GLASS albedo and shortwave radiation data, we computed the net shortwave radiation (Rns). As shown in , the change in the Rns agrees with that of the downward shortwave radiation, which indicates the changes in the downward shortwave radiation is the main contributor to Rns. In contrast, during the cold season, the change rate of Rns in the NW region reaches 0.07 W m−2 yr−1, where the positive effect of albedo offsets the negative trend of shortwave radiation. In general, Rns shows negative trends over the entire China during the two seasons with a slope of approximately −0.15 W m−2 yr−1; therefore, China as a whole receives less energy to drive the evaporation capacity.
Figure 2. Trends of net shortwave radiation (Rns) in the (a) warm and (b) cold seasons; trends of Rns averaged in six sub-regions and China in the (c) warm and (d) cold seasons. The black cross (+) and asterisk (*) denote statistical significance at P < 0.05. K represents the trends of PET in the six subregions and the whole China.
3.2. PET changes
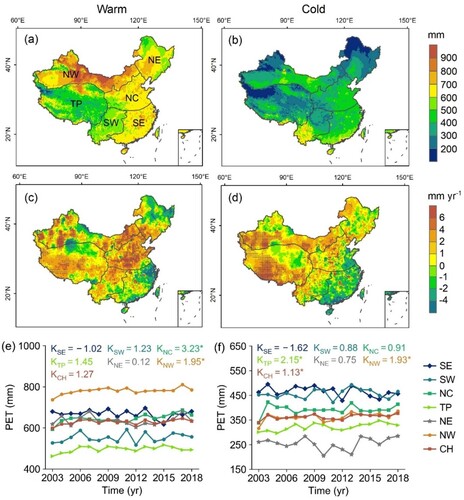
The spatial and temporal variabilities of PET in the warm and cold seasons are plotted in . In the warm season, the spatial distribution of PET has a diverse structure with the highest values in the NW region (>800 mm) and the lowest values in the TP region (<500 mm), while roughly spatial homogeneity is observed in the cold season with most PET values below 500 mm ((a,b)). This result implies atmospheric evaporating capability is larger in the warm season than in the cold season. From (c,d), it can be seen that China is characterized by complicated spatial patterns in the change of PET, which reflects considerable and complex mechanisms of climatic variables (e.g. radiation) to PET changes. In the warm season, the area with increased PET occupies 70% of China, of which 30% is statistically significant at P < 0.05, mainly distributed in the NC and the east of NW regions (>6 mm yr−1), and the area with decreasing trends takes up 30%, primarily located in the SE regions ((c)). Similarly, in the cold season, the significant positive trends are found in the NW and the TP regions (> 4 mm yr−1), and the negative trends are clustered in the SE region (<−1 mm yr−1) ((d)). Except for the SE region, PET has upward trends in the other five regions for the two seasons during 2003–2018; however, the difference is observed that significant positive changes in the warm season are situated in the NC and NW regions, but those in the cold season distribute in the TP and NW regions ((e,f)). All these suggest rising evaporation capacity over the entire China.
Figure 3. Spatial and temporal distributions of PET during 2003-2018: (a) the mean PET, (c) the trend of PET, (e) long-term dynamics of PET in the warm season; and (b) the mean PET, (d) the trend of PET, (f) long-term dynamics of PET in the cold season. The black cross (+) and asterisk (*) denote statistical significance at P < 0.05. Please note that China (CH) is divided into six subregions: the southeast (SE), the southwest (SW), the north China (NC), the Tibet Plateau (TP), the northeast (NE) and the northwest (NW). K represents the trends of PET in six subregions and the whole China.
3.3. Contributions to PET changes
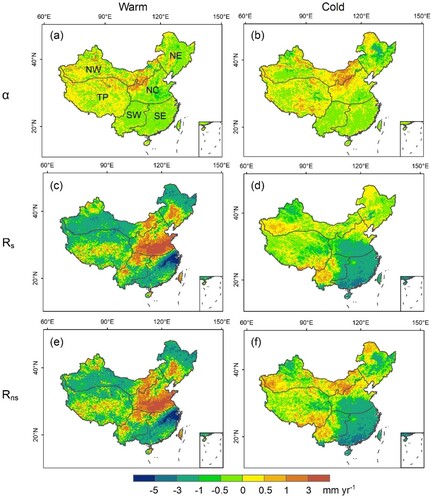
Given the variations in the radiation factors, PET has experienced corresponding changes in response to the energy availability. exhibits the contributions of the radiation factor changes to seasonal PET process. In the warm season, the decline in albedo in the NW and the TP regions leads to PET increases at 0.19 and 0.13 mm yr−1, respectively, and the rise in albedo in the other regions causes PET decrease ((a)). In the cold season, the spatial pattern and magnitude of PET response to albedo are similar to those in the warm season, but in the NW region, the contribution is much larger, reaching 0.23 mm yr−1 ((b)). Changes in PET induced by shortwave radiation are greater than those by albedo during the two seasons. PET receives negative contributions from shortwave radiation in five of the six regions, especially in the northeast of SW (<−5 mm yr−1), and higher positive contribution in the NC region with maximum values up to 3 mm yr−1 ((c)). By contrast, in the cold season, the effect of shortwave radiation to PET is much smaller ranging from −3 to 1 mm yr−1, of which 68.4% is negative effect ((d)). Their combined effects to PET changes (i.e. net shortwave radiation-induced PET) are comparable with those of shortwave radiation, except in the cold season in some parts of NW and NE where albedo changes intensify PET changes with absolute values above 3 mm yr−1 ((e,f)).
Figure 4. Spatial distributions of the contributions of surface albedo (α), shortwave radiation (Rs) and net shortwave radiation (Rns) to PET: (a), (c) and (e) for the warm season; (b), (d) and (f) for the cold season.
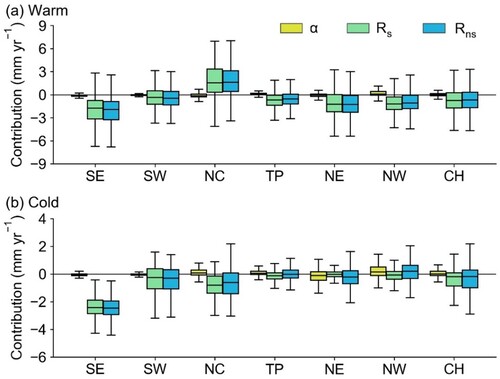
To better explore the role of the radiation factors in the PET process, we computed the contributions with respect to the different subregions in China, as shown in . In the warm season, the role of albedo in PET changes in all the six regions is neglectable, while the downward shortwave radiation exerts big impacts with highest positive effect in the NC region (1.83 mm yr−1) and negative effect in the SE region (−2.10 mm yr−1). The combination of albedo and solar radiation provides an average radiation (Rns) induced PET of −0.63 and −0.45 mm yr−1 in the warm and cold seasons over China, respectively. This situation is different in the cold season. The effect of albedo partly offsets or overtakes that of shortwave radiation in four of the six regions (i.e. the NC, TP, NE and NW regions), although the response of PET to Rns is still negative over the entire China. Despite spatial variabilities, the net shortwave radiation relieved PET in approximately 68% and 61% of China in the warm and cold seasons, respectively. Moreover, there is a hotspot area in the NC region which is one of the main agricultural production regions, as the radiation balance in this area induces contrasting effect on PET for the warm (1.78 mm yr−1) and the cold (−0.66 mm yr−1) seasons.
Figure 5. The contributions of surface albedo (α), shortwave radiation (Rs) and net shortwave radiation (Rns) to PET over 2003–2018 in six subregions: (a) in the warm season and (b) in the cold season. The black line in each box means the average value.
4. Discussion
4.1. Changes in the shortwave radiation
This study quantified spatio-temporal variations in shortwave radiation balance over China for the warm and cold seasons during 2003–2018. The radiation factors show obvious heterogeneity across various climatic zones between the two seasons, which indicated that the factors exerted distinct impacts on PET process. Albedo had a downward trend in the warm season, with the largest decline occurring in the NW region where large-scale afforestation converted bare land to grass and shrubs (Bryan et al. Citation2018) and the largest rise appearing in the SE region due to decreasing dark gaps and increasing canopy coverage (Yan et al. Citation2021). A similar pattern for the growing period during 2002–2019 was detected by Yan et al. (Citation2021) who used the MODIS albedo product. Zheng et al. (Citation2019) found albedo decreased significantly during the warm season between 2000 and 2014 over the China’s grasslands. In the cold season, albedo declined in China for 2003–2018, but there were higher upward trends distributed in the NE region, where He et al. (Citation2015) also reported the increase in albedo due to the conversion from forests to croplands.
The variation of shortwave radiation was also detected, with insignificant decreasing trends of approximately −0.22 W m−2 yr−1 over the entire China for the two seasons from 2003 to 2018. A similar pattern has been detected by a few other studies using different datasets, e.g. the combined satellite-derived products (CERES-EBAF and the GEWEX-SRB) in Zhou et al. (Citation2020), and the sunshine duration-based radiation estimation in He et al. (Citation2018). In this study, it was noticeable that a remarkable rise and decline in shortwave radiation in the warm season occurred in the NC and the SE regions, respectively, which might be related to the radiative effects of the clouds and aerosols (Yang, Wang, and Wild Citation2019).
Net shortwave radiation has varied in response to the changes in albedo and shortwave radiation. It decreased with a rate about −0.15 W m−2 yr−1 during the two seasons from 2003 to 2018. Its spatial distribution relatively agreed well with that of the downward shortwave radiation. This agreement indicated that the downward shortwave radiation was the main contributor of the variation in the net shortwave radiation. But in the NW region, the effect of albedo was larger, leading to a slight increase in net shortwave radiation.
4.2. Impacts on PET
The impact of shortwave radiation on PET has not been well revealed in previous studies, partly because datasets of the shortwave radiation and land surface albedo were not easily available, or they were not fully applied in hydrology. A few studies detected the changes in reference crop evapotranspiration (ET0) which was roughly assumed as a surrogate of PET. In the arid and semi-arid regions of China, wind speed and air temperature could be the dominant factors driving ET0 (Liu and Zhang Citation2013; Li et al. Citation2016; Zhang, Liu, and Hong Citation2013). In the north of China, relative humidity and air temperature were found the major driving factors for ET0 change (Zhang, Liu, and Hong Citation2013; Wang et al. Citation2019). Despite these progresses, few studies discussed the impact of radiation balances. Sunshine duration, which is generally used to retrieve shortwave radiation, might be a driving factor for ET variation in some regions in China (Wu et al. Citation2021).
Our studies detected the spatial–temporal variation of shortwave radiation balance over China, and confirmed the divergent impact of the shortwave radiation balance on PET. The changes in the radiation necessarily imposed forcing on ET process. Our study also identified the PET process and the intrinsic causal mechanism of radiation to it. PET exhibited upward trends in five of six sub-regions ranging from 0.75 (the NE region in the cold season) to 3.23 mm yr−1 (the NC region in the warm season) for the two seasons between 2003 and 2018. The radiation factors behaved differently in PET change. Albedo played a relatively small role in seasonal PET, mainly with positive contributions in the strip between the NW and the NC regions and negative contributions in south China. The spatial variabilities of the impacts of shortwave radiation on PET in the warm season were larger than that in the cold season: the highest positive impacts lay in the NC region and the highest negative impacts occurred in the SE region during the warm season, whereas in the cold season, the impacts clustered −0.5∼1 mm yr−1. The contribution of net shortwave radiation on PET was similar to that of shortwave radiation, except in the NE and NW regions in the cold season.
Please note that the contribution of shortwave radiation on PET or ET0 may depend on data sources and study periods. For example, Zhao and Ma (Citation2021) reported the effect of the shortwave radiation on the PET could be positive or negative in east of China (i.e. the main grain-production area in China) from 1982 to 2016. So different patterns of shortwave radiation and its impact on PET for subregions in China were observed in other studies partly because of radiation datasets and inconsistent study periods.
4.3. Implications and limitations
This study provides implications for evaluating atmospheric evaporation demand related to energy availability. PET is an essential input variable of the water and energy balance for hydrological models to estimate actual evapotranspiration, soil moisture dynamics and runoff (Liang et al. Citation1994; Douglas-Mankin, Srinivasan, and Arnold Citation2010), and it is an important variable to calculate meteorological drought indices such as Palmer drought severity index (PDSI) (Mika et al. Citation2005) and aridity index (AI) (Arora Citation2002). Its long-term variations can be used to identify the impacts of climate change on ecosystems (Milly and Dunne Citation2016). Our study demonstrated that PET experienced an upward trend during the warm and the cold seasons from 2003 to 2018, suggesting a corresponding adjustment of water sources management, like agricultural water supply. However, the decrease in net shortwave radiation resulted in PET decline in recent years, which reflected the reduction in available energy so as to constrain water consumption. It is necessary to take the change in net shortwave radiation into account when estimating PET and assessing climate change effect on ecosystems.
Moreover, in this study, we found that in north China shortwave radiation intensified PET in the warm season but relieved it in the cold season. This contrasting effect should necessarily translate into ET and the associated water consumption. Specifically, the radiation balance promoted water consumption in the warm season when crop grew vigorous, and therefore there would be more water requirement from irrigation. While the weakened radiation forcing reduced water consumption in the cold season, this effect may be negligible because the crop was in a slow growth stage and the soil moisture was at a low level during this season. So, this finding from this study implies there would be different water consumption/requirement pattern in the two seasons due to the effect of radiation balance, and it is important to raise efficient water resources management for agricultural irrigation.
This study has some limitations that need to be addressed in the future work. First, this study discussed shortwave radiation balance but did not include longwave radiation balance. Second, using the differentiation equation method to quantify the contributions of radiation factors to PET may cause some uncertainties, which come from the assumption that the radiation factors were independent.
5. Conclusions
Previous studies have reported the trend of ET0 and the impact of meteorological variables on it, but few of them revealed the changes in PET and its response to radiation factors. In this study, we revealed that PET in China was modulated by the shortwave radiation balance during the warm and cold seasons between 2003 and 2018. A differentiation equation method based on the Penman model was proposed to quantify the contributions of surface albedo, shortwave radiation and their combined effect to PET trends. Based on this attribution method, this study achieved interesting conclusions:
The albedo and downward shortwave radiation had divergent changes in different climatic zones, but their overall trends declined over China for the two seasons. Their combination caused a decrease in net shortwave radiation with a rate of −0.15 W m−2 yr−1. Thus the effect of albedo was largely offset by the change in the downward shortwave radiation.
Despite the spatial variability, PET experienced upward trends at approximately 1.2 mm yr−1 for the China average during the two seasons between 2003 and 2018, and it achieved the largest increase with a rate of 3.23 mm yr−1 in the NC region in the warm season. Albedo exerted a small impact on the PET change of around 0.05 mm yr−1 during the two seasons, while the influences of the downward shortwave radiation to PET were larger, with a decreased trend of around −0.5 mm yr−1, tenfold by the value induced by albedo. The effect of net shortwave radiation on PET were largely contributed by the downward shortwave radiation.
We found a contrasting impact of the net shortwave radiation on PET in the NC region: positive contributions (1.78 mm yr−1) in the warm season and negative contributions (−0.66 mm yr−1) in the cold season. In the NW and the NE regions, the effect of albedo on PET was stronger than the downward shortwave radiation.
The above findings imply that the shortwave radiation balance should impose substantial impact to drive PET and associate actual ET processes. The decline in available energy may reduce water consumption. Therefore, it would be important to consider the instability of net shortwave radiation when estimating regional and global PET and ET and assessing the effect of climate change on ecohydrological systems.
Acknowledgements
The authors thank Dr. Xiaotong Zhang for providing the GLASS downward shortwave radiation data and Ms. Liulin Song for preparing the GLASS albedo data.
Disclosure statement
No potential conflict of interest was reported by the author(s).
Data availability
The data that support the findings of this study are openly available. The Global LAnd Surface Satellite (GLASS) products are available online (http://www.geodata.cn/) and the meteorological records can be obtained from China Meteorological Administration (http://data.cma.cn/).
Additional information
Funding
References
- Anabalón, Alfonso, and Ashish Sharma. 2017. “On the Divergence of Potential and Actual Evapotranspiration Trends: An Assessment Across Alternate Global Datasets.” Earth's Future 5 (9): 905–917. doi:10.1002/2016EF000499.
- Arora, Vivek K. 2002. “The use of the Aridity Index to Assess Climate Change Effect on Annual Runoff.” Journal of Hydrology 265 (1): 164–177. doi:10.1016/S0022-1694(02)00101-4.
- Bastiaanssen, W. G. M., E. J. M. Noordman, H. Pelgrum, G. Davids, B. P. Thoreson, and R. G. Allen. 2005. “SEBAL Model with Remotely Sensed Data to Improve Water-Resources Management Under Actual Field Conditions.” Journal of Irrigation and Drainage Engineering 131: 85–93. doi:10.1061/(ASCE)0733-9437(2005)131:1(85).
- Bryan, Brett A., Lei Gao, Yanqiong Ye, Xiufeng Sun, Jeffery D. Connor, Neville D. Crossman, Mark Stafford-Smith, et al. 2018. “China’s Response to a National Land-System Sustainability Emergency.” Nature 559 (7713): 193–204. doi:10.1038/s41586-018-0280-2.
- Dinpashoh, Y., S. Jahanbakhsh-Asl, A. A. Rasouli, M. Foroughi, and V. P. Singh. 2019. “Impact of Climate Change on Potential Evapotranspiration (Case Study: West and NW of Iran).” Theoretical and Applied Climatology 136 (1): 185–201. doi:10.1007/s00704-018-2462-0.
- Douglas-Mankin, R., K. R. Srinivasan, and J. G. Arnold. 2010. “Soil and Water Assessment Tool (SWAT) Model: Current Developments and Applications.” Transactions of the ASABE 53 (5): 1423–1431. doi:10.13031/2013.34915.
- Feng, Puyu, De Li Liu, Bin Wang, Cathy Waters, Mingxi Zhang, and Qiang Yu. 2019. “Projected Changes in Drought Across the Wheat Belt of Southeastern Australia Using a Downscaled Climate Ensemble.” International Journal of Climatology 39 (2): 1041–1053. doi:10.1002/joc.5861.
- Ficklin, Darren L., Scott M. Robeson, and Jason H. Knouft. 2016. “Impacts of Recent Climate Change on Trends in Baseflow and Stormflow in United States Watersheds.” Geophysical Research Letters 43 (10): 5079–5088. doi:10.1002/2016GL069121.
- Forzieri, Giovanni, Diego G. Miralles, Philippe Ciais, Ramdane Alkama, Youngryel Ryu, Gregory Duveiller, Ke Zhang, et al. 2020. “Increased Control of Vegetation on Global Terrestrial Energy Fluxes.” Nature Climatic Change 10 (4): 356–362. doi:10.1038/s41558-020-0717-0.
- Guo, D., S. Westra, and H. R. Maier. 2017. “Sensitivity of Potential Evapotranspiration to Changes in Climate Variables for Different Australian Climatic Zones.” Hydrology and Earth System Sciences 21 (4): 2107–2126. doi:10.5194/hess-21-2107-2017.
- He, Tian, Quanqin Shao, Wei Cao, Lin Huang, and Lulu Liu. 2015. “Satellite-Observed Energy Budget Change of Deforestation in Northeastern China and its Climate Implications.” Remote Sensing 7 (9): 11586–11601. doi:10.3390/rs70911586.
- He, Yanyi, Kaicun Wang, Chunlüe Zhou, and Martin Wild. 2018. “A Revisit of Global Dimming and Brightening Based on the Sunshine Duration.” Geophysical Research Letters 45 (9): 4281–4289. doi:10.1029/2018GL077424.
- Hupet, F., and M. Vanclooster. 2001. “Effect of the Sampling Frequency of Meteorological Variables on the Estimation of the Reference Evapotranspiration.” Journal of Hydrology 243 (3): 192–204. doi:10.1016/S0022-1694(00)00413-3.
- Jhajharia, Deepak, Yagob Dinpashoh, Ercan Kahya, Vijay P. Singh, and Ahmad Fakheri-Fard. 2012. “Trends in Reference Evapotranspiration in the Humid Region of Northeast India.” Hydrological Processes 26 (3): 421–435. doi:10.1002/hyp.8140.
- Jiang, Fuxiao, Xianhong Xie, Shunlin Liang, Yibing Wang, Bowen Zhu, Xiaotong Zhang, and Yuchao Chen. 2021. “Loess Plateau Evapotranspiration Intensified by Land Surface Radiative Forcing Associated with Ecological Restoration.” Agricultural and Forest Meteorology 311: 108669. doi:10.1016/j.agrformet.2021.108669.
- Jiang, Fuxiao, Xianhong Xie, Yibing Wang, Shunlin Liang, Bowen Zhu, Shanshan Meng, Xiaotong Zhang, Yuchao Chen, and Yao Liu. 2022. “Vegetation Greening Intensified Transpiration but Constrained Soil Evaporation on the Loess Plateau.” Journal of Hydrology 614: 128514. doi:10.1016/j.jhydrol.2022.128514.
- Katerji, Nader, and Gianfranco Rana. 2011. “Crop Reference Evapotranspiration: A Discussion of the Concept, Analysis of the Process and Validation.” Water Resources Management 25 (6): 1581–1600. doi:10.1007/s11269-010-9762-1.
- Li, Sien, Shaozhong Kang, Lu Zhang, Jianhua Zhang, Taisheng Du, Ling Tong, and Risheng Ding. 2016. “Evaluation of six Potential Evapotranspiration Models for Estimating Crop Potential and Actual Evapotranspiration in Arid Regions.” Journal of Hydrology 543: 450–461. doi:10.1016/j.jhydrol.2016.10.022.
- Li, Yanzhong, Kang Liang, Peng Bai, Aiqing Feng, Lifang Liu, and Guotao Dong. 2016. “The Spatiotemporal Variation of Reference Evapotranspiration and the Contribution of its Climatic Factors in the Loess Plateau, China.” Environmental Earth Sciences 75 (4): 1–14. doi:10.1007/s12665-015-5208-7.
- Li, Yang, Yaochen Qin, and Peijun Rong. 2022. “Evolution of Potential Evapotranspiration and its Sensitivity to Climate Change Based on the Thornthwaite, Hargreaves, and Penman–Monteith Equation in Environmental Sensitive Areas of China.” Atmospheric Research 273: 106178. doi:10.1016/j.atmosres.2022.106178.
- Liang, Shunlin, Jie Cheng, Kun Jia, Bo Jiang, Qiang Liu, Zhiqiang Xiao, Yunjun Yao, et al. 2021. “The Global Land Surface Satellite (GLASS) Product Suite.” Bulletin of the American Meteorological Society 102 (2): E323–EE37. doi:10.1175/BAMS-D-18-0341.1.
- Liang, Xu, Dennis P. Lettenmaier, Eric F. Wood, and Stephen J. Burges. 1994. “A Simple Hydrologically Based Model of Land Surface Water and Energy Fluxes for General Circulation Models.” Journal of Geophysical Research 99 (D7): 14415–14428. doi:10.1029/94jd00483.
- Liu, N. F., Q. Liu, L. Z. Wang, S. L. Liang, J. G. Wen, Y. Qu, and S. H. Liu. 2013. “A Statistics-Based Temporal Filter Algorithm to map Spatiotemporally Continuous Shortwave Albedo from MODIS Data.” Hydrology and Earth System Sciences 17 (6): 2121–2129. doi:10.5194/hess-17-2121-2013.
- Liu, Xiaomang, Yuzhou Luo, Dan Zhang, Minghua Zhang, and Changming Liu. 2011. “Recent Changes in pan-Evaporation Dynamics in China.” Geophysical Research Letters 38 (13), doi:10.1029/2011GL047929.
- Liu, Xiaomang, and Dan Zhang. 2013. “Trend Analysis of Reference Evapotranspiration in Northwest China: The Roles of Changing Wind Speed and Surface air Temperature.” Hydrological Processes 27 (26): 3941–3948. doi:10.1002/hyp.9527.
- Maček, Urška, Nejc Bezak, and Mojca Šraj. 2018. “Reference Evapotranspiration Changes in Slovenia, Europe.” Agricultural and Forest Meteorology 260-261: 183–192. doi:10.1016/j.agrformet.2018.06.014.
- McMahon, T. A., B. L. Finlayson, and M. C. Peel. 2016. “Historical Developments of Models for Estimating Evaporation Using Standard Meteorological Data.” WIRES Water 3 (6): 788–818. doi:10.1002/wat2.1172.
- McVicar, T. R., L. T. Li, T. G. Van Niel, M. F. Hutchinson, X. M. Mu, and Z. H. Liu. 2005. “Spatially Distributing 21 Years of Monthly Hydrometeorological Data in China: Spatio-Temporal Analysis of FAO-56 Crop Reference Evapotranspiration and Pan Evaporation in the Context of Climate Change.” In CSIRO Land and Water Technical Report, 316 p. Canberra, ACT.
- McVicar, Tim R., Michael L. Roderick, Randall J. Donohue, Ling Tao Li, Thomas G. Van Niel, Axel Thomas, Jürgen Grieser, et al. 2012. “Global Review and Synthesis of Trends in Observed Terrestrial Near-Surface Wind Speeds: Implications for Evaporation.” Journal of Hydrology 416-417: 182–205. doi:10.1016/j.jhydrol.2011.10.024.
- Meng, Shanshan, Xianhong Xie, Bowen Zhu, and Yibing Wang. 2020. “The Relative Contribution of Vegetation Greening to the Hydrological Cycle in the Three-North Region of China: A Modelling Analysis.” Journal of Hydrology 591: 125689. doi:10.1016/j.jhydrol.2020.125689.
- Mika, J., Sz Horváth, L. Makra, and Z. Dunkel. 2005. “The Palmer Drought Severity Index (PDSI) as an Indicator of Soil Moisture.” Physics and Chemistry of the Earth, Parts A/B/C 30 (1): 223–230. doi:10.1016/j.pce.2004.08.036.
- Milly, P. C. D., and K. A. Dunne. 2016. “Potential Evapotranspiration and Continental Drying.” Nat.” Climatic Change 6 (10): 946–949. doi:10.1038/nclimate3046.
- Mohammad, Lal, Ismail Mondal, Jatisankar Bandyopadhyay, Quoc Bao Pham, Xuan Cuong Nguyen, Cham Dao Dinh, and Ayad M. Fadhil Al-Quraishi. 2022. “Assessment of Spatio-Temporal Trends of Satellite-Based Aerosol Optical Depth Using Mann–Kendall Test and Sen’s Slope Estimator Model.” Geomatics, Natural Hazards and Risk 13 (1): 1270–1298. doi:10.1080/19475705.2022.2070552.
- Monteith, J. L. 1965. “Evaporation and Environment.” Symposia of the Society for Experimental Biology 19: 205–234.
- Oki, Taikan, and Shinjiro Kanae. 2006. “Global Hydrological Cycles and World Water Resources.” Science 313 (5790): 1068–1072. doi:10.1126/science.1128845.
- Pachauri, R. K., M. R. Allen, V. R. Barros, J. Broome, W. Cramer, R. Christ, J. A. Church, et al. 2014. “Climate Change 2014: Synthesis Report.” In Contribution of Working Groups I, II and III to the Fifth Assessment Report of the Intergovernmental Panel on Climate Change, edited by R. K. Pachauri, and L. Meyer, 151. Geneva, Switzerland: IPCC.
- Penman, H. L. 1956. “Evaporation: An Introductory Survey.” Netherlands Journal of Agricultural Science 4 (1), doi:10.18174/njas.v4i1.17768.
- Penman, H. L. 1963. “Vegetation and Hydrology.” Soil Science 96 (5). doi:10.1097/00010694-196311000-00014
- Thornthwaite, C. W. 1948. “An Approach Toward a Rational Classification of Climate.” Geographical Review 38 (1): 55–94. doi:10.2307/210739.
- Wang, Yibing, Xianhong Xie, Shunlin Liang, Bowen Zhu, Yi Yao, Shanshan Meng, and Chuiyu Lu. 2020. “Quantifying the Response of Potential Flooding Risk to Urban Growth in Beijing.” Science of The Total Environment 705: 135868. doi:10.1016/j.scitotenv.2019.135868.
- Wang, Zongzhi, Ailing Ye, Lihui Wang, Kelin Liu, and Liang Cheng. 2019. “Spatial and Temporal Characteristics of Reference Evapotranspiration and its Climatic Driving Factors Over China from 1979–2015.” Agricultural Water Management 213: 1096–1108. doi:10.1016/j.agwat.2018.12.006.
- Wild, Martin. 2016. “Decadal Changes in Radiative Fluxes at Land and Ocean Surfaces and Their Relevance for Global Warming.” WIRES Climate Change 7 (1): 91–107. doi:10.1002/wcc.372.
- Wild, Martin, and Beate Liepert. 2010. “The Earth Radiation Balance as Driver of the Global Hydrological Cycle.” Environmental Research Letters 5 (2): 025203. doi:10.1088/1748-9326/5/2/025203.
- Wu, Dong, Shibo Fang, Xingyuan Tong, Lei Wang, Wen Zhuo, Zhifang Pei, Yingjie Wu, Ju Zhang, and Mengqian Li. 2021. “Analysis of Variation in Reference Evapotranspiration and its Driving Factors in Mainland China from 1960 to 2016.” Environmental Research Letters 16 (5): 054016. doi:10.1088/1748-9326/abf687.
- Xiang, K. Y., Y. Li, R. Horton, and H. Feng. 2020. “Similarity and Difference of Potential Evapotranspiration and Reference Crop Evapotranspiration-a Review.” Agricultural Water Management 232: 16. doi:10.1016/j.agwat.2020.106043.
- Yan, Hao, Shaoqiang Wang, Junhu Dai, Junbang Wang, Jin Chen, and Herman H. Shugart. 2021. “Forest Greening Increases Land Surface Albedo During the Main Growing Period Between 2002 and 2019 in China.” Journal of Geophysical Research: Atmospheres 126 (6), doi:10.1029/2020jd033582.
- Yang, Yong, Rensheng Chen, Chuntan Han, and Zhangwen Liu. 2021. “Evaluation of 18 Models for Calculating Potential Evapotranspiration in Different Climatic Zones of China.” Agricultural Water Management 244: 106545. doi:10.1016/j.agwat.2020.106545.
- Yang, Su, Xiaolan L. Wang, and Martin Wild. 2018. “Homogenization and Trend Analysis of the 1958–2016 In Situ Surface Solar Radiation Records in China.” Journal of Climate 31 (11): 4529–4541. doi:10.1175/JCLI-D-17-0891.1.
- Yang, Su, Xiaolan L. Wang, and Martin Wild. 2019. “Causes of Dimming and Brightening in China Inferred from Homogenized Daily Clear-Sky and All-Sky in Situ Surface Solar Radiation Records (1958–2016).” Journal of Climate 32 (18): 5901–5913. doi:10.1175/jcli-d-18-0666.1.
- Yao, Ning, Yi Li, Fang Xu, Jian Liu, Shang Chen, Haijiao Ma, Henry Wai Chau, et al. 2020. “Permanent Wilting Point Plays an Important Role in Simulating Winter Wheat Growth Under Water Deficit Conditions.” Agricultural Water Management 229: 105954. doi:10.1016/j.agwat.2019.105954.
- Yin, Yunhe, Shaohong Wu, Gang Chen, and Erfu Dai. 2010. “Attribution Analyses of Potential Evapotranspiration Changes in China Since the 1960s.” Theoretical and Applied Climatology101 (1): 19–28. doi:10.1007/s00704-009-0197-7.
- Zhang, Xiaotong, Shunlin Liang, Kaicun Wang, Lin Li, and Sheng Gui. 2010. “Analysis of Global Land Surface Shortwave Broadband Albedo from Multiple Data Sources.” IEEE Journal of Selected Topics in Applied Earth Observations and Remote Sensing 3: 296–305. doi:10.1109/JSTARS.2010.2049342.
- Zhang, Xiaotong, Shunlin Liang, Gongqi Zhou, Haoran Wu, and Xiang Zhao. 2014. “Generating Global Lasnd Surface Satellite Incident Shortwave Radiation and Photosynthetically Active Radiation Products from Multiple Satellite Data.” Remote Sensing of Environment 152: 318–332. doi:10.1016/j.rse.2014.07.003.
- Zhang, Dan, Xiaomang Liu, and Haoyuan Hong. 2013. “Assessing the Effect of Climate Change on Reference Evapotranspiration in China.” Stochastic Environmental Research and Risk Assessment 27 (8): 1871–1881. doi:10.1007/s00477-013-0723-0.
- Zhao, Haigen, and Yanfei Ma. 2021. “Effects of Various Driving Factors on Potential Evapotranspiration Trends Over the Main Grain-Production Area of China While Accounting for Vegetation Dynamics.” Agricultural Water Management 250: 106854. doi:10.1016/j.agwat.2021.106854.
- Zheng, Lei, Guosong Zhao, Jinwei Dong, Quansheng Ge, Jian Tao, Xuezhen Zhang, Youcun Qi, Russell B. Doughty, and Xiangming Xiao. 2019. “Spatial, Temporal, and Spectral Variations in Albedo due to Vegetation Changes in China’s Grasslands.” ISPRS Journal of Photogrammetry and Remote Sensing 152: 1–12. doi:10.1016/j.isprsjprs.2019.03.020.
- Zhou, Zhigao, Aiwen Lin, Lunche Wang, Wenmin Qin, Yang zhong, and Lijie He. 2020. “Trends in Downward Surface Shortwave Radiation from Multi-Source Data Over China During 1984–2015.” International Journal of Climatology 40 (7): 3467–3485. doi:10.1002/joc.6408.