
ABSTRACT
Geospatial data are fundamental in most global-change and sustainability-related domains. However, readily accessible information on data quality and provenance is often missing or hardly accessible for users due to technical or perceptual barriers, for example, due to unstructured metadata information or missing references. Within an interdisciplinary process encompassing perspectives of data users, data producers, and software developers, we identified major needs to facilitate effective fitness-for-use assessments by data users and developed approaches to address these. We provided a stylized analysis of large-scale land use data to showcase selected approaches. To support data users, interoperable quality and provenance information need to be meaningfully represented. Data producers need efficient workflows and tools supporting them in creating high-quality, structured and detailed quality and provenance information. Our newly developed approaches to increase the availability of structured metadata synthesize new and existing tools to extract metadata or to generate provenance data during processing. Within our approaches to improve interoperability and accessibility we present novel tools to support (i) the creation of curated and linked registers of data quality indicators and thematic terms, and (ii) linked visualization of data quality and provenance information. Following our approaches increases transparency, facilitates fitness-for-use assessments, and ultimately improves research quality.
1. Introduction
During the past decades, the availability and heterogeneity of geospatial data have rapidly increased (Balbi et al. Citation2022). This opens vast opportunities for the development of well-informed management strategies in earth system modelling, particularly regarding the interplay between land use and conservation (Dornelles et al. Citation2022; Rounsevell et al. Citation2014). Land use and land cover data play a central role in understanding socio-environmental system feedback and climate-change assessments (Prestele et al. Citation2016; Verburg, Neumann, and Nol Citation2011). However, the usefulness of any data-driven analysis ultimately depends on ‘fitness for use’ or ‘fitness for purpose’ of the input data for a given assessment (Whitfield Citation2012). While assessing the fitness for use of input data is essential to ensure good scientific practice and to provide reliable information for decision-making, it ultimately depends on the availability and accessibility of relevant and curated metadata on quality and provenance (Tilmes, Yesha, and Halem Citation2010; Wüest et al. Citation2020). Here, we broadly define accessibility as absence of technical or perceptual barriers. This includes openness, findability, understandability, interoperability, and machine-readability, encompassing the first three FAIR guiding principles (Wilkinson et al. Citation2016). Information on data quality is indispensable for data users to decide if certain data fit to the analysis in the context of their research question (Peng et al. Citation2021). This is also stressed by several initiatives, like the Global Community Guidelines for Documenting, Sharing, and Reusing Quality Information of Individual Digital Datasets (Peng et al. Citation2022). Provenance information provides relevant details on the genesis of a dataset including input, processes, parameters, and involved actors (Jiang et al. Citation2018; Magagna et al. Citation2020).
The relevance of data quality and provenance information differs depending on the type of data, discipline, and use case (Bielecka Citation2015; Szantoi et al. Citation2020; Veiga et al. Citation2017; Yang et al. Citation2013). Users of geospatial data require information on positional accuracy, data completeness, and thematic accuracy, as defined in ISO 19157 (Geographic information – Data quality; ISO (Citation2013)) and quite similar to FGDC’s data quality information terms (https://www.fgdc.gov/csdgmgraphical/dataq.htm) (Anderson et al. Citation2020; Bielecka Citation2015; Estes et al. Citation2018; Gábor et al. Citation2022). Moreover, information on semantic and ontological uncertainty (Gadelha et al. Citation2021; Mushtaq et al. Citation2022), provenance (Yang et al. Citation2013), heterogeneities in data quality resulting from different input data (Devillers, Bédard, and Jeansoulin Citation2005), cultural and epistemological background (Comber et al. Citation2006), a dataset’s limitations and possible applications are important (Meijer et al. Citation2015; Yang et al. Citation2013).
The availability of quality and provenance information on geospatial data is rudimentary at best (Bernard et al. Citation2014; Bielecka Citation2015; Lush, Lumsden, and Bastin Citation2018). Quality information is often missing entirely, incomplete, or not corresponding to any standard (Anderson et al. Citation2020; Devillers, Bédard, and Jeansoulin Citation2005). For biodiversity data, metadata about uncertainty of primary biodiversity records with regard to both taxonomic identification and geo-reference are rarely provided, although inaccuracies are well known (Anderson et al. Citation2020; Meyer, Weigelt, and Kreft Citation2016; Moudrý and Devillers Citation2020). Moreover, the availability of particularly relevant quality information is perceived as low to medium (Box 1). A systematic review on the publication of metadata shows that only about 20% of metadata records contain quality indicators, rarely including information on thematic accuracy, temporal accuracy, and provenance (or lineage) (Yang et al. Citation2013).
We developed a survey to better understand the needs of geodata users regarding data quality and provenance information (Fischer, Egli, and Henzen Citation2022). The survey is mainly structured around the data quality elements of ISO 19157 (ISO Citation2013) addressing availability and accessibility on several levels of detail. Provenance information are included as they are key to understanding data quality of a product with respect to its development. The survey was launched from November 2021 to January 2022 and was distributed within international earth system science experts and data users. In total 33 respondents completed the survey.
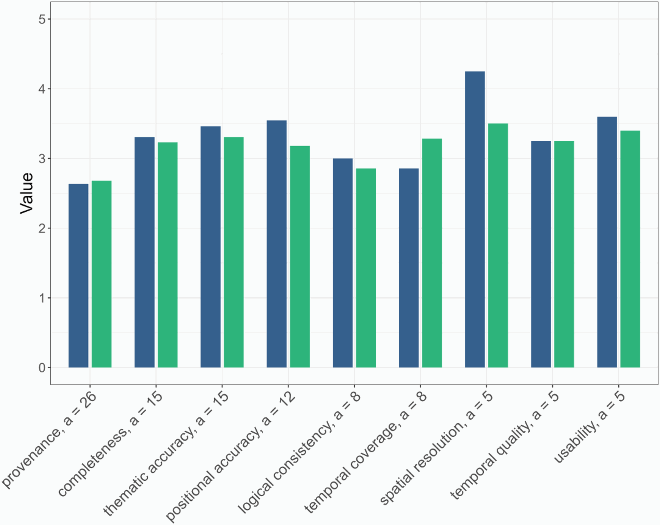
Figure B1. Mean availability (blue) and mean accessibility (green) of relevant data quality and provenance information (0 = low, 5 = high). Only quality information mentioned at least five times (a) was included.
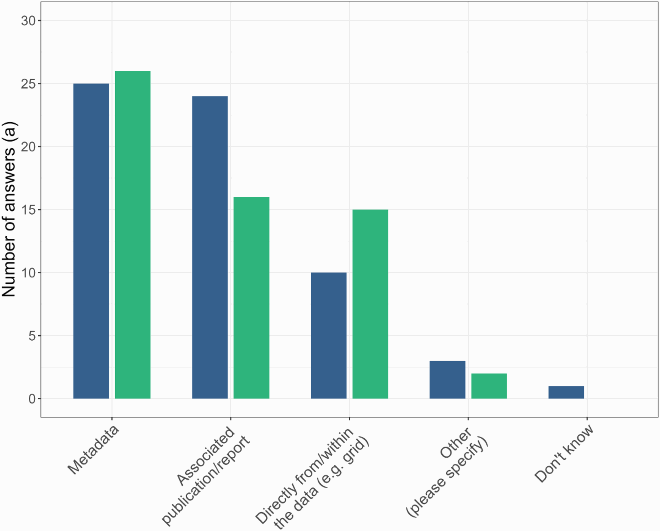
Figure B2. Current (blue) and preferred (green) source of data quality and provenance information.
Twenty-six participants responded that provenance information is relevant for their fitness-for-use assessments. Further, thematic accuracy and completeness have been named most often as being relevant (a = 15). The availability and accessibility of relevant quality information (a ≥ 5) was rated medium except for provenance information which was rated to be less available or accessible (Figure B1). Many participants currently obtain data quality and provenance information from associated publications or reports (a = 24), yet this is the preferred source of information for less respondents (a = 16) (Figure B2). Most participants prefer the presentation of quality information in tables instead of retrieving this information from text sections (a = 23). To determine fitness for use, user tend to evaluate multiple data quality elements for a certain dataset (a = 17) or multiple datasets for a certain quality element (a = 14). Moreover, most participants download the data and perform some tests (a = 20). Survey results indicate that for certain quality indicators spatially, temporally, or thematically specific information is needed, e.g. for positional accuracy or thematic accuracy. Respondents further stressed the usefulness of concepts that link data quality and provenance information and visualize them accordingly (Fischer, Egli, and Henzen Citation2022).
Limited accessibility can also confine fitness for use. Metadata are often hard to find or difficult to understand without discipline-specific knowledge, because they are not (explicitly) referenced and documented (Bielecka Citation2015; Devillers, Bédard, and Jeansoulin Citation2005; Ivánová et al. Citation2013). The accessibility of particularly relevant data quality and provenance information is often medium or low, respectively (Box 1). Many data users obtain data quality and provenance information from associated publications or reports, yet the majority would prefer to extract this information (automatically) from metadata to reduce effort (Box 1).
Uncertainties or missing information regarding data quality and provenance pose various challenges and can even lead to data misuse and misinterpretation (Goodchild Citation2007; Wentz and Shimizu Citation2018; Whitfield Citation2012), particularly in interdisciplinary projects frequently including data and concepts across different disciplines. The term forest, for example, has been defined depending on region, institution, and perspective (), which can lead to inconsistencies among datasets (Chazdon et al. Citation2016; Sexton et al. Citation2016). Combining datasets with different concepts may then bias the results in certain contexts (Verburg, Neumann, and Nol Citation2011). Lack of information on omission and commission errors of land-cover classes can result in under- or overestimation of areas (Nol et al. Citation2008; Wentz and Shimizu Citation2018), whereas lack of information on temporal inconsistencies between data times series (e.g. regarding used methods or land-cover class definitions) can result in under- or overestimation of areal changes (Nedd et al. Citation2021). Moreover, a lack of provenance information could suggest a false level of detail if data has been disaggregated (Verburg, Neumann, and Nol Citation2011), or lead to circular reasoning in downstream analyses if users are unfamiliar with underlying concepts and data (Leyk et al. Citation2019). Especially for data users with insufficient expertise or time constraints, the mentioned shortcomings can severely affect the quality of their assessment (Goodchild Citation2007; Wentz and Shimizu Citation2018).
Table 1. Selected definitions of the term forest.
While there is a good overview of the major challenges related to the availability and accessibility of data quality and provenance information in fitness-for-use assessments, a comprehensive synthesis of needs and most importantly specific ways to overcome them integrating the perspectives of data users, data producers, and software developers are missing. Since earth system sciences are a strongly data-driven and data-producing research field, researchers need clear approaches and guidelines to foster the curation of research data. Although such approaches partly exist an overview is needed to facilitate their selection and use. Data curation provides a methodological and technological basis for improving data management, data quality, and the (re-)usability of datasets, including transparency and reproducibility (Freitas and Curry Citation2016), throughout the full life cycle of a data product.
We address this gap by (i) summarizing major needs regarding the availability and accessibility of data quality and provenance information from data user as well as from data producer perspective (see also Box 1), (ii) presenting a comprehensive overview of newly developed approaches including new as well as already existing tools for data curation to address these needs and to avoid common pitfalls and challenges in downstream analyses, in particular regarding the documentation, visualization, and complementation of data quality and provenance information, and (iii) showcasing selected approaches on an exemplary use case analysis of agricultural yield determinants. While we mainly refer to the land use and land cover domain, identified aspects are relevant for all domains of geospatial data.
2. Materials and methods
In the following, we describe (i) the conceptual framework based on which we organized our work, (ii) how we identified the needs of data users and producers, (iii) how we derived approaches to address those needs, and (iv) the use case we devised to iteratively refine our understanding of the protocol.
2.1. Conceptual frame to co-develop tools, produce, and use data
We followed an interdisciplinary and collaborative approach (i.e. scientists with different disciplinary background iteratively refined needs and approaches) with respect to all phases of the research data lifecycle and major roles. Thereby we aimed at providing approaches, including workflows, processes, and tools, with a specific focus on availability and accessibility of geospatial data quality and provenance information. We hereby understand tool as a specific piece of software built for a certain purpose and with clearly delimited use, process as a course of data operation (e.g. using one or more tools), and workflow as a well-defined sequence of processes that leads to a specified outcome.
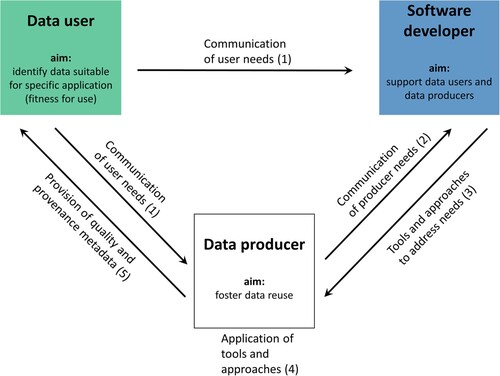
Our interdisciplinary group of scientists included (i) users of existing land use and land cover data for analyses, (ii) data producers that combine a wide range of data to derive harmonized global land use data, and (iii) software developers that develop concepts and tools meeting user’s and producer’s needs (henceforth referred to as ‘users’, ‘producers’ and ‘developers’, respectively) (). Here, we used a simplified model envisioning that both, data users and data producers act as domain expert. Using these three perspectives, we aimed at (i) raising producers’ awareness of user needs, (ii) supporting producers to improve information and metadata provision, and (iii) providing suitable tools to improve the representation of geodata for users.
Figure 1. Roles of data user, data producer, and software developer and their interactions within the process of improving the availability and accessibility of provenance and data quality information. Numbers inside parentheses represent the sequence of steps of this process.
2.2. Identification of needs and development of approaches
First, we combined different approaches to identify relevant needs. With respect to existing standards we reviewed the ISO 19157 quality elements, including their subclasses (), regarding their relevance in the land use and land cover domain by rating each subclass from 1 (low relevance) to 5 (high relevance) based on our experience as user. We then systematically assessed availability and accessibility of the most relevant quality element subclasses in 15 exemplary datasets depicting different land use and land cover aspects, based on information provided in the dataset’s metadata as well as in associated publications, reports, and supplements. By considering the results of our survey, we identified metadata gaps and needs among a wider community of users (Box 1). Since the number of survey participants was limited, we combined the results with findings from expert interviews conducted in the project and experiences from our activities in international working groups. Moreover, we specified user needs in the context of a use case (see below), particularly related to the availability and accessibility of metadata of several datasets that are supposed to be combined in downstream analyses.
Table 2. Summarized overview of openness, FAIRness and data maturity, and detailed overview of quality of yield data evaluated in the use case (Monfreda, Ramankutty, and Foley Citation2008; Yu et al. Citation2020). Openness is high for both datasets. FAIRness and data maturity are higher for MapSPAM, but for both datasets data quality and provenance information is missing in the metadata and evaluated data quality information was derived from the dataset and associated publications.
Second, we evaluated the ability to address the user needs to be identified in the previous steps from a data producer perspective and specified respective needs regarding software and curation tools.
Third, based on the identified needs of both users and producers, we developed and implemented approaches and tools to facilitate the creation, provision, and visualization of data quality and provenance information from a developer perspective. We then tested and reviewed these approaches in the context of the use case (see below) and refined them iteratively. To derive requirements and recommendations, we use knowledge from the survey results, project-specific interviews, recent literature and our programming experiences. That allows us to take different perspectives and scales into account, e.g. concrete use case-specific aspects synthesized with the results from the internationally distributed survey. However, we acknowlegde that, within next iterations, we can integrate more roles, e.g. data stewards to support interaction and mediation.
2.3. Use case: global determinants of agricultural yield
We performed a fitness-for-use evaluation, data selection, and stylized analysis regarding global determinants of agricultural yields. We described yield as a function of agricultural management, climate, soil, and pollination: Yield = f(agricultural management, climate, soil, pollination)
For simplicity reasons, we focus on showcasing the fitness-for-use evaluation of data on yield (Monfreda, Ramankutty, and Foley Citation2008; Yu et al. Citation2020), agricultural management, and pollination (Schulp, Lautenbach, and Verburg Citation2014). Thereby we focused on yield data of rapeseed as a crop modestly dependent on pollination (Klein et al. Citation2007) and selected irrigation (Portmann, Siebert, and Döll Citation2010) as one aspect of agricultural management.
We selected these geodatasets and extracted relevant metadata from repositories, specific websites, associated publications, and supplements and integrated them into one project-specific data management software CKAN. We used the statistical software package R 4.1.3 (https://www.R-project.org) in RStudio (http://www.rstudio.com) to assess, process, and analyse these data and to upload new metadata from our analyses to the CKAN instance. The software project including relevant R scripts is available as GitHub repository (https://zenodo.org/account/settings/github/repository/legli/GeoKur_UseCase1).
3. Results
3.1. Needs
The availability of data quality and provenance information is still limited for many geospatial data products. If available, information is often published in scientific publications or associated reports, which makes it difficult to quickly extract the relevant information and use them for human-readable or machine-readable purposes. Given that this information is indispensable to facilitate users to select the most fitting data product, increasing the availability and accessibility of structured quality and provenance metadata of spatial data remains the major need from the user perspective. Thereby metadata needs to include structured and interoperable data quality and provenance information explicitly linked to the data. This also includes information on underlying thematic terms and concepts, which should ideally be harmonized for the specific use case to enable proper data use across different domains and to prevent semantic misinterpretation. Users need an improved and spatially explicit representation of metadata that enables them to rapidly understand data quality and provenance, which is particularly lacking for gridded data products. Further, tools are needed that allow for a systematic comparison of different datasets with respect to a certain data quality aspect and to define specific characteristics (e.g. threshold values).
Producers need workflows and tools that support them in creating high-quality, structured, and detailed quality and provenance information for spatial data while reducing the effort to do so. Thereby, producers should be able to integrate respective tools into their existing analysis and scripts while the amount of required installation or code adaption needs to be minimized. Here, (partially) automated processes increase efficiency and allow to update quality information once new information is available.
Finally, developers need to learn about producers’ workflows and software environment as well as users’ specific requirements on metadata and how it should be presented to fit their evaluation needs.
3.2. Approaches to increase the availability of metadata
3.2.1. Approach 1: Support the creation of provenance metadata
Producers should provide a curated selection of provenance information, which is needed to understand the genesis of a data product. The ISO 19115-2 lineage extensions (ISO Citation2019) and PROV-O (https://www.w3.org/TR/prov-o/) can serve as starting point to capture detailed provenance information either on dataset or object level. Closa et al. (Citation2017) describe how to capture provenance on dataset, feature, and attribute level and propose a mapping between the ISO 19115 lineage elements and PROV-O. Intermediate datasets should be made available to foster reuse and trust in the final data product. Further, source code of the applied processes should be provided to self-assess scripts, detect errors, foster reproducibility and to create provenance graphs.
Developers should provide tools to support producers in the creation of provenance information within their respective working environment to integrate provenance tracking in the analysis scripts. Thereby, provenance metadata (i) is always up to date with the current version of the analysis script, (ii) can be generated automatically (i.e. with less effort), and (iii) at different levels of detail as needed for specific cases. We developed the package provr (https://github.com/GeoinformationSystems/provr), which allows producers to create PROV-O-conform provenance graphs effortlessly during script execution.
Larger or data-intensive projects should use a research data infrastructure to efficiently manage data and related processing and analysis workflows. Developers should support researchers by integrating provenance generation support in the geodata infrastructure. He et al. (Citation2015) describe how to integrate provenance management at different levels of granularity in geoprocessing environments. We aimed for the support of provenance capturing in rather loosely coupled environments (e.g. researchers using different scripting languages to create data on local machines which is subsequently published on a common data management platform).
The data management software (DMS) CKAN (https://ckan.org/) for example, can be used for managing, publishing, and searching geodata, allows to implement and use several metadata schemas and comes with several geospatial extensions. However, other DMS like Dataverse (https://dataverse.org/), DSPACE (https://dspace.lyrasis.org/), or INVENIO (https://inveniosoftware.org/) provide similar systems with options for several schemas and APIs, but do lack specific libraries to be used from the analysis scripts or such geospatial extensions. We developed metadata schemas (GeoKur metadata profile based on GeoDCAT: https://zenodo.org/record/4916698) for processes and datasets, which both contain metadata fields to describe their provenance step-wise. The captured provenance information is serialized into PROV-O-conform provenance graphs and made available at a SPARQL-endpoint (https://www.w3.org/TR/sparql11-query/), which facilitates semantic querying for fitness-for-use evaluation or for inclusion in data analysing scripts. The CKAN metadata can be managed via the package ckanr (https://cran.r-project.org/package=ckanr), which serves as a wrapper for the CKAN-API. Thus, provenance information can directly be updated alongside other metadata from within researchers’ working environment (Rümmler, Figgemeier, and Henzen Citation2022).
3.2.2. Approach 2: Support the generation of data quality metadata
When building a spatial dataset, producers should generate spatial data quality information throughout the whole data lifecycle. To support this, developers should provide concepts and the technical base for structured and transparent quality assurance (QA) that consider the requirements of both producers and users and allow for their participation in the QA design process. These concepts include for instance suggestions on how to collect and update which quality information with respect to existing metadata standards, the given software environment, and data creation process.
We propose the implementation of a QA workflow (Wagner and Henzen Citation2022) along the whole data lifecycle which adapts existing concepts for openness (https://5stardata.info/en/) and FAIRness of data (Wilkinson et al. Citation2016), data maturity (Höck, Toussaint, and Thiemann Citation2020), and data quality (ISO Citation2013). We derived a data quality matrix for spatial data, similar to a data maturity matrix (Wagner and Henzen Citation2022). For each lifecycle phase, a set of mandatory maturity and quality measures are defined and complemented with use case-specific openness requirements. Our QA workflow is implemented as a web-based interactive questionnaire resulting in a custom report (see GitHub project: https://github.com/GeoinformationSystems/RDMOCatalogBuilder). By publishing the results users get a brief overview on the quality of a dataset and its openness, FAIRness and maturity, which ultimately increases the accessibility of information (Percivall Citation2010) ().
To complement missing metadata for existing datasets, developers should provide tools to derive certain quality indicators automatically, e.g. by analysing the files based on their geodata file type/format. We developed the tool MetadataFromGeodata (Wagner, Henzen, and Müller-Pfefferkorn Citation2021; published on GitHub: https://github.com/GeoinformationSystems/MetadataFromGeodata) that allows to extract several geodata quality indicators compliant to ISO 19115-1 (ISO Citation2014) and ISO 19157-1 (ISO Citation2013), including number or rate of missing items per attribute and various parameters on representativeness.
Table 3. Overview of approaches to increase the availability and accessibility of metadata for geospatial datasets and related tools.
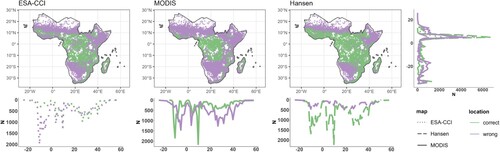
Given the high variety of available geodata, producers should suggest measures to support users working at different spatial and temporal resolutions and scopes in selecting the most fit-for-purpose products for their specific applications. One way to support users, besides publishing spatially and temporally disaggregated validation results and following standardized guidelines for validation assessments (Olofsson et al. Citation2012; Stehman and Foody Citation2019), is to consider several measures that actually maximize the products comparability. Firstly, producers can use a unique set of validation samples, of known quality and quantity to allow comparability of several geodata at the exact same locations. Here we developed a validation database of forest samples to compare the correctness in forest mapping of three well-known global land use/cover time-series in sub-Saharan Africa (). Moreover, producers should assure full transparency and reproducibility of their data quality assessments by publishing information on validation samples collected from the literature or providing their own sample data as open/FAIR datasets, linking them to digital object identifiers (DOIs) of public repositories.
Figure 2. Forest accuracy comparison between 3 time-series in sub-Saharan Africa (2001-2020). Forest accuracy based on 53,132 validation samples (collected from 13 different sources (Bastin et al. Citation2017; Bullock et al. Citation2021; Dupuy Citation2019; Fritz et al. Citation2016; Herrick et al. Citation2019; Jolivot et al. Citation2021; Laurence et al. Citation2019; Lesiv Citation2019; Liangyun et al. Citation2019; Londoño Villegas, Le Mezo, and Dupuy Citation2019; Szantoi et al. Citation2020; Vågen, Okia, and Winowiecki Citation2017; VALERI Citation2022)) during the period 2001–2020 for the time series: ESA-CCI (dotted lines), MODIS (solid lines) and Hansen (dashed lines). Maps and plots show the distribution and number of correct and wrong locations along latitude and longitude.
As the confidence of reported thematic accuracies directly depends on the representativeness of the validation samples (Foody Citation2009), it will increase as more data holders publish and integrate validation samples into the domain-specific, open-access repositories. Especially for domains where amounts of open-access validation and topical samples are rapidly growing (e.g. for biodiversity occurrences via GBIF (www.gbif.org), for soil profiles via WoSIS (www.isric.org/explore/wosis)), regular re-validations of data products will thus be needed, not only to improve the reliability of data quality metadata but also to keep them comparable across products. Producers with the technical capacities to do so, should implement routines to regularly revalidate their own products against latest standardized validation records, e.g. on cloud-based geocomputation platforms and update associated metadata, while all other producers should support such re-assessments by third parties.
3.3. Approaches to increase the accessibility of metadata
3.3.1. Approach 3: Provide flexible and interoperable metadata profiles
For producers the provision of rich metadata is time-consuming and generic metadata schemes (e.g. ISO 19115) may be overwhelming due to their complexity. However, the use of generic schemes is crucial to provide interoperable metadata. This conflict can be resolved by developing metadata profiles, i.e. less complex subsets of a metadata scheme that can be tailored towards user needs.
Our approach to develop metadata profiles is to reduce, restrict, adapt, and comply the original scheme (Henzen, Rümmler, and Wagner Citation2021). Reduce includes a critical review of the optional fields in the original schemes, i.e. only keep fields that are meaningful for the description of the respective datasets. In the context of earth system science data, we kept 24 of originally 49 metadata fields included in the GeoDCAT dataset profile. Restrict includes the change of obligations from optional to mandatory where the information is necessarily needed (e.g. an identifier for internal processing) or can be provided with guarantee (e.g. a contact point), the reduction of cardinality and format restrictions (e.g. machine-readable contents only). Adapt accounts for community needs regarding terminologies by changing the labels of the metadata fields. By using well-known and accepted terminologies, that are driven by, e.g. best practices or quasi standards, we facilitate the understanding of which information should be provided for a certain metadata field. Comply refers to extensions that can be integrated into the structure of the original scheme, for example to facilitate the description of different data quality indicators.
3.3.2. Approach 4: Increase interoperability for metadata and thematic terms
A common understanding of terms is crucial for collaboration between project partners. Furthermore, knowledge dissemination to potential users or providers with different background relies on a clear and accessible description of focal terms. Any project-specific system to manage and represent domain-specific knowledge that is used to organize and describe the concepts of a project as for instance vocabularies, taxonomies, or ontologies, should be published in human- and machine-readable form, and its contents should be linked to existing concepts. Finally, if datasets refer to terms or definitions in a certain field of the metadata scheme (e.g. tags or CRS), these fields should always link to proper terms that are available in an openly accessible register. We (i) developed the R-package ontologics (https://cran.r-project.org/web/packages/ontologics) to support scientists in the development and setup of use-case-specific ontologies, whose terms are well-defined, harmonized, and linked to terms in other knowledge organization systems, (ii) developed and published an ontology of land-use/landcover concepts (Ehrmann, Rümmler, and Meyer Citation2022) (), and (iii) published an extendable register (https://geokur-dmp.geo.tu-dresden.de/quality-register) of geodata quality indicators that fosters managing descriptions of quality indicators and providing them for reference in data quality descriptions and assessments.
Figure 3. Visual representation of the ontology developed in this project with the ontologics R-package. Circles that are nested into bigger circles show hierarchically narrower concepts. Commodities are only partially visualized for clarity, but can be found in the online version of the ontology (Ehrmann, Rümmler, and Meyer Citation2022).
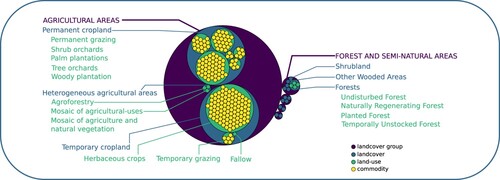
The package ontologics enables the guided development of ontologies from within R, by providing a range of assisting utility functions that prevent inconsistencies within the ontology. The package makes use of the Simple Knowledge Organization System (SKOS, https://www.w3.org/TR/skos-reference/) to define the linkages between registered terms. Consequently, the ontology can be exported as an RDF document.
A common understanding is crucial for thematic terms as well as for quality indicators. Therefore, we built a register of geodata quality indicators. We initially expressed a subset of the geodata quality indicators that are described in ISO 19157 (ISO Citation2013) with the Data Quality Vocabulary (DQV) and made them available in a triplestore database. A dynamic web page requests the triplestore and presents the register in human-readable form. The page is hosted in our CKAN instance including visualizations and a form to provide feedback or to propose new indicators.
3.3.3. Approach 5: Provide user-friendly tools to visualize data provenance and quality information
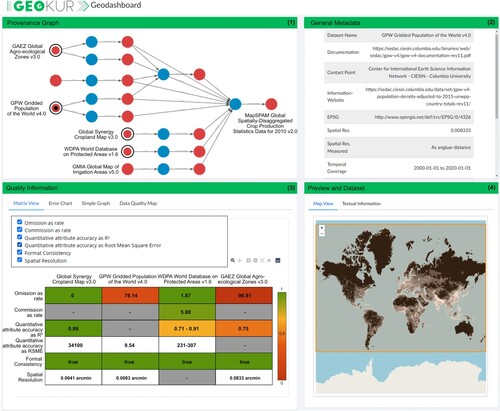
To support the efficient evaluation of fitness for use for geospatial datasets, developers should provide easy-to-use tools to visualize both data quality and provenance. Accordingly, we developed a Geodashboard user interface that links provenance information, data quality information, and general metadata on several levels of detail (Figgemeier, Henzen, and Rümmler Citation2021). The Geodashboard (https://github.com/GeoinformationSystems/Geodashboard) uses standardized semantic geospatial metadata requested via SPARQL from a triplestore (Figgemeier, Rümmler, and Henzen Citation2022). It supports queries on well-defined quality indicators managed in the above-mentioned quality register (see approach 4). Several linked dashboard widgets provide an overview of selected datasets, allowing user-specific selection of quality information on different levels of detail supported by charts and a map view. For users, the Geodashboard facilitates assessing whether potential datasets fulfil user-defined requirements, for instance regarding their spatial resolution, geodata quality, and provenance, e.g. to avoid circular reasoning (). Heterogeneous data quality information can be mapped spatially explicit, allowing users to quickly determine whether the quality of a dataset is adequate in the region of interest. The embedded visualization of provenance information allows the selection of specific datasets and shows which data has been processed.
Figure 4. Dashboard showing provenance information, general metadata, and data quality for the MapSPAM (Yu et al. Citation2020) dataset. The provenance graph shows that input data included irrigation. Since irrigation is also used as a predictor in the downstream analysis, this could bias statistical parameter estimates and cause circular reasoning. Information was generated based on the methodological descriptions in associated publications and supplements.
4. Discussion
4.1. Value of presented approaches and remaining challenges
Our paper synthesizes approaches across single workflows and tools to support producers and users in the provision, management, and usage of relevant and accessible metadata for geospatial data at various stages (). For example, the quality-assurance workflow guides producers through the entire research data lifecycle, the suggested approaches and related tools facilitate the generation of provenance information, the automated extraction of data quality information during processing and analyses and the provision of standardized, transparent and reproducible quality information. Metadata profiles, ontologies, and data quality registers facilitate the structured publication and archiving of metadata and the link between different communities. Once this information is available, visualization will support users in the reuse of data. From a producer perspective, following these approaches will increase transparency, accessibility, and usage of data products. From a user perspective, fitness-for-use assessments will be facilitated, which will improve the adequate usage of data for downstream analyses and ultimately research quality. Further, usage of data from other domains will be eased which will help to answer new research questions and foster research in general.
Although the developed approaches and tools are designed for easy re-use and implementation, a certain effort is needed to integrate them into work routines. The creation of provenance metadata during processing, for example, still requires manual input from producers. Adopting the questionnaire within the quality assurance workflow might be challenging for producers that rely on script-based processes to handle large amounts of data. An even more improved awareness of the crucial importance of metadata for meaningful and successful geodata usage is thus further needed, together with a genuine willingness of the community of producers as well as developers to improve metadata provision. Likewise, awareness and knowledge among users regarding the importance of metadata on data quality and provenance needs to be fostered via corresponding training on responsible data use in higher-education programmes.
4.2. Outlook
Currently, metadata on data quality of geodata are mainly captured, structured, and described from a producer-centric view and might be prone to fail providing suitable information for users (Zabala et al. Citation2021). Flexible user-centric approaches are needed which enable users providing feedback given their own data usage and to annotate data with respect to e.g. data quality or fitness for use for a certain application, and to make this knowledge accessible for other users (Anderson et al. Citation2020; Yang et al. Citation2013; Zabala et al. Citation2021). Storing user feedback in an authorized and reviewed way remains an open task, however, first attempts to do so have already been made (Vahidnia and Vahidi Citation2021).
We demonstrated the necessity to interlink ontologies of the same domain and suggested approaches to support this process (approach 4), e.g. by mapping novel to existing terms as a prominent feature in an ontology development tool (‘domain knowledge descriptions’) or by managing an integrative register of data quality indicators that allows to define different descriptions of quality indicators for different research domains, and defining relations between them (‘data quality descriptions’). While both types have intersections, e.g. different domains use different descriptions for the same data quality concept, there is a lack in concepts that leverage these intersections to generate knowledge and support both producers and users. Thus, the development of concepts interfacing ontologies of different types have a high potential. Assuming that information on a dataset’s thematic scope is given by linking to terms in an ontology, such interfaces could infer the overarching domain of the thematic terms and provide the user with recommendations of data quality indicators that are commonly used in this domain.
The use of a unique set of validation samples can foster thematic accuracy comparison across several geodata by checking their accuracy at the exact same locations. Still, further developments are needed. Comparison of products with different spatial resolutions via a unique set of validation samples requires methodologies that account for the scale-mismatch in the sample-to-product assessment. However, data collection guidelines developed by the community will help for future data integration, but not in making use of validation samples already developed. Therefore, the integration of various data sources to generate a comprehensive validation database requires methodologies that can remove or quantify the bias introduced by the different data collection protocols used (cf Ehrmann, Seppelt, and Meyer Citation2020).
Given the needs to continuously improve the reliability of data quality metadata and to keep metadata comparable across data products, an important frontier lies in developing generic tools and workflows for dynamic quality-(re)assurance. A showcase illustrating the potential of dynamic quality-(re)assurance for enhancing the reliability of downstream scientific and policy applications is implemented within GlobES (www.globesdata.org). Here, an automated workflow periodically re-validates the thematic accuracies of time series on ∼70 natural and artificial ecosystems (incl. different land-use classes) against global GBIF-facilitated occurrence records of plant and animal species known to rely on the respective ecosystem class as habitat. The rapidly increasing GBIF data volumes will thus regularly change the spatiotemporal patterns of classification uncertainties in the gridded products. Propagating these further into the uncertainty bars of aggregated ecosystem-change indicators, also improves the precision and reliability of progress-tracking towards global policy targets.
Realistically, few producers may currently have the capacity to implement and finance such dynamic quality-(re)assurance on their institutional hardware. Easy-to-use tools (e.g. R packages) to support setting up similar automated routines on cloud-based geocomputation platforms are as needed as solutions for financing curation of, and continued use of computational resources by, such routines beyond the funding periods of the projects that originally developed the data products. To ensure reproducibility and provide permanent links to data published alongside a paper, standards, and regulation of data publishing increased and new journals with respect to data publishing emerged. However, so far, increased requirements regarding documentation or transparency are mainly borne by producers while publishers provide few services regarding e.g. metadata generation or updates. Thus, beyond the perspectives of users, producers, and developers integrated here, additional actors need to be considered. Efforts from all actors involved are essential to ensure the implementation of the approaches presented here and widely improve the availability and accessibility of data quality and provenance information.
Acknowledgements
The authors thank Stephan Mäs for his valuable input and feedback.
Disclosure statement
No potential conflict of interest was reported by the authors.
Data availability statement
The survey data that support the findings of this study are openly available on Zenodo at http://doi.org/10.5281/zenodo.737901 . Raw survey data were generated at Helmholtz Centre for Environmental Research – UFZ and are available from the corresponding author JF on request. All other data that support the findings of this study are openly available and directly referenced within the article.
Additional information
Funding
References
- AGROVOC. 2022. “Forests.” AGROVOC Multilingual Thesaurus. Accessed 2022/12/01. https://agrovoc.fao.org/browse/agrovoc/en/page/c_3062.
- Anderson, R. P., M. B. Araújo, A. Guisan, J. M. Lobo, E. Martínez-Meyer, A. T. Peterson, and J. Soberón. 2020. “Optimizing Biodiversity Informatics to Improve Information Flow, Data Quality, and Utility for Science and Society.” Frontiers of Biogeography 12 (e47839): 1–14. doi:10.21425/F5FBG47839.
- Balbi, S., K. J. Bagstad, A. Magrach, M. J. Sanz, N. Aguilar-Amuchastegui, C. Giupponi, and F. Villa. 2022. “The Global Environmental Agenda Urgently Needs a Semantic Web of Knowledge.” Environmental Evidence 11 (1): 5. doi:10.1186/s13750-022-00258-y.
- Bastin, J.-F., N. Berrahmouni, A. Grainger, D. Maniatis, D. Mollicone, R. Moore, C. Patriarca, et al. 2017. “The Extent of Forest in Dryland Biomes.” Science 356 (6338): 635–638. doi:10.1126/science.aam6527.
- Bernard, L., S. Mäs, M. Müller, C. Henzen, and J. Brauner. 2014. “Scientific Geodata Infrastructures: Challenges, Approaches and Directions.” International Journal of Digital Earth 7 (7): 613–633. doi:10.1080/17538947.2013.781244.
- Bielecka, E. 2015. “Geographical Data Sets Fitness for Use Evaluation.” Geodetski vestnik 59 (2): 335–348. doi:10.15292/geodetski-vestnik.2015.02.335-348.
- Bullock, E. L., S. P. Healey, Z. Yang, P. Oduor, N. Gorelick, S. Omondi, E. Ouko, and W. B. Cohen. 2021. “Three Decades of Land Cover Change in East Africa.” Land 10 (2): 150. doi:10.3390/land10020150
- Chazdon, R. L., P. H. Brancalion, L. Laestadius, A. Bennett-Curry, K. Buckingham, C. Kumar, J. Moll-Rocek, I. C. G. Vieira, and S. J. Wilson. 2016. “When is a Forest a Forest? Forest Concepts and Definitions in the era of Forest and Landscape Restoration.” Ambio 45 (5): 538–550. doi:10.1007/s13280-016-0772-y.
- Closa, G., J. Masó, B. Proß, and X. Pons. 2017. “W3C PROV to Describe Provenance at the Dataset, Feature and Attribute Levels in a Distributed Environment.” Computers, Environment and Urban Systems 64: 103–117. doi:10.1016/j.compenvurbsys.2017.01.008.
- Comber, A., P. Fisher, F. Harvey, M. Gahegan, and R. Wadsworth. 2006. “Using Metadata to Link Uncertainty and Data Quality Assessments.” In Progress in Spatial Data Handling, edited by A. Riedl, W. Kainz, and G. A. Elmes, 279–292. Berlin, Heidelberg: Springer. doi:10.1007/3-540-35589-8_18.
- Devillers, R., Y. Bédard, and R. Jeansoulin. 2005. “Multidimensional Management of Geospatial Data Quality Information for its Dynamic Use Within GIS.” Photogrammetric Engineering & Remote Sensing 71 (2): 205–215. doi:10.14358/PERS.71.2.205.
- Dornelles, A. Z., W. J. Boonstra, I. Delabre, J. M. Denney, R. J. Nunes, A. Jentsch, K. A. Nicholas, M. Schröter, R. Seppelt, and J. Settele. 2022. “Transformation Archetypes in Global Food Systems.” Sustainability Science 1827–1840 . doi:10.1007/s11625-022-01102-5.
- Dupuy, S. 2019. “Reunion Island – 2017, Reference Spatial Database.” CIRAD Dataverse. doi:10.18167/DVN1/TOARDN.
- Ehrmann, S., A. Rümmler, and C. Meyer. 2022. “The LUCKINet Land Use Ontology”. doi:10.5281/zenodo.7228852.
- Ehrmann, S., R. Seppelt, and C. Meyer. 2020. “Harmonise and Integrate Heterogeneous Areal Data with the R Package arealDB.” Environmental Modelling & Software 133: 104799. doi:10.1016/j.envsoft.2020.104799.
- Estes, L., P. Chen, S. Debats, T. Evans, S. Ferreira, T. Kuemmerle, G. Ragazzo, et al. 2018. “A Large-Area, Spatially Continuous Assessment of Land Cover Map Error and Its Impact on Downstream Analyses.” Global Change Biology 24 (1): 322–337. doi:10.1111/gcb.13904.
- Figgemeier, H., C. Henzen, and A. Rümmler. 2021. “A Geo-Dashboard Concept for the Interactively Linked Visualization of Provenance and Data Quality for Geospatial Datasets.” AGILE GIScience Ser. 2:25 1–8. doi:10.5194/agile-giss-2-25-2021.
- Figgemeier, H., A. Rümmler, and C. Henzen. 2022. “A Geospatial Dashboard Prototype for Evaluating Spatial Datasets by Using Semantic Data Concepts and Open Source Libraries.” AGILE GIScience Ser. 3:34 1–34. doi:10.5194/agile-giss-3-34-2022.
- Fischer, J., L. Egli, and C. Henzen. 2022. “Reporting Relevance, Availability, and Accessibility of Quality Information in Earth System Science Data (Version 1).” Zenodo. doi:10.5281/zenodo.7379019.
- Foody, G. M. 2009. “Sample Size Determination for Image Classification Accuracy Assessment and Comparison.” International Journal of Remote Sensing 30 (20): 5273–5291. doi:10.1080/01431160903130937.
- Freitas, A., and E. Curry. 2016. “Big Data Curation.” In New Horizons for a Data-Driven Economy, edited by J. Cavanillas, E. Curry, and W. Wahlster, 87–118. Cham: Springer. doi:10.1007/978-3-319-21569-3_6.
- Fritz, S., L. See, C. Perger, I. McCallum, C. Schill, D. Schepaschenko, M. Duerauer, et al. 2016. “A Global Dataset of Crowdsourced Land Cover and Land Use Reference Data (2011-2012).” PANGAEA. doi:10.1594/PANGAEA.869682.
- Gábor, L., W. Jetz, M. Lu, D. Rocchini, A. Cord, M. Malavasi, A. Zarzo-Arias, V. Barták, and V. Moudrý. 2022. “Positional Errors in Species Distribution Modelling are Not Overcome by the Coarser Grains of Analysis.” Methods in Ecology and Evolution n/a (n/a). doi:10.1111/2041-210X.13956.
- Gadelha Jr, L. M. R., P. C. de Siracusa, E. C. Dalcin, L. A. E. da Silva, D. A. Augusto, E. Krempser, H. M. Affe, et al. 2021. “A Survey of Biodiversity Informatics: Concepts, Practices, and Challenges.” WIRES Data Mining and Knowledge Discovery 11 (1): e1394. doi:10.1002/widm.1394.
- GEMET. 2021. “Forest.” General Multilingual Environmental Thesaurus. Accessed 2022/12/01. https://www.eionet.europa.eu/gemet/en/concept/3406.
- Goodchild, M. F. 2007. “Beyond Metadata: Towards User-centric Description of Data Quality.” Proceedings of the 2007), International Symposium on Spatial Data Quality, ISPRS, June 13–15, Enschede.
- He, L., P. Yue, L. Di, M. Zhang, and L. Hu. 2015. “Adding Geospatial Data Provenance Into SDI – A Service-Oriented Approach.” IEEE Journal of Selected Topics in Applied Earth Observations and Remote Sensing 8 (2): 926–936. doi:10.1109/JSTARS.2014.2340737.
- Henzen, C., A. Rümmler, and M. Wagner. 2021. “Recommendations for Developing a Metadata Profile for Earth System Science Data.” Zenodo 1–35. 10.5281/zenodo.4916698.
- Herrick, J. E., A. Quandt, C. Kenny, M. Contreras, J. Neff, W. S. Jang, J. Maynard, et al. 2019. “LandPKS (Land Potential Knowledge System): Mobile App for Extension”, Land-Use and Project Planning, M&E and On-Farm Research.
- Höck, H., F. Toussaint, and H. Thiemann. 2020. “Fitness for Use of Data Objects Described with Quality Maturity Matrix at Different Phases of Data Production.” Data Science Journal 19 (1): 1–14. doi:10.5334/dsj-2020-045.
- ISO. 2013. ISO 19157:2013 Geographic Information – Data Quality. International Organization for Standardization, Geneva. doi:10.31030/2090178.
- ISO. 2014. ISO 19115-1:2014 Geographic Information – Metadata – Part 1: Fundamentals. Geneva: International Organization for Standardization.
- ISO. 2019. ISO 19115-2:2019 Geographic Information – Metadata – Part 2: Extensions for Acquisition and Processing. Geneva: International Organization for Standardization.
- Ivánová, I., J. Morales, R. A. de By, T. S. Beshe, and M. A. Gebresilassie. 2013. “Searching for Spatial Data Resources by Fitness for Use.” Journal of Spatial Science 58 (1): 15–28. doi:10.1080/14498596.2012.759087.
- Jiang, L., P. Yue, W. Kuhn, C. Zhang, C. Yu, and X. Guo. 2018. “Advancing Interoperability of Geospatial Data Provenance on the Web: Gap Analysis and Strategies.” Computers & Geosciences 117: 21–31. doi:10.1016/j.cageo.2018.05.001.
- Jolivot, A., V. Lebourgeois, M. Ameline, V. Andriamanga, B. Bellon, M. Castets, A. Crespin-Boucaud, et al. 2021. “Harmonized In Situ JECAM Datasets for Agricultural Land Use Mapping and Monitoring in Tropical Countries.” CIRAD Dataverse. doi:10.18167/DVN1/P7OLAP.
- Klein, A.-M., B. E. Vaissière, J. H. Cane, I. Steffan-Dewenter, S. A. Cunningham, C. Kremen, and T. Tscharntke. 2007. “Importance of Pollinators in Changing Landscapes for World Crops.” Proceedings of the Royal Society B: Biological Sciences 274 (1608): 303–313. doi:10.1098/rspb.2006.3721
- Laurence, D., V. Andriamanga, E. Rasoamalala, S. Dupuy, and P. Burnod. 2019. “Antananarivo – Madagascar – 2017, Land Use Reference Spatial Database.” CIRAD Dataverse. doi:10.18167/DVN1/5TZOOW.
- Lesiv, M. 2019. “Human Impact on Forests (Version 1)”. doi:10.5281/zenodo.3356758.
- Leyk, S., A. E. Gaughan, S. B. Adamo, A. de Sherbinin, D. Balk, S. Freire, A. Rose, F. R. Stevens, B. Blankespoor, and C. Frye. 2019. “The Spatial Allocation of Population: A Review of Large-scale Gridded Population Data Products and Their Fitness for use.” Earth System Science Data 11 (3): 1385–1409. doi:10.5194/essd-11-1385-2019.
- Liangyun, L., G. Yuan, Z. Xiao, C. Xidong, and X. Shuai. 2019. “A Dataset of Global Land Cover Validation Samples (Version v1)”. doi:10.5281/zenodo.3551995
- Londoño Villegas, M. M., L. Le Mezo, and S. Dupuy. 2019. “Base de données spatiale pour l’apprentissage – 2016-2017- La Réunion”. CIRAD Dataverse. doi:10.18167/DVN1/HM9QNL.
- Lush, V., J. Lumsden, and L. Bastin. 2018. “Visualisation of Trust and Quality Information for Geospatial Dataset Selection and Use: Drawing Trust Presentation Comparisons with B2C e-Commerce.” In Trust Management XII. IFIPTM 2018. IFIP Advances in Information and Communication Technology, edited by Nurit Gal-Oz and Peter R. Lewis, 75–90. Cham: Springer. doi:10.1007/978-3-319-95276-5_6.
- Magagna, B., D. Goldfarb, P. Martin, M. Atkinson, S. Koulouzis, and Z. Zhao. 2020. “Data Provenance.” In Towards Interoperable Research Infrastructures for Environmental and Earth Sciences: A Reference Model Guided Approach for Common Challenges, edited by Zhiming Zhao and Margareta Hellström, 208–225. Cham: Springer. doi:10.1007/978-3-030-52829-4_12.
- Meijer, M., L. A. E. Vullings, J. D. Bulens, F. I. Rip, M. Boss, G. Hazeu, and M. Storm. 2015. “Spatial Data Quality and a Workflow Tool.” The International Archives of the Photogrammetry, Remote Sensing and Spatial Information Sciences XL-3/W3: 55–59. doi:10.5194/isprsarchives-XL-3-W3-55-2015.
- Meyer, C., P. Weigelt, and H. Kreft. 2016. “Multidimensional Biases, Gaps and Uncertainties in Global Plant Occurrence Information.” Ecology Letters 19 (8): 992–1006. doi:10.1111/ele.12624.
- Monfreda, C., N. Ramankutty, and J. A. Foley. 2008. “Farming the Planet: 2. Geographic Distribution of Crop Areas, Yields, Physiological Types, and Net Primary Production in the Year 2000.” Global Biogeochemical Cycles 22: 1. doi:10.1029/2007GB002947.
- Moudrý, V., and R. Devillers. 2020. “Quality and Usability Challenges of Global Marine Biodiversity Databases: An Example for Marine Mammal Data.” Ecological Informatics 56 (101051): 1–10. doi:10.1016/j.ecoinf.2020.101051.
- Mushtaq, F., M. Henry, C. D. O’Brien, A. Di Gregorio, R. Jalal, J. Latham, D. Muchoney, et al. 2022. “An International Library for Land Cover Legends: The Land Cover Legend Registry.” Land 11 (7): 1083. doi:10.3390/land11071083.
- NAL Agricultural Thesaurus. 2019. “Forests.” U.S. Department of Agriculture. Accessed 2022/12/01. https://agclass.nal.usda.gov/vocabularies/nalt/concept?uri=https://lod.nal.usda.gov/nalt/18644.
- Nedd, R., K. Light, M. Owens, N. James, E. Johnson, and A. Anandhi. 2021. “A Synthesis of Land Use/Land Cover Studies: Definitions, Classification Systems, Meta-Studies, Challenges and Knowledge Gaps on a Global Landscape.” Land 10: 9. doi:10.3390/land10090994.
- Nol, L., P. H. Verburg, G. B. M. Heuvelink, and K. Molenaar. 2008. “Effect of Land Cover Data on Nitrous Oxide Inventory in Fen Meadows.” Journal of Environmental Quality 37 (3): 1209–1219. doi:10.2134/jeq2007.0438.
- Olofsson, P., S. V. Stehman, C. E. Woodcock, D. Sulla-Menashe, A. M. Sibley, J. D. Newell, M. A. Friedl, and M. Herold. 2012. “A Global Land-cover Validation Data set, Part I: Fundamental Design Principles.” International Journal of Remote Sensing 33 (18): 5768–5788. doi:10.1080/01431161.2012.674230.
- Peng, G., R. R. Downs, C. Lacagnina, H. Ramapriyan, I. Ivánová, D. Moroni, Y. Wei, G. Larnicol, L. Wyborn, and M. Goldberg. 2021. “Call to Action for Global Access to and Harmonization of Quality Information of Individual Earth Science Datasets.” Data Science Journal 20 (1): 1–15. doi:10.5334/dsj-2021-019.
- Peng, G., C. Lacagnina, R. R. Downs, A. Ganske, H. K. Ramapriyan, I. Ivánová, L. Wyborn, D. Jones, L. Bastin, and C. L. Shie. 2022. “Global Community Guidelines for Documenting, Sharing, and Reusing Quality Information of Individual Digital Datasets.” Data Science Journal 21 (1): 1–20. doi:10.5334/dsj-2022-008.
- Percivall, G. 2010. “The Application of Open Standards to Enhance the Interoperability of Geoscience Information.” International Journal of Digital Earth 3 (sup1): 14–30. doi:10.1080/17538941003792751.
- Portmann, F. T., S. Siebert, and P. Döll. 2010. “MIRCA2000 – Global Monthly Irrigated and Rainfed Crop Areas Around the Year 2000: A New High-Resolution Data set for Agricultural and Hydrological Modeling.” Global Biogeochemical Cycles 24 (1): 1–24. doi:10.1029/2008GB003435.
- Prestele, R., P. Alexander, M. D. A. Rounsevell, A. Arneth, K. Calvin, J. Doelman, D. A. Eitelberg, et al. 2016. “Hotspots of Uncertainty in Land-use and Land-Cover Change Projections: A Global-scale Model Comparison.” Global Change Biology 22 (12): 3967–3983. doi:10.1111/gcb.13337.
- Rounsevell, M. D. A., A. Arneth, P. Alexander, D. G. Brown, N. de Noblet-Ducoudré, E. Ellis, J. Finnigan, et al. 2014. “Towards Decision-based Global Land Use Models for Improved Understanding of the Earth System.” Earth Syst. Dynam 5 (1): 117–137. doi:10.5194/esd-5-117-2014.
- Rümmler, A., H. Figgemeier, and C. Henzen. 2022. “Lösungsansätze zur automatisierten Erfassung und Weiterverarbeitung von strukturierten Provenance-Informationen in Forschungsdateninfrastrukturen am Beispiel von Analyse-Workflows in R.” Bausteine Forschungsdatenmanagement 1: 85–102. doi:10.17192/bfdm.2022.1.8367.
- Schulp, C. J. E., S. Lautenbach, and P. H. Verburg. 2014. “Quantifying and Mapping Ecosystem Services: Demand and Supply of Pollination in the European Union.” Ecological Indicators 36: 131–141. doi:10.1016/j.ecolind.2013.07.014.
- Sexton, J. O., P. Noojipady, X.-P. Song, M. Feng, D.-X. Song, D.-H. Kim, A. Anand, et al. 2016. “Conservation Policy and the Measurement of Forests.” Nature Climate Change 6 (2): 192–196. doi:10.1038/nclimate2816.
- Stehman, S. V., and G. M. Foody. 2019. “Key Issues in Rigorous Accuracy Assessment of Land Cover Products.” Remote Sensing of Environment 231: 111199. doi:10.1016/j.rse.2019.05.018.
- Szantoi, Z., A. Brink, A. Lupi, C. Mammone, and G. Jaffrain. 2020a. “Land Cover and Change Thematic and Validation Datasets for Sub-Saharan Africa.” PANGAEA. doi:10.1594/PANGAEA.914261.
- Szantoi, Z., G. N. Geller, N.-E. Tsendbazar, L. See, P. Griffiths, S. Fritz, P. Gong, M. Herold, B. Mora, and A. Obregón. 2020b. “Addressing the Need for Improved Land Cover Map Products for Policy Support.” Environmental Science & Policy 112: 28–35. doi:10.1016/j.envsci.2020.04.005.
- Tilmes, C., Y. Yesha, and M. Halem. 2010. “Tracking Provenance of Earth Science Data.” Earth Science Informatics 3 (1): 59–65. doi:10.1007/s12145-010-0046-3.
- Vågen, T.-G., C. Okia, and L. Winowiecki. 2017. “Land and Soil Health Assessment in the Nile-Congo Sentinel Landscape.” World Agroforestry (ICRAF). doi:10.34725/DVN/BOFN8B.
- Vahidnia, M. H., and H. Vahidi. 2021. “Open Community-based Crowdsourcing Geoportal for Earth Observation Products: A Model Design and Prototype Implementation.” ISPRS International Journal of Geo-Information 10 (1): 24. doi:10.3390/ijgi10010024.
- VALERI. 2022. “VAlidation of Land European Remote Sensing Instruments.” Accessed 2022/12/05. http://w3.avignon.inra.fr/valeri/fic_htm/database/main.php.
- Veiga, A. K., A. M. Saraiva, A. D. Chapman, P. J. Morris, C. Gendreau, D. Schigel, and T. J. Robertson. 2017. “A Conceptual Framework for Quality Assessment and Management of Biodiversity Data.” PLOS ONE 12 (6): e0178731. doi:10.1371/journal.pone.0178731.
- Verburg, P. H., K. Neumann, and L. Nol. 2011. “Challenges in Using Land Use and Land Cover Data for Global Change Studies.” Global Change Biology 17 (2): 974–989. doi:10.1111/j.1365-2486.2010.02307.x.
- Wagner, M., and C. Henzen. 2022. “Quality Assurance for Spatial Research Data.” ISPRS International Journal of Geo-Information 11: 6. doi:10.3390/ijgi11060334.
- Wagner, M., C. Henzen, and R. Müller-Pfefferkorn. 2021. “A Research Data Infrastructure Component for the Automated Metadata and Data Quality Extraction to Foster the Provision of FAIR Data in Earth System Sciences.” AGILE GIScience Ser 2: 41. doi:10.5194/agile-giss-2-41-2021.
- Wentz, E. A., and M. Shimizu. 2018. “Measuring Spatial Data Fitness-for-Use Through Multiple Criteria Decision Making.” Annals of the American Association of Geographers 108 (4): 1150–1167. doi:10.1080/24694452.2017.1411246.
- Whitfield, P. H. 2012. “Why the Provenance of Data Matters: Assessing Fitness for Purpose for Environmental Data.” Canadian Water Resources Journal / Revue Canadienne des Ressources Hydriques 37 (1): 23–36. doi:10.4296/cwrj3701866.
- WIKIDATA. 2022. “Forest.” Accessed 2022/12/01. https://www.wikidata.org/wiki/Q4421.
- Wilkinson, M. D., M. Dumontier, I. J. Aalbersberg, G. Appleton, M. Axton, A. Baak, N. Blomberg, et al. 2016. “The FAIR Guiding Principles for Scientific Data Management and Stewardship.” Scientific Data 3 (1): 160018. doi:10.1038/sdata.2016.18.
- Wüest, R. O., N. E. Zimmermann, D. Zurell, J. M. Alexander, S. A. Fritz, C. Hof, H. Kreft, et al. 2020. “Macroecology in the age of Big Data – Where to go from Here?” Journal of Biogeography 47 (1): 1–12. doi:10.1111/jbi.13633.
- Yang, X., J. D. Blower, L. Bastin, V. Lush, A. Zabala, J. Masó, D. Cornford, P. Díaz, and J. Lumsden. 2013. “An Integrated View of Data Quality in Earth Observation.” Philosophical Transactions of the Royal Society A: Mathematical, Physical and Engineering Sciences 371 (1983): 20120072. doi:10.1098/rsta.2012.0072.
- Yu, Q., L. You, U. Wood-Sichra, Y. Ru, A. K. B. Joglekar, S. Fritz, W. Xiong, M. Lu, W. Wu, and P. Yang. 2020. “A Cultivated Planet in 2010 – Part 2: The Global Gridded Agricultural-Production Maps.” Earth System Science Data 12 (4): 3545–3572. doi:10.5194/essd-12-3545-2020.
- Zabala, A., J. Masó, L. Bastin, G. Giuliani, and X. Pons. 2021. “Geospatial User Feedback: How to Raise Users’ Voices and Collectively Build Knowledge at the Same Time.” ISPRS International Journal of Geo-Information 10 (3): 141. doi:10.3390/ijgi10030141.