
 ?Mathematical formulae have been encoded as MathML and are displayed in this HTML version using MathJax in order to improve their display. Uncheck the box to turn MathJax off. This feature requires Javascript. Click on a formula to zoom.
ABSTRACT
With the remarkable success of change detection (CD) in remote sensing images in the context of deep learning, many convolutional neural network (CNN) based methods have been proposed. In the current research, to obtain a better context modeling method for remote sensing images and to capture more spatiotemporal characteristics, several attention-based methods and transformer (TR)-based methods have been proposed. Recent research has also continued to innovate on TR-based methods, and many new methods have been proposed. Most of them require a huge number of calculation to achieve good results. Therefore, using the TR-based mehtod while maintaining the overhead low is a problem to be solved. Here, we propose a GNN-based multi-scale transformer siamese network for remote sensing image change detection (GMTS) that maintains a low network overhead while effectively modeling context in the spatiotemporal domain. We also design a novel hybrid backbone to extract features. Compared with the current CNN backbone, our backbone network has a lower overhead and achieves better results. Further, we use high/low frequency (HiLo) attention to extract more detailed local features and the multi-scale pooling pyramid transformer (MPPT) module to focus on more global features respectively. Finally, we leverage the context modeling capabilities of TR in the spatiotemporal domain to optimize the extracted features. We have a relatively low number of parameters compared to that required by current TR-based methods and achieve a good effect improvement, which provides a good balance between efficiency and performance.
1. Introduction
Change detection (CD) has become a popular research topic in the remote sensing (RS) field. Remote sensing change detection can be described as the process of extracting change information using dual-time or multi-time remote sensing image data, employing multiple image processing and pattern recognition methods, and quantitatively analyzing and characterizing surface changes. Depending on the part of the change defined in the remote sensing image, there can be different application scenarios such as urban management (Iino et al. Citation2017, Li Citation2018), deforestation (De Bem et al. Citation2020, Stylianidis et al. Citation2020), damage assessment (Peng et al. Citation2019), cropland change (Liu et al. Citation2022), environmental monitoring (Mucher et al. Citation2000) and land cover (Liu et al. Citation2015, Elmahdy and Mohamed Citation2018).
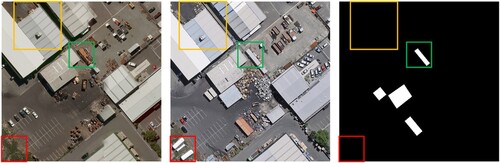
With the development of data acquisition platforms, such as remote sensing images, clearer ultra-high-resolution images have been obtained, which also provide a more accurate way of detecting more detailed land cover and land use. The current challenges of high-resolution RS images in CD tasks includ the accurate identification of (1) target regions in complex scenes, and (2) the same feature object under different imaging conditions. For example, in a complex scene, the regions of interest and non-interest can be accurately identified (green and red boxes in ). Owing to the different imaging conditions, the same area may present different feature information (yellow box in ).
Figure 1. Describes the content details in the change detection task. Red boxes indicate areas that do not need to be identified. Yellow boxes represent the same area with different appearances. Green boxes indicate areas that need to be identified.
With the introduction of deep learning (DL) and its gradual application in the field of computer vision, the CD method has also made significant progress. In the early traditional CD method, a difference image was obtained by algebraic operations for the lower-resolution RS data. Threshold-based or cluster-based image segmentation techniques were conducted to obtain binary CD maps. In addition, principal component analysis (PCA) and change vector analysis (CVA) have been proposed to enhance image change information for change detection in change-based methods in early CD technology. The emergence of the powerful capabilities of the deep convolutional neural network (CNN) has brought a new direction to the current RS image analysis and has shown good performance in the CD task. In addition, generative adversarial networks (GAN) and recurrent neural networks (RNN) based on deep learning have been introduced into the CD field.
Given the powerful capabilities of CNN, recent supervised CD methods all adopt the CNN structure to extract the semantic features of dual-temporal images separately and use the two parts of semantic information for change recognition. Inspired by the segmentation model (Ronneberger, Fischer, and Brox Citation2015), many scholars have designed methods that can be adapted for CD tasks (Daudt, Saux, and Boulch Citation2018).
Although the CD method based on pure convolution has a huge improvement compared to the traditional method, with the development of more complex and clearer remote sensing images, more accurate target recognition is required. Therefore, researchers have begun to explore spatial and temporal context modeling of high-resolution image interest changes, focusing on how to increase the receptive field (RF). Most methods stack more convolutional layers (Chen and Shi Citation2020, Chen et al. Citation2020, Zhang et al. Citation2019, Zhang and Shi Citation2020) or use dilated convolutions (Zhang et al. Citation2019) to increase RF and use attention mechanisms (Chen and Shi Citation2020, Chen et al. Citation2020, Liu et al. Citation2020, Zhang et al. Citation2020, Peng et al. “Optical Remote Sensing Image Change Detection,” Citation2020, Jiang et al. Citation2020, Diakogiannis, Waldner, and Caccetta Citation2021) to further increase RF and the processing of optimized feature details. However, relying only on the traditional spatial and channel attention mechanism cannot achieve a very significant improvement, and most methods still rely on large CNN feature extraction backbones. At the same time, although self-attention can effectively model the semantic relationship between pixels in space and time, the computational efficiency and complexity will increase exponentially with the amount of information.
With the excellent performance of TR in the fields of natural language processing (NLP) and computer vision (CV), many studies have introduced TR in CD tasks (Chen, Qi, and Shi Citation2021, Song, Hua, and Li Citation2022a, Bandara and Patel Citation2022). Using the more powerful context modeling ability of TR to obtain longer-distance dense relationships makes up for the capabilities that traditional convolution and attention mechanisms do not have. At present, TR-based methods generally use stacked CNN backbones for feature extraction first and TR for further modeling (Chen, Qi, and Shi Citation2021), or stacked TR encoders for feature extraction (Bandara and Patel Citation2022). However, the parameters of these methods are also relatively large.
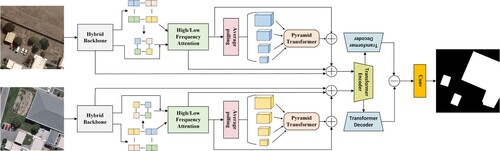
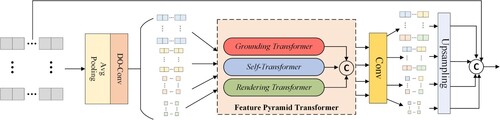
Based on the above analysis, we designed a TR-based CD network that balances the parameter quantities and performance. In this study, we introduce our GNN-based multi-scale transformer Siamese network for remote sensing image change detection (GMTS), as shown in . This network uses an efficient and low-parameter hybrid backbone composed of DO-Conv (Cao et al. Citation2022) and graph convolution (Han et al. Citation2022), which achieves a shallow layer with a low-layer parameter and better performance. To obtain a better receptive field and better global modeling ability, we use a high/low frequency (HiLo) hybrid attention mechanism (Pan, Cai, and Zhuang Citation2022) to optimize the details of features from high and low scales. To better focus on global information, we designed an improved feature interaction method across space and scales, namely, the multi-scale pooling pyramid transformer module (MPPT). Through MPPT, we can obtain more accurate global information so that the information after the backbone can be further integrated into the global information. We fuse the information of each step so that the multi-stage and multi-scale information can jointly extract accurate feature information. The fused features were passed to the TR module for global context modeling, and a shallow CNN was used to generate the final pixel-level change prediction.
Figure 2. Detailed description of our GMTS, including the hybrid backbone, HiLo attention module, MPPT module, and TR module. The hybrid backbone, HiLo attention module, and MPPT module serve as the feature extraction backbone of the network. The role of the TR module is to help model the bitemporal image. The output of the TR module is the final feature map of the bitemporal image. The difference between the two feature maps is calculated, and the final mask map is output by a shallow CNN.
The contributions of our work can be summarized in the following points:
We designed a low-parametric-number and high-performance hybrid backbone, in which the joint use of DO-Conv and vision GNN was introduced and achieved good results. The efficient DO-Conv was combined with the vision GNN, which has an open perception field, to achieve both a wider acceptance domain and good results with a lower overhead.
To better establish the dense relationship between the whole world, we used HiLo attention to focus on the high/low frequency of the information extracted by the backbone to obtain more accurate feature information. We designed an MPPT module that extracts global features using multi-scale information. This helps the feature learning backbone to perform global feature extraction and compensates for incomplete feature information owing to the lack of multiscale information.
Compared with current TR-based CD methods, we achieved good performance and parameters. Not only are the computational and parametric quantities lower than those of many CD methods, but the performance is also significantly improved. On the LEVIR-CD, WHU-CD, and GZ-CD datasets, the F1-Score was the next highest at 1.17%, 1.80%, and 1.20%, respectively.
The remainder of this paper is organized as follows. Section 2 describes the non-transformer and transformer-based CD approaches using a deep learning approach. In Section 3, we describe the design concepts of our approach in detail. In Section 4, we summarize and analyze the experimental reports. Finally, ourconclusions are presented in the Section 5.
2. Related work
The CD task currently uses DL-based methods to achieve good results and can be divided into many types of methods. According to whether it is necessary to establish a training sample set and use labeled samples for learning, CD methods can be divided into unsupervised (Gong et al. Citation2019, Zhou and Li Citation2020) and supervised methods (Daudt, Saux, and Boulch Citation2018, Cheng et al. Citation2021). These models are divided into two types according to their framework: the single-stream model (Bandara and Patel Citation2022, Zhang et al. Citation2022) and the dual-stream model (Chen, Qi, and Shi Citation2021, Song, Hua, and Li Citation2022b, Yuan et al. Citation2022). The framework of the single-stream model is mainly to process the bitemporal image before inputting it into the network (including two methods based on concatenation or difference) so that multiple inputs become a single input into the CD network. The framework of the dual-stream model is mainly used to extract features from the bitemporal image using two identical backbones and then compare and analyze the difference between the two features for CD prediction. Moreover, in the two-stream model, according to whether the feature extraction backbone shares weights, it is divided into a Siamese structure and a pseudo-Siamese structure. However, at present, the feature extraction backbone based on the Siamese structure is the mainstream method, which not only reduces the overhead of the model but also yields good results. As TR is applied to the CD task, its use has become a basis for distinguishing current CD methods. Therefore, current CD methods are generally divided into pure convolution-based, attention-based, and TR-based methods. In the following section, we introduce related studies based on these points.
2.1. CNN-based CD method
CNNs have achieved effective feature-extraction capabilities in the visual field. Early researchers used CNN to design many CD networks using pure convolution methods. Daudt, Saux, and Boulch (Citation2018) used the Unet structure (Ronneberger, Fischer, and Brox Citation2015) to take the lead in integrating existing segmentation methods into the CD task and proposed three fully convolutional network (CNN) types. The input bitemporal image is concatenated before input, concatenated after input, and differenced after input. This discussion of the different generation methods has laid a solid foundation for future research on high-resolution RS images.
However, as the research pays more attention to the increase in the receptive field, Song, Cui, and Jiang (Citation2021) used expanded convolution and variability convolution to replace traditional convolution for enhanced context modeling ability. With the gradual application of the attention mechanism, Li and Huo (Citation2021) improved the Daudt, Saux, and Boulch (Citation2018) method. By adding a pyramid attention layer, the feature difference map processed by its structural processing from the original network was further exploited by the attention mechanism to extract multi-scale variation information, demonstrating that the attention mechanism can improve CNN-based methods. In addition, recent research is more enthusiastic about CNN backbones with attention components to process features in more detail (Fang et al. Citation2021, Chen et al. Citation2020, Liu et al. Citation2020, Song, Hua, and Li Citation2022b, Zhao et al. Citation2019, Chen and Shi Citation2020, Song and Jiang Citation2021). For example, Chen and Shi (Citation2020) utilized a self-attention mechanism to model spatiotemporal relationships and integrated it into a feature extraction process to generate a new CD self-attention model. They utilized the attention between any two pixels at different times and locations, and the force weights to generate the final discriminative features. Song and Jiang (Citation2021) utilized a spatial attention module to add spatial information to deep features the discrimination between changing objects and backgrounds. There is also (Chen et al. Citation2020), which uses a dual attention module to reweight the attention of channels and spatial dimensions and pays more attention to task-related positions and channels.
Attention alone cannot significantly improve the overall performance of the network. Therefore, many methods have begun to use multi-level feature fusion (Fang et al. Citation2021) to improve the change detection performance or use deep supervision (Zhang et al. Citation2020).
Although these models based on CNN and attention mechanisms have improved the feature representation ability of the model, usually the framework based on FCN has a fixed local radio frequency. It is difficult to perform long-term modeling, and it cannot be well controlled for global modeling. Moreover, the current CNN-based backbone network has become increasingly deeper to achieve better results and gradually does not consider the reliability of time performance. In addition, most studies have begun to integrate complex attention modules at each stage, resulting in a bloated entire network, further increasing complexity and decreasing time efficiency. Therefore, we propose a new type of hybrid backbone that uses a shallower layer of DO-Conv composed of convolutional block fusion graph convolutional blocks to extract feature information. Compared with traditional convolution, our method not only has lower complexity but also has a good effect improvement. In addition, to ensure that the backbone network performs well, we separately performed attention operations on local and global features so that the extracted features contained more extensive multi-scale information.
2.2. Transformer-based CD method
With the field of TR (Vaswani et al. Citation2017) in the field of natural language processing (NLP). research on TR in the field of computer vision has been initiated. Compared to the conventional attention mechanism, TR has an irreplaceable advantage. With a nonlocal attention mechanism, it has a better global feature correlation than the traditional attention mechanism. TR can establish a long-term spatiotemporal relationship between the features of each pixel of the image, model them according to the dependence of each position, and enhance the modeling ability overall.
After the successful application of TR in the field of remote sensing, some scholars began to introduce TR into CD tasks (Chen, Qi, and Shi Citation2021, Bandara and Patel Citation2022). Currently, TR-based CD methods can be divided into two categories. One method is the siamese CD method (Bandara and Patel Citation2022, Zhang et al. Citation2022) that completely uses TR methods, in which the CNN model is abandoned, and TR is used as the encoder of the overall network. Although this type of concatenate-level operation has achieved good results, the complexity of the TR-based backbone is usually relatively high, and multilevel feature extraction is required, which greatly increases the network overhead.
There is also a pseudo-siamese model that uses the CNN backbone for feature extraction and then the TR for global modeling. For example, Chen, Qi, and Shi (Citation2021) first proposed ResNet as a CD method for extracting the backbone and used TR for modeling. Spatiotemporal attention was paid to each region of the bitemporal image, and tokens similar to those in the NLP field were used to represent image features, and good results were obtained. Compared to the first method, this method is less complex and relies on feature extraction by the CNN backbone. As a module to help global modeling, TR has good effects and a low network overhead. Therefore, using the backbone to extract more accurate feature information is the main improvement direction of this method.
To improve the effectiveness of the pseudo-Siamese method, we designed a novel hybrid backbone network and combined it with a TR module. To keep the parameters low and to improve the effect, we integrated the lightweight HiLo attention module and the MPPT module to achieve the double improvement of lower complexity and better effect.
3. Methodology
In this study, we propose a hybrid backbone multi-scale fusion transformer remote sensing change detection method. The overall framework of the network is illustrated in . The proposed method can be divided into four modules: feature extraction hybrid backbone, HiLo attention module, MPPT module, and TR module. For the input image, we used the hybrid backbone for feature extraction and HiLo attention to fuse global and local features to extract more detailed feature information. In the MPPT module, we further determine the global information such that the global-scale information can be further integrated into the extracted features. Finally, we leverage the ability of the TR to model the global context to generate enhanced biemporal features. Convolution of the prediction head was used to generate the final pixel-level prediction.
3.1. Hybrid backbone
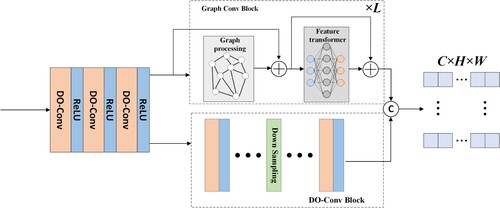
The abilities of CNN have been reflected in various fields. However, we aim to design a feature extraction method that maintains the high performance of segmentation and performs feature extraction in a simple and shallow manner. Therefore, we propose a hybrid backbone consisting of DO-Conv (Cao et al. Citation2022) and graph convolution (Han et al. Citation2022) to extract the features, as shown in .
Figure 3. Detailed description of the hybrid backbone in GMTS. The hybrid backbone is divided into three parts: a shallow convolution layer, a graph convolution block, and a DO-Conv block. First, the original three-channel image goes through a shallow convolution layer to process the feature map into features of different channels, which enter the graph convolution block and DO-Conv block. The DO-Conv block is a multi-layer structure similar to ResNet. Finally, the two parts of features are concatenated and output a feature map for preliminary feature extraction.
DO-Conv. DO-Conv is a new method that combines deep convolution with traditional convolution. For the input features, we can express the operation mode of DO-Conv as:
(1)
(1) where
represents the trainable kernel of depthwise convolution, and
represents the trainable kernel of traditional convolution. ⊛ represents the DO-Conv operation, ° represents the depth convolution operation,
represents the traditional convolution operation, and
is the transpose of D on the first and second axes.
represents a feature composition operation,
represents the kernel composition operation. More details about DO-Conv are provided in Cao et al. (Citation2022). DO-Conv improves the parameters by only 0.17 M compared to conventional convolution but accelerates the overall computation of the network to 1/2 the duration of the original (please refer to the ablation experiment). In addition, the performance improvement was also very large. This allows us to achieve relatively good performance even with a relatively shallow CNN structure. For substantial performance improvement in exchange for trace parameter enhancement, we believe that DO-Conv is the key to resolving the conflict between parameters and performance.
Vision GNN. For an input image with a size of , the image is first divided into N patches, and then feature transformation is performed to obtain the feature vector
corresponding to each patch; thus,
, where D is the feature dimension number. These features can be considered as a set of unordered nodes, expressed as
. For each node
, an exhaustive set of k adjacent nodes
can be found, and for all
add an edge
is added from
to
. Subsequently, a graph
is obtained, where ε represents an edge. Specifically, graph convolution works as follows.
(2)
(2) where
and
are learnable weights for the aggregation and update operations, respectively. The aggregation operation calculates the representation of a node by aggregating the features of adjacent nodes, and the update operation further merges the aggregated features, which can be expressed as
(3)
(3) where
is the set of
neighboring nodes. For convenience and efficiency, the maximum relative graph convolution (Han et al. Citation2022) is used here, expressed as
(4)
(4) The above graph-level processing can be expressed as
. Then, a multi-head update operation is performed on the aggregated features. First, the aggregation feature X is divided into n heads, which are represented by h. These heads were then updated using different weights respectively. All the heads can be updated in parallel and concatenated to obtain the final value:
(5)
(5) The multi-head update operation allows the model to update information in multiple representation subspaces. The aforementioned operations are described in detail in Han et al. (Citation2022). The application of the Vison GNN remedies the problem of the limited acceptance domain of CNN, which has a significant role in feature learning, but the size of the acceptance domain always limits the control of global information. Compared with the method of extracting features using a Transformer, the Vision GNN method compensates for the problem of the restricted receptive domain and is more flexible. In the ablation experiments, we demonstrated the improvement brought about by using vision graph convolution.
Implementation details. The hybrid backbone is divided into three parts: a shallow convolution layer, graph convolution block, and DO-Conv block. First, the original image is processed by a shallow convolution layer into 128-channel and 32-channel features in the graph convolution block and DO-Conv block, respectively. The graph convolution block is composed of graph convolution and a nonlinear activation function. The DO-Conv block has a multilayer structure similar to that of ResNet. Finally, the two parts of the features are concatenated, and a 128-channel feature map is output.
3.2. High/low frequency attention module
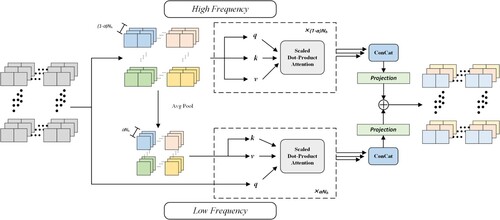
Owing to the high complexity of a scene, remote sensing images usually contain rich frequencies. High frequency features are usually used to capture local details of the picture (e.g. building edge lines, building shapes), and low frequency encoding is used to extract global structures (e.g. target global color, texture). However, global attention in the classic multi-head self-attention (MSA) layer does not consider the characteristics of the underlying frequency; therefore, attention to high/low frequency can be very good for image modeling. Here, we introduce a method that helps to more efficiently extract features. High/low frequency (HiLo) attention (Pan, Cai, and Zhuang Citation2022) is shown in .
Figure 4. Detailed description of the HiLo attention module. The module is divided into two types of processing, the high frequency part and the low frequency part, whose input is the feature information from the hybrid backbone. 1-α heads are assigned to high frequency features, and fine-grained high frequency is captured by local window self-attention. α heads are divided into low frequency features and modeled with the help of queries in high frequency. Finally, the fine-grained high/low frequency features are connected, and the resultant output is forwarded to the subsequent layers.
Multi-head self-attention. In the HiLo attention module, the attention of high/low frequency features is mainly carried out by the MSA. For the input feature , N represents the length of the input sequence and D is the hidden dimension. Each self-attention head computes the query Q, key K and value V matrices using a linear transformation of X:
(6)
(6) where
denotes the learnable parameters of the three linear projection layers, and
is the hidden dimension of the head. Each attention head can be represented as
(7)
(7) where
represents the softmax function operating in the channel dimension. For an MSA layer with n heads, the final output is computed by a linear projection of the concatenated output of each sub-attention head, denoted as
(8)
(8) where
is a linear projection matrix and h is the number of attention heads. MSA operates based on Vaswani et al. (Citation2017).
High frequency attention. Because high frequency coding objects pay more attention to local details, applying global attention to feature maps may be unable to extract more detailed picture details and will bring a huge amount of calculation. Therefore, in high frequency attention, local window self-attention is used to capture fine-grained high frequency signals to reduce computational complexity. Simple non-overlapping window partitioning is used in this module, which is more hardware-friendly than time-consuming operations, such as window moving (Han et al. Citation2022) or multi-scale window partitioning (Yang et al. Citation2021).
Low frequency attention. Studies have shown that the MSA global attention helps to capture low frequencies (Park and Kim Citation2022). Therefore, a low-pass filter (Voigtman and Winefordner Citation1986) was used here to process the high-resolution features to obtain low frequency signals. The low frequency features are mapped to keys , and values
, where s is the window size. Here, the query Q originates from the original features X, and standard attention is applied to them to capture low frequency information.
Head split. Here, to in order to obtain better efficiency, HiLo divides the same number of heads in MSA into two groups, and the with a split ratio is α, where is used for the processing of high frequency features, and
is used for the processing of low frequency features. This ensures the low complexity of the entire framework and helps reduce the model parameters. Finally, the output of the HiLo is connected each attention.
Because our backbone does not perform multi-stage downsampling, such as Unet and ResNet, our motivation is to extract features at different scales using HiLo attention. If only self-attention is used for feature extraction at one size, it is easy to ignore the global features at smaller scales. The HiLo module extraction of high/low frequency features is essentially the extraction of detailed features and global features using self-attention. In addition, in the extraction of lowfrequency features, HiLo uses a less complex approach than the direct use of multiheaded self-attention, which also accelerates the overall computational speed of the network.
3.3. Multi-scale pooling pyramid transformer module
To use the feature information of each scale for feature extraction, we are inspired by multi-scale average pooling (MSAP) (Wang et al. Citation2020) and a feature pyramid transformer (FPT) (Zhang and Shi Citation2020), which we used to design the MPPT module for multi-scale global feature extraction, as shown in .
Figure 5. Detailed description of the MPPT module. Among them, the pooling operation is used to extract information of four scales, and the multi-scale information is passed into the FPT module for global attention, and finally guides the modeling of input features.
MSAP module. To extract global information, we extracted image patches of different sizes by using average pooling and DO-Conv operations. Here, we set the kernel and stride sizes of the convolution part to 64, 32, 16, and 8. The pooled information is then passed into the FPT module to model the global information.
FPT module. Here, we used three transformer types: self-transformer (ST), grounding-transformer (GT), and rendering transformer (RT). The three methods use different rules to fuse context information of different scales, as shown in . The ST module only obtains object features that appear at the same time as the feature image. In essence, it is a modified non-local interaction (Wang et al. Citation2018), so that the output feature has the same ratio as the input X. Among them, a mixture of softmaxes (MoS) (Yang et al. Citation2017) is used as a normalization function, and then q and k are divided into n parts to calculate the similarity of each part score
. The normalization function
based on MoS can be expressed as
(9)
(9) where
is the similarity score of the nth part, and
is the nth aggregation weight. The GT module is a top-down non-local interaction, that maps the deep feature map
onto the shallow feature map
. Essentially, it enhances shallow features. The similarity is calculated using the euclidean distance
instead of the dot product. Therefore, using
as the similarity function is expressed as
(10)
(10) where
and
,
is the ith feature position of
, and
represents the jth feature position of
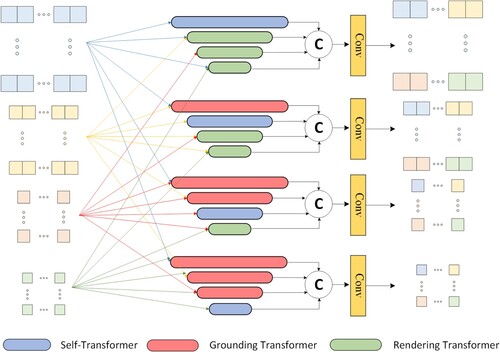
. More details on the functions and operations of the FPT module can be found in the Zhang and Shi (Citation2020). The RT module works in a bottom-up manner, aiming to enhance the deep feature maps by rendering high-level semantic ”concepts” through low-level ”pixel” information. RT belongs to partial rendering, using high-level features to define Q, and low-level features to define K and V to highlight the rendering target. According to the rules of ST, GT, and RT, after calculating the corresponding features that integrate the context information of different scales, the feature maps are reordered according to size; finally, the final FPT features are generated through a convolutional layer.
Figure 6. Interaction rule descriptions in the FPT module. Multi-scale features use ST, GT, and RT to perform feature-level interactions, and combine multi-scale information to generate new multi-scale features.
Feature fusion. At the end of the MPPT module, the multilayer features obtained by FPT are upsampled to the same size as the input, and the information of the four sizes is fused with the information of the two sizes of the mixed backbone and the information after the HiLo module to integrate features from various stages and sizes for better modeling.
3.4. Transformer module
In the TR module, the acquired image features can be further optimized and modeled to enhance their expressiveness. This module can be split into three modules: semantic tokenizer, TR encoder, and TR decoder, as shown in .
Figure 7. Detailed description of the TR module. It includes three parts: semantic tag extractor, TR encoder, and TR decoder.
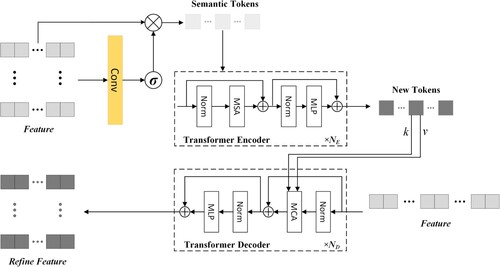
Semantic tokenizer. For an input image feature , the image is first extracted into two sets of tokens
, where L represents the size of the tagged vocabulary. For each pixel on feature
we used point-wise convolution to obtain the semantic groups. Softmax is then used to calculate the spatial attention map, and the attention map is finally used to calculate the weighted average sum in the pixel
, expressed as:
(11)
(11) where
represents the point-wise convolution of the learnable kernel
, and
is normalized for each semantic group to get the attention map
. The idea behind this part originates from Chen, Qi, and Shi (Citation2021).
Transformer encoder. In the encoder, context modeling is performed on the obtained dual-temporal image tokens , so that the image can make full use of the global semantic information in the token. The encoder is an iterative
-layer structure composed of normalization MSA and multi-layer perceptron (MLP). The MSA operation here is the same as in the introduction in section 3.2, and it is represented by multiple attention heads. It is eventually passed into the MLP layer and activated by GELU (Hendrycks and Gimpel Citation2016) to obtain a new token
, which is formally expressed as:
(12)
(12) where
,
are the linear projection matrixes.
Transformer decoder. In the decoder, the optimized token projects high-level semantic information containing rich context back into the pixel space to obtain a better pixel-level feature representation. Here, each pixel in the original feature F is guided by
for modeling, and the refined feature
is obtained. The pixel information in F is used as the multi-head cross-attention (MCA) query, and the token
is used as the key and value. Using MCA instead of MSA can prevent dense relationships between pixels that require extensive calculations. Here, the MCA can be expressed as
(13)
(13) where
is a linear projection matrix and h is the number of attention heads.
3.5. Other network details
Multi-scale feature fusion. We fused information from multiple stages in the final stage of feature extraction. These include the intermediate and final processes of the hybrid backbone and the results from the HiLo attention and MPPT modules. These are integrated into a final feature that contains both detailed and global information.
Prediction head. After feature extraction of the backbone part and feature optimization of the transformer, we generated a final difference prediction map for the generated dual image features. For two outputs (
and
represent the height and width of the original image respectively), the prediction head calculates the difference between the two outputs to generate the final prediction map:
(14)
(14) where
represents the softmax function. The calculation method for the feature difference is the element-level absolute value subtraction. We perform the channel dimension conversion operation g on the final difference feature to transform it into
. For the g operation, we used two 3×3 convolutional layers and BatchNorm, and the number of output channels gradually decreased to 32 and 2, respectively. respectively.
Loss function. The essence of the CD method is similar to the binary classification task of semantic segmentation; therefore, we optimize the model parameters by minimizing the cross-entropy loss. The loss function is defined as follows:
(15)
(15) where
is the cross-entropy loss
and
is the label for the pixel at location
.
4. Experimental results and analysis
4.1. Datasets
We used the current relatively new and high-spatial-resolution remote sensing building change detection datasets, namely, LEVIR-CD, WHU-CD, and GZ-CD, on three datasets to verify our method and the performance of current advanced methods.
LEVIR-CD (Chen and Shi Citation2020) is a large-scale public dataset collected from the Google Earth platform, including 637 pairs of HR optical images with a spatial resolution of 0.5m/pixel. To maintain the same test data as the other CD methods, we cropped LEVIR-CD to
images. The training, validation, and test datasets comprised 7120, 1024, and 2048 sets, respectively.
WHU-CD (Ji, Wei, and Lu Citation2018) is a large public CD dataset. It consists of a pair of high-resolution aerial images with a size of and a spatial resolution of 0.075m/pixel. We cropped it to
samples for training, validation, and testing, and the data sizes were 6096, 762, 762, respectively.
GZ-CD (Peng et al. “SemiCDNet: A Semisupervised Convolutional,” Citation2020) is a large-scale public dataset that covers urban changes in the suburbs of Guangzhou, China that ave occurred over the past decade. Using Google Earth's BIGEMAP software, 19 pairs of seasonal VHR images were collected, with a spatial resolution of 0.55/pixel. Buildings are marked in the figure, representing the major changes caused by urbanization. The image sizes varied from pixels to
pixels. We cropped it into non-overlapping image patches of
pixels. Finally, we set the training, validation, and test data sizes to 2834, 400, and 325, respectively.
4.2. Experimental setup
Evaluation Metrics. To better verify the effectiveness of our method, we conducted experiments in the above three data sets and compared the current advanced CD methods in the same way, where we used precision, recall, F1-score, and intersection. The five evaluation metrics of over-union and overall accuracy were used to evaluate each method. Here, they are represented as Pre, Re, F1-score, IoU, and OA. Among them, the F1-score and IoU are the main evaluation metrics, and the larger the value is, the better is the performance of the model. The representations of the above metrics are:
(16)
(16) where TP, TN, FP and FN represent the numbers of true positives, true negatives, false positives and false negatives, respectively.
Implementation details. Our model is a deep-learning model implemented under the Pytorch framework, using the torch1.11 environment on the Ubuntu system with a TAITAN RTX graphics card for training. We performed data augmentation, such as rotation, rescaling, cropping, and Gaussian blur, on the input training data. We optimized the model using stochastic gradient descent (SGD) with momentum and set the momentum to 0.99 and the weight decay to 0.0005. The learning rate was uniformly set to 0.01 on the three datasets. At the end of each round of training, we used the verification set for verification, saved the optimal model, and tested it.
4.3. Comparative experiment
4.3.1. Comparative CD method
In this section, we compare our GMTS to several of the more advanced methods including three purely convolutional-based methods (FC-Siam-Conc Daudt, Saux, and Boulch Citation2018, FC-Siam-Di Daudt, Saux, and Boulch Citation2018 and FC-EF Daudt, Saux, and Boulch Citation2018), three attention-based methods (DSIFN Zhang et al. Citation2020, DTCDSCN Liu et al. Citation2020, and SNUNet Fang et al. Citation2021) and three transformer-based methods (BIT Chen, Qi, and Shi Citation2021, ChangeFormer Bandara and Patel Citation2022, and CropLand Liu et al. Citation2022).
FC-EF (Fully Convolutional Early Fusion) (Daudt, Saux, and Boulch Citation2018): This is an image-level method based on the U-Net framework. The EF structure concatenates two input images before they are input into the network and processes them as different channels in an image.
FC-Siam(Siamese)-Di (Daudt, Saux, and Boulch Citation2018): Siam is the abbreviation for Siamese. It is an FC-EF-based Siamese neural network structure based on the feature difference level. The absolute value of the difference between the feature maps of the two decoder branches was first obtained, and then a skip connection was made with the corresponding layer of the decoder.
FC-Siam-Conc (Daudt, Saux, and Boulch Citation2018): This is a twin neural network structure based on FC-EF based on the feature concatenate level. The network skip-connects the branches of the two encoders and two feature maps of the corresponding layers of the decoder.
DTCDSCN (Liu et al. Citation2020): This is an attention-based method. A twin convolutional neural network with dual-task constraints was proposed. The network composition includes a change detection network, two semantic segmentation networks (SSN), and a dual attention module.
DSIFN (Zhang et al. Citation2020): DSIFN adopts the multi-scale feature connection method. Herein, a deep supervised image fusion change detection network is proposed, which uses a deeply supervised discriminative network to achieve integrity of the graph boundary and internal compactness, and fuses multilevel depth features with image difference features through an attention mechanism.
SNUNet (Fang et al. Citation2021): This is a multi-level feature connection method, in which the densely linked (NestedUNet) Siamese network is used for change detection, and deep supervision is used to improve the recognition ability of intermediate features and the effectiveness of the final features.
MSCANet (Liu et al. Citation2022): This is a transformer-based feature difference level method, in which a CNN-transformer network with multiscale context aggregation (MSCANet) is proposed, which combines the advantages of CNN and a transformer to achieve efficient and effective change detection.
BIT (Chen, Qi, and Shi Citation2021): This is a transformer-based feature difference-level method that extracts tokens containing rich image features through semantic tokens and then uses transformers to enhance its context modeling capabilities.
ChangeFormer (Bandara and Patel Citation2022): This is a transformer-based feature concatenation method, which backbone is composed entirely of TR encoders, and a CNN is not used. An MLP is used as the decoder, which is unified in the Siamese network architecture for change detection.
We used its public code with default hyperparameters to implement the above-mentioned advanced CD methods for comparative experiments, using the same number of rounds during training and ensuring convergence.
4.3.2. Experimental results on the dataset
We have compared the results of our method with those of state-of-the-art CD methods and present their evaluation metrics in . The data indicate that our method is superior for every metric. We analyzed the data according to our main metrics: F1 and IoU. Compared with the current second-highest advanced method, our GMTS leads by 1.17%/1.97%, 2.17%/3.68%, and 2.48%/3.76% on the LEVIR-CD, WHU-CD, and GZ-CD datasets respectively. The methods based on TR generally performed well, and the final test data were all relatively good. However, the method only relies on CNN and the attention mechanism exhibit outstanding performance and obvious surpassing for some datasets.
Table 1. Comparison results on the three CD test sets.
GMTS has significant advantages as a TR-based CD method. First, our backbone network has a simpler structure than current state-of-the-art methods. Relying on the DO-Conv block with very low overhead and the graph convolution block with a wide field of view, it achieves better results than large networks, such as ResNet or Unet. Second, the HiLo and MPPT modules help us to model local and global information, compensating for the multi-scale information of the large iterative network we lack and maintaining the overhead low.
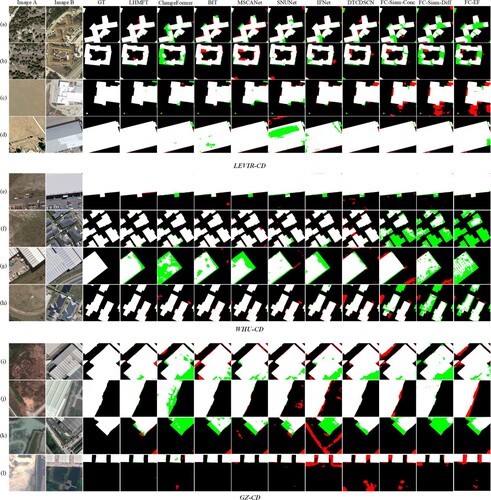
To better compare the differences between our method and the advanced methods, we show the visualization results of each method in Figure . To better compare the differences between our predicted map and the ground truth, we used different colors to represent TP (white), TN (black), FP (red), and FN (green). Based on the visualization results, we can observe the advantages of our method. For example, in the LEVIR-CD dataset, compared with the other methods in (b) image processing, we rarely have green parts. The SNUNet method, which also performs well, exhibits a clear disadvantage in (d), with too many green parts. Therefore, our method exhibits an overall good performance on the LEVIR-CD dataset. In the WHU-CD dataset, the part below (e) is easy to ignore. Most CD methods cannot be accurately identified, but our method can. In (g) and ( h), we again have very little noise. In the GZ-CD dataset, we can see from (i) that our method handles the details of building edges better, and we have fewer red and green parts than the other methods. In (k), although most methods are not particularly effective, our method can still accurately divide the target area. From the above analysis of the visualization results, it can be seen that our method has an advantage over other advanced methods.
Figure 8. Visualization results on the LEVIR-CD, WHU-CD, and GZ-CD datasets. White, black, red, and green represent true positives, true negatives, false positives, and false negatives.
4.3.3. Model efficiency and performance
In this section, we test our method in comparison with the current advanced methods in terms of the number of parameters and FLOPs. For a more accurate comparison, we show the test results of each method as well as the number of parameters and FLOPs in . Compared with current advanced methods, our GMTS guarantees good performance when the number of parameters is relatively low.
Table 2. Parameters and FLOPs results of all methods for the three data sets, and F1 and IoU values for each data set.
4.4. Ablation experiments
To verify the effectiveness of each module in our method and the improvement in network performance, we performed a pruning test on five modules, including the graph convolution block of the hybrid backbone, HiLo attention, MPPT, FPT, and TR modules. The composition of the hybrid backbone was also tested, as shown in .
Table 3. Ablation experiments on GMTS on five modules: backbone graph convolution, HiLo attention, MPPT, FPT, and TR.
Graph convolution. Here we delete the graph convolution block of the mixed backbone and only keep the DO-COnv block for ablation experiments. The experimental results indicate that, after the lack of the graph convolution block, there is a decline in each data set.
Hybrid backbone structure. To explore the effective structure of the hybrid approach, we executed the graph convolution and DO-Conv blocks in parallel and sequentially during the experiments. Experiments show that the sequential execution of the backbone structure is not as effective as parallel execution in terms of feature extraction. In addition, to test the efficiency of DO-Conv, we conducted ablation experiments using conventional convolution instead of DO-Conv, as shown in . do-Conv traded lower computational effort and better performance with a small parameter cost.
Table 4. Performance comparison about the hybrid backbone in GMTS using DO-Conv and using traditional convolution.
HiLo attention module. We removed this module to set up the ablation experiments. The results show that the ability to extract features decreases without the HiLo attention module.
MPPT module. We removed this module to set up the ablation experiments. The results show that for modules related to global modeling, the impact on the overall network is relatively large, and the degree of decline is more obvious after the absence.
FPT module. To prove that in the MPPT module, the FPT module can enhance the feature expression of the pooled multi-scale information, we deleted this part to set up the ablation experiment. The results show that the FPT module enhances the modeling of multi-scale pooling results.
TR module. As a key module of global context modeling, we deleted this module to set up ablation experiments. The lack of the TR module has a more obvious impact overall, and the value drops the most.
4.5. Parameter analysis
In the MPPT module, we modified the kernel size to different scales for the parametric analysis, as shown in .
Table 5. Parameter analysis for different kernel sizes in the MPPT module.
For the token size used by the TR module, we performed a parametric analysis. The token sizes were set to 2, 4, 8, and 16, as shown in .
Table 6. Experiments with different token sizes in the semantic tokenizer.
4.6. Network visualization
To better describe the important stages of GMTS, we visualized the intermediate layers of our network, as shown in . The visualization part includes features extracted from the hybrid backbone, multi-scale fusion features, and TR after modeling features, and we also added class-activation mapping.
Figure 9. Visualization results for each part of the network. These include features extracted from the hybrid backbone, multi-scale fusion features, final features for TR modeling, and class activation mapping.
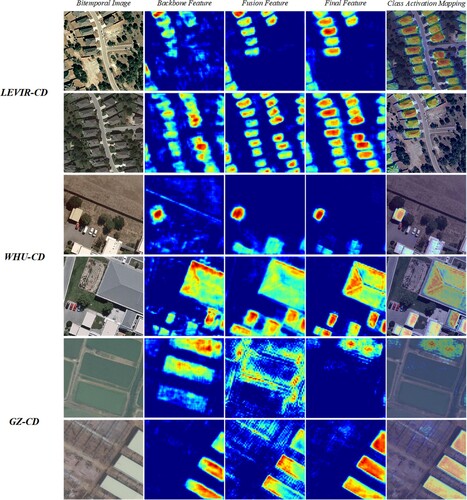
Through the results, we can easily find that our square can gradually narrow the range of changing objects, and as the network deepens, it can better distinguish useful features from useless features.
5. Conclusion
In this study, we propose a GNN-based multi-scale transformer Siamese network for remote sensing image change detection (GMTS). We developed use a new lightweight hybrid network to extract features and used HiLo attention to combine high/low frequency features to generate more complete detailed features. Subsequently, we utilize the MPPT module to extract global features to guide global modeling. Finally, we leveraged the context-modeling capabilities of the TR in the spatiotemporal domain to optimize the extracted features. Several experiments have proven the effectiveness of our model (test set F1-scores of LEVIR-CD/WHU-CD/GZ-CD of 91.57%/92.65%/86.12%). The proposed method exhibited very good performance in terms of efficiency and complexity. Compared to current state-of-the-art CD methods, our method shows excellent performance in terms of efficiency and accuracy.
Disclosure statement
No potential conflict of interest was reported by the author(s).
Data availability statement
Data available on request from the authors.
Additional information
Funding
References
- Bandara, Wele Gedara Chaminda, and Vishal M. Patel. 2022. “A Transformer-Based Siamese Network for Change Detection.” arXiv preprint arXiv:2201.01293.
- Cao, Jinming, Yangyan Li, Mingchao Sun, Ying Chen, Dani Lischinski, Daniel Cohen-Or, Baoquan Chen, and Changhe Tu. 2022. “Do-Conv: Depthwise Over-Parameterized Convolutional Layer.” IEEE Transactions on Image Processing 31: 3726–3736. doi:10.1109/TIP.2022.3175432.
- Chen, Hao, Zipeng Qi, and Zhenwei Shi. 2021. “Remote Sensing Image Change Detection with Transformers.” IEEE Transactions on Geoscience and Remote Sensing 60: 1–14. doi:10.1109/TGRS.2020.3034752.
- Chen, Hao, and Zhenwei Shi. 2020. “A Spatial-Temporal Attention-based Method and a New Dataset for Remote Sensing Image Change Detection.” Remote Sensing 12 (10): 1662. doi:10.3390/rs12101662.
- Chen, Jie, Ziyang Yuan, Jian Peng, Li Chen, Haozhe Huang, Jiawei Zhu, Yu Liu, and Haifeng Li. 2020. “DASNet: Dual Attentive Fully Convolutional Siamese Networks for Change Detection in High-resolution Satellite Images.” IEEE Journal of Selected Topics in Applied Earth Observations and Remote Sensing 14: 1194–1206. doi:10.1109/JSTARS.4609443.
- Cheng, Hongquan, Huayi Wu, Jie Zheng, Kunlun Qi, and Wenxuan Liu. 2021. “A Hierarchical Self-Attention Augmented Laplacian Pyramid Expanding Network for Change Detection in High-resolution Remote Sensing Images.” ISPRS Journal of Photogrammetry and Remote Sensing 182: 52–66. doi:10.1016/j.isprsjprs.2021.10.001.
- Daudt, Rodrigo Caye, Bertr Le Saux, and Alexandre Boulch. 2018. “Fully Convolutional Siamese Networks for Change Detection.” In 2018 25th IEEE International Conference on Image Processing (ICIP), 4063–4067. IEEE.
- De Bem, Pablo Pozzobon, Osmar Abílio de Carvalho Junior, Renato Fontes Guimarães, and Roberto Arnaldo Trancoso Gomes. 2020. “Change Detection of Deforestation in the Brazilian Amazon Using Landsat Data and Convolutional Neural Networks.” Remote Sensing 12 (6): 901. doi:10.3390/rs12060901.
- Diakogiannis, Foivos I., François Waldner, and Peter Caccetta. 2021. “Looking for Change? Roll the Dice and Demand Attention.” Remote Sensing 13 (18): 3707. doi:10.3390/rs13183707.
- Elmahdy, Samy Ismail, and Mohamed Mostafa Mohamed. 2018. “Monitoring and Analysing the Emirate of Dubai's Land Use/land Cover Changes: An Integrated, Low-cost Remote Sensing Approach.” International Journal of Digital Earth 11 (11): 1132–1150. doi:10.1080/17538947.2017.1379563.
- Fang, Sheng, Kaiyu Li, Jinyuan Shao, and Zhe Li. 2021. “SNUNet-CD: A Densely Connected Siamese Network for Change Detection of VHR Images.” IEEE Geoscience and Remote Sensing Letters 19: 1–5. doi:10.1109/LGRS.2021.3056416.
- Gong, Maoguo, Yuelei Yang, Tao Zhan, Xudong Niu, and Shuwei Li. 2019. “A Generative Discriminatory Classified Network for Change Detection in Multispectral Imagery.” IEEE Journal of Selected Topics in Applied Earth Observations and Remote Sensing 12 (1): 321–333. doi:10.1109/JSTARS.4609443.
- Han, Kai, Yunhe Wang, Jianyuan Guo, Yehui Tang, and Enhua Wu. 2022. “Vision GNN: An Image is Worth Graph of Nodes.” arXiv preprint arXiv:2206.00272.
- Hendrycks, Dan, and Kevin Gimpel. 2016. “Gaussian Error Linear Units (Gelus).” arXiv preprint arXiv:1606.08415.
- Iino, Shota, Riho Ito, Kento Doi, Tomoyuki Imaizumi, and Shuhei Hikosaka. 2017. “Generating High-Accuracy Urban Distribution Map for Short-Term Change Monitoring Based on Convolutional Neural Network by Utilizing SAR Imagery.” In Earth Resources and Environmental Remote Sensing/GIS Applications VIII, Vol. 10428, 11–21. SPIE.
- Ji, Shunping, Shiqing Wei, and Meng Lu. 2018. “Fully Convolutional Networks for Multisource Building Extraction From An Open Aerial and Satellite Imagery Data Set.” IEEE Transactions on Geoscience and Remote Sensing 57 (1): 574–586. doi:10.1109/TGRS.2018.2858817.
- Jiang, Huiwei, Xiangyun Hu, Kun Li, Jinming Zhang, Jinqi Gong, and Mi Zhang. 2020. “PGA-SiamNet: Pyramid Feature-based Attention-guided Siamese Network for Remote Sensing Orthoimagery Building Change Detection.” Remote Sensing 12 (3): 484. doi:10.3390/rs12030484.
- Li, Sike. 2018. “Change Detection: How Has Urban Expansion in Buenos Aires Metropolitan Region Affected Croplands.” International Journal of Digital Earth 11 (2): 195–211. doi:10.1080/17538947.2017.1311954.
- Li, Shujun, and Lianzhi Huo. 2021. “Remote Sensing Image Change Detection Based on Fully Convolutional Network With Pyramid Attention.” In 2021 IEEE International Geoscience and Remote Sensing Symposium IGARSS, 4352–4355. IEEE.
- Liu, Mengxi, Zhuoqun Chai, Haojun Deng, and Rong Liu. 2022. “A CNN-Transformer Network with Multi-scale Context Aggregation for Fine-grained Cropland Change Detection.” IEEE Journal of Selected Topics in Applied Earth Observations and Remote Sensing 15: 4297–4306. doi:10.1109/JSTARS.2022.3177235.
- Liu, Yi, Chao Pang, Zongqian Zhan, Xiaomeng Zhang, and Xue Yang. 2020. “Building Change Detection for Remote Sensing Images Using a Dual-Task Constrained Deep Siamese Convolutional Network Model.” IEEE Geoscience and Remote Sensing Letters 18 (5): 811–815. doi:10.1109/LGRS.2020.2988032.
- Liu, Meng, Hong Zhang, Chao Wang, Yixian Tang, Bo Zhang, Fan Wu, Tao Wu, and Xi Chen. 2015. “Polarimetric Synthetic Aperture Radar Change Detection for Specific Land Cover Types.” International Journal of Digital Earth 8 (4): 334–344. doi:10.1080/17538947.2013.872702.
- Mucher, C. A., K. T. Steinnocher, F. P. Kressler, and C Heunks. 2000. “Land Cover Characterization and Change Detection for Environmental Monitoring of Pan-Europe.” International Journal of Remote Sensing 21 (6-7): 1159–1181. doi:10.1080/014311600210128.
- Pan, Zizheng, Jianfei Cai, and Bohan Zhuang. 2022. “Fast Vision Transformers With HiLo Attention.” arXiv preprint arXiv:2205.13213.
- Park, Namuk, and Songkuk Kim. 2022. “How Do Vision Transformers Work?” arXiv preprint arXiv:2202.06709.
- Peng, Daifeng, Lorenzo Bruzzone, Yongjun Zhang, Haiyan Guan, Haiyong Ding, and Xu Huang. 2020. “SemiCDNet: A Semisupervised Convolutional Neural Network for Change Detection in High Resolution Remote-Sensing Images.” IEEE Transactions on Geoscience and Remote Sensing 59 (7): 5891–5906. doi:10.1109/TGRS.2020.3011913.
- Peng, Bo, Zonglin Meng, Qunying Huang, and Caixia Wang. 2019. “Patch Similarity Convolutional Neural Network for Urban Flood Extent Mapping Using Bi-temporal Satellite Multispectral Imagery.” Remote Sensing 11 (21): 2492. doi:10.3390/rs11212492.
- Peng, Xueli, Ruofei Zhong, Zhen Li, and Qingyang Li. 2020. “Optical Remote Sensing Image Change Detection Based on Attention Mechanism and Image Difference.” IEEE Transactions on Geoscience and Remote Sensing 59 (9): 7296–7307. doi:10.1109/TGRS.2020.3033009.
- Ronneberger, Olaf, Philipp Fischer, and Thomas Brox. 2015. “U-net: Convolutional Networks for Biomedical Image Segmentation.” In International Conference on Medical image computing and computer-assisted intervention, 234–241. Springer.
- Song, Kaiqiang, Fengzhi Cui, and Jie Jiang. 2021. “An Efficient Lightweight Neural Network for Remote Sensing Image Change Detection.” Remote Sensing 13 (24): 5152. doi:10.3390/rs13245152.
- Song, Xinyang, Zhen Hua, and Jinjiang Li. 2022a. “PSTNet: Progressive Sampling Transformer Network for Remote Sensing Image Change Detection.” IEEE Journal of Selected Topics in Applied Earth Observations and Remote Sensing 15: 8442–8455. doi:10.1109/JSTARS.2022.3204191.
- Song, Xinyang, Zhen Hua, and Jinjiang Li. 2022b. “Remote Sensing Image Change Detection Transformer Network Based on Dual-Feature Mixed Attention.” IEEE Transactions on Geoscience and Remote Sensing 60: 1–16. doi:10.1109/TGRS.2022.3209972.
- Song, Kaiqiang, and Jie Jiang. 2021. “AGCDetNet: An Attention-Guided Network for Building Change Detection in High-resolution Remote Sensing Images.” IEEE Journal of Selected Topics in Applied Earth Observations and Remote Sensing 14: 4816–4831. doi:10.1109/JSTARS.2021.3077545.
- Stylianidis, Efstratios, Devrim Akca, Daniela Poli, Martin Hofer, Armin Gruen, Victor Sanchez Martin, and Konstantinos Smagas, et al. 2020. “FORSAT: A 3D Forest Monitoring System for Cover Mapping and Volumetric 3D Change Detection.” International Journal of Digital Earth 13 (8): 854–885. doi:10.1080/17538947.2019.1585975.
- Vaswani, Ashish, Noam Shazeer, Niki Parmar, Jakob Uszkoreit, Llion Jones, Aidan N. Gomez, Łukasz Kaiser, and Illia Polosukhin. 2017. “Attention is All You Need.” Advances in Neural Information Processing Systems 30: 6000–6010. doi:10.48550/arXiv.1706.03762.
- Voigtman, Edward, and James D. Winefordner. 1986. “Low-Pass Filters for Signal Averaging.” Review of Scientific Instruments 57 (5): 957–966. doi:10.1063/1.1138645.
- Wang, Rongfang, Fan Ding, Jia-Wei Chen, Bo Liu, Jie Zhang, and Licheng Jiao. 2020. “SAR Image Change Detection Method via a Pyramid Pooling Convolutional Neural Network.” In IGARSS 2020-2020 IEEE International Geoscience and Remote Sensing Symposium, 312–315. IEEE.
- Wang, Xiaolong, Ross Girshick, Abhinav Gupta, and Kaiming He. 2018. “Non-Local Neural Networks.” In Proceedings of the IEEE Conference on Computer Vision and Pattern Recognition, 7794–7803.
- Yang, Zhilin, Zihang Dai, Ruslan Salakhutdinov, and William W. Cohen. 2017. “Breaking the Softmax Bottleneck: A High-Rank RNN Language Model.” arXiv preprint arXiv:1711.03953.
- Yang, Jianwei, Chunyuan Li, Pengchuan Zhang, Xiyang Dai, Bin Xiao, Lu Yuan, and Jianfeng Gao. 2021. “Focal Self-Attention for Local-Global Interactions in Vision Transformers.” arXiv preprint arXiv:2107.00641.
- Yuan, Panli, Qingzhan Zhao, Xingbiao Zhao, Xuewen Wang, Xuefeng Long, and Yuchen Zheng. 2022. “A Transformer-based Siamese Network and An Open Optical Dataset for Semantic Change Detection of Remote Sensing Images.” International Journal of Digital Earth 15 (1): 1506–1525. doi:10.1080/17538947.2022.2111470.
- Zhang, Min, and Wenzhong Shi. 2020. “A Feature Difference Convolutional Neural Network-Based Change Detection Method.” IEEE Transactions on Geoscience and Remote Sensing 58 (10): 7232–7246. doi:10.1109/TGRS.36.
- Zhang, Cui, Liejun Wang, Shuli Cheng, and Yongming Li. 2022. “SwinSUNet: Pure Transformer Network for Remote Sensing Image Change Detection.” IEEE Transactions on Geoscience and Remote Sensing60: 1–13. doi:10.1109/TGRS.2022.3160007.
- Zhang, Yuxiang, Ke Wu, Bo Du, and Xiangyun Hu. 2019. “Multitask Learning-based Reliability Analysis for Hyperspectral Target Detection.” IEEE Journal of Selected Topics in Applied Earth Observations and Remote Sensing 12 (7): 2135–2147. doi:10.1109/JSTARS.4609443.
- Zhang, Chenxiao, Peng Yue, Deodato Tapete, Liangcun Jiang, Boyi Shangguan, Li Huang, and Guangchao Liu. 2020. “A Deeply Supervised Image Fusion Network for Change Detection in High Resolution Bi-temporal Remote Sensing Images.” ISPRS Journal of Photogrammetry and Remote Sensing 166: 183–200. doi:10.1016/j.isprsjprs.2020.06.003.
- Zhao, Wenzhi, Lichao Mou, Jiage Chen, Yanchen Bo, and William J. Emery. 2019. “Incorporating Metric Learning and Adversarial Network for Seasonal Invariant Change Detection.” IEEE Transactions on Geoscience and Remote Sensing 58 (4): 2720–2731. doi:10.1109/TGRS.36.
- Zhou, Yuan, and Xiangrui Li. 2020. “Unsupervised Self-Training Algorithm Based on Deep Learning for Optical Aerial Images Change Detection.” arXiv preprint arXiv:2010.07469.