
 ?Mathematical formulae have been encoded as MathML and are displayed in this HTML version using MathJax in order to improve their display. Uncheck the box to turn MathJax off. This feature requires Javascript. Click on a formula to zoom.
ABSTRACT
In this research, we analyzed the delivery service areas of restaurants, customer satisfaction, and restaurant sales of urban restaurants during the COVID-19 pandemic. We obtained the datasets on food ordering options and restaurant rankings based on Google Maps, Open Street Map, and widely known online food order applications in Iran. Based on this analysis we further modeled suitable areas for future extension of restaurants. We analyzed the online food order data of restaurants’ sales and food delivery reports for 1050 restaurants in the city of Tabriz. We collected and analyzed data on the restaurant locations, the number of food orders for each restaurant, and the number of customers and their locations. Our results revealed that the spatial dimension of the newly emerging food delivery areas is of utmost importance for the success of restaurants. This indicates that an optimal location is not longer only dependent on factors like population density and competitors in the direct vicinity but on the services density even from more distant competitors. The results indicate that an optimized spatial distribution of the restaurants together with efficient quality in services can contribute to optimistic urban development.
1. Introduction
Urban restaurants as labor-intensive services have been discussed in the literature for decades as location-based services. Due to competition avoidance the restaurants are equally distributet as net pattern. With market areas particularly dependent on population density restaurants in rural areas would serve larger market areas as in densily-populated urban areas (Braun and Schulz Citation2012; Dock, Song, and Lu Citation2015). Thus socio-economic aspects like population density, customer base and availvbale income of residents are of utmost importance for resrataurant’s success in terms of their external environment (Mandabach et al. Citation2011; Agarwal and Dahm Citation2015). This has, however, been challengedsince the outbreak of the COVID-19 pandemic, which affected most societal sectors and resulted in a sharp decrease in all economic activities (Madeira, Palrão, and Sofia Mendes Citation2021; Sha et al. Citation2021). The COVID-19 pandemic and its respective lockdowns had significant impacts on the hospitality industry, which relies on tourism, events, and gathering for meals outdoors. The restaurant industry was one of the hardest hit by the lockdowns with orders to stay at home and limit societal interactions to minimize the spread of COVID-19 (Lim Citation2021; Gursoy and Chi Citation2020; Wang et al. Citation2023).
It is well understood that lockdowns may significantly affect business. When lockdowns occur, many, if not all, business-to-business marketing businesses struggle (Lim Citation2023). The pandemic also affected residents’ lifestyles and, among other factors, citizens’ dining behavior. Particularly lock-downs and a restricted accessibility of restaurants with regard to peoples’ COVID-19 vaccination and/or testing status have given rise to online food delivery, particularly in the field of gastronomy. While food retail was considered as basic need and, thus, was only modestly affected by restrictions of accessibility, gastronomy was one most affected sectors by COVID-19 containment measures (Madeira, Palrão, and Sofia Mendes Citation2021). This gave rise to the already increasing online delivery within gastronomy. Furthermore, restaurants increasingly had to adapt their business models. Considering online food delivery, modifying, updating, pivoting, and innovating their operations in an attempt to meet the current needs of a changing customer and adapting customer experience in the time of COVID-19 and the future will be crucial (Gavilan et al. Citation2021). This has two implications: From an academic perspective the perception of restaurants as a location-based services with space as the mere location of businesses has to be abandoned in favor of a more complex assemsment of space. Perticularly restaurants’ delivery area will be a crucial success factor for businesses, which might change the geography of restaurants. Their location decision might not only be dependent on the avoidance of competition and the population density in the vincinity, but on a location that might serve a large quantity of customer by food delivery.
From a practical view point restaurants have to adapt their marketing strategies. Restaurant managers and stakeholders need to focus more than ever on spatial marketing capabilities and the importance of location in their decisions (Li and Hecht Citation2021). Here, spatial data can be applied in the process of planning and implementing marketing decisions (Dušek Citation2020). Combining spatial information with customer and sales information can be used to estimate the status of the markets in different locations with various location-based applications (Yarosh Citation2019(. Furthermore, the related information on customer decisions and demand assist manufacturers and decision-makers in devising future economic strategies (Kellner, Otto, and Busch Citation2013). Customer engagement is critical in a successful business in the 21 century based on its potential to increase consumer satisfaction and business profitability (Lim et al. Citation2022a, Citation2022b). In this context, GIScience, as a multidisciplinary and multiparadigmatic field of science (Goodchild Citation1999; Blaschke and Merschdorf Citation2014) has been supporting the citizens by providing a variety of tools and methods for location-based services such as Geomarketing. Such tools allow us to identify and analyse spatiotemporal patterns which can then be leveraged by the citizens, decision-makers, and authorities for a variety of applications (e.g. optimal choices, business planning, and programs).
GIScience is already considered an efficient approach for location-based analysis, trend assessments, and identifying spatial patterns involving a variety of variables. GIScience also offers the means to analyze data quality and accuracy. Business and economic utilities depend on reliable data, cutting-edge technology, and science-based decision support systems to achieve their business goals (e.g. in the restaurant industry) (Kamil et al. Citation2021). It has been claimed that the ability of GIScience to incorporate data from disparate sources, interpret it, and present map-based knowledge to help marketing-specific decisions sets it apart from other technologies (Omidipoor, Jelokhani-Niaraki, and Samany Citation2019). Recent progress in GIScience and communication technologies and their integration resulted a new approches in restaurant industry services. As one the main aspect, online food ordering and delivery services which is known as online meal delivery services and referred to as such henceforth, have received significant attention and interest over the past years (Cervigni et al. Citation2020; Keeble et al. Citation2021). Geomarketing approaches can be applied to marketing if the market is considered in terms of spatial aspects and not just as the statistical behavior of individuals (Libório et al. Citation2020). In this context, ‘Geomarketing’ can be understood as an approach that leverages GIS and GIScience capabilities. Geomarketing builds on GIS-enabled location-based services and can be implemented for marketing communication, pricing, market segmentation, and geographical targeting. By considering the past and present spatial demographic dataset, GIS-based spatiotemporal analysis can be used to develop an efficient Geomarketing model for a variety of applications, such as business development, customer satisfaction, as well as identifying the local markets and their structure using the location-based capabilities of GIScience (Zhai et al. Citation2015;Touzani and Van Buskirk Citation2016). GIS applications have been employed in various businesses to generate spatial business models to evaluate the customers and competitors not only from the financial viewpoint but also in terms of spatial patterns and behaviors (Habibpour, Feiizadeh, and Jabarzadeh Citation2021). Geomarketing techniques leads to support the identification of optimal new places in facility allocations (e.g. opening new factories, shops, restaurants, or expanding a chain of cafes). Geomarketing has become increasingly relevant for many retail- and service-based businesses (Cliquet Citation2021). Geomarketing can thus be used to determine the best location to establish new facilities based on where managers can maximize the products and services provided (Briozo and Musetti Citation2015). Geomarketing and the location-based services and capabilities of GIScience have been applied extensively in the restaurant industry in recent years. The number of GIS-based apps that give the location of restaurants, help customers navigate to them, and allow them to make online food orders and reservations has significantly increased.
This research, therefore, investigates the online food delivery strategy of restaurant industry in one major city in Iran where very detailed data for a majority of the restaurants as well as detailed data on traffic, land use, demography etc are available. This study was made possible by the high data availability due to the popularity of smartphones and location-based services in Iranian cities, where location-based applications and programs have greatly gained in popularity. A popular application is to enable food orders from home, both for take away and for delivery. The COVID-19 pandemic intensified this trend. An increasing percentage of the population now use location-based searches (e.g. Google Map, Snap food etc.) when planning to buy or online order food from restaurants. According to Google reports (Google Citation2020), during the year 2020 since the beginning of the COVID-19 pandemic, Google has received many searches about ‘what restaurants are open’. According to this report, 81% of customers searched for a restaurant from mobile devices, and 91% searched via web-based browsers. In addition, more than 80% of the customers carried out local searches. The search data from Google shows how searches have changed over the course of a year after the outbreak of the pandemic. The number of online food orders and food deliveries increased significantly. In addition, search interest for ‘food delivery’-related questions increased by 100% (Google Citation2020). A review of the literature indicated that most of the previous studies focused on Geomarketing analytics based on limited factors, such as service area and customer satisfaction, and had limited spatial and temporal coverage (Agarwal and Dahm Citation2015; Zhai et al. Citation2015; Zuluaga and Escobar Citation2017; Vos and Meijers Citation2019; Gursoy and Chi Citation2020; Wang et al. Citation2023). Therefore, the primary research question in this study is ‘what are the major spatial–temporal Geomarketing patterns of the urban restaurants in the neighborhood areas and how can these patterns be employed for successful future expansion?’. In following this research question, the major goal of this study is to explore restaurants’ online food delivery perfomance by analyzing the spatial deminesion of their delivery areas and the customer satisfaction based on custumers’ reviews. We will show that online food delivery massively increases the restaurants’ coverage of the city, by contrasting the accessibility of rastaurants (1) within the ‘classal’ location-based scenario and (2) within a online delivery scenario. Finally, we will draw conclusion by means of identifying subtitle areas for future extension of restaurants baded on the latter scenario. We will achieve this by applying integrated GIScinces and geomarkting approaches, based on quantitative GIS-based data.
2. Study area
The study area is Tabriz city, which is one of the largest cities in Iran, with about 1.8 million inhabitants (Iranian Census Centre Citation2016). Located in the northwest of the country (), it is one of the most modern metropolitans in Iran. Historically, Tabriz has been an important trade center on the silk road for decades. Nowadays, it is nationally significant as an industrial, economic, cultural, political, commercial, and educational center (Rezaei et al. Citation2020). Due to its heavy industrial activities as well as tourism and commercial significance, the city increasingly developed into a multicultural city (Pourmoradian Citation2018; Ghasemi, Karimzadeh, and Feizizadeh Citation2021). Thus, the restaurant industry in Tabriz is also well developed. According to the Iranian Ministry of Health and Medical Education (MOHME Citation2021), it was a prominent high-risk city since the beginning of the pandemic. Since the outbreak of COVID-19, several phases of lockdown were implemented in Tabriz, which significantly affected the economy of the city and, in particular, the restaurant industry.
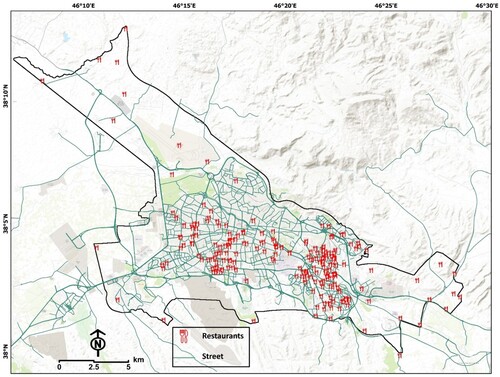
Figure 1. The geographic location of the urban restaurants in Tabriz.
3. Dataset
We used a variety of datasets to achieve our research objectives. According to a recent report of the Municipality of Tabriz (2021), there are approximately 1250 restaurants in the city. Our evaluation through food order applications and list of restaurants indicated that almost 75–85% of these restaurants were offering online services such as ‘take out’ and ‘food delivery’. Thus, based on the data available from Google Maps and Open Street Map (OSM), as well as widely known online food order applications in Iran a total of 1050 restaurants were identified and selected to be analyzed in this study. We obtained data on the location of restaurants, the number of food orders for each restaurant, and the anonymized customer addresses from these applications for the year 2020. To study the services of the restaurants with urban indicators, we considered different restaurant, demographic, land use and traffic characteristics that are explained in the following. The respective datasets used to assess the characteristics are shown in . In addition, the GIS format of the urban land use map and urban road network at a scale of 1/2000 were obtained from the Municipality of Tabriz. We also received a monthly traffic data were from Tabriz traffic police which added as attribute data for the urban road networks data. The land value and property data were also obtained from the tax department of Tabriz for the year 2020 as a GIS dataset which also employed to carry out the research objectives.
Table 1. List of datasets and the initial resources.
3.1. Restaurant characteristics
The culture of ordering food using various food order applications has recently become prevalent in many cities around the world (Song, Jeon, and Jeon Citation2017; Park and Sin Citation2018). Such applications for smartphones and desktop computers make it easy for most members of society to order food or to take-aways. Such apps (e.g. Trip Advisor,Snap food, Changal and etc) collect restaurant properties and customer feedback data in a database. In addition, such applications offer the option for customers to express their satisfaction and to rank restaurants. In many parts of the world, most food delivery services are dominated by small companies. With food delivery now also being offered by luxury hotels and high ranking restaurants, the food delivery market is adaptable and diverse (Kim and Kim Citation2019). The food delivery and take-away apps allow customers to identify the best or most suitable restaurant in a particular neighborhood or target area. In our study, we extracted three types of restaurant data from these applications: type of delivery service, customer satisfaction, and restaurant sales information (based on the rank of each restaurant). To collect the restaurant characteristics dataset, we identified all restaurants that were available on Google Maps and food order applications. We then developed the point-based GIS layer based on the address and location of each restaurant. We obtained the number of food orders and deliveries, as well as the customer satisfaction score from food order apps. This information was added as attribute data for each restaurant and formed the basis of the evaluation model. In addition, since the customer addresses were also available in the food order app, we were able to map the service area of each restaurant. This information was obtained for 1050 out of the 1250 restaurants based on the availability of restaurant information on Google Maps and food order apps.
3.2. Demography characteristics
A rapid population increase in cities can often cause problems for resource management, service allocation, and public health (Phumvichitkarn Citation2020). Conversely, areas with dense populations are often prioritized for economic development measures and establishing additional facilities (e.g. new restaurants). From an economic perspective, population density is an important factor for economic growth (Mohamadzadeh et al. Citation2020) and may directly affect the restaurant industry. A high number of restaurants in major cities may also encourage competition based on product features rather than price, resulting in more diversity. The effect of diversity on demand is straightforward: when a group of people with similar tastes reaches a particular size, product variety within a city expands. This spatial correlation between population density and demands for restaurants has been empirically confirmed by previous studies (Vos and Meijers Citation2019). Thus, for our study of the city of Tabriz, we analyzed the respective demographic characteristics (e.g. population density, education status and etc) and assessed spatial correlations. We used the latest census 2016 data on the urban parcel level from the Iranian statistics center provided by the Municipality of Tabriz. These data include age, gender, education and employment information.
3.3. Land characteristics
Economic development is clearly related to urban structure and urban spatial development. Businesses must compete to grow with the environment and its economic capacity (Utomo, Rahmawati, and Sari Citation2021). In the context of the restaurant industry, urban land use patterns may significantly impact the development of a successful restaurant business. Urban neighborhood characteristics (e.g. residential use, trade, tourism) directly affect the urban restaurant industry. In addition, land value is an indicator that may significantly influence the restaurant industry and affects the availability of restaurants. Land use data can also be used to characterize the customers to some degree, as has been demonstrated in previous studies. We selected urban land use, property and land value data and combined them with tax information that we obtained from the tax department of Tabriz for the year 2020. It has to be indicated that the land value detrmined based on the local tax value for each area of the city which is basically determined by the tax department of city using the number of trade in each area as well as the computed local values.
3.4. Urban road traffic dataset
The daily movement of humans and automobiles in urban environments generate huge amounts of valuable data, and traffic is considered to be a critical and often limiting dimension for planning sustainable cities, particularly in developing countries or emerging economies such as Iran (Feizizadeh et al. Citation2022). Traffic is also an important indicator for the restaurant industry. The number of customers may decline with increased travel times to restaurants and due to heavily congested routes. Customers tend to prefer shorter and less time-consuming routes and may choose another restaurant if the required travel time exceeds certain thresholds. The study of human activities in space and time has been a hot topic in transportation research (Chen et al. Citation2011). One of the most important elements in the delivery of food packages from the origin (restaurant) to the customers is considering the status of the urban transportation network and the traffic situation. Therefore, we used traffic data as one of the related criteria for indictors. In addition, as we aimed to identify suitable areas for possible future restaurants developments, both the time and distance that must be overcome for customers to reach restaurants were evaluated based on the urban road traffic dataset.
4. Methodology
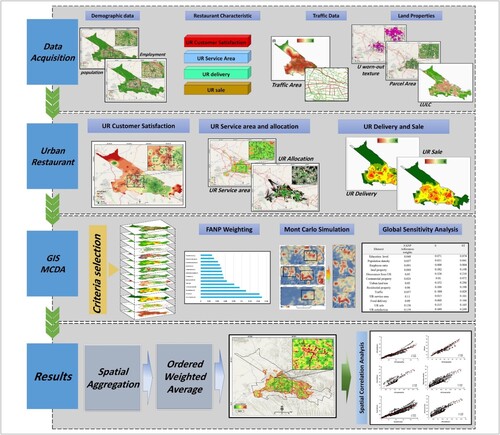
In this research, we employed an integrated GIS decision rules to analyse the spatial dimension of restaurants and their application of online food delivery. We used an ensemble approach of marketing science and decision-making in a management sptial and location based geographic components. GIS models can be used to integrate data from various sources with a georeferenced database to perform various and complicated analyzes (Fan and Collischonn Citation2014; Dolzhenko Citation2017). GIS is, therefore, suitable for the accurate spatial analysis needed for this type of market analysis (Fan and Collischonn Citation2014; Peñarubia-Zaragoza, Simancas-Cruz, and Forgione-Martín Citation2019). We also evaluated and identified appropriate areas for new restaurants in the city of Tabriz. Therefore, we applied a GIS-based multi-criteria decision analysis (MCDA) using the causal indicators we identified (). We used data from the following four categories: demography, restaurant characteristics, urban road traffic indicators, and land properties. The indictors were processed, and 13 sub-criteria were identified and analyzed using the GIS-MCDA. depicts the main aspects of the research methodology.
Figure 2. The main steps of reserch research methodology.
4.1. Functionality assessment and customer satisfaction
The obtained data show that, as a result of several waves of home quarantine and the associated limitation of restaurants to ‘take out’ services, the number of take away and delivery orders using various apps has increased significantly during the COVID-19 pandemic. We prepared the input data for spatial pattern analysis and collected the customer satisfaction rates of all restaurants from Google Maps/OSM and food order apps, including Snap Food, Diba Food, Reyhoon, Gwarinpa and Changal. These satisfaction records include information on the food quality, prices, and delivery satisfaction and allow the customers to rank each restaurant from 1 (min) to 5 (max) scores. Based on the individual ranks, each restaurant receives a specific overall score between 1 and 5 based on customer satisfaction. In addition, these applications also record the after-sales feedback of customers as text messages. We collected all the ranking data and text messages and added them as attribute data for the urban restaurants.
4.2. Service area and allocation
Spatial location and neighborhood can be considered as critical indicator for success business in urban restaurant industry (Motoyam and Usher Citation2021). Facility location optimization includes the selection of a subset of candidate sites and allocating demand to chosen locations (North and Miller Citation2017). Optimization modeling techniques have been developed to address a wide variety of location-allocation problems (Laporte, Nickel, and da Gama Citation2015). In order to allocate services in a geographical area, it is necessary to evaluate the demand and supply of the services. As mentioned, the food order apps store individual transactions, including the address and identity of the customers for food delivery. We obtained the food order data for each restaurant along with the customers’ addresses (without identity information) for the year 2020. We calculated the shortest distance and the shortest possible time for customers to reach an restaurants and, likewise, the shortest and fastest route for a delivery person to reach customers. Then, service areas for each restaurants could be computed based on ranges of both distance and time required for the in-time delivery of food to customers. In addition, the location of customers extracted from population density and the number of food orders recorded by apps as customer location dataset (96,735 points) were used as the demand while the locations of the analyzed restaurants (1050 points) served as the supply of service information. Accordingly, we employed the ESRI Network Analyst extension and Service Allocation tools to compute the customers’ access to the restaurants. According to the time factor (mean time is 15 min) and distance, 90.92% of customers (94,735 points) had access to existing services.
Using road traffic data and associated analyzes to measure the required time and distance of travel has already been addressed by earlier research. The previous studies have mostly been based on the fields of health issues and care services (, Oluoch et al. Citation2020), car accidents (Naboureh et al. Citation2019; Farhangi et al. Citation2020; Feizizadeh et al. Citation2021b), or fire station allocation and crisis management (Aktaş et al. Citation2013; Akay et al. Citation2020). Furthermore, the use of GIS is increasingly commonly used to determine the spatial accessibility of services based on the distance or travel time from residence to the site of service (Cinnamon, Schuurman, and Crooks Citation2008). In this study, the time required to overcome the distance between the customer’s location and the restaurants were computed and included in the restaurants service area and Geomarketing assessment. In addition to the time and distance factors, traffic is one of the most critical factors for delivery personnel (Amaguaya and Hernández Citation2020). Therefore, we used the data received from the traffic police of Tabriz and evaluated the traffic along the delivery routes under consideration of the appropriate timeframe for food delivery to customers and the shortest distance between the restaurant and the customer. The appropriate time to deliver food to customers varies between 10 and 20 min depending on the type of ordered food (fast food versus traditional food). Therefore, the appropriate time was considered to be an average of 15 min. The shortest distance in terms of time was also determined based on the data related to the speed limit on the streets determined by the traffic police of Tabriz. We used the ESRI Network Analyst tool to determine the optimal path for the delivery personnel.
4.3. GIS-MCDA-based urban restaurant suitability assessment
The second objective of this study was to identify suitable areas for new restaurants in Tabriz, which has been growing over the past decades due to its central role in industry, economy, trade, and tourism in Northern Iran. To identify suitable areas for new restaurant locations, a GIS-based multi-criteria decision analysis (MCDA) was used to consider the relevant criteria for the restaurant industry. A GIS-MCDA uses relevant indicators as criteria to determine the degree of suitability of each area. Due to the numerous factors that influence the site selection for a restaurant from a Geomarketing perspective, we applied GIS-MCDA techniques (Feizizadeh and Blaschke Citation2014; Naboureh et al. Citation2019: Mohamadzadeh et al. Citation2020) to identify suitable areas for restaurants. MCDA is one of the most popular decision support techniques (Feizizadeh and Blaschke Citation2014; Omarzadeh et al. Citation2021; Feizizadeh and Ghorbanzadeh Citation2017).
Using an MCDA / GIS ensemble, we applied GIS tools to identify the potential of various areas for restaurants development (Omidipoor, Jelokhani-Niaraki, and Samany Citation2019; Abedi Gheshlaghi et al., Citation2020). Furthermore, MCDA offers techniques and algorithms for designing, evaluating, and prioritizing criteria to derive the objectives of multiple task assessments such as site selection and suitability assessments (North and Miller Citation2017). The MCDA is a method and a set of strategies for ranking alternatives in order of preference, from the most to the least favorable (Omarzadeh et al. Citation2021).
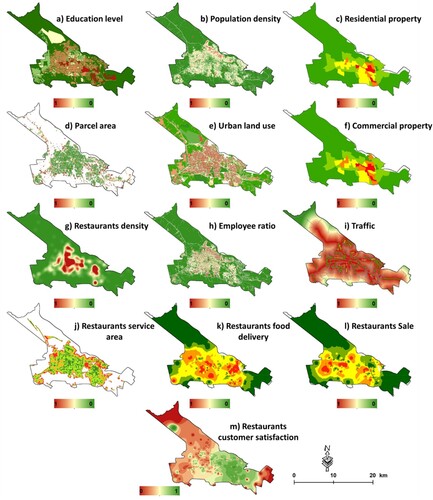
In this study, we first determined the relevant indicators based on literature (Habibpour, Feiizadeh, and Jabarzadeh Citation2021), data availability, and the opinions of experts from the Municipality of Tabriz and the urban planning and marketing departments of the University of Tabriz. Then, we obtained the data from the Municipality of Tabriz, food order applications, the traffic police of Tabriz, and associated organizations (see ). The required geometric and topological editing was then carried out in GIS, and the relevant indicators were derived. The criteria were standardized based on the nature of the pairwise comparison methodology, which is commonly used for rating and standardizing ordinal values. The standardization procedure was also used to prepare all data at the same scale suited for criterion weighting, sensitivity analysis and aggregation objectives. This was done using fuzzy standardization functions. A fuzzy set is essentially a set whose members can have membership degrees ranging from 0 to 1, as opposed to a traditional binary set, where each element must have a membership degree of either 0 or 1 (Malczewski Citation2006; Feizizadeh and Blaschke Citation2014). represent the spatial distribution and standardized version of the selected criteria.
Figure 3. Standardized criteria employed in the MCDA process for restaurants suitability assessment including: (a) education level, (b) population density, (c) residential property, (d) parcel area, (e) urban land use, (f) commercial property, (g) restaurants density, (h) employee ratio, (i) traffic, (j) restaurant service area, (k) restaurant food delivery, (l) restaurant sales, and (m) restaurants customer satisfaction.
4.3.1. Criteria weighting
The criteria weighting is a critical step in GIS-MCDA that is used to determine the significance of each indicator individually as part of the decision model (Feizizadeh and Blaschke Citation2012). In this study, we employed an integrated approach of the fuzzy analytical network process (FANP), which is an efficient criteria weighting method according to our literature review and the early research reports (Mohamadzadeh et al. Citation2020; Feizizadeh et al. Citation2021a, Citation2021b; Abedi Gheshlaghi et al., Citation2021; Omarzadeh et al. Citation2021). The FANP method is one of the most used tools in GIS-MCDA that computes the factor weights (Saaty and Vargas Citation2013; Ghorbanzadeh, Feizizadeh, and Blaschke Citation2018). The integrated FANP method enables the evaluation of each indicator’s intrinsic weight.
The FANP adds to the overlay of data with varied features, in addition to fuzzification of the indicators as GIS spatial data. The pairwise comparison technique can be used in the FANP approach to rank criteria and compute the criteria weights. Based on Saaty (Citation1990), the pairwise comparison of the FANP method is carried out by specialists who rank the relative importance of the initial criteria on a scale of 1–9, with 1 denoting equal position, 2–4 denoting weakly higher relevance, 5–6 denoting moderately higher importance, and 7–9 denoting strongly and extremely higher importance of the criterion. To compute the criteria weights, the expert knowledge is considered in the initial ranking of the indicators. Therefore, 25 experts from the Municipality of Tabriz, Department of Urban Planning/ Marketing at the University of Tabriz initially ranked the indicators from 1 to 9 based on the significance of each indicator for the suitability of certain locations for the expansion of the urban restaurant industry. Accordingly, the initial ranks were used to develop the FANP’s super matrix. Finally, the criteria weights computed as under resendable consistency ratio (CR). It must be indicated that, according to Saaty (Citation1990), a CR < 0.1 indicates the acceptable level of consistency.
Table 2. Results of ANP’s super matrix for the suitability assessment of urban restaurants (restaurants).
4.3.2. Sensitivity and uncertainty analysis
The sensitivity and uncertainty analysis is a critical step in GIS-MCDA implementation. Technically, due to the heterogeneous data sources, expert knowledge for criteria ranking, and modeling errors, uncertainty is inevitable in GIS-MCDA (Feizizadeh and Blaschke Citation2014). In this context, criteria weighting significantly contributes to the uncertainty in the MCDA framework. According to earlier research, such uncertainty may even lead to inaccurate results (Feizizadeh and Blaschke Citation2012; Ligmann-Zielinska and Jankowski Citation2014; Feizizadeh and Kienberger Citation2017). Thus, by highlighting the influence of tiny changes to certain input parameters on evaluation outcomes, the sensitivity analysis can help reduce ambiguity in MCDA and the stability of its findings (Chen and Zhu Citation2010). The sensitivity analysis examines model behavior by adjusting input data or indicating the rate of change of parameters in the model outcome, thus resulting in a better understanding of how changes in the input data affect the output. This analysis shows how input data used in the decision model impacts the output, and it can be used to quantify the inputs’ intensities based on output fluctuations. We thus employed a sensitivity analysis to assess the uncertainty associated with the FANP’s weights for spatial modeling to reduce the risk of error in our GIS-MCDA-based decision model.
Within this research, we employed an integrated method of Monte Carlo simulation (MCS) and a global sensitivity analysis (GSA) to determine the uncertainty of the criteria weights. To evaluate and estimate the GIS-MCDA uncertainty, the sample-based MCS in combination with GSA yielded reliable results for the sensitivity and uncertainty analysis (Feizizadeh et al. Citation2021b). The uncertainty of attribute values and criteria weights can be thought of as a probability distribution or a confidence interval in this context (Chen et al. Citation2011; Fezizadeh et al. Citation2023).
In this integrated approach, the initial FANP’s weights () was employed as input weights for MCS and sensitivity analysis using the GSA. Thus, in our study, the implementation includes four main steps, namely: (a) using the most successful restaurants uniformly distributed as training data, (b) Making use of the FANP’s weights as reference weights, (c) applying the MCS-based simulation 10,000 times, and (d) computing the spatial distribution of results based on the spatial interpolation techniques of the inverse weighted distance. The MCS is used to compute the maximum, minimum, and standard deviation of ranks, which are shown in . In this figure, the standard deviation (c) represents the spatial uncertainty of the criteria weights which indicates the area that might be prone to uncertainty when using the employed weights. The GSA method also allows us to compute the two critical index of S (first order) and St (total effect). Technically, the S and St represent the FANP’s weights indicated in a semantic manner. In this context, any difference between the value and order of the S and St indexes as well as the reference weights (e.g. FANP’s weights), can be considered as the uncertainty associated with criteria weights. If the S and St are significantly different, it clearly indicates that using the computed references weights (e.g. FANP) might result in inaccurate results and must be recomputed. For detailed information about S and St, we refer to Feizizadeh, Jankowski, and Blaschke (Citation2014). shows the results of the sensitivity analysis based on the GSA approach. This table shows the computed weights from the FANP in the semantic manner, which indicates that the obtained weights can be efficiently used in the data aggregation step.
Figure 4. Results of MSC for sensitivity analysis (a) maximum rank, (b) minimum rank, and (c) standard deviation of ranks: Note: this map indicates that according to MCS the area with high values (read) might face sensitivity based on the proposed criteria weights and some modification might be needed.
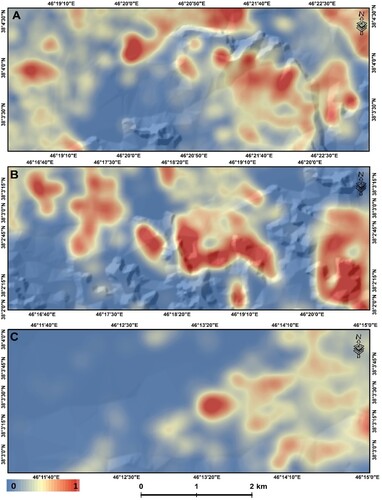
Table 3. Results of the global sensitivity analysis for sensitivity analysis of the fuzzy analytical network process’s weights.
4.3.3. Spatial aggregation
The spatial data aggregation of the selected indicators was based on the computed weights and used to develop the final maps. In this numerical approach, the spatial indicators from the one map layer are aggregated with the attribute (numerical) properties of the other indicators (Pebesma Citation2021). We used the ordered weighted average (OWA) to create the suitability map for the restaurant industry. The OWA is a popular spatial aggregation method in GIS, and its efficiency has been acknowledged by many researchers (e.g. Malczewski Citation2006; Feizizadeh, Jankowski, and Blaschke Citation2014; Malczewski and Rinner Citation2015; Bernard Keenan and Jankowski 2018; Ghorbanzadeh, Feizizadeh, and Blaschke Citation2018). OWA makes use of fuzzy decision rules for modeling the linguistically as effective spatial aggregation method. OWA provides a parameterized class of multi-criteria aggregation operators between the minimum and the maximum (Vigier, Scherger, and Terceño Citation2017). For a given set of n criterion (attribute) aps, an OWA operator can be defined as the following function , where I = [0, 1] that is associated with a set of order weights V = [
] so that
for j = 1, 2, … , n and
given a set of standardized criterion value
for i = 1,2, … m, where
is associated with the location (e.g. cell, polygon, line, point), the OWA operator is defined as follows (Boroushaki and Malczewski Citation2010):
(1)
(1) where
is the sequence obtained by reordering the criterion values
. With different sets of order weights
, one can generate a wide range of OWA operators including the three cases used in this article: WLC, Boolean overlay combination (‘AND’) and (‘OR’) by changing the set of order weights
(Boroushaki and Malczewski Citation2010). The OWA combination operator in Equation (1) ignores the fact that most of the GIS-based decision-making problems require a set of different weights to be assigned to criterion maps layers. OWA provides a tool for generating a wide range of decision strategies in a decision strategy space, by applying a set of order weights to criteria that are ranked in ascending order on a pixel-by-pixel basis. We used the computed FANP weights to create the restaurants suitability map before applying the OWA method as an aggregation function.
5. Results
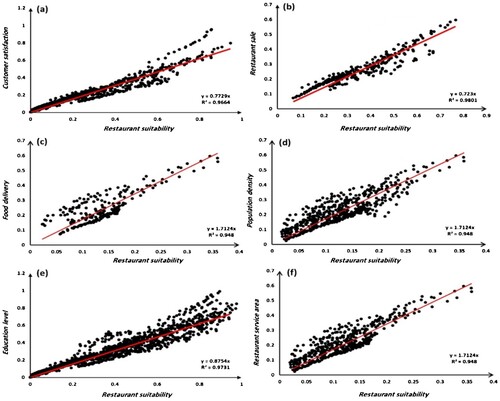
The following figures and tables present the main results of the study. shows the overall satisfaction as experienced by customers in the urban restaurants of Tabriz during the COVID-19 pandemic. shows the computed service areas for restaurants based on the number of food delivery reports. show the service areas for urban restaurants based on the customer locations and number of deliveries for each restaurant. As indicated in the methodology section, to analyze the spatial correlation of the service areas and the functionality assessment of the restaurants, we also considered the population density and the results are presented in . The results of traffic monitoring based on the obtained data from Tabriz traffic police was computed and presented in . As one of the main objectives of this study was to identify suitable areas for urban restaurant developments which is carried out based on the GIS-MCDA as shown in . This map identifies the areas that are suitable for the development of the urban restaurant industry. represents the spatial correlation of the restaurant service area with impacting factors such as population density, road traffic, customer satisfaction, food delivery, and restaurant sales. Based on this figure, of these indicators impacting the service areas of the restaurants, the customer satisfaction had the highest correlation with the expansion of the service areas of the restaurants. also shows the spatial correlation of the developed suitability map for restaurant service area expansion against the socioeconomic indicators such as employment ratio, food orders, restaurant sales, and customer satisfaction.
Figure 5. Customer satisfaction as reported in the food delivery reports.
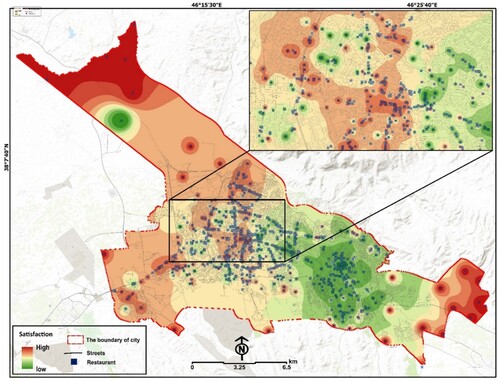
Figure 6. Computed service areas for the restaurants.
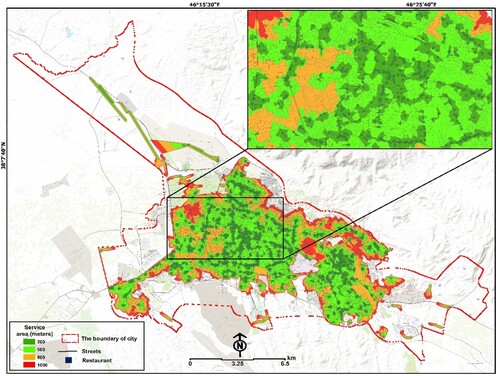
Figure 7. Service allocation results based on the food order deliveries and the location of restaurant customers.
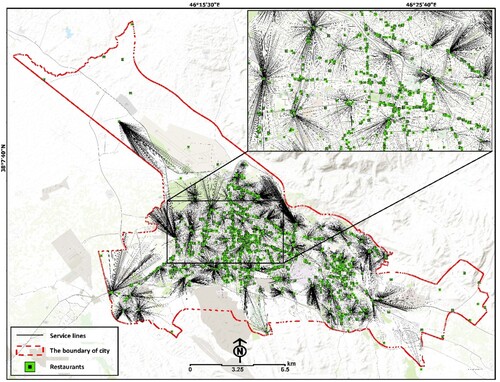
Figure 8. Population density of Tabriz.
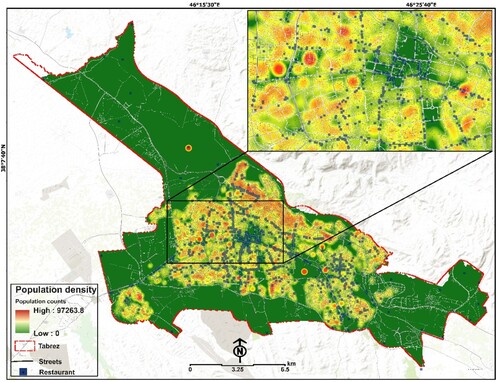
Figure 9. Urban road traffic in Tabriz.
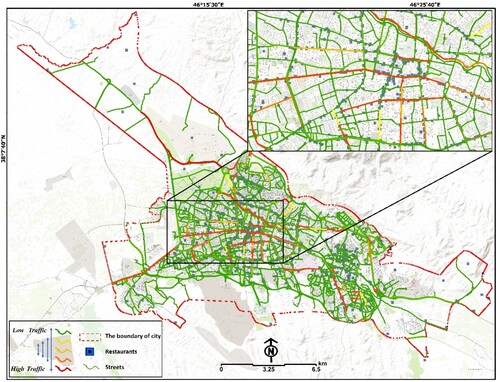
Figure 10. Results of the GIS-MCDA showing the suitability levels for future expansion of restaurants in Tabriz.
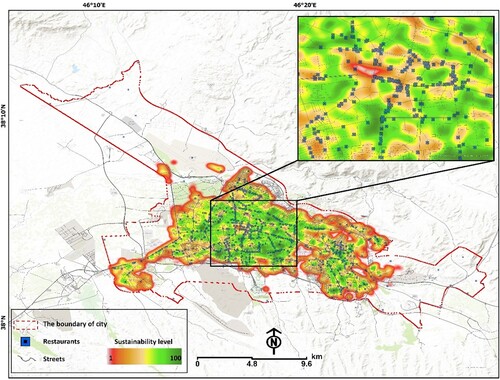
Figure 11. Spatial correlation of the restaurant service area with impacting factors including: (a) road traffic, (b) customer satisfaction, (c) restaurant seale m (d) population density and (e) food delivery.
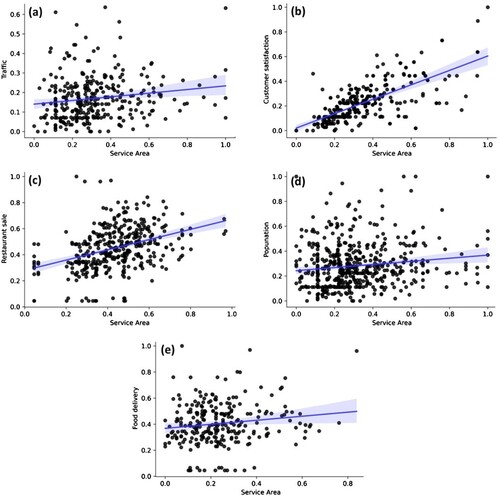
Figure 12. Results of spatial correlation, including: (a) suitability map for restaurant and satisfaction, (b) suitability map for restaurants and their sale, (c) suitability map for restaurants and food delivery, (d) suitability map for restaurants and population density, (e) employment level and food order and (f) the urban restaurants satisfaction and services area.
6. Discussion
6.1. Key findings
This study analyzed the urban restaurants (restaurants) during the COVID-19 pandemic when the restaurant industry faced critical conditions due to strict home quarantine measures. The GIS-based analyses for service allocation were carried out using a time interval of 10–20 min, a service area of 500–1100 meters, and were based on data from 1050 restaurants. Our results indicated that 90.92% of the people has access to the restaurant services in the city. Results of restaurants service area assessment show that the restaurants in central and eastern areas had far reaching service areas that included their neighborhood and extended to other sub-towns in Tabriz. This shows the functionality of these restaurants.
In the central areas, with a high population density, tourism, and commercial and administrative services, the number of restaurants in these areas increased. In the central area of the city, there is a high number of well-known and high standard restaurants, and our analysis shows that there was still sufficient business in the form of take-out or home delivery for these restaurants during the COVID-19 pandemic. The restaurant service area assessment shows that most of these well-known restaurants successfully developed widespread business by means of extending their service area to 15 km from their location.
Based on the results, most of the restaurants in the north (except Roshdeyh town, which is one the wealthiest towns in Tabriz) and the southern part of the city aimed for local business within their neighborhoods. It must be emphasized, that well-known restaurants may not have been interested in developing a business in these areas due to the lifestyle differences, reduced land- and property value, and the low income of many residents. Based on our results, the lowest number of online food orders were recorded in the areas that were essentially limited to the local restaurants. The service area for the restaurants in such areas was within a 1–7 km radius.
The customer satisfaction of restaurants located in the central and eastern areas of Tabriz is relatively high. Restaurants located in northern and southern areas faced serious challenges in terms of customer satisfaction. It must be indicated that the eastern area of Tabriz is known as a modern area that has been developing rapidly in recent decades. Most of the modern restaurants and well-known brands are located in the central and eastern areas of Tabriz. There are also several well-known ‘restaurant chains’ in the suburb located on the urban transport routes to Azarshahr, Urmia, and Marand cities that recorded a high level of customer satisfaction. In addition, a high rate of customer satisfaction was observed for well-known sub-towns such as Elguli, Valiasar, Roshdeyh, Gloshahr, Zafaranieh, Rajaei, Yagcheiyan. These areas are famous for hosting the top restaurants and national restaurant brands. These sub-towns, particularly Elguli and Valisar, are famous for very high property values and a high quality of life as residents are wealthier. By contrast, the western, northern, and southern areas are residential areas with intensive industrial activities and are generally home to low-income families. From a social and cultural perspective, there is a significant difference in lifestyle and quality of life for the residents in different parts of the city (Azami-Aghdash et al. Citation2019).
6.2. Linked to the literature
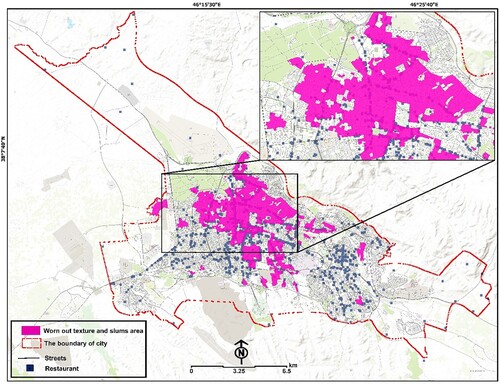
Tabriz has been facing a critical socioeconomic situation in recent decades as one of the major immigrant destinations due to intensive industrial and economical activities. As a result, about 502 hectares of slums and informal settlements as well as 2500 hectares of urban worn out texture (see ) with a population between 400.000 and 700.000 persons developed over the past four decades (Municipality of Tabriz Citation2021). These slums and informal settlements face a dualism in lifestyle, urban fabric and morphology (Feizizadeh et al. Citation2021a). Based on the results, the urban restaurants located in these areas failed to achieve high customer satisfaction rates.
Figure 13. Location of urban worn out textures, slums and informal settlements.
As a result of unbalanced development, the quality of life and access to urban facilities (such as public transport, green spaces, restaurants, markets etc.) is very different across the city. Our study also reflects significant differences in employment and education levels in different parts of the city. Based on the , the spatial correlation diagrams show, the suitability assessment for restaurants, food order, and customer satisfaction represent a linear correlation with most of the socioeconomic indicators, thus expressing the significance of the urban environment, and, specifically, the neighborhood impacts, on the restaurant industry.
6.3. Policy implications
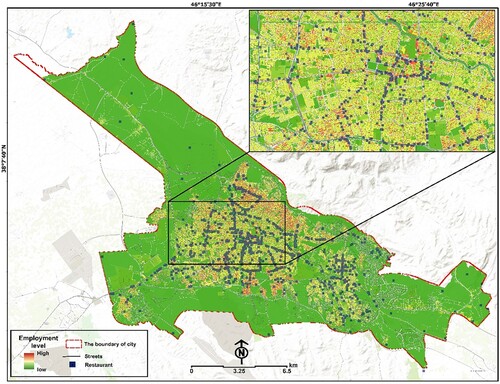
This study reveals a ‘social gap’ between different parts of Tabriz while well-known brands of restaurants are established in the wealthy and modern neighborhoods in a linear correlation with education and employment levels. shows the employment ratio in Tabriz and indicates that the most successful restaurants are located in areas with high employment rates. From the cultural perspective, the wealthy and employed residents use the urban restaurants as recreation activities and their daily meals (Pourmoradian Citation2018). Thus, a number of the home-delivery urban restaurants developed in the wealthy sub-towns such as Elguli, Valiasar, Roshdeyh, Gloshahr, Zafaranieh, Rajaei. In Iran, the metropolitan environments act as centers of immigration with several resulting challenges such as air pollution, the expansion of slums and informal regions etc. These developments also lead to an increase in traffic problems and air pollution, which was barely heard of in this environmental setting some twenty years ago. Tabriz is now ranked the second most populated city in Iran (Feizizadeh et al. Citation2021a). As Tabriz is also a significant tourist attraction in Iran, improvements in restaurants and service infrastructure may benefit citizens.
Figure 14. Spatial distribution of the employment ratio in Tabriz.
The number of restaurants in Tabriz has generally increased in recent decades and brought about vast improvements in the restaurant industry in terms of the variety and quality of food (e.g. fast food). Thus, the tendency to buy food, especially fast food, from restaurants has increased dramatically, and, as a result of this trend, the number of restaurants has also increased drastically (Habibpour, Feiizadeh, and Jabarzadeh Citation2021).
6.4. Data and method
Our study pointed out that Geomarketing may not only help restaurants commercially but could be part of a planning strategy aiming to benefit citizens for optimized access of restaurants (Touzani and Van Buskirk Citation2016; Zuluaga and Escobar Citation2017; Fagir Citation2016; Juárez et al. Citation2020; Habibpour, Feiizadeh, and Jabarzadeh Citation2021). We may indicate that Geomarketing allows restaurants to maximize profitability by maximizing the economic metrics of the business thanks to the design of segmented marketing strategies based on the behavior patterns of the target audience and specific criteria for that business. On the other hand, from the urban planning perspective, our results revealed that areas for the establishment of new restaurants exist in Tabriz that can be considered by planners and authorities and by restaurants for successful business planning and development. The most beneficial areas for establishing new restaurants are in the southern and western parts of the city. High population density, residential land use, and affordable land are among the factors influencing the identification of these areas as being suitable for the small business restaurant industry.
In this study, we applied a GIS-based Geomarketing approach to analyz the restaurants’ functionality and identify suitable areas for future expansion. It must be indicated that Geomarketing is a new trend in GIScience, which brings both opportunities and challenges. The results of this study verify the efficiency of GIS-based Geomarketing approaches for analyzing and mapping the spatial context of food delivery datasets using location-based systems. Obviously, such a study would not have been possible a few years ago. Generally, time- and geotagged data are produced at a previously unheard-of rate on many platforms, providing a wealth of options for studying human and environmental dynamics. Spatial data mining can empower a variety of data analysis approaches, including clustering and classification, as well as trend detection in various domains (Perumal et al. Citation2016). The methods applied and presented in this research could make a significant contribution to developing GIScience. Our results showed that the proposed approach turned out to be an efficient methodological framework for data acquisition and pattern mapping. The proposed approach supports the authorities and decision-makers in understanding the spatial pattern of this business sector, as well as supporting businesses in identifying suitable areas for future expansion. The applied methodology can easily be customized and applied for spatiotemporal pattern mapping of any business sector or to conduct suitability assessments for future expansion in urban environments.
7. Conclusion and future works
The main objective of this study was to analyze the situation of the restaurant industry and the customer behavior in Tabriz city during the COVID-19 pandemic. We also analysed the spatial distribution of the restaurants and their service area as well as potential areas for the future extension. The Geomarketing analyses revealed that the most significant spatial criteria impacting the business of the restaurants were customer satisfaction, delivery service performance, service area, and road traffic, together with education and employment level. We observed different inherent spatial patterns in Tabriz city in terms of the restaurants functionality and their services for the citizens. There was a significant spatial correlation between the quality of life indicators, population density, and the functionality of urban restaurants. The best-known brands and high-quality restaurants are mostly located in wealthy areas with large services areas and high levels of customer satisfaction. During the COVID-19 pandemic, most of the urban restaurants efficiently offered home delivery and take-out services. Results also demonstrated an increasing willingness of citizens to use location-based apps during the COVID-19 pandemic. The availability of location-based services and apps for smartphones and tablets addressing online transportation, shopping, and ordering, amongst other things, enable a new lifestyle. GIScience and spatiotemporal analysis have enabled the development of various apps, including Geomarkting applications, that help facilitate this modern lifestyle. As Goodchild predicted in 2010, the positioning technologies build the basis for ‘knowing where everything is, at all times and the role of the citizen’ (Goodchild Citation1999, 13). However, this development was accelerated during the COVID-19 pandemic, where the GIS location-based service industry grew from a demand to supporting citizens during the home quarantine. We were able to re-establish the importance of GIScience methodologies and methods for location-based marketing of restaurants. Since the GIS based Geomarkting has been considered as new trend GIScience, we optimized the proposed approach can be also applied for any other similar case studies which is the stat of art and makes the current research as progressive for urban planning. In addition, this research indicated, that the assessment of restaurants as mere location-based services, has to be abandoned in favor of a more complex understanding, incorporating the spatial dimension of food-delivery service areas as a new factor for location choice. Based on the results, our future research will be focused on applying timeseries analysis in order to detect the inherent spatiotemporal geomarkting patterns in the city and identify their correlation with impacting sociodemographic characteristics. We conclude that most of the restaurants in Tabriz were started to use the food order apps after the COVID-19 disease. However, our analysis indicated a significant difference between functionality of restaurants in different parts of the city while the restaurants in developed part of the city were actively working during the home quarantine.
Disclosure statement
No potential conflict of interest was reported by the author(s).
Additional information
Funding
References
- Agarwal, R., and M. J. Dahm. 2015. “Success Factors in Independent Ethnic Restaurants.” Journal of Foodservice Business Research 18 (1): 20–33. doi:10.1080/15378020.2015.995749.
- Akay, A. E., N. Erdoganm, A. Dogan, and TAŞ İ̇nanç. 2020. “Assessment of Firefighting Teams by Using GIS Based Network Analysis Method.” Turkish Journal of Forest Science 4 (2): 424–435. doi:10.32328/turkjforsci.799293
- Aktaş, E., Ö Özaydın, B. Bozkaya, F. Ülengin, and Ş Önsel. 2013. “Optimizing Fire Station Locations for the Istanbul Metropolitan Municipality.” Interfaces 43 (3): 240–255. doi:10.1287/inte.1120.0671
- Amaguaya, F. R. O., and J. R. H. Hernández. 2020. “Improvement of Public Transport Routes with ArcGIS Network Analyst. Case Study: Urban Center of Milagro, Ecuador.” In International Conference on Applied Human Factors and Ergonomics, 31–36. Cham: Springer.
- Azami-Aghdash, S., H. Gharaee, M. H. Aghaei, and N. Derakhshani. 2019. “Cardiovascular Disease Patient's Quality of Life in Tabriz City in Iran in 2018.” Journal of Community Health Research, doi:10.18502/jchr.v8i4.2080.
- Blaschke, T., and H. Merschdorf. 2014. “Geographic Information Science as a Multidisciplinary and Multiparadigmatic Field.” Cartography and Geographic Information Science 41 (3): 196–213. doi:10.1080/15230406.2014.905755.
- Boroushaki, S., and J. Malczewski. 2010. “Using the Fuzzy Majority Approach for GIS-Based Multicriteria Group Decision-Making.” Computers and Geosciences 36: 302–312. doi:10.1016/j.cageo.2009.05.011
- Braun, B., and C. Schulz. 2012. Wirtschaftsgeographie. Stuttgart: Verlag Eugen Ulmer.
- Briozo, R. A., and M. A. Musetti. 2015. “Método multicritério de tomada de decisão: aplicação ao caso da localização espacial de uma Unidade de Pronto Atendimento–UPA 24h.” Gestão & Produção 22 (4): 805–819. doi:10.1590/0104-530X975-13
- Cervigni, E., M. Renton, K. Haslam, and S. Hickling. 2020. “Describing and Mapping Diversity and Accessibility of the Urban Food Environment with Open Data and Tools.” Applide Geography, doi:10.1016/j.apgeog.2020.102352.
- Chen, J., S. L. Shaw, H. Yu, F. Lu, Y. Chai, and Q. Jia. 2011. “Exploratory Data Analysis of Activity Diary Data: A Space–Time GIS Approach.” Journal of Transport Geography 19 (3): 394–404. doi:10.1016/j.jtrangeo.2010.11.002
- Chen, J., and Q. Zhu. 2010. “Uncertainty and Decision Strategy Analysis of GIS-based Ordered Weighted Averaging Method.” 2010 International Conference on Information, Networking and Automation (ICINA).
- Cinnamon, J., N. Schuurman, and V. A. Crooks. 2008. “A Method to Determine Spatial Access to Specialized Palliative Care Services Using GIS.” BMC Health Services Research 8 (1): 1–11. doi:10.1186/1472-6963-8-140
- Cliquet, G. 2021. “From Geomarketing to Spatial Marketing.” In Spatial Economics Volume II, 277–305. Cham: Palgrave Macmillan.
- Dock, J. P., W. Song, and J. Lu. 2015. “Evaluation of Dine-in Restaurant Location and Competitiveness: Applications of Gravity Modeling in Jefferson County, Kentucky.” Applied Geography 60: 204–209. doi:10.1016/j.apgeog.2014.11.008.
- Dolzhenko, R. A. 2017. “Approaches to Geomarketing Via Office Locations Serving Individuals and Legal Entities in a Commercial Bank.” Biznes-informatika Business Informatics 3: 41–55. doi:10.17323/1998-0663.2017.3.41.55.
- Dušek, R. 2020. “A Decision-Making Method Based on Consumer Spending Data.” In SHS Web of Conferences, 73, 01006.
- Fagir, D. H. B. 2016. “Finding the Best Location for New Restaurant Using GIS Technologies.” Doctoral dissertation, Sudan University of Science and Technology.
- Fan, F. M., and W. Collischonn. 2014. “Integração do modelo MGB-IPH com sistema de informação geográfica.” Revista Brasileira de Recursos Hídricos 19 (1): 243–254. doi:10.21168/rbrh.v19n1.p243-254
- Farhangi, F., A. Sadeghi-Niaraki, A. Nahvi, and S. V. Razavi-Termeh. 2020. “Spatial Modeling of Accidents Risk Caused by Driver Drowsiness with Data Mining Algorithms.” Geocarto International, doi:10.1080/10106049.2020.1831626.
- Feizizadeh, B., and T. Blaschke. 2012. “Uncertainty and Decision Strategy Analysis of GIS-Based Ordered Weighted Averaging Method for Landslide Susceptibility Mapping in Urmia Lake Basin, Iran.” In: Proceedings of the International Conference of GI Science 2012, Columbus, Ohio, USA, September, 18–21.
- Feizizadeh, B., and T. Blaschke. 2014. “An Uncertainty and Sensitivity Analysis Approach for GIS-Based Multicriteria Landslide Susceptibility Mapping.” International Journal of Geographical Information Science 28 (3): 610–638. doi:10.1080/13658816.2013.869821
- Feizizadeh, B., and O. Ghorbanzadeh. 2017. “GIS-Based Interval Pairwise Comparison Matrices as a Novel Approach for Optimizing an Analytical Hierarchy Process and Multiple Criteria Weighting.” GI_Forum 1: 27–35. doi:10.1553/giscience2017_01_s27
- Feizizadeh, B., P. Jankowski, and T. Blaschke. 2014. “A GIS Based Spatially-Explicit Sensitivity and Uncertainty Analysis Approach for Multi-Criteria Decision Analysis.” Computers and Geosciences 84: 81–95. doi:10.1016/j.cageo.2013.11.009
- Feizizadeh, B., and S. Kienberger. 2017. “Spatial Explicit Sensitivity and Uncertainty Analysis for Multicriteria Based Vulnerability Assessment.” Journal of Environmental Planning and Management 60 (11): 2013–2035. doi:10.1080/09640568.2016.1269643
- Feizizadeh, B., D. Omarzadeh, A. Sharifi, A. Rahmani, T. Lakes, and T. Blaschke. 2022. “A GIS-Based Spatiotemporal Analysis of COVID-19 Impacts on the Urban Traffic Accident Hotspots and Transport Network Sustainability Assessment in Tabriz.” Sustanbility, doi:10.3390/su14127468.
- Feizizadeh, B., D. Omrazadeh, Z. Ronag, A. Sharifi, T. Blaschke, and T. Lakes. 2021a. “A Scenario-Based Approach for Urban Water Management in the Context of the COVID-19 Pandemic and a Case Study for the Tabriz Metropolitan Area, Iran.” Sciences of Total Environment, doi:10.1016/j.scitotenv.2021.148272.
- Feizizadeh, B., Z. Ronagh, S. Pourmoradian, H. A. Gheshlaghi, T. Lakes, and T. Blaschke. 2021b. “An Efficient GIS-Based Approach for Sustainability Assessment of Urban Drinking Water Consumption Patterns: A Study in Tabriz City, Iran.” Sustainable Cities and Society 64: 102584. doi:10.1016/j.scs.2020.102584
- Fezizadeh, B., T. Lakes, D. Omarzadeh, and S. Pourmoradian. 2023. “Health Effects of Shrinking Hyper-Saline Lakes: Spatiotemporal Modeling of the Lake Urmia Drought on the Local Population, Case Study of the Shabestar County.” Scientific Reports 13: 1622. doi:10.1038/s41598-023-28332-6.
- Gavilan, D., A. Balderas-Cejudo, S. Fernández-Lores, and G. Martinez-Navarro. 2021. “Innovation in Online Food Delivery: Learnings from COVID-19.” International Journal of Gastronomy and Food Science 24. doi:10.1016/j.ijgfs.2021.100330.
- Ghasemi, M., S. Karimzadeh, and B. Feizizadeh. 2021. “Urban Classification Using Preserved Information of High Dimensional Textural Features of Sentinel-1 Images in Tabriz, Iran.” Earth Sciences Information, doi:10.1007/s12145-021-00617-2.
- Gheshlaghi, Abedi, H. Feizizadeh, B. Blaschke. 2020. “GIS-based forest fire risk mapping using the analytical network process and fuzzy logic.” Journal of Environmental Planning and Management 63 (3): 481–499.
- Gheshlaghi, Abedi , H. Feizizadeh, B. Blaschke, T. Lakes, and S. Tajbar. 2021. “Forest fire susceptibility modeling using hybrid approaches.” Transaction in GIS. doi:10.1111/tgis.12688.
- Ghorbanzadeh, O., B. Feizizadeh, and T. Blaschke. 2018. “Multi-criteria Risk Evaluation by Integrating an Analytical Network Process Approach Into GIS-Based Sensitivity and Uncertainty Analyses.” Geomatics, Natural Hazards and Risk 9 (1): 127–151. doi:10.1080/19475705.2017.1413012
- Goodchild, M. F. 1999. “Future Directions in Geographic Information Science.” Geographic Information Sciences 5 (1): 1–8. doi:10.1080/10824009909480507.
- Google Shopurfood. 2020. Unveiling Top Google Searches About Restaurants & Dine-In In 2020. https://www.shopurfood.com/blogs/unveiling-top-google-searches-about-restaurants-dine-in-in-2020.
- Gursoy, D., and C. G. Chi. 2020. “Effects of COVID-19 Pandemic on Hospitality Industry: Review of the Current Situations and a Research Agenda.” Journal of Hospitality Marketing & Management 29 (5): 527–529. doi:10.1080/19368623.2020.1788231.
- Habibpour, F., B. Feiizadeh, and Y. Jabarzadeh. 2021. “GIS Spatial and Network Analysis Applied for Bookstores Geomarketing.” Journal of Geomatics Socity and Tchnology 10 (3): 99–109.
- Iranian Census Centre. 2016. “Population Density and Statistics.” https://www.amar.org.ir/.
- Juárez, K. S. R., E. M. Huerta, J. L. M. Rivera, and K. L. V. Matamoros. 2020. “Design of a Proposal for the Restaurant Sector of the Municipality of Apizaco that Generates value in Decision-Making Through Geomarketing.” ASIN: B083KM1N4S.
- Kamil, N. M. F. N. M., K. A. Razak, F. M. Yatim, and A. H. Hidzir. 2021. “GIS-Based Crisis Response System for Electric Distribution Utility: A Case Study of Covid-19 Pandemic In Malaysia.” In IOP Conference Series: Materials Science and Engineering, 1051, No. 1, 012046, IOP Publishing.
- Keeble, M., J. Adams, T. R. P. Bishop, and T. Burgoine. 2021. “Socioeconomic Inequalities in Food Outlet Access Through an Online Food Delivery Service in England: A Cross-Sectional Descriptive Analysis.” Applide Geography 133. doi:10.1016/j.apgeog.2021.102498.
- Kellner, F., A. Otto, and A. Busch. 2013. “Understanding the Robustness of Optimal FMCG Distribution Networks.” Logistics Research 6 (4): 173–185. doi:10.1007/s12159-012-0097-6
- Kim, H., and M. Kim. 2019. “Analysis of the Consumption Behaviors and Factors Determining the use of Delivery or Take-out Foods.” Journal of East Asian Society of Dietary Life 29 (3): 168–179. doi:10.17495/easdl.2019.6.29.3.168
- Laporte, G., S. Nickel, and F. S. da Gama. 2015. Location Science. New York: Springer.
- Li, H., and B. Hecht. 2021. “3 Stars on Yelp, 4 Stars on Google Maps: A Cross-Platform Examination of Restaurant Ratings.” Proceedings of the ACM on Human-Computer Interaction 4 (CSCW3): 1–25. doi:10.1145/3432953.
- Libório, M. P., O. Martinuci, S. Laudares, R. M. Lyrio, M. Machado, P. Bernardes, and P. Ekel. 2020. “Measuring Intra-Urban Inequality with Structural Equation Modeling: A Theory-Grounded Indicator.” Sustanbility 12: 8610. doi:10.3390/su12208610.
- Ligmann-Zielinska, A., and P. Jankowski. 2014. “Spatially-Explicit Integrated Uncertainty and Sensitivity Analysis of Criteria Weights in Multicriteria Land Suitability Evaluation.” Environmental Modelling & Software, 235–247. doi:10.1016/j.envsoft.2014.03.007
- Lim, W. M. 2021. “Toward an Agency and Reactance Theory of Crowding: Insights from COVID-19 and the Tourism Industry.” Journal of Consumer Behaviour 20 (6): 1690–1694. doi:10.1002/cb.1948.
- Lim, W. M. 2023. “Transformative Marketing in the New Normal: A Novel Practice-Scholarly Integrative Review of Business-to-Business Marketing Mix Challenges, Opportunities, and Solutions.” Journal of Business Research 160: 113638. doi:10.1016/j.jbusres.2022.113638
- Lim, W. M., S. Kumar, N. Pandey, T. Rasul, and V. Gaur. 2022b. “From Direct Marketing to Interactive Marketing: A Retrospective Review of the Journal of Research in Interactive Marketing.” Journal of Research in Interactive Marketing, doi:10.1108/JRIM-11-2021-0276.
- Lim, W. M., T. Rasul, S. Kumar, and M. Ala. 2022a. “Past, Present, and Future of Customer Engagement.” Journal of Business Research 140: 439–458. doi:10.1016/j.jbusres.2021.11.014
- Madeira, A., T. Palrão, and A. Sofia Mendes. 2021. “The Impact of Pandemic Crisis on the Restaurant Business.” Sustainability 13: 40. doi:10.3390/su13010040.
- Malczewski, J. 2006. “GIS-Based Multicriteria Decision Analysis: A Survey of the Literature.” International Journal of Geographical Information Science 20 (7): 703–726. doi:10.1080/13658810600661508
- Malczewski, J., and C. Rinner. 2015. Multicriteria Decision Analysis in Geographic Information Science. New York: Springer.
- Mandabach, K. H., M. A. Siddiqui, G. F. Blanch, and D. W. VanLeeuwen. 2011. “Restaurant Viability: Operations Rating of Contributing Success Factors.” Journal of Culinary Science & Technology 9 (2): 71–84. doi:10.1080/15428052.2011.580707.
- Mohamadzadeh, P., S. Pourmoradian, B. Feizizadeh, A. Sharifi, and M. Vogdrup-Schmidt. 2020. “A GIS-Based Approach for Spatially-Explicit Sustainable Development Assessments in East Azerbaijan Province, Iran.” Sustainability, doi:10.3390/su122410413.
- MOHME: Ministry of Health and Medical Education. 2021. “Monthly Report for COVID-19 Disease.” https://irangov.ir/ministry-of-health-and-medical-education.
- Motoyam, Y., and K. Usher. 2021. “Restaurant Reviews and Neighborhood Effects.” Papers in Applide Geography 4 (2): 386–401. doi:10.1080/23754931.2020.1791942.
- Musicality of Tabriz. 2021. center of data and statistics, https://en.tabriz.ir/
- Naboureh, A., B. Feizizadeh, A. Naboureh, J. Bian, T. Blaschke, O. Ghorbanzadeh, and M. Moharrami. 2019. “Traffic Accident Spatial Simulation Modeling for Planning of Road Emergency Services.” ISPRS International Journal of Geo-Information 8 (9): 371. doi:10.3390/ijgi8090371
- North, J., and F. L. Miller. 2017. “Facility Location Using GIS Enriched Demographic and Lifestyle Data for a Traveling Entertainment Troupe in Bavaria, Germany.” Decision Support Systems 99: 30–36. doi:10.1016/j.dss.2017.05.007
- Oluoch, F., G. Ayodo, F. Owino, and E. Okuto. 2020. “The Cost Implications of Reaching Universal Coverage of Maternity Health Services in Siaya County.” Western Kenya.
- Omarzadeh, D., S. Pourmoradian, B. Fezizadeh, H. Khalagei, A. Sharifi, and K. Valizadeh Kamran. 2021. “A GIS-Based Multiple Ecotourism Sustainability Assessment of West Azerbaijan Province, Iran.” Journal of Environmental Planning and Management, doi:10.1080/09640568.2021.1887827.
- Omidipoor, M., M. Jelokhani-Niaraki, and N. N. Samany. 2019. “A Web-Based Geo-Marketing Decision Support System for Land Selection: A Case Study of Tehran, Iran.” Annals of GIS 25 (2): 179–193. doi:10.1080/19475683.2019.1575905
- Park, S. H., and I. S. Sin. 2018. “The Effect of Food Delivery Service Quality on Customer Satisfaction, Perceived Emotion, and Intension to Reuse.” Journal of Distribution Management Research 21 (4): 5–13. doi:10.17961/jdmr.21.4.201808.5.
- Pebesma, E. 2021. “Map Overlay and Spatial Aggregation in sp, Report, Institute for Geoinformatics.” University of Muenster, Weseler Strasse 253, 48151 Munster.
- Peñarubia-Zaragoza, M. P., M. Simancas-Cruz, and G. Forgione-Martín. 2019. “Application of Geomarketing to Coastal Tourism Areas.” Tourism & Management Studies 15 (4): 7–16. doi:10.18089/tms.2019.150401
- Perumal, M., B. Velumani, A. Sadhasivam, and K. Ramaswamy. 2016. “Spatial Data Mining Approaches for GIS – A Brief Review.” Advances in Intelligent Systems and Computing 338. doi:10.1007/978-3-319-13731-5_63.
- Phumvichitkarn, C. 2020. “Tax Measures Asures for City Plan.” Valaya Alongkorn Review 10 (3): 140–154.
- Pourmoradian, S. 2018. “Tourism Policymaking Assessment of UNESCO World Heritage Sites in Tabriz, Iran.” PhD thesis, Faculty of Cultural and Social Science, University of Salzburg, Austria.
- Rezaei, N., R. Najjari, A. Nezhadfard, and R. Mohammadzadeh. 2020. “Spatial Analysis on the Recreation of Wool Retail Spaces in Iranian Markets (Case Study: Tabriz Grand Bazaar).” Property Management.
- Saaty, T. L. 1990. “How to Make a Decision: The Analytic Hierarchy Process.” European Journal of Operational Research 48 (1): 9–26. doi:10.1016/0377-2217(90)90057-I
- Saaty, T. L., and L. G. Vargas. 2013. “The Analytic Network Processes.” In Decision Making with the Analytic Network Process, 1–40. Boston: Springer.
- Sha, D., Y. Liu, Q. Liu, Y. Li, Y. Tian, F. Beaini, and C. Yang. 2021. “A Spatiotemporal Data Collection of Viral Cases for COVID-19 Rapid Response.” Big Earth Data 5 (1): 90–111. doi:10.1080/20964471.2020.1844934.
- Song, Y. E., S. H. Jeon, and M. S. Jeon. 2017. “The Effect of Mobile Food Delivery Application Usage Factors on Customer Satisfaction and Intention to Reuse.” Culinary Science & Hospitality Research 23 (1): 37–47. doi:10.20878/cshr.2017.23.1.005005005
- Touzani, S., and R. Van Buskirk. 2016. “Estimating Sales and Sales Market Share from Sales Rank Data for Consumer Appliances.” Physica A: Statistical Mechanics and its Applications 451: 266–276. doi:10.1016/j.physa.2016.01.030
- Utomo, C., Y. Rahmawati, and O. L. Sari. 2021. “Methodology Review on Multi Stakeholders Decision of Urban Market Land Use”. In Proceedings of the International Conference on Civil, Offshore and Environmental Engineering, 685–692.
- Vigier, H. P., V. Scherger, and A. Terceño. 2017. “An Application of OWA Operators in Fuzzy Business Diagnosis.” Applied Soft Computing 54: 440–448. doi:10.1016/j.asoc.2016.06.026
- Vos, D., and D. Meijers. 2019. “Population, Diversity and Restaurants: Trends in the Geography of Cuisine Variety in the Netherlands.” Regional Statistics 9 (2): 1–22. https://repositorio.comillas.edu/xmlui/handle/11531/37287
- Wang, S., R. Wang, X. Huang, Z. Li, and S. Bao. 2023. “A GIS-Based Analytical Framework for Evaluating the Effect of COVID-19 on the Restaurant Industry with Big Data.” Big Earth Data 7 (1): 47–68. doi:10.1080/20964471.2022.2163130
- Yarosh, O. 2019. “Digital Geomarketing Methods for Analyzing the Development of the Economy of Modern Urban Space.” IOP Conference Series: Materials Science and Engineering 497 (1): 12–32. doi:10.1088/1757-899X/497/1/012102
- Zhai, S., X. Xu, L. Yang, M. Zhou, L. Zhang, and B. Qiu. 2015. “Mapping the Popularity of Urban Restaurants Using Social Media Data.” Applied Geography 63: 113–120. doi:10.1016/j.apgeog.2015.06.006
- Zuluaga, J. D., and D. A. Escobar. 2017. “Geomarketing Analysis for Shopping Malls in Manizales (Colombia). Accessibility Approach Methodology.” Revista Espacios 38 (21): 1–18.