
 ?Mathematical formulae have been encoded as MathML and are displayed in this HTML version using MathJax in order to improve their display. Uncheck the box to turn MathJax off. This feature requires Javascript. Click on a formula to zoom.
ABSTRACT
In this study some soil phosphorous sorption parameters (PSPs) by using different machine learning models (Cubist (Cu), random forest (RF), support vector machines (SVM) and Gaussian process regression (GPR)) were predicted. The results showed that using the topographic attributes as the sole auxiliary variables was not adequate for predicting the PSPs. However, remote sensing data and its combination with soil properties were reliably used to predict PSPs (R2 =0.41 for MBC by RF model, R2=0.49 for PBC by Cu model, R2=0.37 for SPR by Cu model, and R2=0.38 for SBC by RF model). The lowest RMSE values were obtained for MBC by RF model, PBC by SVM model, SPR by Cubist model and SBC by RF model. The results also showed that remote sensing data as the easily available datasets could reliably predict PSPs in the given study area. The outcomes of variable importance analysis revealed that among the soil properties cation exchange capacity (CEC) and clay content, and among the remote sensing indices B5/B7, Midindex, Coloration index, Saturation index, and OSAVI were the most imperative factors for predicting PSPs. Further studies are recommended to use other proximally sensed data to improve PSPs prediction to precise decision-making throughout the landscape.
1. Introduction
Phosphorus (P) is a crucial nutrient element for plant growth and development, as it plays a crucial role in several plant physiological and biochemical processes, such as respiration, photosynthesis, protein synthesis, energy transfer, cell division and expansion, root development, flowering, and seed formation (White and Hammond Citation2008; Du et al. Citation2016; Malhotra, Vandana, and Pandey Citation2018). Du et al. (Citation2020) estimated that 43% of the natural terrestrial land area is relatively P limited. Hence, the phosphorus (P) limitation constrains the magnitude of terrestrial carbon uptake in response to elevated carbon dioxide and climate change. Therefore, an adequate supply of P is necessary to enhance crop growth and productivity, sustaining food security for the increasing world population.
Soils usually contain a relatively great quantity of total P; however, soil P is only sparingly available to plants (Malhotra, Vandana, and Pandey Citation2018). Furthermore, a large portion of the applied P fertilizers in agricultural soils is readily converted to less available forms through sorption reactions on the soil constituents, including clay minerals, iron and aluminum oxides, and carbonates (Shen et al. Citation2011). Phosphorus sorption in calcareous soils is dominated by surface precipitation and adsorption on the carbonate and clay mineral surfaces (Shen et al. Citation2011). Therefore, a quantitative description of the P sorption reactions is necessary for identifying the fate and bioavailability of P in soils (Daly et al. Citation2015; Kruse et al. Citation2015).
The behavior of P sorption in soils is usually quantified using sorption isotherms. An isotherm is a mathematical model for describing the equilibrium partitioning of a given chemical between the solid and aqueous phases at a constant temperature (Barrow Citation2015). Although various mathematical equations exist for describing the sorption isotherm data, the Langmuir and Freundlich models are the furthermost commonly used ones (Bai et al. Citation2017; Ghodszad et al. Citation2022; Mihoub, Bouhoun, and Saker Citation2016). The Langmuir model provides important information about the capacity and affinity of soils for the sorption of phosphate ions, both are critical in predicting P behavior in soils (Daly et al. Citation2015; Raven and Hossner Citation1994). The Freundlich model is a semi-empirical equation that can represent comparative information on the P sorption quantity and strength in soils (Hafiz et al. Citation2016).
In addition, sorption isotherms can provide valuable information about the soil’s buffering capacity with respect to the P concentrations within the soil solution. The soil P buffering capacity (PBC) is supposed to be a significant factor controlling the P-supplying ability of soils to plants, since it is reciprocally related to the ease of P release from the soil surfaces into the soil liquid phase (Holford Citation1997). It has been shown in plant uptake trials that PBC indices are negatively but significantly correlated to soil P bioavailability and absorption by wheat plants (Shirvani, Shariatmadari, and Kalbasi Citation2005). Hence, the larger the PBC, the larger the soil test threshold values and the amount of P fertilizer needed to attain a given P content in plants (Quintero, Boschetti, and Benavidez Citation2003; Recena et al. Citation2016; Sánchez-Alcalá et al. Citation2014).
Phosphorus sorption isotherms could also be applied to assess the required amounts of P fertilizers to establish a favored P intensity in soil solution (Hue and Fox Citation2010; Kumar Citation2015; Wisawapipat et al. Citation2009). For instance, the standard P requirement (SPR) has been described as the P quantity which should be added to the soil to create the P concentration in the equilibrium solution at 0.3 mg L−1 (Agbenin and Tiessen Citation1994). Phosphorus concentration of 0.003–0.3 mg L−1 in soil solution has been suggested as favorable to the growth of most plants, related to the plant species and the growth stage (Pierzynski, McDowell, and Thomas Sims Citation2015).
Although sorption isotherm studies can disclose useful information on soil P status, they can be exceedingly time-consuming and laborious to be used in soil testing programs. Soil P sorption parameters have been shown significant correlations with various soil routinely measured properties such as the quantities of clay (Bera et al. Citation2006; Li, Hou, and Zhu Citation2007; Shirvani, Shariatmadari, and Kalbasi Citation2005), organic matter (Daly, Jeffrey, and Tunney Citation2001; Li, Hou, and Zhu Citation2007), and calcium carbonate (Shirvani, Shariatmadari, and Kalbasi Citation2005). To save time and resources, pedotransfer functions (PTFs) can therefore be developed and applied to estimate P sorption parameters using the easily-measurable soil variables. Nevertheless, only a few studies have been dedicated to developing PTFs for predicting soil P sorption indices. Burkitt et al. (Citation2006) in a study in the high-rainfall zones of southeastern Australia for developing a PTF for the estimation of PBC showed that the combination of soil oxalate-extractable Al (Alox) with clay content could explain more than 98% of the variability in PBC. Meng et al. (Citation2022) determined the most influential environmental variables affecting PBC, using partial least squares structural equation. They found that the PBC index was straightly controlled by soil characteristics and hydrological circumstances, whereas landscape configurations meaningfully controlled the impacts of topography on hydrology and soil properties.
Digital soil mapping (DSM) as a machine learning-based approach has been developed (McBratney, Mendonça Santos, and Minasny Citation2003) and successfully used for estimating soil properties or soil classes (Zeraatpisheh et al. Citation2017; Tajik et al. Citation2019). This technique has the potential to use easily obtained environmental covariates to predict target variables using machine learning models. However, little attempt has been made to predict spatially soil PSPs using soil characteristics and easily accessible environmental variables (Møller et al. Citation2022; Wilson, Steenwerth, and O’Geen Citation2023). Møller et al. (Citation2022) mapped phosphorus sorption capacity (PSC) of Danish soil in four depths using a PTF and determined the uncertainty by Quantile Regression Forests (QRF) and showed that the prediction accuracies were moderate at best, but the prediction quantiles were generally reliable. Wilson, Steenwerth, and O’Geen (Citation2023) assessed three machine learning algorithms Random Forest (RF), Extreme Gradient Boosting (XGB), and Cubist, as well as two super learner ensembles for predicting P availability in California. They concluded that P-sorption capacity lends itself to environmental correlation mapping owing to the pedological underpinnings of digital soil mapping Consequently, the chief objectives of this investigation were to: (i) calculate a variety of soil PSPs based on phosphorus sorption isotherms, (ii) examine the proficiency of different machine learning models and DSM to predict the spatial distribution of the selected soil PSPs, and (iii) determine the most imperative ancillary variables that regulate the prediction’s accuracy and variability of selected parameters at the landscape scale, west of Iran.
2. Methods and materials
2.1. Description of the study area and soil sampling
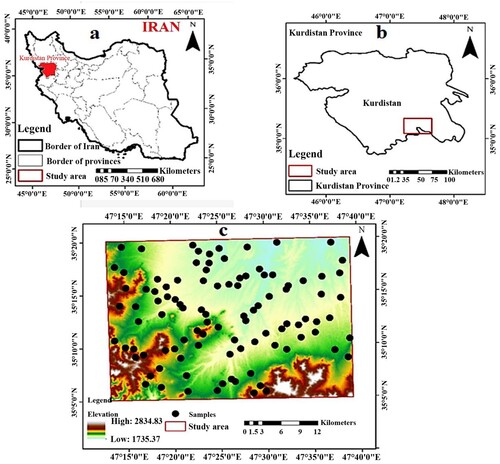
The current study was conducted in Sanandaj district, Kurdistan province, west of Iran with an area of 110,000 ha, situated between 35°05′00″ to 35°20′00″N latitudes and 47°12′59″ to 47°39′17″E longitudes (). The average elevation of the selected area is 2277 m above sea level. The mean annual temperature is 10.2°C, and the mean annual precipitation is 370 mm. Xeric and Mesic are the soil moisture regime and soil temperature regime, respectively, according to Soil Survey Staff - NRCS/USDA (Citation2014). The geological formation of the study area comprises granite, reddish sandy marls, river deposits, marl sandstone, and alluvium-cultivated lands. The stratified random sampling approach was used to select the soil sampling points. Elevation, slope, land use, geology and geomorphology maps were used as strata. A total of 100 samples were collected from the surface layer of 0–20 cm throughout the study area from 20 June to 20 September 2020 (). A global positioning system (GPS) device was used to document the coordinates of sampling locations. According to the study reported by Ghorbanian et al. (Citation2020), agricultural fields, rangelands, outcrops, clay deposits and urban areas are the dominant land use/cover types of this area, respectively. The main part of the area (about 71%) is covered by agricultural lands (Ghorbanian et al. Citation2020). The economy of the area is based on agricultural activities; the most important crops include wheat, barley, alfalfa and potato.
Figure 1. Location of the study area and spatial distribution of the soil sampling points in Kurdistan province, west of Iran. (a) Kurdistan province in Iran. (b) Selected area in Kurdistan province. (c) Spatial distribution of soil sample locations.
2.2. Analytical procedures
The soil samples were air-dried at room temperature under well-ventilated conditions and passed through a 2-mm sieve before laboratory analyses. The method suggested by Rhoades (Citation1982) was used to determine cation exchange capacity (CEC). Clay, silt, and sand fractions were measured by the Pipette method (Day et al. Citation1995). Wet oxidation approach (Nelson and Sommers Citation1996) was applied for the determination of soil organic carbon (SOC), and the titration approach (Goh and Mermut Citation2007) was used for the measurement of calcium carbonate equivalent (CCE).
To determine P sorption isotherms, 0.01 M CaCl2 solution comprising different concentrations of 0, 1, 2, 4, 7, 10, 13, and 16 µg P mL−1 (from KH2PO4) was added to 3 g of soil samples in three replicates (Shirvani, Shariatmadari, and Kalbasi Citation2005). The samples were subsequently centrifuged at 2500 rpm for 10 min and the supernatant was passed through filter papers (Whatman No. 42). The concentration of P in the final solutions was measured by the Murphy and Riley (Citation1962) method, using a Jenway 6300 UV/visible spectrophotometers. The quantity of the sorbed P in each sample was obtained from the difference between the initial and the equilibrium P concentrations, using Equation (1):
(1)
(1) where qe is the equilibrium amount of P sorbed per unit mass of soil (μg g−1), C0 and Ce are the initial and equilibrium concentrations P (μg L−1) in solutions, respectively, V is the volume of the solution (L), and W is the soil mass (g).
The Langmuir and Freundlich models were applied to describe the resulted P sorption data. The Langmuir isotherm equation is as follows:
(2)
(2) where qmax (µg P g−1 soil) is the maximum amount of P sorbed, KL (L µg−1) is a parameter related to the P sorption affinity, and qe and Ce were defined earlier.
The Freundlich equation is as follows:
(3)
(3) where, KF (μg1−n Ln g−1) is a parameter associated with the P sorption capacity and N is a coefficient showing sorption strength and surface heterogeneity. The qe and Ce were defined above.
A number of PSPs were obtained from the fitted isotherm models. The maximum buffering capacity (MBC) and the standard buffering capacity (SBC) of P were calculated from the fitted Langmuir model. The MBC and SBC are the maximum slopes of the Longmuir equation and the slope of the model at Ce of 0.3 μg P mL−1, respectively (Agbenin and Tiessen Citation1994). PBC1 index was also calculated from the slope of the Freundlich equation at Ce of 1 μg P mL−1 (Anghinoni, Baligar, and Wright Citation1996).
The standard P requirement (SPR) of the soils was obtained from the Longmuir isotherms, as the quantity of P sorbed by the soils at the concentration of 0.3 µg P mL−1 (Agbenin and Tiessen Citation1994).
2.3. Auxiliary environmental variables
In this research, three sources were examined to derivate the auxillary variables to estimate PSPs, including: (i) remote sensing data, (ii) topographic features obtained from DEM, and (iii) intrinsic soil properties. All raster-based auxiliary variables were rescaled to a resembling spatial resolution of 30 m. A summary of topographic and remotely sensed indices is given in .
Table 1. A list of environmental covariates used to predict PSPs in the study area (Resolution = 30 m).
The digital elevation data were gained from the Shuttle Radar Topography Mission (SRTM) with a 30 m spatial resolution to derive DEM. Michalak (Citation2004) was employed to extract topographic features using SAGA GIS (see ). Remotely sensed indexes (described in ) were derived from the image processing of the already corrected atmospherically images with 30 m spatial resolution for 7 August 2020, of the Landsat 8 Data Continuity Mission (Landsat 8) sensor and then was projected by the map projection of WGS 1984/UTM, Zone: 38 N. Following the image processing and required corrections, several remotely sensed indices were derived. The derived covariates comprised initial Landsat 8 bands, vegetation indices (NDMI, TDVI, OSAVI, NDVI), clay mineral index, brightness index (BI), Midindex, Hue index, Coloration index, Saturation index, and Redness index (). Since the PSPs generally are affected by some soil properties (clay, type of clay and soil organic matter), based upon the literature review the mentioned remotely sensed indices were the most powerful predictors for those soil properties that may mediate the PSPs along the landscape.
Soil properties that were expected to influence PSPs indices such as pH, calcium carbonate equivalent (CCE), electrical conductivity (EC), soil particle distribution, cation exchange capacity (CEC), and soil organic carbon (SOC) were included in the models. The interpolation method of Inverse Distance Weighted (IDW) was employed in R software to create the maps of soil parameters for spatial modeling.
2.4 . Modeling procedures
In this study, we examined four techniques comprising support vector machines (SVM), Gaussian process regression (GPR), Cubist model (Cu), and random forest (RF) to predict the soil PSPs. Support vector machines (SVMs) are advanced implements in neural network expertise based on statistical learning (Vapnik Citation1995). The elementary impression of SVM is to employ a linear model to construct non-linear class boundaries over the nonlinear mapping of the input vector into a high-dimensional feature space. The linear model constructed in the new space can represent a non-linear judgment boundary in the initial space (see detail in Vapnik Citation1995). Random Forest (RF) is a regression and classifier model that is comprised of numerous regression or decision trees whereas each tree corresponded to the values of a random vector sampled autonomously and with the same dissemination for all trees in the data (see detail in Liaw and Wiener Citation2002; Breiman et al. Citation2022). Cubist is a deployment of the Quinlan’s M5 model tree (Quinlan Citation1992) and it is alike to communal regression trees, excluding that the leaves are in the arrangement of a linear regression of the covariates. In Cubist, the calculation is based upon the linear regression models as an alternative to distinct values (see detail in Malone et al. Citation2009).
All modeling and feature selection was done using the ‘caret’ and ‘caretEnsemble’ packages in R 3.5.2 (Deane-Mayer and Knowles Citation2019).
2.5. Performance evaluation of models
For evaluating the performance of the selected models, a 10-fold cross-validation technique with 10 replications was employed (Hengl et al. Citation2015). The coefficient of determination (R2), root mean square error (RMSE), and mean absolute error (MAE) were used to evaluate the performance of the predictive models.
(4)
(4)
(5)
(5)
(6)
(6) where Z∗(Xi) and Z(Xi) are the forecasted and measured values, respectively, N is the number of measured samples, and
is the average of measured values. According to validation criteria, a higher coefficient of determination, and lower RMSE and MAE values reveal a higher model performance and accurate prediction with less error.
3. Results and discussion
3.1. Descriptive statistics of PSPs and soil properties
The descriptive statistics of some selected soil physical and chemical properties are presented in . Regarding the classification scheme suggested by Wilding (Citation1985), the soil EC, CCE, and SOC values were classified as highly variable (CV > 35%), and the properties including CEC and particle size distribution (clay, silt, sand) were classified as moderately variable (15 < CV < 35), and only soil pH was classified as slightly variable (CV = 3%). The low variability for pH in semiarid to arid regions of Iran was already obtained by Naimi et al. (Citation2022). High variability of chemical properties such as EC, CCE, and SOC are mainly attributed to variability in soil management practices, soil forming processes, and soil redistribution following soil erosion in hilly lands of the study area. The soil texture of selected soils was mainly classified as Loam, Silt Loam and Sandy Loam.
Table 2. Descriptive statistics of some soil chemical and physical properties and phosphorous sorption parameters in the study area (N = 100).
Descriptive statistics of calculated PSPs indices for the studied soils are given in . The results of the Kolmogorov–Smirnov (K–S) test showed that all four selected indices had normal distribution, but exhibited high variability in the study area (CV > 35%). The high variability of the PSPs in the study area can mainly be related to the great variability of intrinsic soil properties such as clay content, SOM, CCE, CEC, and even types of clay minerals that may have controlling roles on the PSPs. The MBC index ranged from 13.39 to 377.97 mL g−1 with a mean of 104.3 mL g−1 and a CV of 62.98%. Shirvani, Shariatmadari, and Kalbasi (Citation2005) showed that the MBC index varied from 58.1 to 672.3 mL g−1 in 11 calcareous soils of the Isfahan region, central Iran. Samadi (Citation2006) also reported MBC to be varied from 80 to 267 mL g−1 in 36 calcareous soils of western Iran. Laverdière and Karam (Citation1984) in a study in Quebec, Canada, reported a mean MBC value of 203.9 mL g−1 for Gelysols and 1278 mL g−1 for Podzols. Daly et al. (Citation2015), studying P sorption in a variety of Irish grassland soils with different calcite contents, showed that MBC varied from 244 to 3333 mL g−1 in non-calcareous soils and from 119 to 1000 mL g−1 in calcareous soils.
The PBC1 index derived from the Freundlich equation varied from 6.93 to 134.36 mL g−1 with an average of 30.1 and CV value of 50.49%. Shirvani, Shariatmadari, and Kalbasi (Citation2005) calculated the PBC1 value in a range of 10–57.6 mL g−1 in 11 calcareous soils, while Burkitt et al. (Citation2006) reported PBC1 value ranging from 2 to 97 mL g−1, calculated by the Rayment and Higginson (Citation1992) in some soils in high-rainfall zones of southeastern Australia. The SPR and SBC values showed mean values of 26 mg P kg−1 and 242.27 mL P g−1 with CV values of 54.88% and 48.93%, respectively. High variations in P buffering capacity indices among our soils compared to other studies can be dominantly related to the high differences in soil properties across the studied area.
3.2. Model performance and spatial mapping of PSPs
In this study, different groups of auxiliary variables were used for predicting PSPs. In the first scenario (I), we only included 14 topographic attributes for spatial modeling. The results of cross-validation for four applied machine-learning models are given in . The results indicated that the RF model had the lowest capability for predicting all studied PSPs with the highest nRMSE, RMSE and MAE, and lowest R2 values using topographic attributes. Although the SVM model showed the highest performance, in general, topographic attributes could not predict PSPs reliably in the study area (). Our results also revealed that the combination of topographic attributes with other auxiliary variables could not improve the accuracy of PSPs prediction (Results not shown). Several studies have successfully used topographic attributes to predict soil variables along the landscapes (Roecker and Thompson Citation2010; Rizzo et al. Citation2016; Azizi et al. Citation2022). As stated by Roecker and Thompson (Citation2010), the accuracy of prediction may be attributed to the gird size of DEM, the source of topographic data for DEM derivation, and the topology of the studied area. Based on our literature reviews no attempt has been made to use topographic attributes for predicting P sorption indices, therefore, it seems that further investigations are required in various environments to investigate the impacts of topographic attributes on the variability of PSPs. Using the topographic data with higher resolution would probably improve the prediction accuracy. Maleki et al. (Citation2020) studied the effects of the accuracy of topographic data on prediction and showed that including the high-resolution DEM derived from the UAV technique (0.30 × 0.30 m) into models led to an enhanced accuracy of the predictive soil maps at diverse taxonomic levels compared the DEM derived from the topographic maps (5 × 5 m).
Table 3. Validation results for PSPs predicted in four different scenarios using four studied models.
In the second scenario (II), intrinsic soil properties were solely included as the predictors for PSPs. In this regard, some intrinsic soil properties including soil particle distribution, CEC, CCE, pH and EC were entered as the input variables. The results presented in show that for different indices, different models were outperformed. For MBC and SBC, the RF model could explain 33% and 29% of the variability in validation processes, respectively. For predicting PBC and SPR, the cubist and GPR were identified as the most powerful models with R2 values of 0.42 and 0.35, respectively. Recently Møller et al. (Citation2022) employed oxalate-extractable aluminum (Alo) and iron (Feo) variables for the estimation of soil P sorption capacity, using Quantile Regression Forests (QRF) model. Wilson, Steenwerth, and O’Geen (Citation2023) successfully applied three machine learning models comprising Extreme Gradient Boosting (XGB), Random Forest (RF), and Cubist to predict P sorption index (PSI) with R2 values from 0.68 to 073 and found that the Fe/Al-(hydr) oxides controlled the P sorption in some weathered soils of California. Parra et al. (Citation2022) in a study on sugarcane croplands of Brazil with distinguished relief, used a decision tree induction model, with an 85% accuracy, and found that soil magnetic susceptibility was the variable with the most noteworthy impact on the estimation of soil P sorption in soils of the studied area.
In the third scenario (III), solely remotely sensed data and PSPs were included in the modeling. The results of the modeling presented in reveal that remote sensing data could explain the variability of PSPs in the given area with the highest performance. The RF was the superlative model for predicting MBC (R2 = 0.41, RMSE = 50.05, nRMSE = 0.48), SVM was the best model for predicting PBC (R2 = 0.36, RMSE = 11.56, nRMSE = 0.35), while the Cubist was superior for prediction of SPR (R2 = 0.37, RMSE = 11.66, nRMSE = 0.45) and SBC (R2 = 0.33, RMSE = 29.03, nRMSE = 0.39). Although, several scholars have successfully employed remotely sensed data for predicting soil properties and using machine learning models (Zeraatpisheh et al. Citation2017; Tajik et al. Citation2019; Azizi et al. Citation2022), no attempts have been made to estimate soil P sorption capacity throughout the world using the remote sensing data. Nevertheless, the effectiveness of proximal and remote sensing data for predicting available soil P has been investigated (Mponela et al. Citation2020; Misbah et al. Citation2022).
The inclusion of remote sensing data and intrinsic soil properties as the last scenario (IV) was investigated to explore the combination of these two data sets on the accuracy of PSPs prediction. In this scenario, MBC, PBC, SPR, and SBC were outperformed by the RF, Cubist, RF and RF models, respectively. Comparison of these results with previous scenarios showed that for MBC prediction, the inclusion of soil properties to RS data could not improve the results compared to RS data alone (scenario III). A similar trend was observed for SPR, but for PBC and SPR scenario IV was outperformed. Different studies confirmed that the inclusion of some auxiliary variables and combining them together improved the prediction’s accuracy of soil target variables (Zeraatpisheh et al. Citation2017; Kalambukattu, Kumar, and Arya Raj Citation2018). However, our results showed that the combination of variables together (even three input categories), led to a lower accuracy compared to one input variable scenario such as RS data (scenario III). This discrepancy in our study may be related to the existence of unknown relationships between variables that indirectly dampen their interaction for improvement of prediction.
Overall, a comparison of the obtained results by different scenarios revealed that the RS data (scenario III) was reliable for predicting PSPs in the study area. The inclusion of soil properties and RS data improved R2 values from 0.30 to 0.38 for MBC and from 0.36 to 0.37 for PBC in the RF modeling. These slight changes are negligible, where we can use easily and non-expensive remotely sensed data for predicting PSPs. Measuring the physical and chemical properties of the soil at the landscape scale is expensive and time-consuming, therefore, at the studied watershed scale using remote sensing data provides acceptable predictions for P sorption indices. For the best scenarios, almost RF had the best performance among the machine learning models, while among the models, GPR showed the least performance for all selected indices. Several researchers have confirmed the high proficiency of the RF model for estimating soil properties across the landscape (Zeraatpisheh et al. Citation2017; Azizi et al. Citation2022; Wilson, Steenwerth, and O’Geen Citation2023). Although some scholars reported a high coefficient of determination for the validation dataset, but reversely a lot of scholars reported lower R2 values (Ng et al. Citation2023; Reddy and Das Citation2023; Mirchooli et al. Citation2020). Based on nRMSE that confirmed that the results are acceptable and reasonable at the large scale. The high extent of area and high heterogeneity of soils induced by agricultural activities have led to poorer estimation. Diversity in environmental variables and target variables mainly affected the accuracy’s prediction as well human activity may be due to discrepancies in our expectations from the digital soil mapping. Moreover, sometimes the extent of variability in input variables control the accuracy such as low CV (less than 30%).
3.3. Importance variable analysis and mapping of PSPs
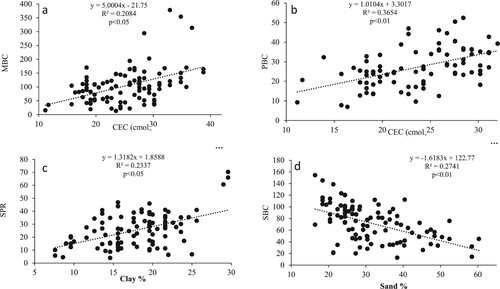
The results of the importance variable analysis for the studied P sorption indices are given in . This analysis was derived from the best models in the fourth scenario (a combination of RS data and soil properties). For predicting MBC, among the used input soil and RS data, the top ten variables were as: Clay > B5/B7 > Midindex > Coloration index > Saturation index > OSAVI > Silt > NDVI > Sand > CEC. Among the most important soil properties, particle size distribution was identified in the top ten, and specifically clay content was determined as the greatest important variable for an explanation of the soil MBC variation in the study area. Furthermore, CEC was identified as the key factor, as a significant positive linear correlation was obtained between CEC and MBC (r = 0.46, p < 0.01; (a)). Similarly, for predicting PBC, SPR, and SBC, the clay content and CEC were recognized as the furthermost important soil parameters. Positive and significant linear relationships were also obtained between PBC and CEC (r = 0.60, p < 0.01, (b)), and SPR and clay (r = 0.47, p < 0.01; (c)). Bera et al. (Citation2006) found positive and significant relationships between MBC and clay (r = 0.67, p < 0.01) and between SPR and clay content (r = 0.70, p < 0.01). Amrani, Westfall, and Moughli (Citation1999) also reported a correlation coefficient of 0.87 between the clay content and MBC of calcareous soils, indicating that clay content is a significant factor in controlling the P buffering capacity of soils because clay content determines the quantity of surface area accessible for P adsorption in the soil. Sand content was recognized as the supreme important soil factor for the explanation of the soil SBC variability (r = −0.52, p < 0.01, (d)), reflecting the negative influence of sand fraction on P sorption by soils. Using a linear regression analysis, Shirvani, Shariatmadari, and Kalbasi (Citation2005) also showed that clay content and CEC were the furthermost important soil variables influencing the buffering capacity factors. Using the multiple regression technique, Agbenin and Tiessen (Citation1994) reported that clay and CEC had influential positive effects on MBC and SBC values in various Brazilian soils. Other scholars have also reported that clay content and CEC have substantial impacts on P buffering capacity and sorption indices (Samadi Citation2006; Shahabifar et al. Citation2019).
Figure 2. Variable importance analysis results for selected phosphors sorption parameters using the best model and best scenario. (a) MBC. (b) PBC. (c) SPR. (d) SBC. All variables already described in .
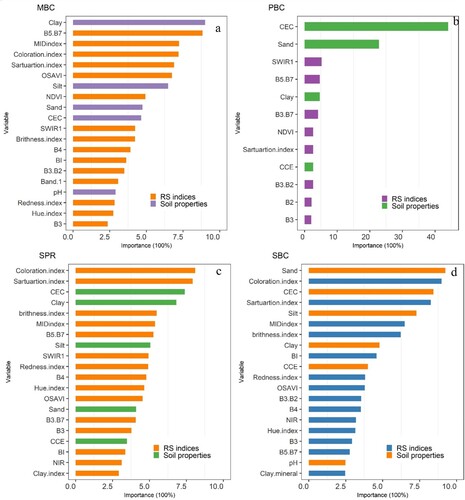
Figure 3. Relationships between phosphorus sorption parameters and some soil properties; (a) MBC vs. CEC; (b) PBC vs. CEC; (c) SPR vs. Clay; (d) SBC vs. Sand.
In addition to soil properties, some remotely sensed indices and ratios were identified to have high contributions for explaining P buffering capacity. As seen in , there are little differences among the remote sensing indices regarding their importance for predicting PSPs, but the most reliable indices included the Band5/Band7 ratio, Midindex, coloration index, saturation index, brightness index, and OSAVI. None of the vegetation indices were included as an important variable, indicating that vegetation and consequently organic matter had no influential impacts on the soil PSPs in our study area. The leading remotely sensed variables were mainly ascribed to the reflectance of soil particles and bare soils that dominantly related particle size distribution and the importance of clay particles and even CEC. Coloration index, bight index, and saturation index as indices derived from the visible bands (Green, Red, and Blue) were proposed by Ray et al. (Citation2004) and then successfully applied for estimating soil properties such as CEC (Khanal et al. Citation2018). Some studies reported significant correlations between clay content and CEC with the raw data bands of green, red, blue, and near infra-red (NIR) as well as some bands in mid-infrared (MIR1 (550–1750 µm) and MIR2 (2080–2350 µm)) ranges, suggesting the high capability of these bands for predicting clay content and CEC of the soils (Bishop and McBratney Citation2001; Triantafilis et al. Citation2009; Shabou et al. Citation2015; Thomas et al. Citation2021). Although in our study area and similar environments, clay content and CEC had the most influence on PSPs, in highly weathered soils and tropical areas iron and aluminum oxides have been identified as the controlling factors (Anghinoni, Baligar, and Wright Citation1996), and their reflectance have been used for prediction of CEC and soil potential for P sorption (Vaudour et al. Citation2019).
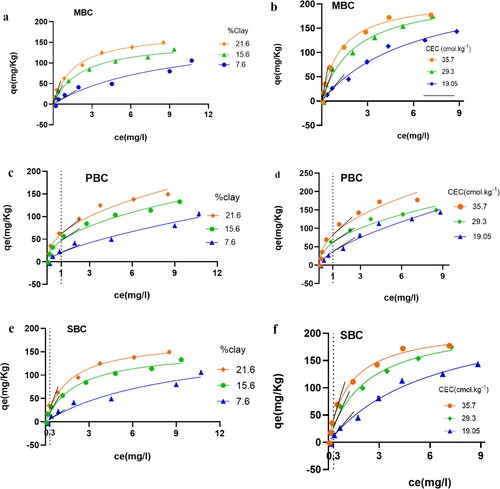
The visual inspection of three representative soils with different CEC values but similar clay content in (a) and three soils with similar CEC and different clay content in (b) confirmed that the Langmuir P sorption isotherms of the soils with higher CEC and clay content had higher initial slopes (i.e. MBC values). Similarly, in soils with the same CEC (19.7 cmol+ kg−1) value, the slope of the isothermal curve at unit P concentration (representing SBC1) increased with increasing the soil clay content ((c)). In three soils with a similar clay content of 21.6%, the slope of the tangent line at 1 mg P L−1 on the curve, corresponding to SBC1 value, was higher for the soil containing a higher clay content ((c)). The same trends were also observed for the slope of the curves at 0.30 mg L−1 of P concentration representing SBC ((e,f)).
Figure 4. Phosphorus sorption isotherms for selected soils with various clay content and CEC values in the study area, (a, c, and e) three soils with similar CEC (19.7 cmol+ kg−1) and different clay content (7.6%, 15.6%, and 21.6%). (b, d, and f) three soils with similar clay content (21.6%) and different CEC value (19.05, 29.3, and 35.7 cmol+ kg−1).
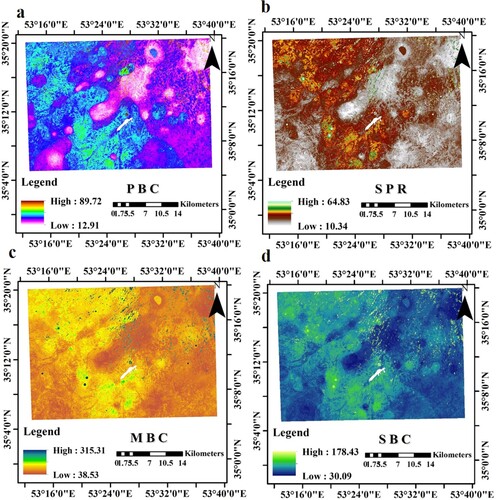
The spatial variability of the studied indices was displayed in by most performance models and scenarios. As shown in the figure, the lowest values of all P sorption indices were observed in the center of the study area toward all parts of the west of the area. Furthermore, a specific area located in the south-western of area had the highest values, while a large path directed from north-west to south showed the low values of indices. The knowledge about the spatial pattern of these indices have crucial and empirical implications for decision-makers and land users.
Figure 5. Spatial distribution of selected PSPs along the studied area in the west of Iran. (a)PBC; (b)SPR; (c)MBC; (d) SBC.
4. Conclusion
This research, as one of the leading efforts to predict phosphorus sorption indices in a semi-arid region, was accomplished to examine the proficiency of four machine learning algorithms and the application of some auxiliary environmental covariates as well as soil properties in the west of Iran. Results of statistical analysis showed that P buffering indices had high variation along the studied area, due to the high variance in soil properties across the area. Among the three selected scenarios, the topographic attribute dataset could not successfully predict PSPs, while the two others that included remote sensing data and soil properties were more powerful. The combination of soil properties and remotely sensed data slightly improved the accuracy of estimations. However, for estimating the PSPs in large areas that need a huge number of sampling and laboratory analyses, the use of easily available remote sensing data is more reliable for predicting PSPs. The results of sensitivity analysis in accordance with the isotherm diagrams and linear correlation coefficients revealed that the clay content and CEC were the most important soil properties that control the variability of PSPs that could be considered in the decision-making and fertilization. Among the remote sensing data, the original bands and the synthesized ratios and indices related to the direct reflectance of soil particles had the highest contributions in explaining PSPs variation along the studied landscape. For future studies, it is suggested to use images of other remote sensors such as Sentinel 1 and 2, as well as proximal spectroscopy for improving the accuracy of prediction of PSPs as the key parameters for precise soil management in large areas.
Geolocation information
The study area in this paper is Isfahan province, Iran.
Disclosure statement
No potential conflict of interest was reported by the author(s).
Data availability statement
The data that support the findings of this study are available on request from the corresponding author [S. Ayoubi]. The data are not publicly available due to restriction of our University.
Additional information
Funding
References
- Agbenin, J. O., and H. Tiessen. 1994. “The Effects of Soil Properties on the Differential Phosphate Sorption by Semiarid Soils from Northeast Brazil.” Soil Science 157 (1): 36–45. doi:10.1097/00010694-199401000-00006.
- Amrani, M., D. G. Westfall, and L. Moughli. 1999. “Phosphate Sorption in Calcareous Moroccan Soils as Affected by Soil Properties.” Communications in Soil Science and Plant Analysis 30 (9–10). doi:10.1080/00103629909370286.
- Anghinoni, I., V. C. Baligar, and R. J. Wright. 1996. “Phosphorus Sorption Isotherm Characteristics and Availability Parameters of Appalachian Acidic Soils.” Communications in Soil Science and Plant Analysis 27 (9–10). doi:10.1080/00103629609369686.
- Azizi, Kamran, Shamsollah Ayoubi, Kamal Nabiollahi, Younes Garosi, and Rene Gislum. 2022. “Predicting Heavy Metal Contents by Applying Machine Learning Approaches and Environmental Covariates in West of Iran.” Journal of Geochemical Exploration 233. doi:10.1016/j.gexplo.2021.106921.
- Bai, Junhong, Xiaofei Ye, Jia Jia, Guangliang Zhang, Qingqing Zhao, Baoshan Cui, and Xinhui Liu. 2017. “Phosphorus Sorption-Desorption and Effects of Temperature, PH and Salinity on Phosphorus Sorption in Marsh Soils from Coastal Wetlands with Different Flooding Conditions.” Chemosphere 188. doi:10.1016/j.chemosphere.2017.08.117.
- Barrow, N. J. 2015. “Soil Phosphate Chemistry and the P-Sparing Effect of Previous Phosphate Applications.” Plant and Soil. doi:10.1007/s11104-015-2514-5.
- Bera, R., A. Seal, P. Bhattacharyya, K. Mukhopadhyay, and R. Giri. 2006. “Phosphate Sorption Desorption Characteristics of Some Ferruginous Soils of Tropical Region in Eastern India.” Environmental Geology 51 (3): 399–407. doi:10.1007/s00254-006-0335-9.
- Bishop, T. F. A., and A. B. McBratney. 2001. “A Comparison of Prediction Methods for the Creation of Field-Extent Soil Property Maps.” Geoderma 103 (1–2). doi:10.1016/S0016-7061(01)00074-X.
- Breiman, Leo, Adele Cutler, Andy Liaw, and Matthew Wiener. 2022. “Breiman and Cutler’s Random Forests for Classification and Regression.” doi:10.1023/A:1010933404324.
- Burkitt, L. L., C. J. P. Gourley, M. C. Hannah, and P. W. G. Sale. 2006. “Assessing Alternative Approaches to Predicting Soil Phosphorus Sorption.” Soil Use and Management 22 (4): 325–333. doi:10.1111/j.1475-2743.2006.00042.x.
- Conrad, O., B. Bechtel, M. Bock, H. Dietrich, E. Fischer, L. Gerlitz, J. Wehberg, V. Wichmann, and J. Böhner. 2015. “System for Automated Geoscientific Analyses (SAGA) v. 2.1.4.” Geoscientific Model Development 8 (7): 1991–2007. doi:10.5194/gmd-8-1991-2015.
- Daly, K., D. Jeffrey, and H. Tunney. 2001. “The Effect of Soil Type on Phosphorus Sorption Capacity and Desorption Dynamics in Irish Grassland Soils.” Soil Use and Management 17 (1): 12–20. doi:10.1111/j.1475-2743.2001.tb00003.x.
- Daly, K., D. Styles, S. Lalor, and D. P. Wall. 2015. “Phosphorus Sorption, Supply Potential and Availability in Soils with Contrasting Parent Material and Soil Chemical Properties.” European Journal of Soil Science 66 (4): 792–801. doi:10.1111/ejss.12260.
- Day, P. R. 1995. “Particle fractionation and particle‐size analysis.” In Methods of Soil Analysis: Part 1 Physical and Mineralogical Properties, Including Statistics of Measurement and Sampling . Vol. 9, 545–567. Madison, WI: American Society of Agronomy.
- Deane-Mayer, Zachary A., and Jared E. Knowles. 2019. “CaretEnsemble: Ensembles of Caret Models.” R Package Version 2.0.1.
- Douaoui, A. E. K., H. Nicolas, and C. Walter. 2006. “Detecting salinity hazards within a semiarid context by means of combining soil and remote-sensing data.” Geoderma 134 (1-2): 217–230.
- Du, E., C. Terrer, A. F. Pellegrini, A. Ahlström, C. J. Van Lissa, X. Zhao, N. Xia, X. Wu, and R. B. Jackson. 2020. “Global patterns of terrestrial nitrogen and phosphorus limitation.” Nature Geoscience 13 (3): 221–226.
- Du, Enzai, Wim De Vries, Wenxuan Han, Xuejun Liu, Zhengbing Yan, and Yuan Jiang. 2016. “Imbalanced Phosphorus and Nitrogen Deposition in China’s Forests.” Atmospheric Chemistry and Physics 16 (13). doi:10.5194/acp-16-8571-2016.
- Foody, Giles M., Mark E. Cutler, Julia McMorrow, Dieter Pelz, Hamzah Tangki, Doreen S. Boyd, and Ian Douglas. 2001. “Mapping the Biomass of Bornean Tropical Rain Forest from Remotely Sensed Data.” Global Ecology and Biogeography 10 (4). doi:10.1046/j.1466-822X.2001.00248.x.
- Ghodszad, Larissa, Adel Reyhanitabar, Shahin Oustan, and Leila Alidohkt. 2022. “Phosphorus Sorption and Desorption Characteristics of Soils as Affected by Biochar.” Soil and Tillage Research 216. doi:10.1016/j.still.2021.105251.
- Ghorbanian, Arsalan, Mohammad Kakooei, Meisam Amani, Sahel Mahdavi, Ali Mohammadzadeh, and Mahdi Hasanlou. 2020. “Improved Land Cover Map of Iran Using Sentinel Imagery Within Google Earth Engine and a Novel Automatic Workflow for Land Cover Classification Using Migrated Training Samples.” ISPRS Journal of Photogrammetry and Remote Sensing 167. doi:10.1016/j.isprsjprs.2020.07.013.
- Goh, Tee Boon, and A. R. Mermut. 2007. “Carbonates.” In Soil Sampling and Methods of Analysis. 2nd ed. doi:10.1201/9781420042344-5.
- Hafiz, Nureza, Shirajum Monira Adity, Sadia Farah Mitu, and Atikur Rahman. 2016. “Effect of Manure Types on Phosphorus Sorption Characteristics of an Agricultural Soil in Bangladesh.” Cogent Food and Agriculture 2 (1). doi:10.1080/23311932.2016.1270160.
- Hengl, Tomislav, Gerard B.M. Heuvelink, Bas Kempen, Johan G.B. Leenaars, Markus G. Walsh, Keith D. Shepherd, Andrew Sila, et al. 2015. “Mapping Soil Properties of Africa at 250 m Resolution: Random Forests Significantly Improve Current Predictions.” PLoS ONE 10 (6). doi:10.1371/journal.pone.0125814.
- Holford, I. C. R. 1997. “Soil Phosphorus: Its Measurement, and Its Uptake by Plants.” Australian Journal of Soil Research 35 (2). doi:10.1071/S96047.
- Hue, N. V., and R. L. Fox. 2010. “Predicting Plant Phosphorus Requirements for Hawaii Soils Using a Combination of Phosphorus Sorption Isotherms and Chemical Extraction Methods.” Communications in Soil Science and Plant Analysis 41 (2). doi:10.1080/00103620903426949.
- Kalambukattu, Justin George, Suresh Kumar, and R. Arya Raj. 2018. “Digital Soil Mapping in a Himalayan Watershed Using Remote Sensing and Terrain Parameters Employing Artificial Neural Network Model.” Environmental Earth Sciences 77 (5): 203. doi:10.1007/s12665-018-7367-9.
- Khan, Nasir M., Victor V. Rastoskuev, Y. Sato, and S. Shiozawa. 2005. “Assessment of Hydrosaline Land Degradation by Using a Simple Approach of Remote Sensing Indicators.” In Agricultural Water Management, 77. doi:10.1016/j.agwat.2004.09.038.
- Khanal, Sami, John Fulton, Andrew Klopfenstein, Nathan Douridas, and Scott Shearer. 2018. “Integration of High Resolution Remotely Sensed Data and Machine Learning Techniques for Spatial Prediction of Soil Properties and Corn Yield.” Computers and Electronics in Agriculture 153. doi:10.1016/j.compag.2018.07.016.
- Kruse, Jens, Marion Abraham, Wulf Amelung, Christel Baum, Roland Bol, Oliver Kühn, Hans Lewandowski, et al. 2015. “Innovative Methods in Soil Phosphorus Research: A Review.” Journal of Plant Nutrition and Soil Science. doi:10.1002/jpln.201400327.
- Kumar, Manoj. 2015. “Phosphate Requirement of Acidic Soils in Northeast India: A Reappraisal Based on Phosphate Sorption Isotherms.” National Academy Science Letters 38 (5). doi:10.1007/s40009-015-0376-2.
- Laverdière, M. R., and A. Karam. 1984. “Sorption of Phosphorus by Some Surface Soils from Quebec in Relation to Their Properties.” Communications in Soil Science and Plant Analysis 15 (10): 1215–1230. doi:10.1080/00103628409367552.
- Li, M., Y. L. Hou, and B. Zhu. 2007. “Phosphorus Sorption-Desorption by Purple Soils of China in Relation to Their Properties.” Australian Journal of Soil Research 45 (3). doi:10.1071/SR06135.
- Liaw, Andy, and Matthew Wiener. 2002. “Classification and Regression with Random Forest.” R News 2.
- Maleki, Sedigheh, Farhad Khormali, Jahangir Mohammadi, Patrick Bogaert, and Mohsen Bagheri Bodaghabadi. 2020. “Effect of the Accuracy of Topographic Data on Improving Digital Soil Mapping Predictions with Limited Soil Data: An Application to the Iranian Loess Plateau.” Catena 195. doi:10.1016/j.catena.2020.104810.
- Malhotra, Hina, Sandeep Sharma Vandana, and Renu Pandey. 2018. “Phosphorus Nutrition: Plant Growth in Response to Deficiency and Excess.” In Plant Nutrients and Abiotic Stress Tolerance. doi:10.1007/978-981-10-9044-8_7.
- Malone, B. P., A. B. McBratney, B. Minasny, and G. M. Laslett. 2009. “Mapping Continuous Depth Functions of Soil Carbon Storage and Available Water Capacity.” Geoderma 154 (1-2): 138–152. doi:10.1016/j.geoderma.2009.10.007
- McBratney, A. B., M. L. Mendonça Santos, and B. Minasny. 2003. “On Digital Soil Mapping.” Geoderma 117 (1–2): 3–52. doi:10.1016/S0016-7061(03)00223-4.
- Meng, Cen, Huanyao Liu, Yuyuan Li, Jianlin Shen, Xi Li, Yue Deng, Dianlin Gong, and Jinshui Wu. 2022. “Influence Path Identification of Topography, Soil, Hydrology and Landscape on Phosphorus Buffering Capacity in Typical Agricultural Catchments in Central Subtropical China.” Journal of Environmental Management 315. doi:10.1016/j.jenvman.2022.115164.
- Michalak, J. 2004. “{DEM} Data Obtained from the Shuttle Radar Topography Mission–SRTM-3.” Ann. Geomat 2 (1): 33–44.
- Mihoub, Adil, Mustapha Daddi Bouhoun, and Mohamed Lakhdar Saker. 2016. “Phosphorus Adsorption Isotherm: A Key Aspect for Effective Use and Environmentally Friendly Management of Phosphorus Fertilizers in Calcareous Soils.” Communications in Soil Science and Plant Analysis 47 (16). doi:10.1080/00103624.2016.1206923.
- Mirchooli, F., M. Kiani-Harchegani, A. K. Darvishan, S. Falahatkar, and S. H. Sadeghi. 2020. “Spatial Distribution Dependency of Soil Organic Carbon Content to Important Environmental Variables.” Ecological Indicators 116: 106473. doi:10.1016/j.ecolind.2020.106473.
- Misbah, Khalil, Ahmed Laamrani, Keltoum Khechba, Driss Dhiba, and Abdelghani Chehbouni. 2022. “Multi-Sensors Remote Sensing Applications for Assessing, Monitoring, and Mapping Npk Content in Soil and Crops in African Agricultural Land.” Remote Sensing. doi:10.3390/rs14010081.
- Møller, Anders Bjørn, Goswin Heckrath, Cecilie Hermansen, Trine Nørgaard, Lis Wollesen de Jonge, and Mogens Humlekrog Greve. 2022. “Mapping the Phosphorus Sorption Capacity of Danish Soils with Quantile Regression Forests and Uncertainty Propagation.” SSRN Electronic Journal. doi:10.2139/ssrn.4213200.
- Mponela, Powell, Sieglinde Snapp, Grace B. Villamor, Lulseged Tamene, Quang Bao Le, and Christian Borgemeister. 2020. “Digital Soil Mapping of Nitrogen, Phosphorus, Potassium, Organic Carbon and Their Crop Response Thresholds in Smallholder Managed Escarpments of Malawi.” Applied Geography 124. doi:10.1016/j.apgeog.2020.102299.
- Murphy, J., and J. P. Riley. 1962. “A Modified Single Solution Method for the Determination of Phosphate in Natural Waters.” Analytica Chimica Acta 27 (C). doi:10.1016/S0003-2670(00)88444-5.
- Naimi, Salman, Shamsollah Ayoubi, Luis Augusto Di Loreto Di Raimo, and Jose Alexandre Melo Dematte. 2022. “Quantification of Some Intrinsic Soil Properties Using Proximal Sensing in Arid Lands: Application of Vis-NIR, MIR, and PXRF Spectroscopy.” Geoderma Regional 28. doi:10.1016/j.geodrs.2022.e00484.
- Nelson, D. W., and L. E. Sommers. 1996. “Total Carbon, Organic Carbon, and Organic Matter. BT – Methods of Soil Analysis. Part 3. Chemical Methods.” Methods of Soil Analysis. Part 3. Chemical Methods 5: 961–1010.
- Ng, W., B. Minasny, A. McBratney, P. de Caritat, and J. Wilford. 2023. “Digital Soil Mapping of Lithium in Australia.” Earth System Science Data Discussions, 1–25. doi:10.5194/essd-2022-418.
- Nikolakopoulos, Konstantinos G. 2003. “Use of Vegetation Indexes with ASTER VNIR Data for Burnt Areas Detection in Western Peloponnese, Greece.” International Geoscience and Remote Sensing Symposium (IGARSS) 5. doi:10.1109/igarss.2003.1294758.
- Parra, Jeison Sanchez, Zigomar Menezes de Souza, Stanley Robson Medeiros de Oliveira, Camila Viana Vieira Farhate, José Marques, and Diego Siqueira. 2022. “Phosphorus Adsorption Prediction Through Decision Tree Algorithm Under Different Topographic Conditions in Sugarcane Fields.” Catena 213. doi:10.1016/j.catena.2022.106114.
- Pierzynski, Gary M., Richard W. McDowell, and J. Thomas Sims. 2015. “Chemistry, Cycling, and Potential Movement of Inorganic Phosphorus in Soils.” 51–86. doi:10.2134/agronmonogr46.c3.
- Quinlan, J. R. 1992. “Learning with Continuous Classes.” In Australian Joint Conference on Artificial Intelligence.
- Quintero, Cesar E., Norma G. Boschetti, and René A. Benavidez. 2003. “Effect of Soil Buffer Capacity on Soil Test Phosphorus Interpretation and Fertilizer Requirement.” Communications in Soil Science and Plant Analysis 34 (9–10). doi:10.1081/CSS-120020455.
- Raven, K. P., and L. R. Hossner. 1994. “Sorption and Desorption Quantity-Intensity Parameters Related to Plant-Available Soil Phosphorus.” Soil Science Society of America Journal 58 (2). doi:10.2136/sssaj1994.03615995005800020024x.
- Ray, Shibendu, J. Singh, Gargi Das, and S. Panigrahy. 2004. “Use of High Resolution Remote Sensing Data for Generating Site-Specific Soil Management Plan,” 1–5.
- Rayment, G. E. E., and F. R. R. Higginson. 1992. “Australian Laboratory Handbook of Soil and Water Chemical Methods.” In Australian Soil and Land Survey Handbook.
- Recena, Ramiro, Isabel Díaz, María Carmen del Campillo, José Torrent, and Antonio Delgado. 2016. “Calculation of Threshold Olsen P Values for Fertilizer Response from Soil Properties.” Agronomy for Sustainable Development 36 (4). doi:10.1007/s13593-016-0387-5.
- Reddy, N. N., and B. S. Das. 2023. “Digital Soil Mapping of key Secondary Soil Properties Using Pedotransfer Functions and Indian Legacy Soil Data.” Geoderma 429: 116265. doi:10.1016/j.geoderma.2022.116265
- Rhoades, J. D.. 1982. “Cation exchange capacity.” In Methods of soil analysis. Part 2. Chemical and Microbiological Properties , edited by A. L. Page, R. H. Miller , and D. R. Keeney, 149–157. Madison, Wisconsin: American Society of Agronomy, Inc. Soil Science Society of America. Inc.
- Rizzo, Rodnei, José A.M. Demattê, Igo F. Lepsch, Bruna C. Gallo, and Caio T. Fongaro. 2016. “Digital Soil Mapping at Local Scale Using a Multi-Depth Vis-NIR Spectral Library and Terrain Attributes.” Geoderma 274. doi:10.1016/j.geoderma.2016.03.019.
- Roecker, S. M., and J. A. Thompson. 2010. “Scale Effects on Terrain Attribute Calculation and Their Use as Environmental Covariates for Digital Soil Mapping.” In Digital Soil Mapping. doi:10.1007/978-90-481-8863-5_5.
- Samadi, A. 2006. “Phosphorus Sorption Characteristics in Relation to Soil Properties in Some Calcareous Soils of Western Azarbaijan Province.” Journal of Agricultural Science and Technology 8.
- Sánchez-Alcalá, I., M. C. del Campillo, V. Barrón, and J. Torrent. 2014. “The Olsen P/Solution P Relationship as Affected by Soil Properties.” Soil Use and Management 30 (4): 454–462. doi:10.1111/sum.12141.
- Shabou, Marouen, Bernard Mougenot, Zohra Lili Chabaane, Christian Walter, Gilles Boulet, Nadhira Ben Aissa, and Mehrez Zribi. 2015. “Soil Clay Content Mapping Using a Time Series of Landsat TM Data in Semi-Arid Lands.” Remote Sensing 7 (5). doi:10.3390/rs70506059.
- Shahabifar, Jafar, Ebrahim Panahpour, Farhad Moshiri, Ali Gholami, and Mehrzad Mostashari. 2019. “The Quantity/Intensity Relation Is Affected by Chemical and Organic P Fertilization in Calcareous Soils.” Ecotoxicology and Environmental Safety 172. doi:10.1016/j.ecoenv.2019.01.058.
- Shen, Jianbo, Lixing Yuan, Junling Zhang, Haigang Li, Zhaohai Bai, Xinping Chen, Weifeng Zhang, and Fusuo Zhang. 2011. “Phosphorus Dynamics: From Soil to Plant.” Plant Physiology 156 (3). doi:10.1104/pp.111.175232.
- Shirvani, Mehran, Hosein Shariatmadari, and Mahmoud Kalbasi. 2005. “Phosphorus Buffering Capacity Indices as Related to Soil Properties and Plant Uptake.” Journal of Plant Nutrition 28 (3). doi:10.1081/PLN-200049235.
- Soil Survey Staff – NRCS/USDA. 2014. “Keys to Soil Taxonomy.” Soil Conservation Service 12.
- Tajik, Samaneh, Shamsollah Ayoubi, Hossein Shirani, and Mojtaba Zeraatpisheh. 2019. “Digital Mapping of Soil Invertebrates Using Environmental Attributes in a Deciduous Forest Ecosystem.” Geoderma 353. doi:10.1016/j.geoderma.2019.07.005.
- Thomas, Cathy L., Javier Hernandez-Allica, Sarah J. Dunham, Steve P. McGrath, and Stephan M. Haefele. 2021. “A Comparison of Soil Texture Measurements Using Mid-Infrared Spectroscopy (MIRS) and Laser Diffraction Analysis (LDA) in Diverse Soils.” Scientific Reports 11 (1). doi:10.1038/s41598-020-79618-y.
- Triantafilis, John, Scott Mitchell Lesch, Kevin La Lau, and Sam Mostyn Buchanan. 2009. “Field Level Digital Soil Mapping of Cation Exchange Capacity Using Electromagnetic Induction and a Hierarchical Spatial Regression Model.” Australian Journal of Soil Research 47 (7). doi:10.1071/SR08240.
- Vapnik, Vladimir N. 1995. “The Nature of Statistical Learning Theory.” The Nature of Statistical Learning Theory. doi:10.1007/978-1-4757-2440-0.
- Vaudour, E., C. Gomez, Y. Fouad, and P. Lagacherie. 2019. “Sentinel-2 Image Capacities to Predict Common Topsoil Properties of Temperate and Mediterranean Agroecosystems.” Remote Sensing of Environment 223: 21–33. doi:10.1016/j.rse.2019.01.006.
- White, Philip J., and John P. Hammond. 2008. “Phosphorus Nutrition of Terrestrial Plants.” doi:10.1007/978-1-4020-8435-5_4.
- Wilding, L. P. 1985. “Spatial Variability: Its Documentation, Accommodation and Implication to Soil Surveys.” Soil Spatial Variability.
- Wilson, Stewart, Kerri Steenwerth, and Anthony O’Geen. 2023. “Mapping Phosphorus Sorption and Availability in California Vineyard Soils Using an Ensemble of Machine Learning Models.” Soil Science Society of America Journal 87 (1). doi:10.1002/saj2.20487.
- Wisawapipat, Worachart, Irb Kheoruenromne, Anchalee Suddhiprakarn, and Robert J. Gilkes. 2009. “Phosphate Sorption and Desorption by Thai Upland Soils.” Geoderma 153 (3–4). doi:10.1016/j.geoderma.2009.09.005.
- Zeraatpisheh, Mojtaba, Shamsollah Ayoubi, Azam Jafari, and Peter Finke. 2017. “Comparing the Efficiency of Digital and Conventional Soil Mapping to Predict Soil Types in a Semi-Arid Region in Iran.” Geomorphology 285. doi:10.1016/j.geomorph.2017.02.015.