
 ?Mathematical formulae have been encoded as MathML and are displayed in this HTML version using MathJax in order to improve their display. Uncheck the box to turn MathJax off. This feature requires Javascript. Click on a formula to zoom.
ABSTRACT
Downward shortwave radiation (DSR) is a critical variable in energy balance driving Earth’s surface processes. Satellite-derived and reanalysis DSR products have been developed and continuously improved during the last decades. However, as those products have different temporal resolutions, their performances in different time scales have not been well-documented, particularly in China. This study intended to evaluate several DSR products across multiple time scales (i.e. instantaneous, 1-hourly, daily, and monthly average) and ecosystems in China. Six DSR products, including GLASS, BESS, CLARA-A2, MCD18A1, ERA5 and MERRA-2, were evaluated against ground measurements at Chinese Ecosystem Research Network (CERN) and integrated land-atmosphere interaction observation (TPDC) sites from 2009 to 2012. The instantaneous DSR of MCD18 showed a root mean square error (RMSE) of 146.02 W/m2. The hourly RMSE of ERA5 (155.52 W/m2) was largely smaller than MERRA-2 (188.53 W/m2). On the daily and monthly scale, BESS had the most optimized accuracy among the six products (RMSE of 36.82 W/m2). For the satellite-derived DSR products, the monthly accuracy at CERN can meet the threshold accuracy requirement set by World Meteorological Organization (WMO) for Global Numerical Weather Prediction (20 W/m2).
1. Introduction
Surface downward shortwave radiation (DSR) is the total solar irradiance from 0.3–3.0 μm reaching the Earth's surface. As a critical component of the surface radiation budget (SRB), DSR is essential for biological, geophysical, and ecological processes (Liang et al. Citation2019). Moreover, it is an important input for land surface numerical models such as irrigation scheduling and crop growth simulation models (Shook and Pomeroy Citation2011; Jiang et al. Citation2019). Therefore, accurate DSR estimation and characterization of its regional and global variabilities are crucial for climate monitoring and ecosystem research.
Ground measurements provide the most accurate DSR observations (Hartmann et al. Citation2013); however, they are limited by sparse spatial distribution and coverage owing to the high costs of building and maintaining an observation platform (Jahani et al. Citation2017). Alternatively, satellite-derived and reanalysis products are available for global and regional DSR monitoring (Yang and Bright Citation2020). Satellite-derived DSR products play a critical role in accurate DSR estimations because satellite observations provide a unique perspective on radiation at the top of the atmosphere (TOA; Hilburn et al. Citation2015). Reanalysis products can provide long-term historical DSR estimates from data assimilation that combines geophysical process dynamics models with ground and satellite measurements (Besharat, Dehghan, and Faghih Citation2013; Zhang et al. Citation2016). Unfortunately, reanalysis and satellite-derived DSR products are subject to uncertainties such as inaccurate retrieval of clouds and aerosols (Huang et al. Citation2019), topographic effects (Ma et al. Citation2023), geolocation, radiometric errors in sensor measurements (Liang et al. Citation2010), and simplified retrieval algorithms (Letu et al. Citation2020). Therefore, comprehensive evaluations should be performed to elucidate the uncertainties and deviations in DSR estimates.
In 2011, the World Meteorological Organization (WMO) published accuracy requirements/recommendations for DSR products for four specific applications (WMO Citation2022; ). The requirements are divided into three levels: goals, breakthroughs, and thresholds. In 2022, the Global Climate Observing System (GCOS) program published the 2022 GCOS Implementation Plan and the 2022 ECV Requirements for DSR (GCOS Citation2022); 1, 5, and 10 W/m2 were set as the goal, breakthrough, and threshold, respectively. Huang et al. (Citation2019) summarized the typical accuracy of DSR products for different time scales. For the instantaneous scale, the root means square error (RMSE) for a clear sky condition is below 50 W/m2, while that of a cloudy sky condition is 60–140 W/m2. The RMSE for daily DSR of high-resolution kilometer-scale products is ∼35 W/m2 (∼10% of the mean DSR), and the monthly RMSE has been reported to be below 10 W/m2. DSR records at different timescales are suitable for different applications and have distinct requirements (). Instantaneous DSR represents the inversion capability of the satellite. Hourly DSR records detail solar radiation changes within a day, which are required for nowcasting and numerical weather prediction (WMO Citation2022), diurnal variabilities of solar-induced fluorescence (Damm et al. Citation2010), and solar energy utilization in photovoltaic power plants (Voyant et al. Citation2012). The daily scale is the most common temporal scale for current DSR products (Slater Citation2016). Daily DSR estimates are required for agricultural meteorology and climate monitoring (Abraha and Savage Citation2008). Although monthly DSR records are not practical for precise climate monitoring, validation results on a monthly scale can disclose systematic biases in the algorithm (Hilburn et al. Citation2015) by reducing random errors. Monthly DSR records are also capable of detecting long-term climate trends and characterizing solar dimming and brightening (SDB; Yang et al. Citation2022). Annual DSR records are related to photovoltaic power, and their trends are frequently used to capture SDB and climate change (Tang et al. Citation2017; Fang et al. Citation2021).
Table 1. Quantitative requirements for DSR collected by WMO in weather, water, and climate-related areas (WMO Citation2022).
China necessitates an examination of DSR product performance because of its heavy aerosol load accompanied by rapid urbanization and economic development (Li et al. Citation2018; Guo et al. Citation2019; Lou et al. Citation2019). The Qinghai–Tibet Plateau (QTP), located in western China, is characterized by varied topography and complex atmospheric conditions that substantially impact atmospheric circulation and the energy budget (Yang et al. Citation2008; Wang et al. Citation2022). Therefore, DSR product validation on the QTP should be given additional consideration. Numerous validations and assessments of DSR products have been conducted using ground measurements from China Meteorological Administration (CMA) network stations. For the DSR reanalysis products, Zhang et al. (Citation2020) evaluated monthly records from ERA-Interim and MERRA-2 using surface measurements from the CMA network station from 2000 to 2009. They pointed out that both ERA-Interim and MERRA-2 products overestimate DSR in China, with MERRA-2 overestimation being more pronounced (18.28 W/m2 bias for ERA-Interim and 43.84 W/m2 bias for MERRA-2). Jiang et al. (Citation2020) evaluated global, direct, and diffuse DSR from the ERA5 across China using CMA stations. They concluded that ERA5 underestimated hourly diffuse radiation by 43.08 W/m2 but overestimated total solar and direct radiation by 30.87 and 73.95 W/m2, respectively. Less work has been done for satellite-derived products. Zhang et al. (Citation2022) evaluated daily and monthly DSR estimates of CERES using CMA stations and documented RMSE and MBE of 21.2 (31.6) W/m2 and 4.8 (6.2) W/m2 at the monthly (daily) scale, respectively. Wang et al. (Citation2018) reported that CLARA-A2 and SARAH-E overestimated monthly global solar radiation by 10.0 and 7.5 W/m2 compared with ground measurements from CMA stations for 1993–2015 and 1999–2015, respectively. Nevertheless, most of these validation studies have been conducted at certain temporal scales and with little focus on ecosystems.
However, determining DSR accuracy across different temporal scales is crucial for meeting the requirements of various applications and research studies (Huang et al. Citation2019). In addition, potential changes in the land-atmosphere feedback of ecosystems may create major uncertainties in the energy budget (Heffernan et al. Citation2014) and exhibit different DSR features in various ecosystems. Therefore, it is necessary to conduct product evaluations in different ecosystems.
With a 1 h temporal resolution for DSR records and ecosystem monitoring, the Chinese Ecosystem Research Network (CERN) is an ideal alternative to the CMA network to conduct multi-temporal-scale DSR product evaluation. As an ecosystem research network, CERN provides valuable long-term ecological research by answering the question, ‘How can ecosystem structures be both a cause and consequence of ecological fluxes of energy?’(Li et al. Citation2015; Mirtl et al. Citation2018) Integrated land-atmosphere interaction observations (hereafter referred to as TPDC) can provide ground measurements in the QTP and elucidate the performance of DSR products.
Using CERN and TPDC data from 2009 to 2012, we aimed to validate and compare the multi-temporal-scale (hourly, daily, and monthly) and ecosystem-based performance of widely used surface parameter products and their newest DSR versions (GLASS, BESS, MCD18A1, CLARA-A2, ERA5, and MERRA-2) in China. Additionally, we studied their performance across different seasons and compared their interannual variation trends. Moreover, we investigated the spatial patterns of the products and accessed their quantitative discrepancies across China. The remainder of this paper is organized as follows. The DSR products and ground measurements are introduced in Section 2. The processing procedures, accuracy statistical metrics, and interannual analysis method used in this study are presented in Section 3. The results and analysis are presented in Section 4. The discussion and conclusions are presented in sections 5 and 6, respectively.
2. Materials
The latest versions of the most widely used DSR products were selected for this study. lists the temporal and spatial resolutions, temporal ranges, and estimation methods for the DSR products. Details of each DSR product are presented in Section 2.1.
Table 2. Summary of the data sources used in the evaluation.
2.1. Satellite-derived and reanalysis of DSR products
2.1.1. Global land surface satellite-DSR
Production of the Global Land Surface Satellite (GLASS) product suite began in 2009 (Liang et al. Citation2013a; Liang et al. Citation2013), and subsequent development enhanced the accuracy and quality of the products (Liang et al. Citation2021). The old version of GLASS DSR was enhanced by improving the look-up table (LUT) method using visible-band TOA radiance from multi-source polar-orbiting and geostationary satellite data (Zhang et al. Citation2014). However, this development was limited by (i) poor performance among bright objects, such as snow – and ice-covered areas, and (ii) high time consumption for processing and constructing long-term DSR products. Therefore, the GLASS DSR product (V60) was created from Moderate Resolution Imaging Spectroradiometer (MODIS) TOA spectral reflectance using a direct-estimation method (Zhang et al. Citation2019). GLASS DSR outputs daily average data with a spatial resolution of 0.05°, which can be obtained from http://www.glass.umd.edu/DSR/ (last accessed May 3, 2023).
2.1.2. Breathing earth system simulator radiation
The Breathing Earth System Simulator (BESS) is a simplified process-based model that couples atmospheric and canopy radiative transfers, canopy photosynthesis, transpiration, and energy balance. The BESS DSR products were first published in 2017 at 0.05°daily and 0.5° monthly resolutions (Ryu et al. Citation2018). DSR products were generated using a combination of an atmospheric radiative transfer model and an artificial neural network (ANN). The ANN was fed with various land and atmospheric data from MODIS. BESS DSR data from 2000 to 2019 can now be obtained from https://www.environment.snu.ac.kr/bess-rad (last accessed May 3, 2023).
2.1.3. CM SAF cloud, albedo and surface radiation-A2
The CLARA-A2 record provides cloud properties, surface albedo, and surface radiation parameters derived from the Advanced Very High Resolution Radiometer (AVHRR) sensor onboard the polar-orbiting NOAA and METOP satellites (Karlsson et al. Citation2017). Surface radiation products included daily and monthly average DSR estimates. The retrieval of DSR is an LUT-based method (Mesoscale Atmospheric Global Irradiance Code, MAGIC) proposed by Mueller et al. (Citation2009) that uses satellite-derived radiances in the visible and near-infrared AVHRR satellite channels. The nowcasting SAF software (PPSv2014) was used to distinguish between cloudy and clear-sky pixels. Monthly and daily averages are available on a 0.25° × 0.25° global grid and cover 34 years (1982–2015). The data can be accessed free from https://wui.cmsaf.eu/safira/action/viewDoiDetails?acronym = CLARA_AVHRR_V002 (last accessed May 3, 2023).
2.1.4. MCD18A1
MCD18A1 is a high-resolution global DSR product founded by NASA and distributed by the NASA EOSDIS Land Processes DAAC. The first version of MODIS DSR was released in 2017 as Collection 6 and provided a spatial resolution of 5 km and a temporal resolution of 3 h from 2000 to 2017 (Wang Citation2017). In the 2021 version of MCD18A1 (Version 6.1), the spatial resolution was improved to 1 km, and certain programming errors in the earlier version were resolved (Wang Citation2021). An LUT-based retrieval strategy was selected as the primary operational algorithm to generate products, mainly from TOA satellite observations based on MODIS Terra and Aqua. The direct use of TOA data reduces data gaps and error accumulation compared with atmospheric-parameter-based (e.g. aerosol and cloud) DSR estimation strategies (Wang et al. Citation2020). Users can access the data at https://lpdaac.usgs.gov/products/mcd18a1v061/ (last accessed May 3, 2023).
2.1.5. ERA5
ERA5 is a reanalysis dataset obtained from the European Center for Medium-Range Weather Forecasts (ECMWF; Muñoz Sabater Citation2019). Based on the Integrated Forecasting System (IFS) Cy41r2, ERA5 benefits from 10 years of modeling and assimilation techniques (such as the Rapid Radiative Transfer Model shortwave scheme; Hersbach et al. Citation2020). The most notable improvement in the ERA5 dataset is its significantly higher spatial (0.25°) and temporal (hourly) resolutions {Dee et al. Citation2011 #314} compared with its precursors (ERA-15, ERA-40, and ERA-Interim). We used the ‘Shortwave Solar Radiation Downward’ variable from ‘ERA5 hourly data on single levels from 1940 to the present’ (hereafter referred to as ‘ERA5 DSR’). The ERA5 hourly DSR data were accessed from the Climate Data Store (CDS) at https://cds.climate.copernicus.eu/cdsapp#!/dataset/reanalysis-era5-single-levels?tab = overview (last accessed May 3, 2023).
2.1.6. Modern-Era retrospective analysis for research and applications version 2
The Modern-Era Retrospective Analysis for Research and Applications Version 2 (MERRA-2) was produced by the Global Modeling and Assimilation Office (GMAO; Gelaro et al. Citation2017). MERRA-2 is a timely replacement for MERRA and has made significant progress toward GMAO’s goal of Earth System reanalysis (Kleist et al. Citation2009; Molod et al. Citation2015). MERRA-2 implements version 5.12.4, of the GEOS atmospheric data assimilation system (including the GEOS atmospheric model and GSI analysis scheme). The spatial resolution of the MERRA-2 DSR data is 0.5° × 0.625°, and the temporal resolutions are 1 h and monthly. The variable used in our experiment, Surface Downward Shortwave Flux (henceforth referred to as ‘MERRA-2 DSR’), can be downloaded from https://disc.gsfc.nasa.gov/datasets/M2T1NXRAD_5.12.4/summary?keywords = MERRA-2%20tavg1_2d_rad_Nx (last accessed May 3, 2023).
2.2. Ground measurements
We gathered 4 years (2009-2012) of ground measurements from 48 sites, including 31 from CERN (Fu et al. Citation2010), 6 sites from the TPDC (Ma et al. Citation2020), and 11 sites from the Global Energy Balance Archive (GEBA) network. The distribution of these sites is shown in .
Figure 1. Geographical distribution of the observation stations used in this study from CERN (stations represented by circles, different colors indicate different ecosystems), TPDC (stations represented by orange triangles), and GEBA (stations represented by cyan rectangles).
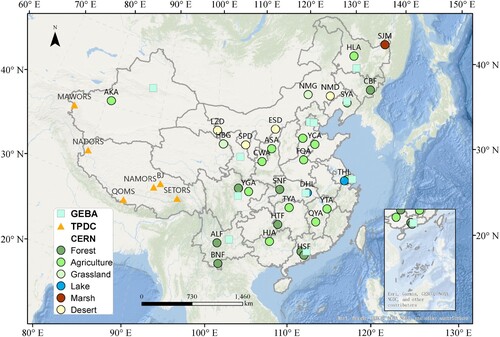
Supported by the Chinese Academy of Sciences (CAS), CERN was established in 1988 (Fu et al. Citation2010). Each ground observation in CERN collects hourly total incoming radiation (305–2800 nm) using a pyranometer CM11 (Kipp & Zonen, Delft, The Netherlands), with an accuracy of 5%. After registration and application, we collected data for 31 sites from CERN, including 14 agricultural sites, 8 forest stations, 2 grassland sites, 4 desert sites, 1 marsh sites, and 2 lake ecosystem sites. For data privacy for the 1-h scale records of CERN, nine sites (ASA, CWA, DHF, LCA, LZD, NMD, YGA, AKA, and HJA) provided available hourly scale records; the other 22 sites were recorded on a daily scale.
In addition to CERN, TPDC was implemented to characterize the accuracy of the DSR product on the Tibetan Plateau. Most of the TPDC stations used four-component radiometers (Hukseflux NR01 and Kipp & Zonen CNR 1) with an accuracy of 10% and spectral range of 285−3000 nm (Ma et al. Citation2020). BJ station was an exception, as it uses CM21 (Kipp & Zonen, Delft, The Netherlands) with an accuracy of
2% and spectral range of 300−2800 nm. In the trend analysis section, GEBA (http://www.geba.ethz.ch; Wild et al. Citation2017) was included to illustrate DSR variance. Maintained by ETH Zürich, GEBA collects monthly means of DSR measurements globally. Estévez et al. (Citation2022) estimated that the accuracy of monthly mean values was 5% in terms of relative random measurement error.
3. Methodology
3.1. Quality control of ground measurements
As ground measurements were used as true values to gauge the accuracy of the gridded products, their quality was crucial for the correctness of the validation results. Previous studies have shown that ground measurements obtained in China are limited with respect to reliability owing to technical failures and operation-related problems (Xu et al. Citation2008; Tang et al. Citation2010). Therefore, we applied a quality control (QC) procedure to hourly measurements (nine sites described in Section 2.2) based on the study performed by Espinar et al. (Citation2012). The identifiable faulty data and inaccurate measurements were eliminated using the following three filters:
,
where SEA is the solar elevation angle, is the global horizontal irradiance on the ground,
is the global horizontal irradiance at TOA, and
is the normal beam irradiance at TOA.
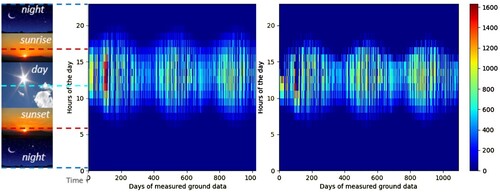
In the first two filters, GHIGRD night values or negative values at sunrise and sunset were identified and set to zero. Subsequently, the QC procedure for the BSRN proposed by the WMO was implemented. The extremely rare limit (ERL; De Miguel et al. Citation2001; Muneer and Fairooz Citation2002; Long and Dutton Citation2010) excludes records that cannot guarantee logical minimum and maximum values. Therefore, only data that passed the three limits were retained. shows the data before and after quality control, taking 1,095 days of data (from 2009 to 2011) from the CERN CWA site as an example. Certain unstable values at the day–night threshold (i.e. at sunrise and sunset) and anomalous records above the set threshold were removed.
Figure 2. 1095 days data from CWA site before and after the quality control (The colors indicate the value of hourly DSR, the vertical coordinates indicate the variation in radiation values over the 24 h of the day, and the horizontal coordinates indicate the variation in data for each day over the three years).
3.2. Spatio-temporal matching of products and ground measurements
The investigated DSR products (see Section 2.1) have spatial resolutions ranging from 1 km to 0.5° and temporal resolutions of instantaneous, 1-hourly, daily, and monthly. Therefore, the spatiotemporal matching of different products is a prerequisite for ensuring that all validated data are comparable.
For the spatial scale, the products were validated and compared at a uniform spatial resolution of 0.5° × 0.5°, as recommended by Huang et al. (Citation2016). If the spatial resolution of the DSR product was finer than 0.5° × 0.5°, the station location (data point) was regarded as the window center, and the data within 0.5° × 0.5° windows were resampled into the target resolution. The results presented in this study refer to those aggregated to a grid of 0.5° × 0.5° unless otherwise mentioned.
For the temporal scale, one of the greatest limitations of sub-daily scale validation is the time mismatch between ground measurements and DSR products. In this study, the hourly ground measurements nearest to the instantaneous/hourly stamps of the DSR products were used as the ground reference. Daily and monthly observation records were generated using the following steps. On a daily scale, nine quality-controlled hourly measurements (see Section 2.2) were averaged into a daily scale if there were more than 20 valid observations per day. Moreover, the 22 stations that were initially provided on a daily scale were combined for validation. In other words, 9 plus 22 stations were included in the daily scale validation. On a monthly scale, at least six daily data points should be recorded every 10 days for 1 month (in February, daily data should be recorded for more than 18 days).
3.3. Statistical metrics
3.3.1. Evaluation with ground measurements
Following the aforementioned processing procedures, the DSR products were evaluated by comparing the surface measurements with their collocated grid values. R2, MBE, relative MBE (rMBE), RMSE, and relative RMSE (rRMSE) were used to characterize the accuracy of the DSR estimates. The correlation coefficient is an important index; the closer it is to the ideal value of 1, the more ‘in phase’ the ground measurements and product estimates are. MBE indicates the average over- or underestimation of the product estimates compared with reference datasets, and RMSE indicates the uncertainty of the product estimates. The formulas for these indicators are as follows:
(1)
(1)
(2)
(2)
(3)
(3) where
is the product estimate of the DSR,
is the ground radiation measurement,
is the number of samples, and
is the average of the ground measurements.
3.3.2. Product intercomparison
To explore the differences between products directly and continuously, we calculated the 2009 annual mean values of the DSR products instead of using discrete ground measurements as an intermediary. The difference was represented by calculating the deviation between the collocated annual mean values using R (linear correlation), rRMSD (relative root mean square deviation), and rMBD (relative mean bias deviation). The formulas for these indicators are as follows:
(4)
(4)
(5)
(5)
(6)
(6)
Note that (r)RMSD and (r)MBD were calculated using formulas similar to those for (r)RMSE and (r)MBE listed in (equations Equation2(2)
(2) and Equation3
(3)
(3) ). Herein, ‘Deviation (D)’ was used instead of ‘error (E)’ because in this case, one product (
)
was compared with a product (
) other than the ‘true value'.
3.4. Interannual variation analysis
We used the Mann–Kendall (M–k) test and Sen's slope estimator to assess the trend of DSR in the time series data. The M–k test is a non-parametric method suitable for environmental, meteorological, and hydrological time series data. Sen's slope estimator is a robust method for estimating the magnitude and direction of trends. Statistical significance at the 95% confidence level was used to ensure high confidence in trend estimates. We employed deseasonalized monthly anomalies [DA(m)], defined as follows:
(7)
(7) where
is the monthly mean DSR in a year and
is the corresponding averaged value. DSR anomalies were preferred to absolute DSR in the computation of the trends of the time series because the use of deseasonalized anomalies minimizes the seasonal variability of the component.
4. Results and analysis
4.1. Multiple-temporal scale evaluation
4.1.1. Sub-daily scale evaluation
At sub-daily scales, we separated the products into clear, cloudy, and all-sky conditions to evaluate their performances under different sky conditions. The division was based on the clearness index (difference between observed DSR and TOA). If the clearness index was > 0.5, the threshold used by Cao et al. (Citation2016), the hourly DSR value was considered to indicate clear-sky conditions. Otherwise, it was treated as a cloudy-sky observation.
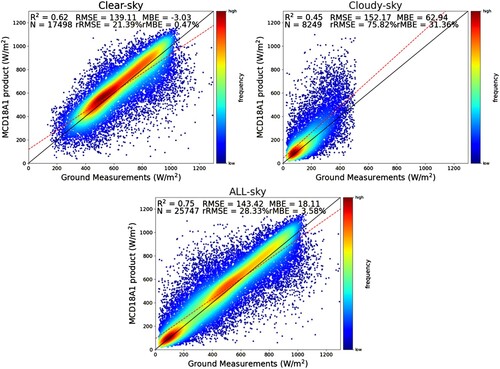
First, we compared the quality-controlled hourly DSR ground measurements of CERN with instantaneous estimates of MCD18A1. The evaluation results of MCD18A1 under different sky conditions are shown in . Under all-sky conditions, R2 was 0.75, RMSE was143.42 W/m2, and MBE was 18.11 W/m2. The results under clear-sky conditions show that (r)RMSEs were (21.39%) 139.11 W/m2 with a slight underestimation (MBE of −3.03 W/m2). Under cloudy-sky conditions, the performance deteriorated substantially: (r)RMSEs were (75.82%) 152.17 W/m2 with (r)MBE of (31.36%) 62.94 W/m2.
Figure 3. Evaluation results of instantaneous DSR estimates of MCD18A1 against nine sites from CERN under different conditions from 2009–2012: all-sky, clear-sky, and cloudy-sky conditions. The warm colors represent the high density of samples, while the cool colors represent low density, and the following density scatter plots have the same color scheme.
and show the validation results under different sky conditions for hourly DSR estimations from ERA5 and MERRA-2, respectively. Under all-sky conditions, the overall RMSE (MBE) for ERA5 was 155.52 (32.14) W/m2. In terms of MERRA-2, the overall RMSE (MBE) was 188.53 (72.7) W/m2. These results are consistent with those of previous studies (Liang et al. Citation2010; Huang et al. Citation2019; Jiang et al. Citation2020), thereby indicating that both the ERA5 and MERRA-2 products overestimate DSR in China, with the overestimation of MERRA-2 being more apparent.
Figure 4. As but for hourly estimates of ERA5.
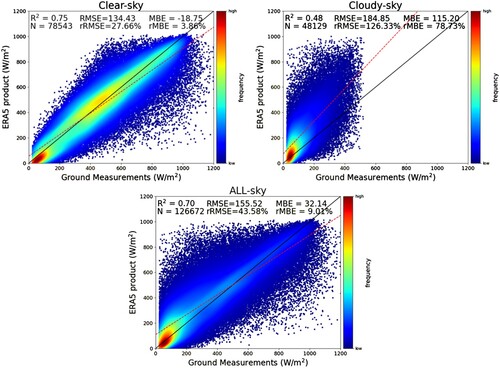
Figure 5. As but for hourly estimates of MERRA-2.
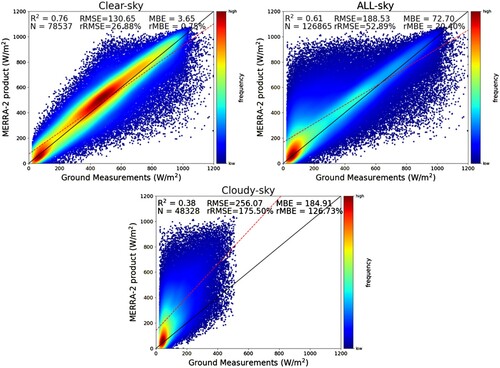
For clear-sky conditions, the reanalysis products showed good agreement between the DSR estimates and ground-based measurements. The (r)RMSEs were (27.66%) 134.43, and (26.88%) 130.65 W/m2 for ERA5 and MERRA-2, respectively. In terms of MBE, ERA5 tended to underestimate DSR with an MBE of −18.75 W/m2: MERRA-2 slightly underestimated DSR with an MBE of 3.65 W/m2.
Under cloudy-sky conditions, performance deteriorated substantially. The (r)RMSEs were (126.33%) 184.85, and (175.50%) 256.07 W/m2 for ERA5 and MERRA-2, respectively. A different degree of overestimation was observed for the reanalysis products; (r)MBEs were (78.73%) 115.20 and (126.73%) 184.91 W/m2, for ERA5 and MERRA-2, respectively.
4.1.2. Daily scale evaluation
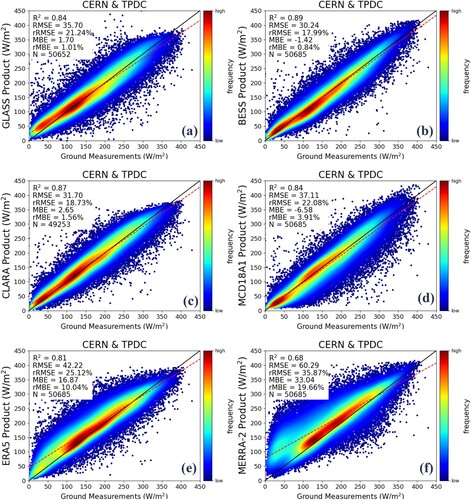
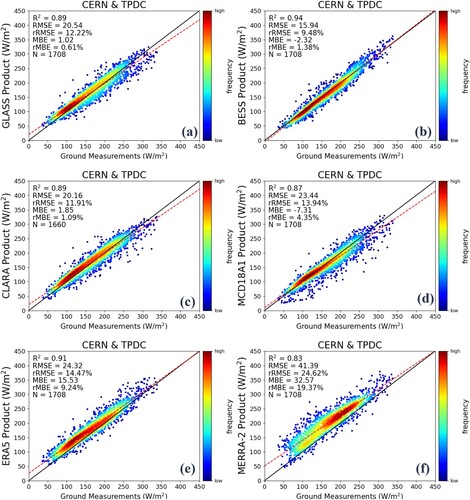
MERRA-2, ERA5, and MCD18A1 do not directly provide daily DSR values. Therefore, we aggregated the hourly DSR estimates of MERRA-2 and ERA5 and the 3-hourly DSR estimates of MCD18A1 to the daily DSR using a simple averaging approach. The daily DSR estimates calculated from the products were validated against CERN sites (), TPDC sites (), and all sites (). The MBEs of ERA5 were 16.87 W/m2 for all sites, and 16.58 and 18.60 W/m2 for CERN and TPDC sites, respectively. The MBEs of MERRA-2 were 33.04 W/m2 for all sites, and 33.91 and 27.96 W/m2 for CERN and TPDC sites, respectively. The four satellite-derived products showed an apparent underestimation of the TPDC records. In CERN, GLASS and CLARA tended to overestimate DSR with an MBE of approximately 7 W/m2, whereas BESS and MCD18A1 tended to underestimate DSR with an MBE of approximately −2 W/m2. The discrepancy over CERN finally led to differences in the overall MBEs, which were 1.70, −1.42, 2.65, and −6.58 W/m2 for GLASS, BESS, CLARA, and MCD18A1, respectively. The overall RMSE values ranging from small to large were 30.24 W/m2 (BESS), 31.70 W/m2 (CLARA), 35.70 W/m2 (GLASS), 37.11 W/m2 (MCD18A1), 44.22 W/m2 (ERA5), and 60.29 W/m2 (MERRA-2). Based on the results, the satellite-derived products performed better than the reanalysis products overall (Babar, Graversen, and Boström Citation2019). However, neither met the thresholds set by the WMO.
Figure 6. Evaluation results of daily DSR values against CERN network: (a) GLASS; (b) BESS; (c) CLARA; (d) MCD18A1; (e) ERA5; (f) MERRA-2.
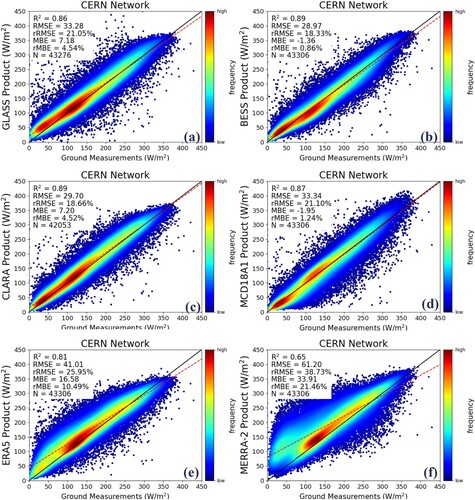
Figure 7. Evaluation results of daily DSR values against TPDC network: (a) GLASS; (b) BESS; (c) CLARA; (d) MCD18A1; (e) ERA5; (f) MERRA-2.
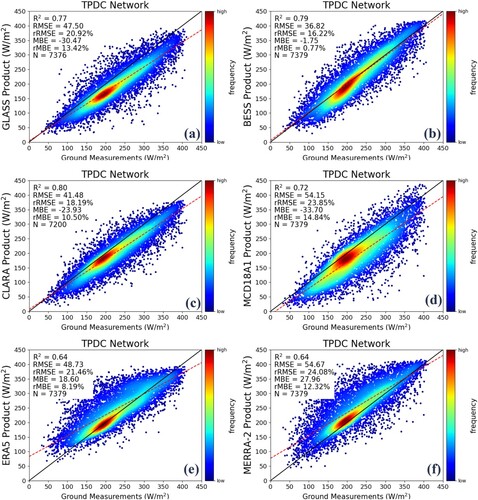
Figure 8. Evaluation results of daily DSR values against ground measurements combing CERN and TPDC together: (a) GLASS; (b) BESS; (c) CLARA; (d) MCD18A1; (e) ERA5; (f) MERRA-2.
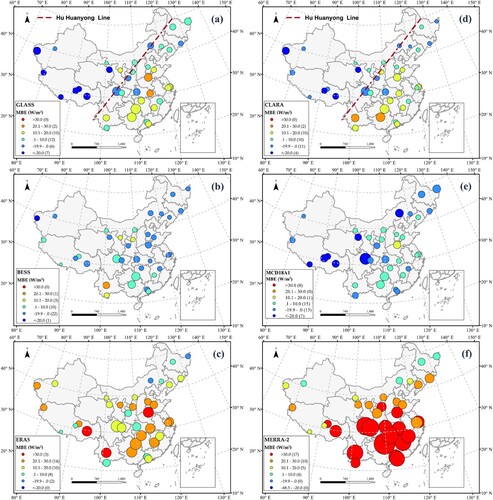
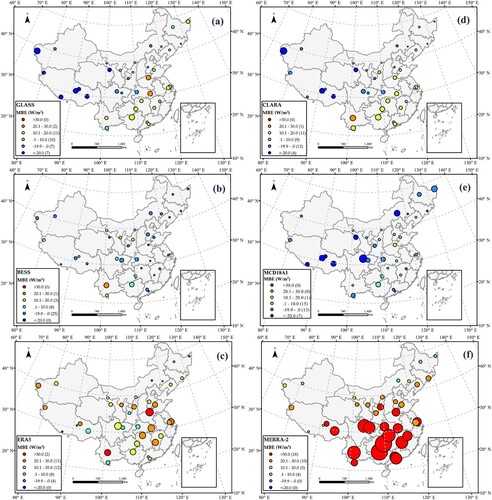
shows the geographical distribution of the statistical metrics. The size of the dots varies from small to large, corresponding to the value of rRMSEs, and the color of the dots varies from blue (the greater the underestimation, the bluer) to red (the greater the overestimation, the redder), corresponding to the value of MBE. The reanalysis products showed an overestimation for almost all stations, and ERA5 dominated MERRA-2 except for AKA, NMG, and MAWORS. Consistent with the hourly timescale validation, the performances of sites in southern China were poorer than those of sites in northern China. Satellite-derived products perform differently in various locations and ecosystems. The optimal retrieval regions were desert sites in Northwest China (MBEs < 10 W/m2) The poorest retrieval was observed over the QTP, with passive MBE of < −20 W/m2 except for BESS, which outperformed the other products with smaller MBEs by approximately 10 W/m2. GLASS and CLARA yielded different accuracies on the two sides of the Hu Huanyong Line (Hu Line, population density boundary; dotted red lines in a and d). The sites west of the Hu Line (23 of 26 for GLASS and 21 of 26 for CLARA) mainly yielded positive MBEs, whereas MBEs east of the Hu Line tended to be negative. This coincidence may result from increasing aerosol loading accompanied by dramatic urbanization in southeastern China (Wang et al. Citation2022). As suggested by previous studies(Xia et al. Citation2006; Wang et al. Citation2018), increasing aerosol loading from pollutant emissions is responsible for reduced DSR and increased diffuse radiation in cloud-free skies. It is highly probable that the GLASS and CLARA algorithms do not adequately account for changes in aerosols, resulting in a systematic overestimation(Zhang et al. Citation2019).
Figure 9. Spatial distribution of accuracy of product DSR estimates at daily time scale at ground measurements (a) GLASS; (b) BESS; (c) ERA5; (d) CLARA; (e) MCD18A1; (f) MERRA-2.
4.1.3. Monthly scale evaluation
Among the six products used in this study, GLASS and MCD18A1 did not archive monthly DSRs; therefore, their monthly DSR data were calculated using the daily integrated DSR. Consistent with the daily scale evaluation, the monthly mean DSR of the product estimates was validated using all the selected ground measurements from CERN and TPDC. show the evaluation results for CERN, TPDC, and all the sites, respectively. The evaluation results were consistent with those obtained on a daily timescale, indicating that the DSR estimates from the reanalysis products were significantly overestimated. However, for satellite-derived product data, BESS and MCD18A1 tended to underestimate DSR, whereas GLASS and CLARA tended to overestimate it in China. In particular, the (RMSEs) MBEs of monthly DSR estimates were (20.54) 1.02 W/m2, (15.94) −2.32 W/m2, (20.16) 1.85 W/m2, (23.44) −7.31 W/m2, (24.32) 15.53 W/m2, and (41.39) 32.57 W/m2 for GLASS, BESS, CLARA, MCD18A1, ERA5, and MERRA-2, respectively. BESS maintains the optimal estimates in the monthly scale, particularly in TPDC, showing an MBE of −3.89 W/m2 and RMSE of 20.06 W/m2. At CERN, BESS did not significantly outperform the other three satellite-derived products (RMSE of BESS was approximately 2–3 W/m2 lower than that of the other three satellite-derived products). Except for the MERRA-2 data, the RMSEs of the products were < 25 W/m2. Notably, monthly DSR estimates of the satellite-derived products meet the WMO's ‘threshold’ standards for numerical weather prediction.
Figure 10. Evaluation results of monthly DSR values against CERN network: (a) GLASS; (b) BESS; (c) CLARA; (d) MCD18A1; (e) ERA5; (f) MERRA-2.
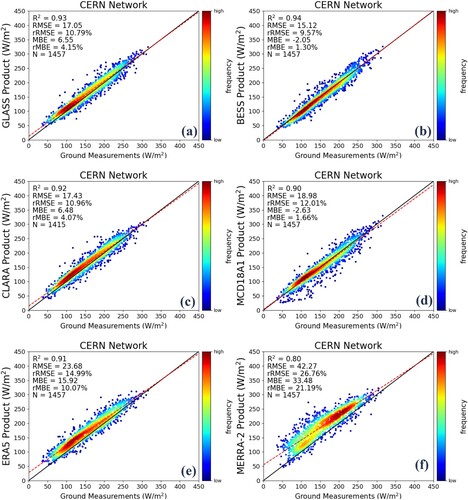
Figure 11. Evaluation results of monthly DSR values against TPDC network: (a) GLASS; (b) BESS; (c) CLARA; (d) MCD18A1; (e) ERA5; (f) MERRA-2.
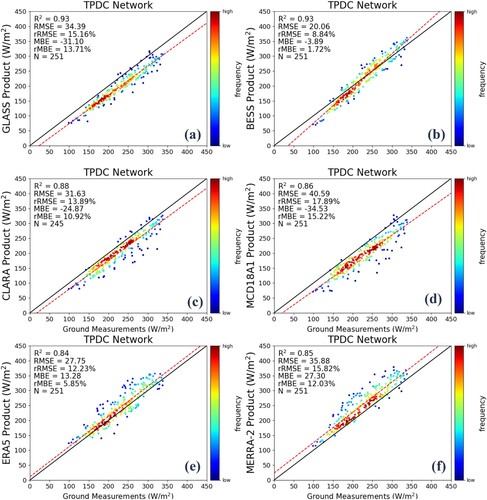
Figure 12. Evaluation results of monthly DSR values against ground measurements combining CERN and TPDC together: (a) GLASS; (b) BESS; (c) CLARA; (d) MCD18A1; (e) ERA5; (f) MERRA-2.
The geographic distribution of the monthly mean values for each site is shown in . The overall geographical distribution pattern is consistent with the daily average values shown in . BESS maintains the best performance in QTP. Owing to the shortage of cloud detection algorithms, MERRA-2 was still overestimated compared with sites in southern China. The monthly estimates of most products are acceptable because random errors have been significantly eliminated.
Figure 13. Spatial distribution of accuracy of DSR product estimates at ground sites. (The same as Figure 9, but at a monthly time scale).
4.2. Ecosystem-based variation
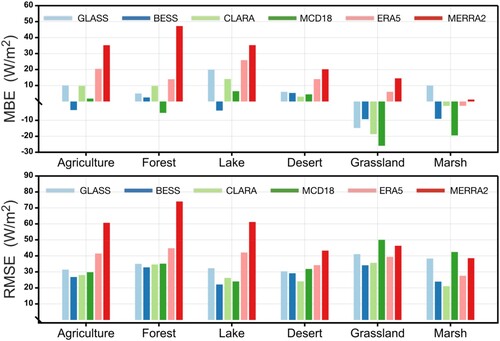
DSR drives canopy photosynthesis, which is fundamental to regional energy and ecological processes (Ryu, Berry, and Baldocchi Citation2019). A previous study reported that radiation sources could result in a 20% uncertainty in yield estimates (Zhang et al. Citation2022). In this study, we conducted a preliminary evaluation of the performance of DSR products, focusing on ecosystem characteristics, by averaging over stations from diverse ecosystems (agriculture, forests, lakes, grasslands, and marshes). As shown in , a significant overestimation of the desert ecosystem was observed; DSR in agriculture, forest, and lake ecosystems tended to be overestimated, while grasslands and marshes were underestimated. In addition, the performance of CLARA was optimal in certain ecosystems (deserts and marshes), whereas BESS yielded the most optimized estimations for agriculture, forests, lakes, and grasslands.
Figure 14. Comparison of the MBD and rRMSE values obtained from different sets of ecosystems.
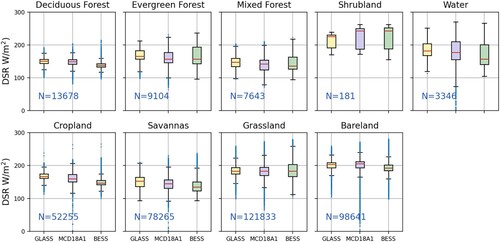
Although CERN provides valuable insights into ecosystems, only a limited number of sites from grasslands, marshes, and lake ecosystems are available, which may cause a lack of representation of these ecosystems. Therefore, we made another attempt to characterize the influence of ecosystem heterogeneity on DSR estimation using GLASS, BESS, and MCD18A1 (chosen because of their fine resolution) as examples. We divided the selected DSR products’ 2009 annual average DSR estimates into nine primary land cover types (evergreen forest, deciduous forest, mixed forest, shrub, savannas, grasslands, cropland, bare land, and water) according to MCD12C1. shows the dispersion and outliers of the 2009 annual average DSR of different land-cover classes as boxplots, with whiskers representing the 25th (lower) and 75th (upper) percentiles. The selected products have diverse dispersions over different land covers but show similarities within a certain type of land cover. For example, the DSR estimates for the deciduous forest, cropland, and bare land were spread out on a relatively wide scale compared with the boxplots corresponding to evergreen forest, shrubland, and water, without much separation between the different products.
Figure 15. Box plots of the 2009 annual mean of different products over different land cover types; the red line within the box represents the median value; the blue markers represent the outliers.
4.3. Seasonal and interannual variation
4.3.1. Seasonal variation
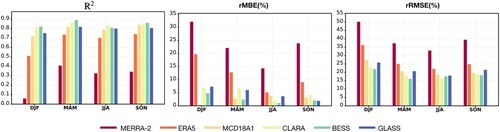
We investigated the seasonal dependency on the accuracy of the products by dividing monthly DSR estimates into spring (MAM), summer (JJA), autumn (SON), and winter (DJF) seasons. As shown in , BESS yields optimal estimates during spring, summer, and winter, whereas CLARA slightly outperforms BESS during autumn. also shows their consistent seasonal accuracy: the lowest R2 and highest rMBE and rRMSE in winter and a relatively higher R2 and lower rMBE and rRMSE in the other seasons. Zhang et al. (Citation2016) arrived at a similar conclusion. Winter is distinguished from other seasons by (i) inaccuracy in DSR retrievals over snow-covered surfaces, (ii) degraded retrieval quality under the low sun and extensive viewing angle conditions in the Northern Hemisphere during winter, and (iii) low absolute DSR levels. Furthermore, disregarding that sub-monthly aerosol variability in satellite retrievals may contribute to the substantial relative bias during winter when China is assumed to have significant aerosol concentrations owing to domestic heating.
Figure 16. variations of R2; (b) seasonal variations of rMBE; (c) seasonal variations of rRMSE. DJF represents December, January, and February. MAM means March, April, and May. JJA represents June, July, and August. SON represents September, October, and November.
4.3.2. Interannual variation
First, we utilized surface measurements from 43 sites from CERN, TPDC, and GEBA between January 2009 and December 2012 to analyze site-averaged time trends of all products. shows the site-averaged time series of site-measured and product-estimated DSR monthly anomalies. Note that, with only 4 years of data, our purpose was not to accurately represent interannual variation in DSR, but instead to examine whether the products could replicate the anomalies of the given ground measurements. The correlation coefficients of the calculated and observed anomalies and the standard deviations of the calculated and observed anomaly differences are shown at the bottom left of each plot.
Figure 17. Time series of monthly mean DSR anomalies from January 2009 to December 2012. The solid blue line shows the site-averaged DSR anomalies; The solid red line shows the averaged DSR anomalies of the grids overlying the sites for each product. Sen's slopes of the site-measured and product-estimated time series as dark blue and red dashed lines (** marked as the significance level p < 0.05). The product ensemble mean is denoted by the light blue dashed line with 2 standard deviation uncertainties represented by the shadings. The bottom left of each plot shows the correlation coefficient of calculated and observed anomalies and the standard deviation of their anomaly differences.
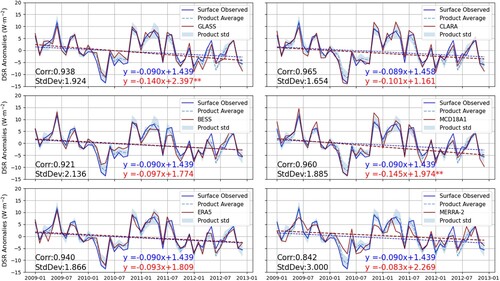
Five out of six products have correlation coefficients larger than 0.90. CLARA and MCD18A1 DSR had the highest correlations and lowest standard deviations relative to the observations. Standard deviations between estimated and observed MERRA-2 DSR estimates were 3.0 W/m2, achieving the largest fluctuations among these six products. Regarding linear trends, the observed and estimated DSR anomalies exhibited similar slope values with the same negative sign. In conclusion, the time series of the estimated DSR anomalies were generally consistent with the observed DSR anomalies, displaying the capability of DSR products to reproduce monthly and annual variability.
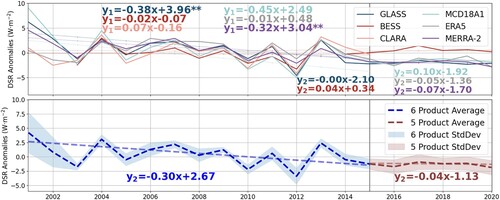
Furthermore, grid-area-averaged DSR data from the six products were compared for long-term trends over China, both annually and across seasons. To maintain consistency among the products, we divide the period (2001-2020) into two segments: Period I, spanning from 2001 to 2015, and Period II, spanning from 2016 to 2020. By doing so, we examine the temporal changes of all six products over the longer time frame of Period I and compare the five products (excluding CLARA, which ends in 2015) in the more recent and shared time frame of Period II.
The annual results are presented in . During Period I, CLARA exhibited a slightly increasing trend of 0.07 W/m2 per year, while the other products showed decreasing trends ranging from −0.45 W/m2 per year to −0.02 W/m2 per year, resulting in a six-product mean of 0.3 W/m−2 per year. Notably, the products still exhibited significant consistency from 2009 to 2012, which supports our previous conclusion of their consistency. However, over the longer term, the deviation between products could be significant. For example, large standard deviations between products were observed in 2001 (3.59 W/m2), 2002 (2.64 W/m2), and 2012 (1.48 W/m2). In Period II, all five products showed statistically insignificant trends in DSR, with GLASS showing a flat trend, BESS and MCD18A1 showing slightly increasing trends, as well as MCD18A1 and MERRA-2 displaying slightly decreasing trends.
Figure 18. Time series of grid-area-averaged DSR anomalies in China for different products; the product ensemble means with 2 standard deviation uncertainties represented by the shadings. In all panels, the period was divided into 2001–2015 (Period I) and 2016–2020 (Period II). Dash lines represent the Sen's slopes (** marked as the significance level p < 0.05) of the product estimated time series.
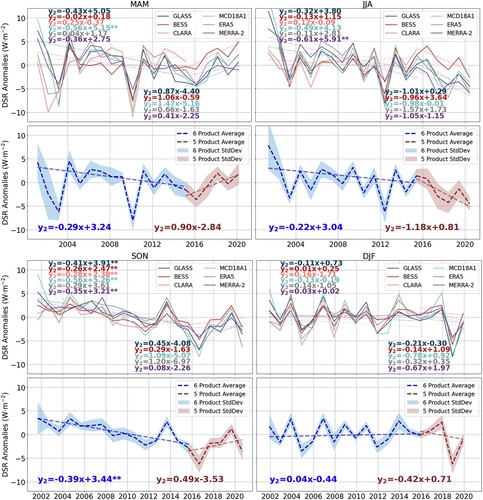
Decadal DSR trends for individual seasons are depicted in , revealing trends varying from season to season in both Periods I and II. During Period I, a consistent negative trend (from −0.41 W/m2 per year to −0.26 W/m2 per year) was observed in autumn for all six products. However, in the other seasons, the trends of each product were less consistent and mostly nonsignificant. In Period II, consistently increasing trends were observed in spring and autumn while decreasing trends were observed in summer and winter. These opposing trends resulted in a corresponding overall nonsignificant annual trend in Period II.
Figure 19. As , but for the seasonal trend.
Multiple studies have disclosed that neither satellite nor reanalysis retrievals can accurately reproduce the decadal variability of DSR (Yang et al. Citation2023). As reported by He, Wang, and Feng (Citation2021), ERA-Interim and ERA5 failed to reproduce trends in DSR variations from 1979 to 2014. Additionally, Wang et al. (Citation2015) found that both CERES EABF and MERRA recorded invalid long-term trends in China. CERES EABF's recorded decreasing trend from 1983 to 2007 was caused by inhomogeneity due to imperfect usage of cloud observations, while MERRA's predicted increasing trend after 1990 was found to be invalid due to the products ignoring the canceling effect of increased aerosol loading. Li, Wang, and Liang (Citation2021) have found that CLARA and GLASS products exhibited inaccurate long-term global trends due to sensor degradation over the years. Our study revealed inconsistency in the long-term trend in China across these products, which casts doubt on their ability to capture the long-term variation in the region. However, additional research using ground truth is necessary to quantify the long-term trend's accuracy and identify the source of error.
4.4. Spatial distribution and intercomparison
4.4.1. Annul mean DSR distribution
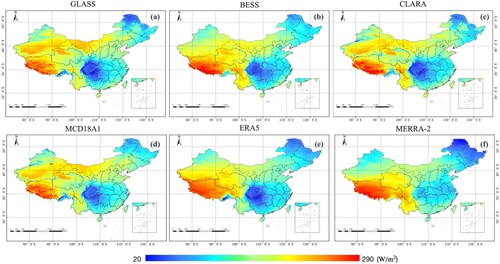
Analyzes based on ground measurements showed that DSR products have varying accuracies and systematic biases across different networks; therefore, a detailed spatial comparison is necessary. In this study, the average annual mean values of all DSR products were calculated. As shown in a–f, the DSR estimates for the six products displayed a similar spatial distribution in China. In particular, DSR was higher in the non-monsoon region than in the monsoon region and higher in areas with higher elevations than in areas with lower elevations. Nationwide, maximum DSR occurs on the QTP, which is related to increased atmospheric transparency. At the same time, the minimum is in southwestern China (Szechwan Basin and Guizhou), which is associated with more clouds and higher aerosol loadings.
Figure 20. Spatial distribution of annual mean DSR (W/m2) of (a) GLASS; (b) BESS, (c) CLARA; (d) MCD18A1; (e) ERA5; (f) MERRA-2 in China.
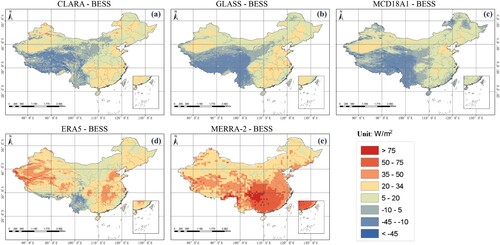
The datasets were compared directly by computing their differences. Owing to its optimal performance, BESS was regarded as a benchmark for subtracting other DSR products, as shown in the validation section. a–f compare the BESS estimates with the other five product estimates for the 2009 annual mean DSR. The red (blue) colors of various tints indicate that BESS is higher (lower) than the other products by varying degrees. A striking discrepancy can be observed in . Most areas are red for ERA5 (d) and MERRA-2 (e), indicating that their DSR values are more systematically significant than those of BESS. In contrast, the differences between the BESS and the three other satellite-derived products are highly region-related, being negative (blue) in high elevation areas (the QTP and Yunnan–Guizhou Plateau in the west) and positive (red) in low elevation areas (plains and hills in the east).
Figure 21. Spatial distribution of annual mean DSR difference(W/m2) of (a) CLARA - BESS; (b) GLASS-BESS; (c) MCD18A1-BESS; (d) ERA5-BESS; (e) MERRA-2-BESS in China.
4.4.2. Product intercomparison
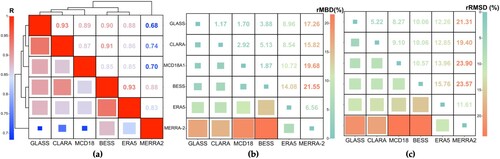
The geographical distribution of products provides qualitative verification results, such as whether they are spatially homogenous or heterogeneous. The quantitative discrepancies between products were further displayed by comparing the collocated grid values at 0.5° spatial resolution and illustrating them in terms of R, (r)MBD, and (r)RMSD.
As shown in , R ranged from 0.68–0.93, rMBD from 1.17% to 21.55%, and rRMSD from 5.222% to 23.90%. GLASS and CLARA yielded the most optimized consistencies (R, rMBD, and rRMSD were 0.93, 1.17%, and 5.22%, respectively). Generally, the DSR estimation errors of the four satellite-derived products were strongly correlated with each other, with R > 0.86, rMBD < 5%, and rRMSE < 11%. Differences between the satellite-derived and reanalysis products were significantly relatively large (ERA5 > 10%; MERRA-2 > 20%). The correlation coefficient between BESS and MERRA-2 was high (0.88), but rMBD was low (21.54%). This high correlation is probably attributable to the use of MERRA-2 reanalysis data to compute filled data gaps under cloudy-sky radiation (Ryu et al. Citation2018). A large rMBD reflects the intrinsic difference between satellite-derived and reanalysis products. These results enhance the findings of previous studies that reported a large discrepancy between satellite-derived and reanalsis products (Liang et al. Citation2010; Huang et al. Citation2019; Jiang et al. Citation2020). This study goes a step further by providing quantitative data.
Figure 22. Comparison for the six DSR products (a) R; (b) rMBD; (c) rRMSE.
5. Discussion
5.1. Spatial representativeness error analysis
Representativeness errors result in discrepancies between in situ measurements and collocated DSR product estimates (Hakuba et al. Citation2013; Huang et al. Citation2019). The current study illustrates that representativeness errors are strongly contingent on the spatial scale of satellite-derived products (Huang et al. Citation2016). However, these inferences regarding particular products are controversial. For example, Wang, Wang, and Xue (Citation2021) validated the 3 h DSR at the original resolution (1 × 1 km) and 1° × 1° scale and concluded that the accuracy was almost unchanged. In contrast, Wang et al. (Citation2020) showed that when instantaneous MCD18A1 was aggregated from 1 to 50 km, the RMSE decreased from 119.2–101.0 W/m2. To determine this contradiction, we evaluated the MCD18A1 product at multiple temporal (instantaneous, daily, and monthly) and spatial (50, 25, 5, and 1 km) scales. Consistent with Wang, Wang, and Xue (Citation2021), for the instantaneous scale of MCD18, RMSE was strongly correlated with the spatial scale, ranging from 160.43–146.02 W/m2 (). When the spatial scale changed from 5 to 25 km, RMSE decreased from 155.43–147.02 W/m2, indicating that the accuracy of MCD18 is possibly subject to the representativeness of the surface observation. On a daily timescale, the results showed a 7.8 W/m2 discrepancy between the 1 and 50 km scales. Conversely, on a temporal scale larger than or equal to 1 month, the spatial scale had no impact on data accuracy.
Table 3. Comparison between mean DSR of MCD18A1 with the ground measurements collected from CERN stations from 2009 to 2012 at multi-spatiotemporal scales.
As the spatial resolution is an important factor that determines the value of statistical indicators, it is difficult to conclude that BESS outperforms GLASS based merely on accuracy at a scale of 0.5° × 0.5°. Therefore, we performed further validation on the original scale (0.05°). GLASS yielded an R2 of 0.85, RMSE of 35.03 W/m2, and MBE of 7.83 W/m2, while BESS yielded an R2 of 0.86, RMSE of 33.24 W/m2, and MBE of −1.05 W/m2. From this perspective, GLASS is comparable to BESS in terms of RMSE and R2. A similar conclusion was drawn by Li, Wang, and Liang (Citation2021).
5.2. Cloud effect on accuracy at sub-daily scales
Previous research has found that clouds significantly affect both satellite-derived and reanalysis DSR retrievals, making them unsuitable in cloudy regions or seasons (Li, Wang, and Liang Citation2021; Zhang et al. Citation2022). The sub-daily evaluation results of this study under different sky conditions (Section 4.1) reinforce this conclusion. Under cloudy-sky conditions, MCD18A1, ERA5, and MERRA-2 showed acceptable accuracies with MBEs of −3.03, −18.75, and 3.65 W/m2, respectively. Under cloudy-sky conditions, a varying degree of overestimation was observed for the MCD18A1, ERA5, and MERRA-2 products: the MBEs were 62.94, 115.20, and 184.91 W/m2, respectively.
However, the main reasons for the overestimation were different for the satellite-derived product (MCD18A1) and the reanalysis products (ERA5 and MERRA-2). For MCD18A1, the 3D effects of clouds may have significantly affected the validation results. Huang et al. (Citation2016) demonstrated that uncertainty originating from the 3D effects of clouds is particularly large for instantaneous high-resolution satellite-derived DSR products. For ERA5 and MERRA-2, the main reason for their positive MBE may be inaccurate cloud characteristics (especially underestimation of cloudiness; Du et al. Citation2022; Stamatis et al. Citation2022). This is consistent with evaluation at the daily scale, where sites in southern China (more affected by clouds and precipitation) generally performed worse than those in northern China (see e and f).
5.3. Differences between BESS and other satellite products
BESS did not correlate with the three other satellite-derived products (rMBDs between BESS and GLASS, CLARA-A2, and MCD18A1 were 10.06%, 10.06%, and 10.59%, respectively). The differences were highly region-related, being lower in high elevation areas (i.e. the QTP and Yunnan–Guizhou Plateau in the west) and higher in low elevation regions (i.e. plains and hills in the east). Previous studies have indicated that the choice of elevation model may introduce large uncertainties in DSR modeling (Ma et al. Citation2022). In fact, BESS offers the most reliable estimation over QTP among the products investigated, with an MBE of −1.75 W/m2 and RMSE of 36.82 W/m2. However, GLASS, CLARA, and MCD18A1 showed a significant underestimation over the QTP, with MBEs of −30.47, −23.93, and −36.86 W/m2, respectively. A previous study reported that DSR estimates of satellite-derived products over the QTP are usually less accurate than those for other regions (Xia et al. Citation2006; Wu and Fu Citation2011). Wang, Wang, and Xue (Citation2021) noted that GLASS and CERES-SYN yield fluctuations across the QTP. Wang et al. (Citation2018) attributed the underestimation by CLARA to neglecting reduced atmospheric scattering at higher elevations. However, we observed that BESS performed remarkably across the QTP. This may be because the neural network-based algorithm is distinct from other LUT-based approaches. This phenomenon could reveal differences in the inherent physical mechanisms between the neural network approach, LUT, direct estimation (Ryu et al. Citation2018), and different elevation treatments.
6. Conclusions and outlook
We evaluated the DSR estimates from six gridded products (GLASS, BESS, MCD18A1, CLARA-A2, ERA5, and MERRA-2) on a 0.5° × 0.5° spatial scale and multiple temporal scales based on quality-controlled ground-measured records of CERN and TPDC from 2009 to 2012. Under all-sky conditions, the instantaneous DSR estimates of MCD18 exhibited an RMSE of 146.02 W/m2 and MBE of 16.94 W/m2. The hourly DSR of ERA5 had more optimized accuracy (RMSE of 155.52 W/m2) than that of MERRA-2 (RMSE of 188.53 W/m2.) The products showed a clear overestimation under cloudy-sky conditions (MBEs of 62.94, 115.20, and 184.91 W/m2 for MCD18A1, ERA5, and MERRA-2, respectively). The validation results for the daily and monthly data were consistent. Among the six products, BESS showed the highest overall accuracy on daily and monthly mean scales, particularly at sites from the TPDC (MBE of −1.75 W/m2). However, under certain circumstances, CLARA and MCD18 may outperform BESS. For instance, CLARA showed the best performance in particular ecosystems (desert and marsh) and during a specific season (autumn), whereas MCDA1 showed the best consistency for interannual variation with ground measurements. For the current satellite-derived DSR products, the monthly accuracy at CERN meets the threshold accuracy requirement suggested by the WMO for the application of global numerical weather prediction (20 W/m2). In terms of spatial accuracy distribution, reanalysis products greatly overestimated the DSR at most sites; GLASS and CLARA overestimated DSR at sites east of the ‘Hu Line,’ indicating they were subjected to an urbanization effect accompanied by increased aerosol loading. A preliminary evaluation of ecological dependence revealed an overestimated tendency in desert agriculture, forest, and lake ecosystems, and an underestimation in grassland and marsh ecosystems.
The performance of the DSR products exhibited seasonal dependence (more optimized accuracy during winter than during other seasons). The selected products displayed consistency and the capability of replicating monthly DSR variability in China in the short term (2009–2012). However, inconsistencies were observed in the long-term trends (2001-2020) of DSR among the gridded products. Seasonal variations were also found in their long-term trends, in which the products only showed a consistent dimming trend in autumn, while differed in the other seasons in terms of direction and magnitude. These discrepancies in long-term trends can significantly impact Earth system simulations, potentially leading to differences in energy and carbon budget estimation (Chakraborty, Lee, and Lawrence Citation2022). In addition, they can affect solar power potential estimation and determine the effectiveness and confidence in designing the layout of solar photovoltaic systems (He et al. Citation2023). Therefore, we highlight the need to pay attention to dataset selection when conducting the long-term DSR trend analysis over China.
Furthermore, the 2009 annual mean values of the six products were compared by characterizing their spatial distributions and quantitative statistical metrics. The differences between BESS and the three other satellite-derived products were highly region-related, being relatively low in high elevation areas (QTP and the Yunnan–Guizhou Plateau in the west) and relatively high in low elevation regions (i.e. plains and hills in the east). The results further established significant discrepancies between satellite-derived products and reanalysis products (rMBD > 8.5%, rRMSD > 12.3%). The GLASS, CLARA, and MCD18A1 products were reasonably correlated, and GLASS and CLARA yielded the most optimized consistencies (R, rMBD, and rRMSD were 0.93, 1.17%, and 5.22%, respectively). At the same time, BESS was less correlated with the results of the three other satellite-derived products.
This validation can elucidate the performance of DSR products and provide guidelines for the selection of appropriate products for specific applications in China. Future studies using additional ground measurement data are required to ensure representativeness and reinforce our conclusions. Moreover, surface measurement data should be collected over a more extensive time range to account for intra-annual variability and long-term trends and provide users with more comprehensive and representative information. In addition to global DSR components, direct and diffuse components are required for various research applications such as concentrated solar power plants (Abal et al. Citation2017) and monitoring ecosystem carbon uptake (Zhou et al. Citation2021). Radiation products containing these components are increasingly available; however, few related studies have been conducted (Jiang et al. Citation2020). Therefore, future evaluations should focus more on direct and diffuse components.
Acknowledgment
We would like to thank the satellite and reanalysis data developers and providers: ERA5 from ECMWF, MERRA-2 from NASA GMAO, MCD18A1 from NASA’s LP DAAC, CLARA-A2 from CM SAF, BESS from Ecological Sensing AI Lab at Seoul National University and the GLASS team. We are grateful to the Chinese National Ecosystem Research Network for their support. We also extend our special thanks to the 31 CERN stations represented by circles in for providing the necessary data. TPDC data are provided by National Tibetan Plateau Data Center. GEBA is co-funded by the Federal Office of Meteorology and Climatology MeteoSwiss within the framework of GCOS Switzerland. We appreciated anonymous reviewers’ and editors’ constructive comments in improving our paper.
Disclosure statement
No potential conflict of interest was reported by the author(s).
Additional information
Funding
References
- Abal, G., D. Aicardi, R. Alonso Suárez, and A. Laguarda. 2017. “Performance of Empirical Models for Diffuse Fraction in Uruguay.” Solar Energy 141:166-181. doi:10.1016/j.solener.2016.11.030.
- Abraha, M. G., and M. J. Savage. 2008. “Comparison of Estimates of Daily Solar Radiation from air Temperature Range for Application in Crop Simulations.” Agricultural and Forest Meteorology 148 (3):401-416. doi:10.1016/j.agrformet.2007.10.001.
- Babar, Bilal, Rune Graversen, and Tobias Boström. 2019. “Solar Radiation Estimation at High Latitudes: Assessment of the CMSAF Databases, ASR and ERA5.” Solar Energy 182:397-411. doi:10.1016/j.solener.2019.02.058.
- Besharat, Fariba, Ali A. Dehghan, and Ahmad R. Faghih. 2013. “Empirical Models for Estimating Global Solar Radiation: A Review and Case Study.” Renewable and Sustainable Energy Reviews 21: 798–821. doi:10.1016/j.rser.2012.12.043.
- Cao, C., X. Lee, S. Liu, N. Schultz, W. Xiao, M. Zhang, and L. Zhao. 2016. “Urban Heat Islands in China Enhanced by Haze Pollution.” Nature Communications 7: 12509. doi:10.1038/ncomms12509.
- Chakraborty, T., X. Lee, and D. M. Lawrence. 2022. “Diffuse Radiation Forcing Constraints on Gross Primary Productivity and Global Terrestrial Evapotranspiration.” Earth’s Future 10 (8). doi:10.1029/2022EF002805.
- Damm, Alexander, J. A. N. Elbers, Andre Erler, Beniamino Gioli, Karim Hamdi, Ronald Hutjes, Martina Kosvancova, Michele Meroni, Franco Miglietta, and Andre Moersch. 2010. “Remote Sensing of sun-Induced Fluorescence to Improve Modeling of Diurnal Courses of Gross Primary Production (GPP).” Global Change Biology 16 (1): 171–186. doi:10.1111/j.1365-2486.2009.01908.x.
- Dee, Dick P, SMꎬ Uppala, Adrian J Simmons, Paul Berrisford, Paul Poli, Shinya Kobayashi, U. Andrae, M. A. Balmaseda, G. Balsamo, and D. P. Bauer. 2011. “The ERA Interim Reanalysis: Configuration and Performance of the Data Assimilation System.” Quarterly Journal of the Royal Meteorological Society 137 (656): 553–597. doi:10.1002/qj.828.
- De Miguel, A. B. J. A. R. K. H., J. Bilbao, R. Aguiar, H. Kambezidis, and E. Negro. 2001. “Diffuse Solar Irradiation Model Evaluation in the North Mediterranean Belt Area Solar Irradiation Model Evaluation in the North Mediterranean Belt Area.” Solar Energy Energy 70 (2): 143–153. doi:10.1016/S0038-092X(00)00135-3.
- Du, Yunfei, Hongrong Shi, Jinqiang Zhang, Xiangao Xia, Zhendong Yao, Disong Fu, Bo Hu, and Chunlin Huang. 2022. “Evaluation of MERRA-2 Hourly Surface Solar Radiation Across China of MERRA-2 hourly Surface Solar Radiation Across China.” Solar Energy Energy 234: 103–110. doi:10.1016/j.solener.2022.01.066.
- Espinar, B., P. Blanc, L. Wald, C. Hoyer-Lick, M. Schroedter-Homscheidt, and T. Wanderer. 2012. “Controlling the Quality of Measurements of Meteorological Variables and Solar Radiation. From sub-hourly to monthly average time periods." EGU General Assembly 2012, Apr 2012, European Geosciences Union 2012, Vienna (Austria) 22–27 April 2012.
- Estévez, José, Matías Salinero-Delgado, Katja Berger, Luca Pipia, Juan Pablo Rivera-Caicedo, Matthias Wocher, Pablo Reyes-Muñoz, Giulia Tagliabue, Mirco Boschetti, and Jochem Verrelst. 2022. “Gaussian Processes Retrieval of Crop Traits in Google Earth Engine Based on Sentinel-2 top-of-Atmosphere Data.” Remote Sensing of Environment, doi:10.1016/j.rse.2022.112958.
- Fang, Hejin, Wenmin Qin, Lunche Wang, Ming Zhang, and Xuefang Yang. 2021. “Solar Brightening/Dimming Over China’s Mainland: Effects of Atmospheric Aerosols, Anthropogenic Emissions, and Meteorological Conditions.” Remote Sensing 13 (1), doi:10.3390/rs13010088.
- Fu, Bojie, Shenggong Li, Xiubo Yu, Ping Yang, Guirui Yu, Renguo Feng, and Xuliang Zhuang. 2010. “Chinese Ecosystem Research Network: Progress and Perspectives.” Ecological Complexity 7 (2):225-233. doi:10.1016/j.ecocom.2010.02.007
- GCOS. 2022. “The 2022 GCOS Implementation Plan.” Accessed Dec 7. https://gcos.wmo.int/en/publications/gcos-implementation-plan2022.
- Gelaro, Ronald, Will McCarty, Max J Suárez, Ricardo Todling, Andrea Molod, Lawrence Takacs, Cynthia A Randles, Anton Darmenov, Michael G Bosilovich, and Rolf Reichle. 2017. “The Modern-era Retrospective Analysis for Research and Applications, Version 2 (MERRA-2).” Journal of Climate 30 (13): 5419–5454. doi:10.1175/JCLI-D-16-0758.1.
- Global Modeling and Assimilation Office (GMAO) 2015. MERRA-2 tavg1_2d_slv_Nx: 2d,1-Hourly,Time-Averaged,Single-Level, Assimilation,Single-Level Diagnostics V5.12.4, Greenbelt, MD, USA, Goddard Earth Sciences Data and Information Services Center (GES DISC), Accessed May 2023. doi:10.5067/VJAFPLI1CSIV.
- Guo, Jianping, Yuan Li, Jason Blake Cohen, Jian Li, Dandan Chen, Hui Xu, Lin Liu, Jinfang Yin, Kaixi Hu, and Panmao Zhai. 2019. “Shift in the Temporal Trend of Boundary Layer Height in China Using Long-Term (1979–2016) Radiosonde Data.” Geophysical Research Letters 46 (11): 6080–6089. doi:10.1029/2019GL082666.
- Hakuba, Maria Zyta, Doris Folini, Arturo Sanchez-Lorenzo, and Martin Wild. 2013. “Spatial Representativeness of Ground-Based Solar Radiation Measurements.” Journal of Geophysical Research: Atmospheres 118 (15): 8585–8597. doi:10.1002/jgrd.50673.
- Hartmann, Dennis L, Albert MG Klein Tank, Matilde Rusticucci, Lisa V Alexander, Stefan Brönnimann, Yassine Abdul Rahman Charabi, Frank J Dentener, Edward J Dlugokencky, David R Easterling, and Alexey Kaplan. 2013. “Observations: Atmosphere and Surface.” In Climate Change 2013 the Physical Science Basis: Working Group I Contribution to the Fifth Assessment Report of the Intergovernmental Panel on Climate Change, edited by T. Stocker, D. Qin, GK Plattner, M. Tignor, SK Allen, J. Boschung, A. Nauels, Y. Xia, V. Bex, and PM Midgley, 159–254. UK and New York: Cambridge University Press.
- He, Yanyi, Kaicun Wang, and Fei Feng. 2021. “Improvement of ERA5 Over ERA-Interim in Simulating Surface Incident Solar Radiation Throughout China.” Journal of Climate 34 (10):3853-3867. doi:10.1175/JCLI-D-20-0300.1.
- He, Yanyi, Kun Yang, Martin Wild, Kaicun Wang, Dan Tong, Changkun Shao, and Tianjun Zhou. 2023. “Constrained Future Brightening of Solar Radiation and its Implication for China's Solar Power.” National Science Review 10 (1), doi:10.1093/nsr/nwac242.
- Heffernan, James B, Patricia A Soranno, Michael J Angilletta Jr, Lauren B Buckley, Daniel S Gruner, Tim H Keitt, James R Kellner, John S Kominoski, Adrian V Rocha, and Jingfeng Xiao. 2014. “Macrosystems Ecology: Understanding Ecological Patterns and Processes at Continental Scales.” Frontiers in Ecology and the Environment 12 (1):5-14. doi:10.1890/130017
- Hersbach, Hans, Bill Bell, Paul Berrisford, Shoji Hirahara, András Horányi, Joaquín Muñoz-Sabater, Julien Nicolas, et al. 2020. “The ERA5 global reanalysis.” Quarterly Journal of the Royal Meteorological Society 146 (730): 1999–2049. doi:10.1002/qj.3803.
- Hilburn, K., D. P. Lettenmaier, E. Clark, C. A. Schlosser, X. Gao, W. T. Liu, E. Fetzer, et al. 2015. “The Observed State of the Energy Budget in the Early Twenty-First Century.” Journal of Climate 28 (21): 8319–8346. doi:10.1175/JCLI-D-14-00556.1.
- Huang, Guanghui, Xin Li, Chunlin Huang, Shaomin Liu, Yanfei Ma, and Hao Chen. 2016a. “Representativeness Errors of Point-Scale Ground-Based Solar Radiation Measurements in the Validation of Remote Sensing Products.” Remote Sensing of Environment 181:198-206. doi:10.1016/j.rse.2016.04.001.
- Huang, Guanghui, Zhanqing Li, Xin Li, Shunlin Liang, Kun Yang, Dongdong Wang, and Yi Zhang. 2019. “Estimating Surface Solar Irradiance from Satellites: Past, Present, and Future Perspectives.” Remote Sensing of Environment 233:111371. doi:10.1016/j.rse.2019.111371.
- Jahani, Babak, Y. Dinpashoh, and Atefeh Raisi Nafchi. 2017. “Evaluation and Development of Empirical Models for Estimating Daily Solar Radiation.” Renewable and Sustainable Energy Reviews 73:878-891. doi:10.1016/j.rser.2017.01.124.
- Jiang, Hou, Ning Lu, Jun Qin, Wenjun Tang, and Ling Yao. 2019. “A Deep Learning Algorithm to Estimate Hourly Global Solar Radiation from Geostationary Satellite Data.” Renewable and Sustainable Energy Reviews 114:109327. doi:10.1016/j.rser.2019.109327.
- Jiang, Hou, Yaping Yang, Yongqing Bai, and Hongzhi Wang. 2020a. “Evaluation of the Total, Direct, and Diffuse Solar Radiations from the ERA5 Reanalysis Data in China.” IEEE Geoscience and Remote Sensing Letters 17 (1):47-51. doi:10.1109/LGRS.2019.2916410.
- Jiang, Hou, Yaping Yang, Hongzhi Wang, Yongqing Bai, and Yan Bai. 2020b. “Surface Diffuse Solar Radiation Determined by Reanalysis and Satellite Over East Asia: Evaluation and Comparison.” Remote Sensing 12 (9). doi:10.3390/rs12091387.
- Karlsson, Karl-Göran, Kati Anttila, Jörg Trentmann, Martin Stengel, Jan Fokke Meirink, Abhay Devasthale, Timo Hanschmann, Steffen Kothe, Emmihenna Jääskeläinen, and Joseph Sedlar. 2017. “CLARA-A2: the second edition of the CM SAF cloud and radiation data record from 34 years of global AVHRR data.” Atmospheric Chemistry and Physics 17 (9): 5809–5828. doi:10.5194/acp-17-5809-2017.
- Kleist, Daryl T., David F. Parrish, John C. Derber, Russ Treadon, Wan-Shu Wu, and Stephen Lord. 2009. “Introduction of the GSI Into the NCEP Global Data Assimilation System.” Weather and Forecasting 24 (6):1691-1705. doi:10.1175/2009WAF2222201.1
- Letu, Husi, Jiancheng Shi, Ming Li, Tianxing Wang, Huazhe Shang, Yonghui Lei, Dabin Ji, Jianguang Wen, Kun Yang, and Liangfu Chen. 2020. “A Review of the Estimation of Downward Surface Shortwave Radiation Based on Satellite Data: Methods, Progress and Problems.” Science China Earth Sciences 63 (6):774-789. doi:10.1007/s11430-019-9589-0.
- Li, Shenggong, Yu Guirui, Yu Xiubo, He Honglin, and Guo Xuebing. 2015. “A Brief Introduction to Chinese Ecosystem Research Network (CERN).” Journal of Resources and Ecology 6 (3):192-196. doi:10.5814/j.issn.1674-764x.2015.03.009
- Li, Jing, Yiwei Jiang, Xiangao Xia, and Yongyun Hu. 2018. “Increase of Surface Solar Irradiance Across East China Related to Changes in Aerosol Properties During the Past Decade.” Environmental Research Letters 13 (3): 034006. doi:10.1088/1748-9326/aaa35a.
- Li, Ruohan, Dongdong Wang, and Shunlin Liang. 2021. “Comprehensive Assessment of Five Global Daily Downward Shortwave Radiation Satellite Products.” Science of Remote Sensing 4:100028. doi:10.1016/j.srs.2021.100028.
- Liang, Shunlin, Jie Cheng, Kun Jia, Bo Jiang, Qiang Liu, Zhiqiang Xiao, Yunjun Yao, et al. 2021. “The Global Land Surface Satellite (GLASS) Product Suite.” Bulletin of the American Meteorological Society 102 (2):E323-E337. doi:10.1175/BAMS-D-18-0341.1.
- Liang, Shunlin, Dongdong Wang, Tao He, and Yunyue Yu. 2019. “Remote Sensing of Earth’s Energy Budget: Synthesis and Review.” International Journal of Digital Earth 12 (7):737-780. doi:10.1080/17538947.2019.1597189
- Liang, Shunlin, Kaicun Wang, Xiaotong Zhang, and Martin Wild. 2010. “Review on Estimation of Land Surface Radiation and Energy Budgets from Ground Measurement, Remote Sensing and Model Simulations.” IEEE Journal of Selected Topics in Applied Earth Observations and Remote Sensing 3 (3):225-240. doi:10.1109/JSTARS.2010.2048556
- Liang, Shunlin, Xiaotong Zhang, Zhiqiang Xiao, Jie Cheng, Qiang Liu, and Xiang Zhao. 2013a. Global LAnd Surface Satellite (GLASS) Products: Algorithms, Validation and Analysis. Beijing: Springer Science & Business Media.
- Liang, Shunlin, Xiang Zhao, Suhong Liu, Wenping Yuan, Xiao Cheng, Zhiqiang Xiao, Xiaotong Zhang, Qiang Liu, Jie Cheng, and Hairong Tang. 2013b. “A Long-Term Global Land Surface Satellite (GLASS) Data-set for Environmental Studies.” International Journal of Digital Earth 6 (sup1):5-33. doi:10.1080/17538947.2013.805262
- Long, Charles N, and Ellsworth G Dutton. 2010. “BSRN Global Network recommended QC tests, V2. x.”.
- Lou, Mengyun, Jianping Guo, Lingling Wang, Hui Xu, Dandan Chen, Yucong Miao, Yanmin Lv, Yuan Li, Xiaoran Guo, and Shuangliang Ma. 2019. “On the Relationship Between Aerosol and Boundary Layer Height in Summer in China Under Different Thermodynamic Conditions.” Earth and Space Science 6 (5): 887–901. doi:10.1029/2019EA000620.
- Ma, Yichuan, Tao He, Shunlin Liang, Tim R. McVicar, Dalei Hao, Tong Liu, and Bo Jiang. 2023. “Estimation of Fine Spatial Resolution all-sky Surface net Shortwave Radiation Over Mountainous Terrain from Landsat 8 and Sentinel-2 Data.” Remote Sensing of Environment, doi:10.1016/j.rse.2022.113364.
- Ma, Yichuan, Tao He, Shunlin Liang, and Xiongxin Xiao. 2022. “Quantifying the Impacts of DEM Uncertainty on Clear-sky Surface Shortwave Radiation Estimation in Typical Mountainous Areas.” Agricultural and Forest Meteorology 327. doi:10.1016/j.agrformet.2022.109222.
- Ma, Yaoming, Zeyong Hu, Zhipeng Xie, Weiqiang Ma, Binbin Wang, Xuelong Chen, Maoshan Li, et al. 2020. “A Long-Term (2005–2016) Dataset of Hourly Integrated Land–Atmosphere Interaction Observations on the Tibetan Plateau.” Earth System Science Data 12 (4):2937-2957. doi:10.5194/essd-12-2937-2020
- Mirtl, Michael, E. T. Borer, Ika Djukic, Martin Forsius, Herbert Haubold, Wim Hugo, Jourdan Jourdan, D. Lindenmayer, William H McDowell, and Hiroyuki Muraoka. 2018. “Genesis, Goals and Achievements of Long-Term Ecological Research at the Global Scale: A Critical Review of ILTER and Future Directions.” Science of The Total Environment 626: 1439–1462. doi:10.1016/j.scitotenv.2017.12.001.
- Molod, A., L. Takacs, M. Suarez, and J. Bacmeister. 2015. “Development of the GEOS-5 Atmospheric General Circulation Model: Evolution from MERRA to MERRA2.” Geoscientific Model Development 8 (5): 1339–1356. doi:10.5194/gmd-8-1339-2015.
- Mueller, R. W., Christos Matsoukas, A. Gratzki, H. D. Behr, and R. Hollmann. 2009. “The CM-SAF Operational Scheme for the Satellite Based Retrieval of Solar Surface Irradiance — A LUT Based Eigenvector Hybrid Approach.” Remote Sensing of Environment 113 (5): 1012–1024. doi:10.1016/j.rse.2009.01.012.
- Muneer, T., and F. Fairooz. 2002. “Quality Control of Solar Radiation and Sunshine Measurements–Lessons Learnt from Processing Worldwide Databases.” Building Services Engineering Research and Technology 23 (3): 151–166. doi:10.1191/0143624402bt038oa.
- Muñoz Sabater, J. 2019. “ERA5-Land Hourly Data from 1981 to Present.” Copernicus Climate Change Service (C3S) Climate Data Store (CDS) 10, doi:10.24381/cds.e2161bac.
- Ryu, Youngryel, Joseph A. Berry, and Dennis D. Baldocchi. 2019. “What is Global Photosynthesis? History, Uncertainties and Opportunities.” Remote Sensing of Environment 223:95-114. doi:10.1016/j.rse.2019.01.016.
- Ryu, Youngryel, Chongya Jiang, Hideki Kobayashi, and Matteo Detto. 2018. “MODIS-derived Global Land Products of Shortwave Radiation and Diffuse and Total Photosynthetically Active Radiation at 5 km Resolution from 2000.” Remote Sensing of Environment 204:812-825. doi:10.1016/j.rse.2017.09.021.
- Shook, Kevin, and John Pomeroy. 2011. “Synthesis of Incoming Shortwave Radiation for Hydrological Simulation.” Hydrology Research 42 (6):433-446. doi:10.2166/nh.2011.074
- Slater, Andrew G. 2016. “Surface Solar Radiation in North America: A Comparison of Observations, Reanalyses, Satellite, and Derived Products.” Journal of Hydrometeorology 17 (1): 401–420. doi:10.1175/JHM-D-15-0087.1.
- Stamatis, Michael, Nikolaos Hatzianastassiou, Marios Bruno Korras-Carraca, Christos Matsoukas, Martin Wild, and Ilias Vardavas. 2022. “Interdecadal Changes of the MERRA-2 Incoming Surface Solar Radiation (SSR) and Evaluation Against GEBA & BSRN Stations.” Applied Sciences 12 (19), doi:10.3390/app121910176.
- Tang, Wenjun, Kun Yang, Jie He, and Jun Qin. 2010. “Quality Control and Estimation of Global Solar Radiation in China.” Solar Energy 84 (3): 466–475. doi:10.1016/j.solener.2010.01.006.
- Tang, Wenjun, Kun Yang, Jun Qin, Xiaolei Niu, Changgui Lin, and Xianwen Jing. 2017. “A Revisit to Decadal Change of Aerosol Optical Depth and its Impact on Global Radiation Over China.” Atmospheric Environment 150:106-115. doi:10.1016/j.atmosenv.2016.11.043.
- Voyant, Cyril, Marc Muselli, Christophe Paoli, and Marie-Laure Nivet. 2012. “Numerical Weather Prediction (NWP) and Hybrid ARMA/ANN Model to Predict Global Radiation.” Energy 39 (1): 341–355. doi:10.1016/j.energy.2012.01.006.
- Wang, D. 2017. MODIS/Terra+Aqua Surface Radiation Daily/3-Hour L3 Global 5km SIN Grid V006. 2017, distributed by NASA EOSDIS Land Processes DAAC, Accessed May 16 2023. doi:10.5067/MODIS/MCD18A1.006.
- Wang, D.. 2021. MODIS/Terra+Aqua Surface Radiation Daily/3-Hour L3 Global 1km SIN Grid V061. 2021, distributed by NASA EOSDIS Land Processes DAAC, Accessed May 16 2023. doi:10.5067/MODIS/MCD18A1.061.
- Wang, Dongdong, Shunlin Liang, Yi Zhang, Xueyuan Gao, Meredith G. L. Brown, and Aolin Jia. 2020. “A New Set of MODIS Land Products (MCD18): Downward Shortwave Radiation and Photosynthetically Active Radiation.” Remote Sensing 12 (1):168. doi:10.3390/rs12010168.
- Wang, Kaicun, Qian Ma, Zhijun Li, and Jiankai Wang. 2015. “Decadal Variability of Surface Incident Solar Radiation Over China: Observations, Satellite Retrievals, and Reanalyses.” Journal of Geophysical Research: Atmospheres 120 (13):6500-6514. doi: doi:10.1002/2015JD023420.
- Wang, Yawen, Jörg Trentmann, Wenping Yuan, and Martin Wild. 2018. “Validation of CM SAF CLARA-A2 and SARAH-E Surface Solar Radiation Datasets Over China.” Remote Sensing 10 (12):1977. doi:10.3390/rs10121977.
- Wang, Gaofeng, Tianxing Wang, and Huazhu Xue. 2021. “Validation and Comparison of Surface Shortwave and Longwave Radiation Products Over the Three Poles.” International Journal of Applied Earth Observation and Geoinformation 104:102538. doi:10.1016/j.jag.2021.102538.
- Wang, Hong-Lei, Xue Yan, Li-Juan Shen, Jane Liu, Tian-Liang Zhao, Xiao-Bin Guan, and De-Long Zhao. 2022a. “Temporal and Spatial Variations in Black Carbon Aerosol in Different Atmospheric Background Stations in China from 2006 to 2020.” Huan Jing ke xue = Huanjing Kexue 43 (8):3977-3989. doi:10.13227/j.hjkx.202111106.
- Wang, Qiuyan, Hua Zhang, Su Yang, Qi Chen, Xixun Zhou, Bing Xie, Yuying Wang, Guangyu Shi, and Martin Wild. 2022b. “An Assessment of Land Energy Balance Over East Asia from Multiple Lines and the Roles of Tibet Plateau, Aerosols, and Clouds.” Atmospheric Chemistry and Physics Discussions 2022:1-29. doi:10.5194/acp-2022-451.
- Wild, Martin, Atsumu Ohmura, Christoph Schär, Guido Müller, Doris Folini, Matthias Schwarz, Maria Zyta Hakuba, and Arturo Sanchez-Lorenzo. 2017. “The Global Energy Balance Archive (GEBA) Version 2017: A Database for Worldwide Measured Surface Energy Fluxes.” Earth System Science Data 9 (2): 601–613. doi:10.5194/essd-9-601-2017.
- WMO. 2022. “Requirements for incident shortwave radiation at Earth surface.” Accessed Oct 4. http://www.wmo-sat.info/oscar/variables/view/50.
- Wu, Futing, and Congbin Fu. 2011. “Assessment of GEWEX/SRB Version 3.0 Monthly Global Radiation Dataset Over China.” Meteorology and Atmospheric Physics 112 (3-4):155-166. doi:10.1007/s00703-011-0136-x.
- Xia, X. A., P. C. Wang, H. B. Chen, and F. Liang. 2006. “Analysis of Downwelling Surface Solar Radiation in China from National Centers for Environmental Prediction Reanalysis, Satellite Estimates, and Surface Observations.” Journal of Geophysical Research 111 (D9). doi:10.1029/2005jd006405.
- Xu, Li, Hui-Zheng Che, Jian-Qi Zhao, Biao Wang, Zhi-Hua Chen, Atsumu Ohmura, Tadahiro Hayasaka, and Guang-Yu Shi. 2008. “Data Quality Assessment and the Long-Term Trend of Ground Solar Radiation in China.” Journal of Applied Meteorology and Climatology 47 (4):1006-1016. doi:10.1175/2007JAMC1493.1.
- Yang, Dazhi, and Jamie M. Bright. 2020. “Worldwide Validation of 8 Satellite-Derived and Reanalysis Solar Radiation Products: A Preliminary Evaluation and Overall Metrics for Hourly Data Over 27 Years.” Solar Energy 210: 3–19. doi:10.1016/j.solener.2020.04.016.
- Yang, Kun, Rachel T. Pinker, Yaoming Ma, Toshio Koike, Margaret M. Wonsick, Stephen J. Cox, Yuanchong Zhang, and Paul Stackhouse. 2008. “Evaluation of Satellite Estimates of Downward Shortwave Radiation Over the Tibetan Plateau.” Journal of Geophysical Research 113 (D17). doi:10.1029/2007jd009736.
- Yang, Shuyue, Xiaotong Zhang, Shikang Guan, Wenbo Zhao, Yanjun Duan, Yunjun Yao, Kun Jia, and Bo Jiang. 2023. “A Review and Comparison of Surface Incident Shortwave Radiation from Multiple Data Sources: Satellite Retrievals, Reanalysis Data and GCM Simulations.” International Journal of Digital Earth 16 (1):1333-1358. doi:10.1080/17538947.2023.2198262.
- Yang, Shuyue, Xiaotong Zhang, Jiawen Xu, Chunjie Feng, Shikang Guan, Yunjun Yao, and Kun Jia. 2022. “Quantification of the Urbanization Impacts on Solar Dimming and Brightening Over China.” Environmental Research Letters 17 (8). doi:10.1088/1748-9326/ac7e61.
- Zhang, Zhentao, Tao Li, Erjing Guo, Chuang Zhao, Jin Zhao, Zhijuan Liu, Shuang Sun, et al. 2022a. “20% of Uncertainty in Yield Estimates Could be Caused by the Radiation Source.” Science of The Total Environment 838 (Pt 1): 156015. doi:10.1016/j.scitotenv.2022.156015.
- Zhang, Xiaotong, Shunlin Liang, Guoxin Wang, Yunjun Yao, Bo Jiang, and Jie Cheng. 2016. “Evaluation of the Reanalysis Surface Incident Shortwave Radiation Products from NCEP, ECMWF, GSFC, and JMA Using Satellite and Surface Observations.” Remote Sensing 8 (3):225-249. doi:10.3390/rs8030225.
- Zhang, Xiaotong, Shunlin Liang, Gongqi Zhou, Haoran Wu, and Xiang Zhao. 2014. “Generating Global LAnd Surface Satellite Incident Shortwave Radiation and Photosynthetically Active Radiation Products from Multiple Satellite Data.” Remote Sensing of Environment 152:318-332. doi:10.1016/j.rse.2014.07.003.
- Zhang, Xingxing, Ning Lu, Hou Jiang, and Ling Yao. 2020. “Evaluation of Reanalysis Surface Incident Solar Radiation Data in China.” Scientific Reports 10 (1): 3494. doi:10.1038/s41598-020-60460-1.
- Zhang, Xiaotong, Xiang Zhao, Wenhong Li, Shunlin Liang, Dongdong Wang, Qiang Liu, Yunjun Yao, et al. 2019. “An Operational Approach for Generating the Global Land Surface Downward Shortwave Radiation Product from MODIS Data.” IEEE Transactions on Geoscience and Remote Sensing 57 (7):4636-4650. doi:10.1109/TGRS.2019.2891945
- Zhang, Ke, Long Zhao, Wenjun Tang, Kun Yang, and Jing Wang. 2022b. “Global and Regional Evaluation of the CERES Edition-4A Surface Solar Radiation and its Uncertainty Quantification.” IEEE Journal of Selected Topics in Applied Earth Observations and Remote Sensing 15:2971-2985. doi:10.1109/JSTARS.2022.3164471.
- Zhou, Hao, Xu Yue, Yadong Lei, Chenguang Tian, Yimian Ma, and Yang Cao. 2021. “Large Contributions of Diffuse Radiation to Global Gross Primary Productivity During 1981–2015.” Global Biogeochemical Cycles 35 (8). doi:10.1029/2021gb006957.