
 ?Mathematical formulae have been encoded as MathML and are displayed in this HTML version using MathJax in order to improve their display. Uncheck the box to turn MathJax off. This feature requires Javascript. Click on a formula to zoom.
ABSTRACT
With rapid urban expansion across Tanzania, there is a need to institute steps to address factors and forms as well as impacts and challenges associated with the observed trend. This study’s aim is to use spatial urban landscape indices to analyze the spatial changes in urban forms, patterns, and rates across 11 urban centers in Tanzania over a 30-year study period (1990–2020). During the past three decades, urban lands of 11 cities and town in Tanzania have grown by a total of 480 km2. Leapfrog growth was found as the most dominant form of urban expansion in Tanzania while Dodoma, the capital city of Tanzania, had the highest rate of urban expansion when compared to all other individual cities. The most robust and significant interaction of the AWMLEI and MLEI was found in Kigoma, Arusha, Mtwara, Mafinga, and Tunduma cities. In contrast, Mbeya agricultural city, Arusha the tourist city, Tabora, and Geita Lake zone areas did show their own peculiarities revealing an interesting spatial temporal variation in rate and form of expansion. The outcome of this study reveals that the influence and management of economic and socio-cultural opportunities will be an effective tool for the determination of the rapidly expanding cities and towns of Tanzania.
1. Introduction
Generally unpresented urbanization and urban expansion characterized by demographic shift from rural to urbanized areas with a resultant rapid increase in absolute and per capita land consumption rates has been recorded over the last several decades. According to United Nations (Citation2012), global urban population increased from 1.35 billion in 1970 to 3.63 billion in 2011, a 169% increase. The United Nations (Citation2019), World Urbanization Prospects 2018 revision states that globally, 55% of world’s population live in urban centers as of 2018. The report further states that in 1950, 3% of the world’s population was urban, and by 2050, 68% of global population is projected to be urban. Of particular concern is the fast pace of urbanization recorded in low-income countries including those in sub-Saharan Africa. In 2018, the proportion of the population living in urban areas was 32% in low-income countries, and is projected to reach, on average, 59% urban by 2050.
As urbanization persists, urban land expansion has also occurred more dramatically with the global urban area quadrupling during 1970–2000 (Cai et al. Citation2022; Zhang and Seto Citation2011), showing a growth reported on an average twice as fast as urban population in recent years (Chen et al. Citation2022; Sumari et al. Citation2020), and expected to triple the global urban area in circa 2000 by 2030 (Seto, Güneralp, and Hutyra Citation2012). The predicted population growth will occur in developing countries, with an over 90% increase in Asia and Africa. Slums in emerging nations (including nations in Africa) are characterized by inequality, and a general lack of adequate infrastructure such as roads, housing, water, and waste and sanitation services all of which are associated with unimpeded and rapid growth (Onilude and Vaz Citation2021; Parnell Citation2016; Wu et al. Citation2021).
Drastic land cover changes are associated with urban expansion (Dutta and Das Citation2019; Shao et al. Citation2021; Sumari et al. Citation2017). Land cover changes influence ecosystem functioning of the natural ecology from the neighborhood to the regional scales (Bolund and Hunhammar Citation1999; Grimm et al. Citation2008; Nong et al. Citation2014). Studies have shown that rural to urban mass movement of population, mostly for the search of a better life, is one of the leading causes for urban population growth and massive unemployment among cities, traffic congestion, and environmental devastation in many circumstances (Bloom, Canning, and Fink Citation2008; Roy Citation2009). Further studies have revealed both urban form and urban environmental changes in association to urban expansion (Halla Citation2005; Kropf Citation2009; Lepczyk et al. Citation2007; Sumari, Tanveer, et al., Citation2019; Sumari, Xu, et al., Citation2019). In this study, urban form is defined in accordance with Anderson, Pavlos, and Eric (Citation1996) as the spatial configuration of fixed rudiments within a metropolitan area.
For Africa, the rate and pattern of expansion and urban growth dynamics are collectively and fundamentally shifting the development trajectory of the continent. With an average annual urbanization rate of 3.6%, Africa is currently the world’s fastest urbanizing region (UNDESA/PD Citation2013). Some of the continent’s cities are growing at an average of 5% per annum, faster than any other region globally (UN-HABITAT Citation2015), with a sharp increase in demand for housing, infrastructure, and other basic services. Unfortunately, demand often outstrips the capacity of city authorities leading to unfolding patterns of development that are spontaneous, unplanned, and lack the necessary services (Bar-Cohen Citation2006; Cobbinah, Erdiaw-Kwasie, and Amoateng Citation2015; Shao et al. Citation2021; Sumari et al. Citation2020).
In Tanzania, urbanization has been on rapid increase (Sumari et al. Citation2020; Sumari, Mandela, and Swai Citation2021; Shao et al. Citation2021) as the proportion of the population residing in urban settlements increased from 33% in 1950 to 34% in 2018 and is projected that an additional 50 million people will be added to its urban population between 2018 and 2050, with Dar-es-Salaam projected to become a megacity of more than 10 million people by 2030 and to grow to 13.4 million people by 2035 (United Nations Citation2019). This immense pressure on population growth and urbanization in Tanzania calls for concerns particularly as much of the expansion is actually unplanned and organic in nature (Sumari et al. Citation2020; Shao et al. Citation2021), a common problem with most cities in most developing and underdeveloped countries (Sarif and Gupta Citation2021; Xu et al. Citation2019).
Addressing the challenges of urbanization in Tanzania requires a clear understanding and an involved concern for planned use of urban space. The emergence of new cities (most probably driven by globalization and population increase) will continue to trigger persistent spatial transformations across urban centers and cities in Tanzania over the foreseeable future. Accordingly, it is crucial to describe and comprehend the evolving spatial urban forms and patterns across metropolitan Tanzania. The most growing cities’ spatial dynamics, including their structure, key characteristics, land consumption rates, spatial layout, degree of segmentation, and comparability, are still mostly unexplored/unclear. Monitoring growth trends and defining spatial metrics to characterize urban development and sprawling, the key features of urban expansion were assessed using satellite imagery for 11 cities and towns in Tanzania over a 30-year period. The planning and management of sub-Saharan African cities to generate a more sustainable urban form can only be achieved through reliable information gathering, dedicated, and specialized research, and studies into the spatial development patterns of cities within the region.
A study by Seto and Fragkias (Citation2005) argued that urban growth patterns at any/every time and scale reflect the prevailing, yet dynamic, social, economic, and political conditions of a given environment. In this study, the spatial development patterns of different sized 11 Tanzanian cities and towns are explored using Landsat satellite images with the aim of providing a clear understanding of their forms and pattern of evolution between 1990 and 2020. The study focused on 3 major objectives: (i) quantify the spatio-temporal change of urban expansion; (ii) identify the urban growth form and pattern, and specific spatial dynamics of urban expansion; and (iii) characterize the dynamics in the changing urban landscape patterns based on the landscape metrics namely Landscape Expansion Index (LEI), Mean Landscape Expansion Index (MLEI) and Average Weighted Mean Landscape Expansion Index (AWMLEI). The objectives are specifically drawn from two main research questions, as follows: (a) How can we measure and describe the emerging spatiotemporal patterns of urban development in Tanzania cities? (b) What urban form does the prevailing spatial patterns reveal?
2. Study area and methods
2.1. Study area
Administratively, Tanzania mainland is divided into 20 regions and Zanzibar into 5 regions, with each region subsequently subdivided into districts. In this study, a total of 11 cities were selected from 6 administrative zones as summarized in ().
Figure 1. Map of Tanzania showing the 11 urbans centers under this study.
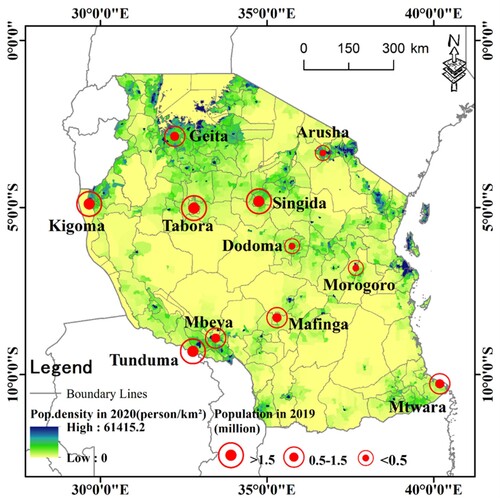
Table 1. Tanzania cities selected for the study.
2.2. Data acquisition and processing
Remote sensing imagery from Landsat-TM/ETM and Landsat-8 were acquired from Google-earth engine explore (GEE) using a graphical engine interface from https://explorer.earthengine.google.com of 30 m resolution Landsat images for different study years were selected for this study including Landsat-TM for 1990, Landsat-ETM for 2000, 2005, and 2010 Landsat-OLI for 2015 and 2020. Data for Administrative boundaries was acquired from the National Bureau of Statistics (NBS). Image pre-processing included geometric and radiometric calibration, while atmospheric correction was performed in GEE. These remote sensing data were then used to map 11 urban areas for 6 different study epochs: (1990–1995, 1995–2000, 2000–2005, 2005–2010, 2010–2015, 2015–2020) over a 30-year period corresponding to national budgetary and political transition time points. As a result, the change in power during the relevant period makes it obvious to see the change in urban expansion. Consequently, the focus of this study is on the spatiotemporal dynamics of urban expansion with two classes identified urban and non-urban.
The accuracy of classification results of urban land use within the 11 cities and towns was validated through visual interpretation of time series classification results and ground truth sample points. With the help of local knowledge and proceeding study (Sumari et al. Citation2020), high-resolution Google Satellite imagery was used to create a total of 11,083 training sample points which were tested (approximately 100 points per city) for all the six time periods for all 11 urban areas. The overall accuracy of 87% to 96% between 1990 and 2020 was recorded, and the results after computed Kappa were convincing and formed the basis for further analysis.
2.3. Landscape metrics
The following landscape metrics were used to identify and quantify the spatiotemporal pattern of urbanization and urban population growth dynamics in the study area;
2.3.1. Landscape expansion index
The LEI was proposed by Liu et al. (Citation2010). It can be used to extract the distribution patterns and expansion kinds of a certain landscape from multitemporal remote sensing data. Spatial modes of LEI is one of the main area in landscape conservation suites, which aims at understanding the complex relationships between landscape patterns and landscape change processes (Fan and Fan Citation2014; Jiao et al. Citation2018). Resulting from interactions among different processes and natural environments, landscape patterns can affect conservation processes in multiple ways, while conservation processes can facilitate the evolution of landscape patterns. One of such important conservation process is landscape expansion (including urban growth, species spreading, desertification, soil erosion, etc.). It involves mainly three types of spatial pattern (), i.e. infilling, edge-expansion, and leapfrog (Forman Citation1995). An infilling type refers to the one where the gap (or hole) between old patches or within an old patch is filled up with the existing grown patch ((a)). Forman (Citation1995) discusses edge-expansion type, defined as an existing grown patch spreading unidirectional in more or less parallel strips from an edge ((b)). If the newly grown patch is found isolated from the old, then it would be defined as a leapfrog ((b)).
Figure 2. Three types of landscape expansion infilling, edge-expansion, and leapfrog (a) Pre-expansion patch and newly urban patch, (b) Newly grown patch is found isolated from the old.
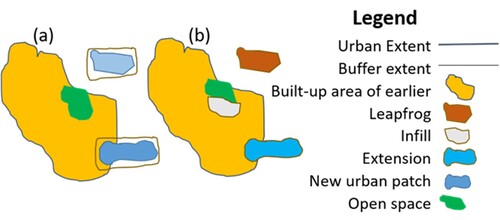
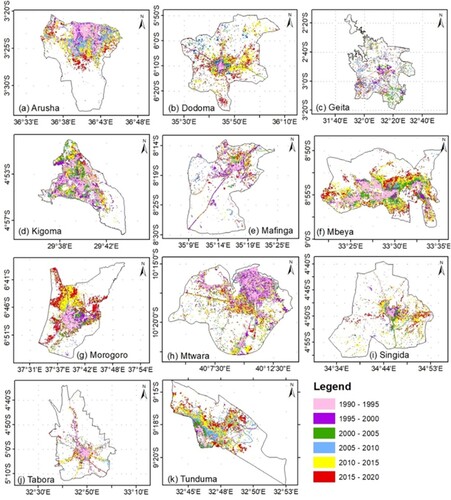
Figure 3. Spatial pattern of urban expansion for the 11 cities in the six periods.
Liu et al. (Citation2010) have proposed LEI to characterize and identify different urban growth modes such as infilling, edge-expansion, and leapfrog. The LEI of the existing growing urban patch is calculated using Equation (1) below:
(1)
(1) where A0 is the area of the intersection between the buffer zone of the new patch and the old urban patches (occupied category), while Av is the area of the intersection between the buffer and the vacant (unoccupied category). According to Equation (1) above, LEI values range from 0 to 100%. Liu et al. (Citation2010) divided the whole LEI range into three discrete intervals so as to respectively classify the expansion patterns into these three types. An expansion type can be classified as infilling if the ratio is larger than 50%, edge-expansion growth if the ratio is between 50% and 100%, on the other hand, expansion is classified as leapfrog if the ratio is 0 meaning the newly grown patch occurred beyond the old patch.
2.3.2. Mean landscape expansion index
This was used to incorporate LEI of all patches over the full extent through simple averaging in one period. The purpose of using MLEI is to show the aggregate properties of the patch mosaics (Liu et al. Citation2010; Jiao, Mao, and Liu Citation2015). MLEI is calculated using Equation (2) below:
(2)
(2) where by LEI0 is the LEI for a new patch, and N is the total number of newly grown patches. Thus, from interpretations of the above formula, a smaller MLEI signifies higher expansion degree of the city whilst a larger MLEI value signifies a more substantial compacting trend along with the landscape expansion.
2.3.3. Area weighted mean landscape expansion index
This is the area-weighted index, which considers the weight of an area of each patch. In contrast with MLEI, AWMLEI is an area-weighted mean. AWMLEI is calculated using the formula (3) below:
(3)
(3) where by LEI0 is the LEI value for a newly grown patch, a0 is the area of this new patch, and A is the total area of all these newly grown patches. When there is a smaller AWMLEI, it signifies that the landscape expansion is in diffusion form and the vice versa is true for the compact urban expansion forms.
2.4. Spatial extent
2.4.1. Urban expansion rate
Two indices were used in order to quantify the spatial extent and the urban expansion rate for the 11 cities and towns, these are the Annual Expansion (AE) in km2 and Annual Growth Rate (AGR) in percentage growth. AE is the direct measure of the annual urban change and it is most effective when comparing time series changes of the expansion of the same urban area. On the other hand, AGR is more applicable in the comparison of urban expansion for different cities since it eliminates the size or area effects of the city (Wu et al. Citation2015). The two indices can be calculated using the formulas (4) and (5) below;
(4)
(4)
(5)
(5) From Equations (4) and (5) above, Astart and Aend are the extent of the urban area at the start and the end period of the study period respectively and ‘t’ is the time span from the start to the end point.
2.4.2. Urban population density
Population growth is another crucial field to be assessed when analyzing the dynamics of urban expansion. Two approaches were used to assess population growth in this study. First urban density (Equation (6)) also referred to urban land density in other literatures (Toure et al. Citation2020); and second, the annual change rate (Equation (7)) which is more reliable for comparison studies of more than one area with different area sizes (Xu et al. Citation2020).
(6)
(6)
(7)
(7) where by DStart and Dend refers to urban density at the beginning and at the end respectively of the study period n.
3. Results
3.1. Spatiotemporal pattern of urban expansion over the study period
Prior to pattern analysis, a simple linear regression model was used to test the significance of the urban expansion over time. The urban area (in square kilometers) was modeled against time in years. Statistical results revealed that urban expansion was significant with a confidence level of 99% (p-value ranging between 0.000484 for Mbeya to 0.00391 for Tabora). Also, the expanding rate was explained by the changing time (R-square ranging between 0.78 for Tunduma to 0.93 for Arusha).
Over the three decades of this study, cities and town in Tanzania have experienced significant changes in terms of land use patterns and forms. Rapid urban expansion of the 11 urban centers analyzed in this study confirms this claim (). Only five cities (Dodoma, Arusha, Singida, Mbeya, and Tabora), expanded almost all around the existing urban core resulting to the formation of mono-nuclear concentric rings model-like shape by the added urban patches. The outcome of this study shows that Kigoma, and Mafinga have experienced a disintegrated linear pattern of urban expansion during 1990–2000 but the pattern of expansion has changed during the 2005–2020 periods in which the aggregate pattern of urbanization took over. Geita is the one with the most peculiar type of growth, a constant scattered growth form throughout the study period with just a small ring of nucleated urbanization in the city center. For Tunduma, the urbanization direction observed pointed towards the north-east direction, expanding and concentrating towards the city center which is the border between Tanzania and Zambia.
Figure 4. Landscape Expansion Index for various towns from 1990 to 2020.
3.2. Spatiotemporal forms of urban expansion
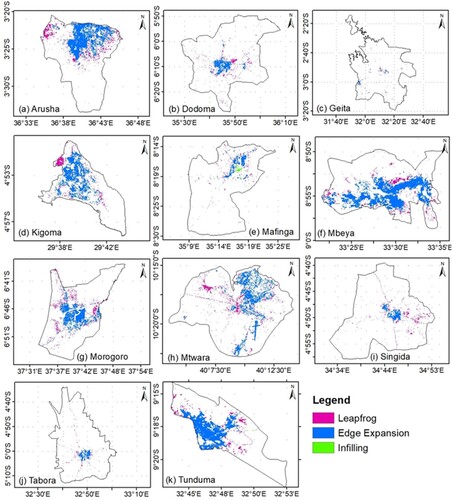
Three urban growth patterns were identified using the LEI index on the basis of the analyses of LEI values to determine the urban patch growth types. From the maps in , there is a substantial number of new urban patches occurring very far away from the old urban patches while few new patches are seen to be attached to the old patches forming edge expansion growth.
Figure 5. Ternary diagram showing the proportional composition of the three urban expansion types: leapfrogging, infilling and edge expansion for the various towns.
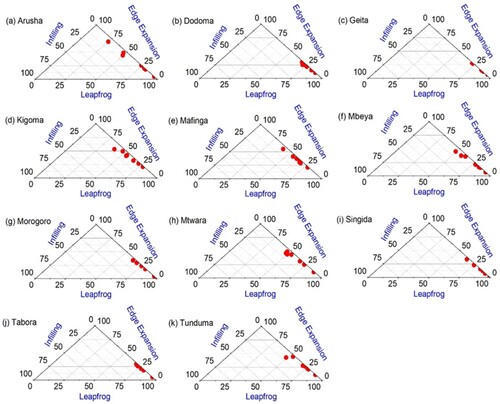
We found out that Leapfrog urban expansion form is the most common form of urban expansion in all cities and towns with few outliers seen in Arusha, Kigoma, Mafinga, Mbeya, Mtwara, and Tunduma where at least one study year had edge expansion dominating with over 50% of the total expanding patches. Infilling urban expansion had been the least experienced/recorded urban expansion form in all 11 cities and towns analyzed ().
Figure 6. Percentage number of patches for the three urban expansion types in the six study periods for all 11 cities and towns (Liu et al. Citation2010).
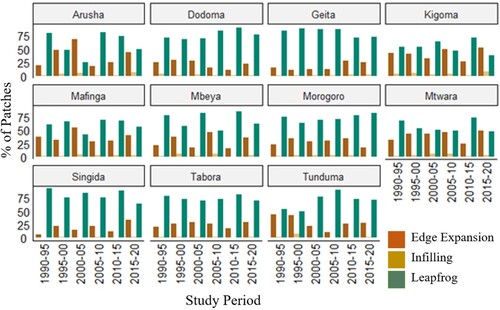
The study discovered that the percentage of the number of new patches for each growth mode shows considerable variations between different study periods (). For example, Leapfrog growth pattern maintained its dominance in the majority of the study locations in this study over all six study periods with the largest proportions on the number of new patches recorded in Geita, Dodoma, Mbeya, Morogoro, Singida, Tunduma, and Tabora. On the contrary, in the rest study locations (Arusha, Mafinga, Kigoma, and Mtwara) there was an alternating dominance between Leapfrog and edge urban expansion patterns. In all 11 cities and towns and over the six study periods, infill expansion demonstrated little percentage over the total new patches.
Figure 7. AWMLEI and MLEI variations between the 11 cities and towns.
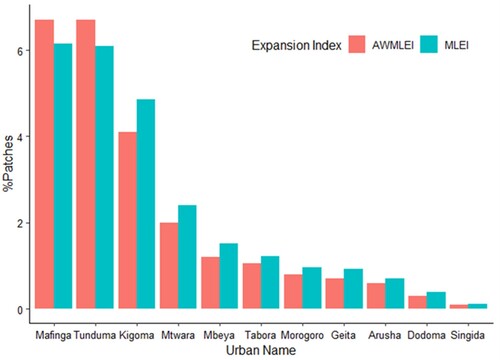
Two more indices were used to create an understanding of urban expansion form for the 11 cities and towns. The variation of AWMLEI and MLEI values in a one-year period (over the overall study period of 1990–2020) among all 11 urbans areas is summarized and presented in . Mafinga and Tunduma show the largest values of AWMLEI and MLEI signaling the most compact urban expansion when compared to other urban areas. On the other hand, Singida and Dodoma have the least values of AWMLEI and MLEI indicating that these cities and towns expanded in a diffuse pattern during the 1990–2020 study period. Further, shows time series plot variation of AWMLEI and MLEI values of individual urban site for each time period of the study. Geita have shown a straight-forward form of expansion trend with a progressive increase in AWMLEI and MLEI values indicating that the city becomes more and more compacted over time, with the dramatic rise seen between 2010 and 2015. Other cities and towns have shown an interesting trend with a periodic increase of AWMLEI and MLEI values signifying changes of urban expansion forms over time in which the periods with lower AWMLEI and MLEI values indicate leapfrog expansion as a dominant urban expansion form during that period and vice versa.
Figure 8. AWMLEI and MLEI values of individual urban site for each time period of the study.
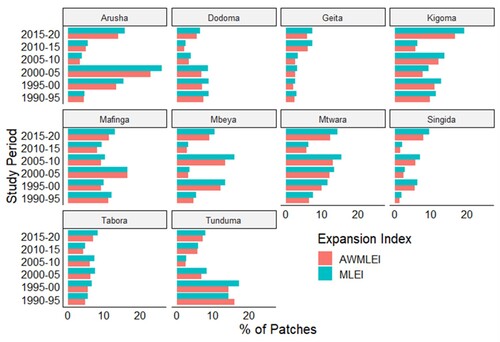
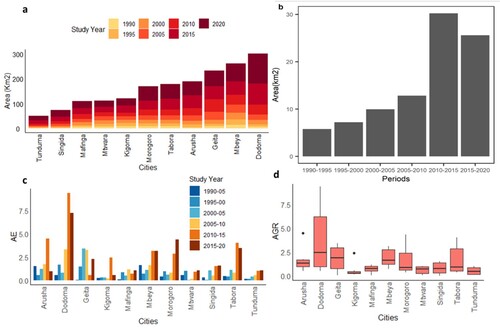
Figure 9. (a) Magnitude of area expansion for each city/town over the study period; (b) Average AE of the 11 cities and towns during the study period; (c) Average Annual expansion of the 11 urban sites during the study period; (d) AGR distribution of all 11 cities.
Edge urban expansion trend was the dominant urban expansion trend at different time periods for the cities and towns under this study. For Arusha, edge expansion was dominant urban expansion pattern during 2000–2005 while similar occurrence was recorded for Geita in 2015–2020, Mafinga in 2000–2005, Dodoma in 2000–2005, Kigoma in 2015–2020, Mbeya in 1990–1995, Morogoro in 1995–2000, Singida in 2015–2020, Tunduma in 1995–2000, Mtwara in 2005–2010 and Tabora in 2015–2020.
A significant leapfrog expansion occurred in Morogoro between 2005 and 2015, while during that same period the values of AWMLEI and MLEI were very low. Other significant leapfrog expansion patterns were noticed in Arusha between years 1990–1995 and 2005–2015 and Mbeya for years 2000–2005 and 2010–2015 ().
3.3. Magnitude and the rate of urban expansion
Dodoma, the capital city of Tanzania, experienced a much greater urban expansion rate over the 30 years of study with the average Annual Expansion (AE) of 43.15 km2. Mbeya, Geita, Arusha, and Tabora also did show a considerably significant growth rate with the average AE of 37.41, 33.35, 27.12, and 25.67 km2, respectively. On the other hand, Tunduma and Singida towns showed the slowest expansion rate between the 11 cities and towns with average AE of 10.63 and 7.15 km2, respectively (a).
Collectively, the expansion rate of the 11 Tanzania cities and towns was constantly increasing from the beginning of the study period 1990 to 2015, with the exception recorded during 2015–2020 period when the rate of expansion did decline a bit. The average AE during 2010–2015 study period was the highest when compared to the average AE of previous time periods. The least average AE was recorded during 1990–1995 (Figure (b)).
(c) reveals the variation in AE between the 11 cities and towns over the course of the study period. The figure shows that during the 2010–2015 study period Dodoma had the highest rate of expansion in comparison to other cities and towns (with and average AE of 9.35 km2). The least average AE of 0.03762 km2 was recorded in Singida town during the 1995–2000 study period.
Additionally, ACR distribution and variation between the 11 cities and towns were analyzed to provide clarity and understanding of their variations and the stability of the expansion rate ((d)). The figure shows that Kigoma, of all 11 study cities and towns, did show the most stable expansion rate having ACR value ranging from the lowest as 64.19 in 2010–2015 and the highest as 78.69 in 2000–2010, and the mean of 75.6% whilst Geita did show the most varying expansion rate ranging from 59.27 during 2000–2005 to 79.42 during the 1990–1995 period and the mean ACR of 71.21.
4. Discussion
The rate of urban expansion recorded from the 11 urban centers under this study reveals some important information about the peculiarities and complex interplay of socio-economic and population dynamics of each city/town. Tanzania has been an actively transiting nation with a largely mobile population due to various factors including political/administrative drivers(change of national Capital and Administrative headquarters of Tanzania from Dar-es-Salaam to Dodoma), environmental drivers (which was actually a substantial consideration in the movement of the capital city), and educational and institutional drivers (which influences population migration and ultimately urbanization as students and workers at various educational institutions continue to move from one city to the other). Another key driving factor is business (mining and agriculture as well as transportation hubs) and tourism that have seen the continued rise of some of the cities and towns listed in this study. The general pattern of urban expansion is a reflection of what is observed in most cities in sub-Saharan Africa especially in countries with relatively stable economies and guaranteed security which are necessary for investment, tourism, and economic advancement.
In this study, not unexpectedly, Dodoma has experienced the highest rate of urban expansion over the 30-year study period from 7 km2 in 1990 to 121 km2 in 2020. However, it is important to note that the rapid expansion of Dodoma city began from the study periods 2005–2010 then escalated almost exponentially from 2010–2015 and again from 2015–2020 (). As the city recording the second highest rate of urban expansion between 1990 and 2020, Mbeya city is the capital city of the Mbeya Region which is rich in agricultural productivity and mineral resources. The city, which became prominently established in the 1920s due to gold mining, is well connected in terms of road and rail networks, primarily for the evacuation of the cash and food crops from Tanzania and other parts of Southern Africa. The city recorded its highest rate of expansion between 2010–2015 and 2015–2020, a reflection of increased agricultural activities and agro-allied businesses within and around the city over the last decade. This pattern of growth appears to be consistent with the urban growth pattern recorded in Ghana (Cobbinah et al. Citation2020; Korah et al. Citation2017) and in Nigeria (Anule and Ujoh Citation2018; Dam et al. Citation2020; Ujoh et al. Citation2011) in West Africa.
Generally, all of the large cities exhibited a similar pattern of ascent in terms of expansion from 2005–2020 while urban expansion was generally slow at the beginning of the years of study (1990–2005). Conversely, the cities and towns that experienced the least growth were mostly the larger cities in 1990. These include Kigoma (10 km2 in 1990 to 30 km2 in 2020), Mafinga (6.6 km2 in 1990 to 28.6 km2 in 2020), and Mtwara (7.5 km2 in 1990 to 26.1 km2 in 2020). Tunduma city appears to be an outlier as its growth was rather gradual from 1.6 km2 in 1990 to 18 km2 in 2020 representing an annual average of 0.55 km2). Located in the Songwe Region on the border between Tanzania and Zambia, the city is a railway and road transportation junction/hub. The outcome shows that cities and towns in Tanzania have risen at different years and clearly by different drivers as revealed by Geita, Tabora, Morogoro, and Arusha cities.
In terms of the annual expansion rates (), Dodoma recorded the highest rates between 2010 and 2015 (9.3 km²) and 2015–2020 (7.2 km²). The next set of high rates of annual urban expansion were recorded between 2010 and 2015 by Arusha (4.4 km²), Tabora (4 km²), and Mbeya (3.1 km²), and between 2015 and 2020 by Morogoro (4.3 km²), Tabora (3.4 km²), and Mbeya (3.1 km²). However, it is striking to note that between 1990 and 2010, the only city that recorded the highest rate of annual urban expansion was Geita (3.41 km²), a historically German gold mine settlement which is currently the headquarters of Geita Region.
As shown in , , , and , the number and the area of new urban patches in all 11 cities and towns appear to correspond to the frequency and extensiveness of urbanization, in addition to provision of complementary information on temporal dynamics of the 3 urban expansion types similar to the findings of and Li et al., (Citation2022). The spatiotemporal dynamics of the three expansion types derived from the various analyses appear to be consistent for each time period (see , , , and ). On the whole, the edge expansion and leapfrog (or spontaneous growth) were observed to be the most important contributors to urban expansion across all 11 cities for all time periods, while the infilling played a relatively less influential role in urban expansion across all 11 cities and towns. Again, this finding aligns with the findings of Kassa (Citation2013) for Ethiopian cities, Cobbinah and Aboagye (Citation2017) for cities in Ghana, and Yiran et al., (Citation2020) which assessed urban expansion in Kenya, Nigeria, South Africa, and Ghana.
Regarding the urban expansion indices of AWMLEI and MLEI, the values appear to be complementary although MLEI is higher in all 11 cities and towns during all study periods albeit not so significantly higher than AWMLEI (). The most robust and significant interaction of the AWMLEI and MLEI among all 11 cities and towns is found in Kigoma, Arusha, Mtwara, Mafinga, and Tunduma urban center. For the remaining seven urban centers, the influence of AWMLEI and MLEI values recorded over the study period is not significantly influential when compared to the aforementioned 5 cities.
5. Conclusion
Retrospectively, this study provides an understanding of and explanation for the rate, form, and extent of urban expansion observed in 11 cities and towns in Tanzania over a period of 30 years (1990–2020). Intentionally, Dar-es-Salaam, the largest city in Tanzania was not included in the study as it would have presented inconsistencies in all forms of comparison with the other 11 cities and towns in terms of the magnitude of urban expansion magnitude, urban land patterns, urban development modes, urban expansion types, urban population changes, as well as land-use efficiency.
The study discovered that the common pattern of urban expansion across all 11 cities and towns is the combination of AWMLEI and MLEI urban growth indices, even though there were variations in terms of the magnitude and temporal occurrence (from 1990 to 2020) across the 11 cities and towns. A major discovery is in the fact that the infilling urban expansion tool could be used as a planning step towards stabilizing the influence of the other two dominant indices (leapfrog and edge expansion) on urban expansion in Tanzanian cities. Essentially, the urban growth of the cities (especially those with rapid urbanization rates) is found to be mostly polycentric with more than two influences and drivers controlling the pattern of urban growth and expansion.
Generally, population growth was positively correlated to urban expansion and function of cities (administrative, economic, educational, etc.). This study, therefore, provides a documented record of urban expansion (and its forms) across the 11 cities and towns as well as the need to infuse compactness in urban expansion as a key urban planning tool for urban centers in Tanzania. The intention is to eliminate uncontrolled development and improve efficiency of urban land use across all urban centers in Tanzania as they inevitably continue to expand.
Acknowledgements
The authors are sincerely grateful to the editors as well as the anonymous reviewers for their valuable suggestions and comments that helped us improve the quality of this paper significantly.
Disclosure statement
No potential conflict of interest was reported by the author(s).
Data availability statement
The data that support the findings of this study are available from the corresponding author(s) upon reasonable request.
Additional information
Funding
References
- Anderson, W. P., S. K. Pavlos, and J. M. Eric. 1996. “Urban Form, Energy and the Environment: A Review of Issues.” Evidence and Policy 33 (February 1994): 7–35. doi:10.1080/00420989650012.
- Anule, P., and F. Ujoh. 2018. Geospatial Analysis of Wetlands Degradation in Makurdi, Nigeria Geospatial Analysis of Wetlands Degradation in. August. doi:10.9734/JGEESI/2018/39505.
- Arusha-cc. 2016. The Strategic Plan for the Arusha City Council.
- Bar-Cohen, Y. 2006. “Biomimetics : Using Nature as an Inspiring Model for Human Innovation.” Bioinspiration & Biomimetics 1 (1): 1–4. doi:10.1088/1748-3182/1/1/P01.
- Bloom, D. E., D. Canning, and G. Fink. 2008. “Urbanization and the Wealth of Nations.” Science 319 (5864): 772–775. doi:10.1126/science.1153057.
- Bolund, P., and S. Hunhammar. 1999. “Ecosystem Services in Urban Areas.” Ecological Economics 29 (2): 293–301. doi:10.1016/S0921-8009(99)00013-0.
- Cai, B., Z. Shao, S. Fang, X. Huang, Y. Tang, M. Zheng, and H. Zhang. 2022. “The Evolution of Urban Agglomerations in China and How It Deviates from Zipf’s Law.” Geo-Spatial Information Science 00 (00): 1–11. doi:10.1080/10095020.2022.2083527.
- Chen, Z., Y. Li, Z. Liu, J. Wang, and X. Liu. 2022. “Impacts of Different Rural Settlement Expansion Patterns on Eco-Environment and Implications in the Loess Hilly and Gully Region, China.” Frontiers in Environmental Science 10 (March): 1–13. doi:10.3389/fenvs.2022.857776.
- Cobbinah, P. B., and H. N. Aboagye. 2017. “A Ghanaian Twist to Urban Sprawl.” Land Use Policy 61: 231–241. doi:10.1016/j.landusepol.2016.10.047.
- Cobbinah, P. B., M. O. Erdiaw-Kwasie, and P. Amoateng. 2015. “Africa’s Urbanisation: Implications for Sustainable Development.” Cities 47: 62–72. doi:10.1016/j.cities.2015.03.013.
- Cobbinah, P. B., E. Gaisie, N. Y. Oppong-Yeboah, and D. O. Anim. 2020. “Kumasi: Towards a Sustainable and Resilient Cityscape.” Cities 97 (October 2019), 102567. doi:10.1016/j.cities.2019.102567.
- Dam, D. P., S. Iorliam, F. Kwaghsende, P. T. Anule, I. Mngutyo, and J. Atser. 2020. “Emerging Urban Systems in the Benue Basin of Nigeria.” American Journal of Rural Development 8 (1): 17–27. doi:10.12691/ajrd-8-1-3.
- Dutta, I., and A. Das. 2019. “Application of Geo-spatial Indices for Detection of Growth Dynamics and Forms of Expansion in English Bazar Urban Agglomeration, West Bengal.” Journal of Urban Management 8 (2): 288–302. doi:10.1016/j.jum.2019.03.007.
- Fan, F., and W. Fan. 2014. “Understanding Spatial-Temporal Urban Expansion Pattern (1990–2009) Using Impervious Surface Data and Landscape Indexes: A Case Study in Guangzhou (China).” Journal of Applied Remote Sensing 8 (1): 083609. doi:10.1117/1.jrs.8.083609.
- Forman, R. T. T. 1995. “Some general principles of landscape and regional ecology.” In Landscape Ecology. Vol. 10, Issue 3, 133–142. SPB Academic Publishing. https://link.springer.com/content/pdf/10.1007/BF00133027.pdf.
- Grimm, N. B., S. H. Faeth, N. E. Golubiewski, C. L. Redman, J. Wu, X. Bai, and J. M. Briggs. 2008. “Global Change and the Ecology of Cities.” Science 319 (5864): 756–760. doi:10.1126/science.1150195.
- Halla, F. 2005. “Critical Elements in Sustaining Participatory Planning: Bagamoyo Strategic Urban Development Planning Framework in Tanzania.” Habitat International 29 (1): 137–161. doi:10.1016/S0197-3975(03)00077-8.
- Jiao, L., J. Liu, G. Xu, T. Dong, Y. Gu, B. Zhang, Y. Liu, and X. Liu. 2018. “Proximity Expansion Index: An Improved Approach to Characterize Evolution Process of Urban Expansion.” Computers, Environment and Urban Systems 70 (January 2017): 102–112. doi:10.1016/j.compenvurbsys.2018.02.005.
- Jiao, L., L. Mao, and Y. Liu. 2015. “Multi-order Landscape Expansion Index: Characterizing Urban Expansion Dynamics.” Landscape and Urban Planning 137: 30–39. doi:10.1016/j.landurbplan.2014.10.023.
- Kassa, Fekadu. 2013. “Conurbation and Urban Sprawl in Africa : The Case of the City of Addis Ababa.” Ghana Journal of Geography 5 (January 2013): 74–92. doi:10.4314/gjg.v5i1.
- Korah, P. I., P. B. Cobbinah, A. M. Nunbogu, and S. Gyogluu. 2017. “Spatial Plans and Urban Development Trajectory in Kumasi, Ghana.” GeoJournal 82 (6): 1113–1134. doi:10.1007/s10708-016-9731-1.
- Kropf, K. 2009. “Aspects of Urban Form.” Urban Morphology 13 (2): 105–120. doi:10.1002/9781118747711.ch3.
- Lepczyk, C., R. B. Hammer, S. I. Stewart, and ÆVC Radeloff. 2007. “Spatiotemporal Dynamics of Housing Growth Hotspots in the North Central U . S . from 1940 to 2000.” Landscape Ecology 22: 939–952. doi:10.1007/s10980-006-9066-2.
- Li, G., C. Fang, Y. Li, Z. Wang, S. Sun, S. He, W. Qi, et al. 2022. “Global impacts of future urban expansion on terrestrial vertebrate diversity.” Nature Communications 13 (1). doi:10.1038/s41467-022-29324-2.
- Liu, X., X. Li, Y. Chen, Z. Tan, S. Li, and B. Ai. 2010. “A New Landscape Index for Quantifying Urban Expansion Using Multi-temporal Remotely Sensed Data.” Landscape Ecology 25 (5): 671–682. doi:10.1007/s10980-010-9454-5.
- National Bureau of Statistics. 2013. Population Distribution by Age and Sex.
- National Bureau of Statistics (NBS). 2013. The 2012 Population and Housing Census, Population Distribution by Administrative Areas (Volume I), Dar es Salaam, Tanzania
- Nong, D., C. Lepczyk, T. Miura, J. Fox, J. Spencer, and Q. Chen. 2014. “Quantify Spatiotemporal Patterns of Urban Growth in Hanoi Using Time Series Spatial Metrics and Urbanization Gradient Approach.” 2: 25. doi:10.1371/journal.pone.0196940.
- Onilude, O. O., and E. Vaz. 2021. “Urban Sprawl and Growth Prediction for Lagos Using GlobeLand30 Data and Cellular Automata Model.” Sci 3 (2): 23. doi:10.3390/sci3020023.
- Parnell, S. 2016. “Defining a Global Urban Development Agenda.” World Development 78: 529–540. doi:10.1016/j.worlddev.2015.10.028.
- Roy, M. 2009. “Planning for Sustainable Urbanisation in Fast Growing Cities: Mitigation and Adaptation Issues Addressed in Dhaka, Bangladesh.” Habitat International 33 (3): 276–286. doi:10.1016/j.habitatint.2008.10.022.
- Sarif, M. O., and R. D. Gupta. 2021. “Modelling of Trajectories in Urban Sprawl Types and Their Dynamics (1988-2018): A Case Study of Prayagraj City (India).” Arabian Journal of Geosciences 14 (14), doi:10.1007/s12517-021-07573-7.
- Seto, K. C., and M. Fragkias. 2005. “Quantifying Spatiotemporal Patterns of Urban Land-use Change in Four Cities of China with Time Series Landscape Metrics.” Landscape Ecology 20 (7): 871–888. doi:10.1007/s10980-005-5238-8.
- Seto, K. C., B. Güneralp, and L. R. Hutyra. 2012. “Global Forecasts of Urban Expansion to 2030 and Direct Impacts on Biodiversity and Carbon Pools.” Proceedings of the National Academy of Sciences of the United States of America 109 (40): 16083–16088. doi:10.1073/pnas.1211658109.
- Shao, Z., N. S. Sumari, A. Portnov, F. Ujoh, W. Musakwa, and P. J. Mandela. 2021. “Urban Sprawl and Its Impact on Sustainable Urban Development: A Combination of Remote Sensing and Social Media Data.” Geo-Spatial Information Science 24 (2): 241–255. doi:10.1080/10095020.2020.1787800.
- Sumari, N. S., P. B. Cobbinah, F. Ujoh, and G. Xu. 2020. “On the Absurdity of Rapid Urbanization: Spatio-Temporal Analysis of Land-use Changes in Morogoro, Tanzania.” Cities 107 (June): 102876. doi:10.1016/j.cities.2020.102876.
- Sumari, N. S., P. J. Mandela, and C. S. Swai. 2021. “Impact of Urban Expansion on Land Surface Temperature in Dodoma and Morogoro Metropolises, Tanzania.” Proceedings of the 2nd SUA Scientific Conference held at SUA from 25th to 26th, 263–276.
- Sumari, N. S., Z. Shao, M. Huang, C. A. Sanga, and J. L. Van Genderen. 2017. “Urban Expansion: A Geo-spatial Approach for Temporal Monitoring of Loss of Agricultural LAND.” International Archives of the Photogrammetry, Remote Sensing and Spatial Information Sciences - ISPRS Archives 42 (2W7): 1349–1355. doi:10.5194/isprs-archives-XLII-2-W7-1349-2017.
- Sumari, N. S., H. Tanveer, Z. Shao, and E. S. Kira. 2019. “Geospatial Distribution and Accessibility of Primary and Secondary Schools: A Case of Abbottabad City, Pakistan.” Proceedings of the ICA 2: 1–11. doi:10.5194/ica-proc-2-125-2019.
- Sumari, N. S., G. Xu, F. Ujoh, P. I. Korah, O. J. Ebohon, and N. N. Lyimo. 2019. “A Geospatial Approach to Sustainable Urban Planning: Lessons for Morogoro Municipal Council, Tanzania.” Sustainability (Switzerland) 11 (22): 1–14. doi:10.3390/su11226508.
- Toure, S. I., D. A. Stow, K. Clarke, and J. Weeks. 2020. “Patterns of Land Cover and Land use Change Within the Two Major Metropolitan Areas of Ghana.” Geocarto International 35 (2): 209–223. doi:10.1080/10106049.2018.1516244.
- Ujoh, F., I. D. Kwabe, F. C. Commission, and O. O. Ifatimehin. 2011. “Urban Expansion and Vegetal Cover Loss in and Around Nigeria’s Federal Capital City.” Journal of Ecology and the Natural Environment 3 (February): 1–10. http://www.academicjournals.org/app/webroot/article/article1379759261_Fanan et al.pdf.
- UNDESA/PD. 2013. World Population Prospects: The 2012 revision, DVD Edition. UNEP (2007). Global environmental outlook 4: Environment for development.
- UN-HABITAT. 2015. Planned City Extensions : Analysis of Historical Examples.
- United Nations. 2012. World Population Prospects: The 2012 Revision. (Medium variant).
- United Nations. 2019. World Urbanization Prospects. In Department of Economic and Social Affairs (Vol. 12). https://population.un.org/wup/Publications/Files/WUP2018-Report.pdf.
- URT. 2015. The 2012 Population and Housing Census: Gender Dimension Monograph: Vol. IV. http://tanzania.opendataforafrica.org/TZSOCECD2016/social-economics-of-tanzania-2016?region=1000060-morogoro&indicator=1001300-population-size-number.
- Wu, S., N. S. Sumari, T. Dong, G. Xu, and Y. Liu. 2021. “Characterizing Urban Expansion Combining Concentric-Ring and Grid-based Analysis for Latin American Cities.” Land. doi:10.3390/land10050444.
- Wu, W., S. Zhao, C. Zhu, and J. Jiang. 2015. “A Comparative Study of Urban Expansion in Beijing, Tianjin and Shijiazhuang Over the Past Three Decades.” Landscape and Urban Planning 134: 93–106. doi:10.1016/j.landurbplan.2014.10.010.
- Xu, G., T. Dong, P. B. Cobbinah, L. Jiao, N. S. Sumari, B. Chai, and Y. Liu. 2019. “Urban Expansion and Form Changes Across African Cities with a Global Outlook: Spatiotemporal Analysis of Urban Land Densities.” Journal of Cleaner Production 224: 802–810. doi:10.1016/j.jclepro.2019.03.276.
- Xu, G., Z. Zhou, L. Jiao, and R. Zhao. 2020. “Compact Urban Form and Expansion Pattern Slow Down the Decline in Urban Densities: A Global Perspective.” Land Use Policy 94 (May): 104563. doi:10.1016/j.landusepol.2020.104563.
- Yiran, G. A. B., A. D. Ablo, F. E. Asem, and G. Owusu. 2020. “Urban Sprawl in sub-Saharan Africa: A review of the literature in selected countries.” Ghana Journal of Geography 12 (1): 1–28. doi:10.4314/gjg.v12i1.1.
- Zhang, Q., and K. C. Seto. 2011. “Mapping Urbanization Dynamics at Regional and Global Scales Using Multi-Temporal DMSP/OLS Nighttime Light Data.” Remote Sensing of Environment 115 (9): 2320–2329. doi:10.1016/j.rse.2011.04.032.