
 ?Mathematical formulae have been encoded as MathML and are displayed in this HTML version using MathJax in order to improve their display. Uncheck the box to turn MathJax off. This feature requires Javascript. Click on a formula to zoom.
ABSTRACT
The high-temporal-resolution monitoring of key management nodes in cotton management via agricultural remote sensing is vital for field cotton macro-statistics, particularly for predicting cotton production and obtaining comprehensive data. This study examines Shihezi, Xinjiang as a case study, utilizing Sentinel-1 and Sentinel-2 data from 2019 to 2021. Three machine learning models(RF, SVM, and CART) were employed to extract annual crop classification area rasters, monitor weekly cultivation progress, and monitor abandoned cropland during the cultivation period. The results demonstrate that the random forest model has produced satisfactory results in gridded extraction for cotton classification areas, achieving the producer's accuracy of the cotton category reached 98.5%, and the kappa coefficient is 0.947. Cotton cultivated in 2021 began is a week later than in 2020, yet exhibited a faster cultivate speed. The proportion of abandoned cotton fields in the study area rose in 2020 compared to 2019. The methodology presented in this study has a certain reference value for exploring the monitoring of continuous changes in crops over the years and macro-monitoring of important activities in the entire growth cycle.
1. Introduction
Google Earth Engine (GEE) is a cloud-based remote sensing platform that provides powerful computing power and an extensive database (Gorelick et al. Citation2017). It offers a variety of functions and enables users to perform a vast amount of remote sensing data processing using a script language in the browser, reducing the computing power requirements of remote sensing workers. GEE has a rich database, and users can easily access free and constantly updated satellite data. Additionally, GEE supports uploading local data to assets and using scripts for processing. Functions can be conveniently encapsulated and called, making it easy for users to navigate and utilize the platform. With the support of this platform, a vast amount of information can be monitored, especially in the field of agricultural remote sensing. Numerous studies have been conducted on crop map drawing (Adrian, Sagan, and Maimaitijiang Citation2021; Saah et al. Citation2019; Wang et al. Citation2019a; Yan and Ryu Citation2021), crop monitoring (Liu et al. Citation2020; Markos, Sims, and Giuliani Citation2023; Paludo et al. Citation2020), and cropland abandonment detection (Yin et al. Citation2020). Moreover, many studies have carried out long-term and planetary-level land-use change studies on this platform (Bey et al. Citation2020; Elnashar et al. Citation2021; Naboureh et al. Citation2021; Yang et al. Citation2022, Citation2019; Yue et al. Citation2023). These studies have provided interesting methods for planetary-level monitoring, which have greatly expanded the possibilities for remote sensing research.
The Sentinel series of satellites are highly popular among remote sensing workers for their free and high-resolution images, which are available on the Google Earth Engine platform. These satellites include all-weather radar images from Sentinel-1A and 1B, as well as high-resolution optical images from Sentinel-2A and 2B (Adrian, Sagan, and Maimaitijiang Citation2021; Amani et al. Citation2020; Li et al. Citation2020; Luo et al. Citation2021). The use of time-series data combined with spectral and radar images for crop classification has proven successful in various crop scenarios, including rice and wheat (Arjasakusuma et al. Citation2020; Perilla and Mas Citation2019; Tiwari et al. Citation2020). This study aims to explore a monitoring method for cotton crops, including the classification raster, the cultivation process, and the monitoring of abandoned cotton cropland.
Cotton is an important economic crop worldwide, and information about its production from cultivation to harvest is crucial (Chen et al. Citation2021; Wang et al. Citation2019b; Xu et al. Citation2020; Yang et al. Citation2021). Cultivation area and yield are crucial factors for determining total production, while changes in abandoned cropland can influence the cultivation area. Moreover, cultivation progress significantly impacts the length of the growth period, ultimately affecting crop yield (Yi et al. Citation2019; Yu et al. Citation2019; Zhang and Yemoto Citation2019). Current research primarily focuses on individual ground object classification and abandoned cultivated land classification, lacking a comprehensive monitoring system for key management nodes in cotton production, particularly the sowing progress. This information is vital for predicting cotton production, aiding farmers in making cultivation decisions, and assisting financial and government officials in evaluating supply and demand, as well as implementing macroeconomic controls.
Therefore, a systematic approach is required that encompasses the entire process to evaluate agricultural production capacity, predict and judge the value of agricultural products, and analyze value trends. This study aims to realize the macroscopic monitoring of key cotton management nodes through three steps: extraction of cotton classification map, monitoring of cultivation process and monitoring of abandoned farmland. The development of this research will further enhance the ability of producers and the government to perceive key factors such as cotton cultivation progress, cultivation willingness, and cultivation area, and lay the foundation for more precision cotton cultivation management.
2. Research methods
This study focuses on Shihezi City, Xinjiang, China, an essential agricultural production city with over 40% cropland proportion. Cotton is selected as the research subject, with its classification as the foundation for discussing the cotton cultivation process and cotton cropland abandonment changes.
The study used a variety of datasets from 2019 to 2021, including manually surveyed and labeled location information and satellite imagery (). To accomplish the study's objectives, we had developed two functions, an image preprocessing function and an Otsu algorithm function. The image preprocessing function generates an image collection comprising Sentinel-1 and Sentinel-2 data. The Sentinel-2 L2 data utilizes cloudless images filtered through the QA60 band (cloud probability band) and generates the specified vegetation index. The Sentinel-1 data includes Ground Range Detected (GRD) scenes, employs VH polarization images with a backscattering coefficient greater than −30, and specifies the Interferometric Wide swath (IW) mode. This function obtains the image collection of Sentinel-1 and Sentinel-2 that meet the conditions and fall within the specified time period. The Otsu algorithm is employed to acquire classification thresholds. Its principle involves obtain the variance between different categories of classification results through exhaustive thresholds and search for the threshold corresponding to the largest inter-class variance. Japanese scholar Nobuyuki Otsu first proposed this algorithm (Otsu Citation1979).
Table 1. Data Sources for each section.
In this paper, three machine learning models were employed for analysis, respectively Classification and Regression Trees(CART), Support Vector Machine(SVM), and Random Forest(RF) (Abdi Citation2020; Breiman et al. Citation1984; Sheykhmousa et al. Citation2020). To evaluate their performance, we utilized the confusion matrix and kappa statistics, focusing on overall accuracy, user's accuracy, producer's accuracy, and kappa coefficient as indicators(Cohen Citation1960; Tang et al. Citation2015). The necessary formulas were implemented using built-in functions in GEE, and their calculation methods have been documented in references.
(1)
(1)
(2)
(2)
(3)
(3)
(4)
(4) where the subscript class refers to the accuracy of the corresponding category.
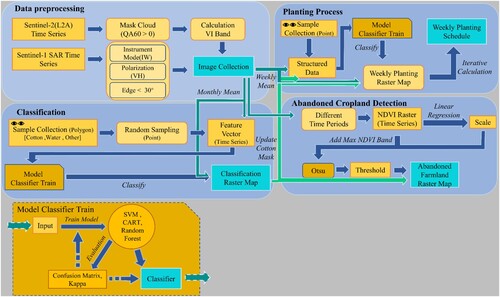
illustrates the four main parts of this study and a model flow. The data pre-processing part involves the function constructed by the research, which describes the method for merging the two image sets of Sentinel-2 and Sentinel-1; the classification part is the method of raster extraction of cotton cultivation area, and the feature vector is obtained through the manually labeled data set to training the model, and comparing the classification results of different models; the Cultivation Process part describe the manual labeling method to obtain the feature collection of the two states before and after cultivation, then training different models, and obtain the results according to the model and the specified time image, which corresponding results synthesized by the different state classification raster of the model and the cultivation area raster of the previous cultivation season; the abandoned cropland detection part describe the method of Otsu algorithm obtain the threshold of in NDVI time series data; the model classifier train section describes the process of model training and accuracy testing.
Figure 1. Technical route (the model classifier train is a reused part.).
2.1 Research on crop classification methods
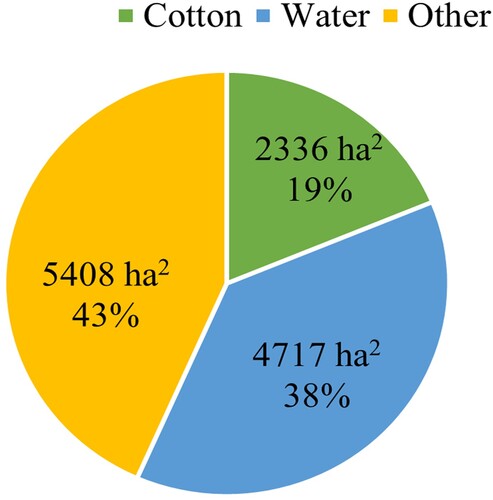
In this study, a combination of data from manual surveys conducted in the cotton fields of Shihezi, Xinjiang in 2019, and manual labeling methods were used to expand the data set. The expanded data set includes Cotton, Water, and Other categories, the Other category which includes plants that are not cotton, buildings, roads, etc. The green, blue, and yellow markers in represent the spatial distribution of these three categories, respectively. The data sets were labeled in Polygon form, and the area of each data set is shown in .
Figure 2. Overview of the study area and distribution of some samples.
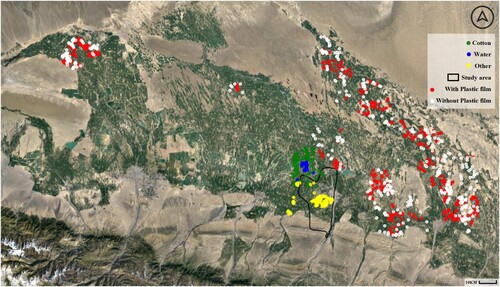
Figure 3. Data set area distribution.
In this section, the time range for the dataset selection is determined based on the features of different categories. Then, 10,000 feature points are randomly generated for each category, and the time series of the corresponding positions are extracted to obtain feature vectors. The feature vector is obtained from the monthly data set synthesized from April to October 2019, which consists of the vegetation index NDVI and VH backscatter coefficient corresponding to each point. The data set is then split into a train set and a test set with a ratio of 4:1, and the ratio of each category in the divided data set is 1:1, ensuring that our dataset division was reasonable, there was no issue with mixing training and test sets, and the data distribution across different categories was balanced. The model is trained and evaluated on this data set, and the model is used to generate the classification raster. The displayed result does not include the area where the training data is located.
2.2 Monitoring of the cultivation process
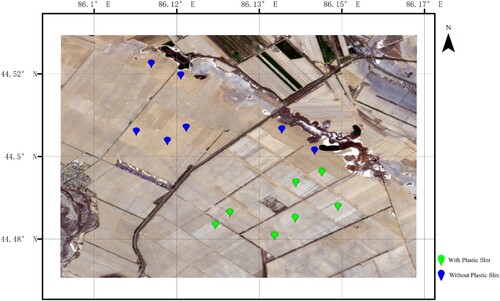
In Xinjiang, due to its unique climatic conditions, cotton cultivation often involves covering the fields with plastic film to maintain soil temperature and humidity. demonstrates the significant difference between covered and non-covered with plastic film fields in this region. To study this phenomenon, the manual labeling method was used to mark the mosaic images generated from the image collection taken between 30 April and 6 May 2021. In total, 587 and 578 points with and without plastic film were marked in the entire cotton cultivation area of Xinjiang. The red and white marks in represent the spatial distribution of these two categories respectively. The marks were used to extract the red, green, blue, near-infrared, and VH backscatter coefficient data of the image, resulting in a structured dataset. To evaluate the model, the dataset was divided into a training set and a test set in a 4:1 ratio.
Figure 4. Example of the image covered by plastic film on May 6, 2021.
To detect the cultivation progress, we use weekly mean imagery. However, due to satellite revisit period limitations, the area covered in each week might differ, which can lead to missing data. To address this issue, we devised a method to solve the missing results. Generally, the plastic film that has been covered will not be removed before cultivation. Since the climate in the region is typically dry with significant day-night temperature differences, a film is necessary to maintain soil temperature and moisture. Therefore, we combined the predicted results of the previous period with the current predicted results iteratively to obtain the complete results of the current period ().
Figure 5 Prediction result combination diagrams.
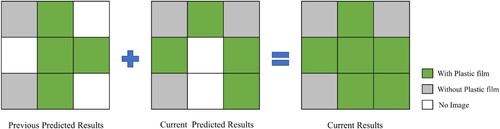
Using a mask file to filter non-cotton growing areas is an effective technique for isolating the cotton cultivation area from non-cotton areas, which is essential for analyzing and predicting the growth of cotton in the current year. The mask file is created by utilizing the classified raster map that contains information about the cotton fields from the previous year. This map helps filter out non-cotton areas and identify the region where cotton is planted in the current year. This process of identifying the cotton cultivation area can provide valuable insights into the growth and yield of cotton, which can benefit both farmers and researchers. Moreover, after obtaining the classification map of film coverage, the current cultivation rate can be determined by dividing the area covered with the film by the total area, which provides an important metric for assessing the success of cotton cultivation in the current year.
2.3 Abandoned cropland detection
Abandoned cropland in this study is defined as cropland where no crop cultivation activities have occurred during one or more crop cultivation periods. While the NDVI of crops changes during the growth process, abandoned cropland exhibits no such change (Tucker et al. Citation1979). Relying solely on NDVI to determine whether an area is wasteland in each image period may not necessarily indicate that it is abandoned cropland, as some cultivated land may have already been harvested. Consequently, this study considers the phenological period of the target location to determine whether there has been vegetation on each cropland in a specific period.
Annual monitoring is considered to be the most effective for identifying abandoned cropland in Xinjiang because the cultivation system in this region typically involves one cropping cycle per year. In order to test this hypothesis, the study compared the results of annual monitoring with those of monitoring cycles of 6 months and 3 months.
To identify abandoned cropland, the study first calculated the slopes of the maximum, average, and minimum NDVI values during the monitoring period. The Otsu algorithm was then used to find the threshold for classification based on these slopes. Finally, the image was divided into abandoned cropland and non-abandoned cropland based on this threshold.
It is important to note that relying solely on NDVI to identify abandoned cropland can be challenging since changes in vegetation cover alone may not necessarily indicate abandonment. Therefore, the study considered the phenological period of the target location to help distinguish abandoned cropland from other types of land cover.
3. Results
3.1 Classification accuracy and results
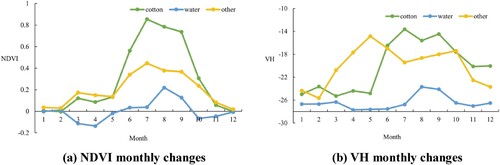
The NDVI time-series data for the three categories under study were obtained in GEE using function script. As shown in , the three categories can be well distinguished from April to October. Consequently, for model training, the experiment employed time series feature vectors constructed by NDVI and VH backscatter coefficients from April to October 2019. The trained model was used to classify the satellite data for 2020.
Figure 6. Monthly changes in different categories.
The random forest model showed good results in both evaluation methods. The evaluation based on the confusion matrix method indicated that the overall performance of the random forest model was better, with an overall accuracy of 96.5%. The User's and Producer's Accuracy for Cotton and Other categories were the highest ().
Table 2. Model verification results for classification.
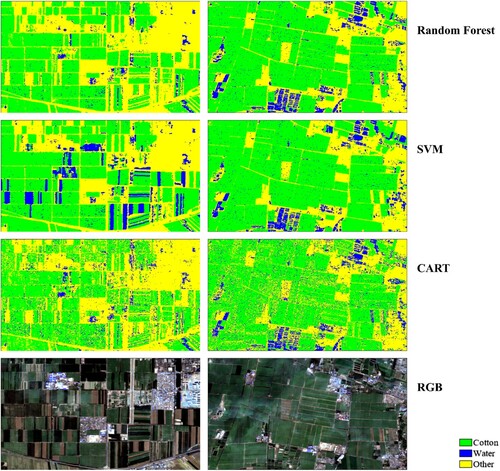
As seen in the , taking the 2020 image as the classification object, the RGB image in the figure is a composite image from June to August 2020. The random forest model performs best among the three models. In the selected scenes in the figure, the SVM model appears to be prone to confusing non-cotton farmland with the water category, while both the random forest model and SVM model have a similar salt & pepper effect. However, the salt & pepper effect is more pronounced in the CART model.
Figure 7. Detailed display of classification results.
The classification map generated by the random forest model demonstrated the highest accuracy, as determined by the comparison of evaluation indicators and classified images. Therefore, this map was chosen as the mask file for further research and analysis.
3.2 Statistics and analysis for cultivation process
The primary focus of the research on the cotton cultivation process is to determine whether the arable land is covered with plastic film. The SVM model exhibits the poorest performance(), where Without in table means without plastic film, With in table means with plastic film. The CART model and the random forest model display similar evaluation results for each category, however, the overall accuracy and kappa coefficient of the CART model are higher than those of the random forest model.
Table 3. Model verification results for the cultivation process.
Based on the results obtained from different models, two rasters were generated to detect cotton cultivation progress in 2020 and 2021. After evaluating the indicators and examining the rasters in detail, it was discovered that the prediction results of the SVM model were unsatisfactory. Although the difference between the CART model and the random forest model was not significant, the salt & pepper effect observed by the CART model was more severe than that of the random forest model ().
Figure 8. Cultivation progress at different times based on different models.
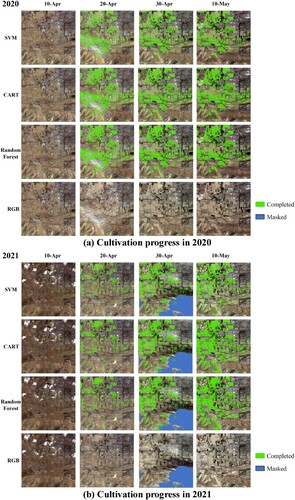
Based on the statistical analysis of the three models, it can be observed that the beginning of the cotton cultivation process in April 2021 was approximately ten days behind that of 2020 (). However, it had exceeded the 2020 cultivation process by May. The results of the analysis indicate that all three models predict the 2021 cultivation progress to be faster than 2020, especially the more accurate models, CART and random forest, which exceeded last year's progress by 7.28% and 8.17%, respectively. Therefore, it can be concluded that the 2021 cotton cultivation process is progressing faster than the 2020 ().
Table 4. Cultivation progress monitored by different models.
3.3 Abandoned cropland detection
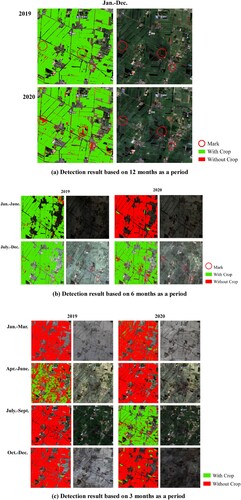
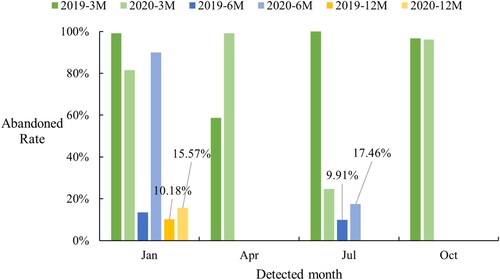
To detect changes in abandoned cropland, three detection periods were used, 12 months, 6 months, and 3 months. The results indicate that the 12-month and 6-month periods are better for detecting the abandonment of cotton fields in this area, while the 3-month period's detection results are more likely to indicate abandoned cropland. Among the test results with a 6-month period, only the results from July to December showed good results. Where in , the red circle marks the abandoned cropland that has changed significantly in the two years. Where in , detected month refers to the start month of the detection cycle, 3M, 6M, and 12M refer to the detection periods of 3, 6, and 12 months respectively. The statistics indicate that the proportion of abandoned cotton fields in 2020 is higher than in 2019, with an increase of 5% to 7%. However, it is possible that the ratio is higher due to the limitations of the model methods employed.
Figure 9. Statistics of cultivation progress monitored by each model.
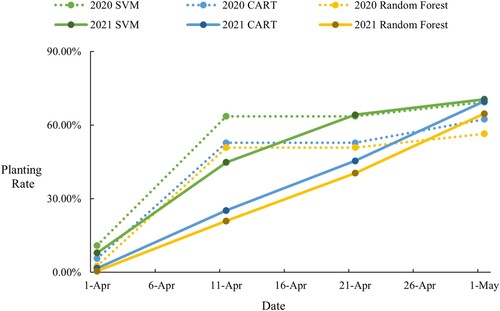
Figure 10. Changes in the detection results of abandoned cropland.
4. Discussions
This research highlights several significant aspects worthy of discussion. The powerful capabilities of the GEE platform have helped us achieve complex and time-consuming tasks, reducing the costs of remote sensing workers. Researchers can employ straightforward syntax to combine and analyze multiple satellite images, as demonstrated in this study through the integration of Sentinel-1 and Sentinel-2 images. Furthermore, with the assistance of the GEE platform, researchers can utilize basic functions to construct a classifier and accomplish feature classification.
The classification of cotton has achieved favorable results, especially the random forest mode. Its overall accuracy reached 96.5%, and the producer's accuracy in the cotton category reached 98.5%, both higher than other models. This result is slightly higher than previous research results(Adrian, Sagan, and Maimaitijiang Citation2021; Kibret, Marohn, and Cadisch Citation2020; Liu et al. Citation2020). The possible reason is that we use fewer categories, so we still maintain good results under simple machine learning models, but we cannot ensure that it is also effective in more complex scenarios. The selected samples in our dataset may have been very representative regions, and the mixed-use of the Other category may have caused the classifier to prefer not to classify the features into that category. This explains the higher user's accuracy than the producer's accuracy in the SVM and random forest models for this category.
It should be noted that the method used in this research is only applicable to areas or crops where plastic film is used for covering and sowing simultaneously. The classification raster obtained in previous studies is used as a mask file to obtain data on the cotton cultivation process. Among the three classifiers used in this study to detect the presence or absence of plastic film, SVM performed poorly, possibly due to the high data dimension and large-size dataset, while CART and random forest performed better in modeling high-dimensional data. Especially the CART model, its overall accuracy reached 87.07%, and the producer's accuracy in the categories which with and without plastic film reached 85.34%, 88.79%, respectively. The statistical results based on SVM classification differed significantly from those of CART and random forest, as shown in . The classification accuracy of CART and random forest models is good, and their detection results are consistent, suggesting that the information conveyed by these two models is correct. Therefore, the start of cotton cultivation in this area in 2021 was about 10 days later than last year, followed by faster cultivation progress.
Figure 11. Statistics of abandoned cropland detection results.
In the classification of cotton and the classification of whether it is covered with a film, the accuracy of SVM is poor, which may be due to the large sample size, and the interpretation of SVM for large samples is poor(Nagasubramanian et al. Citation2018; Yuan et al. Citation2017). In the two tasks, RF is more excellent in terms of accuracy and control of the salt and pepper effect, which depends on RF's ability to better suppress overfitting and has good robustness(Magidi et al. Citation2021; Phalke et al. Citation2020). CART has a good performance in the task of film classification, but poor performance in the task of cotton classification, which may be due to its easy overfitting, and the greedy algorithm does not always find the global optimal solution (Thieme et al. Citation2020).
The effectiveness of using the Otsu algorithm to detect cropland abandonment depends on selecting an appropriate detection period. In this study, we obtained good results by selecting detection periods consistent with the cultivation pattern in the study area, including 12-month and 6-month periods. However, inappropriate period selection may cause a loss of key information in the data, as seen in the 6-month detection results from January to June, and in the 3-month detection results, where changes in the data are not significant enough to be classified accurately. Our results indicate that the percentage of abandoned cropland has increased from 10.18% to 15.57% and from 9.91% to 17.46%, according to the two most reliable statistics. This result means that the cotton sown area in Shihezi City will be reduced by about 5% in 2020.
The limitation of this study is that it fails to cover more production management nodes. In combination with the GEE remote sensing big data platform, the monitoring of nodes such as cotton defoliation process and harvesting process can be developed in the future. And limited by the computing power provided by the platform and the coverage of the data set, the research has not been tested on a larger scale. In the future, the data sets in various regions can be supplemented to expand the research area and build a monitoring platform for key nodes of cotton production.
5. Conclusion
This study leverages the GEE remote sensing cloud platform to investigate the major cotton production activities in the Shihezi area of Xinjiang over the past three years. By utilizing ground classification results and the unique mulching activity during cotton cultivation in Xinjiang, a method for fast monitoring of the cultivation process is achieved. Additionally, by combining the classification results, the changes in the abandoned cropland area can be quickly estimated. The results show that the planting speed of cotton in 2021 is faster than that in 2020 in the study area, and the proportion of abandoned cotton fields in 2020 is higher than that in 2019. Future research will focus on refining the methodology, incorporating additional data sources, exploring advanced machine learning techniques, and extending the approach to other agricultural regions to support sustainable agricultural practices and decision-making.
CRediT authorship contribution statement
Weiguang Yang: Write, Conceptualization, Methodology, Software. Weicheng Xu: Investigation, Software. Kangtin Yan: Methodology. Zongyin Cui: Software. Pengchao Chen: Conceptualization, Methodology. Lei Zhang: Conceptualization, Revised, Funding acquisition. Yubin Lan: Conceptualization, Funding acquisition, Supervision.
Disclosure statement
No potential conflict of interest was reported by the author(s).
Data availability
Data available on request from the authors.
Additional information
Funding
References
- Abdi, A. M. 2020. “Land Cover and Land use Classification Performance of Machine Learning Algorithms in a Boreal Landscape Using Sentinel-2 Data.” GIScience & Remote Sensing 57 (1): 1–20. doi:10.1080/15481603.2019.1650447.
- Adrian, J., V. Sagan, and M. Maimaitijiang. 2021. “Sentinel sar-Optical Fusion for Crop Type Mapping Using Deep Learning and Google Earth Engine.” ISPRS JOURNAL OF PHOTOGRAMMETRY AND REMOTE SENSING 175: 215–235. doi:10.1016/j.isprsjprs.2021.02.018.
- Amani, M., M. Kakooei, A. Moghimi, A. Ghorbanian, B. Ranjgar, S. Mahdavi, A. Davidson, et al. 2020. “Application of Google Earth Engine Cloud Computing Platform, Sentinel Imagery, and Neural Networks for Crop Mapping in Canada.” Remote Sensing 12 (21): 3561. doi:10.3390/rs12213561.
- Arjasakusuma, S., S. Swahyu Kusuma, R. Rafif, S. Saringatin, and P. Wicaksono. 2020. “Combination of Landsat 8 oli and Sentinel-1 sar Time-Series Data for Mapping Paddy Fields in Parts of West and Central Java Provinces, Indonesia.” ISPRS International Journal of Geo-Information 9 (11): 663. doi:10.3390/ijgi9110663.
- Bey, A., J. Jetimane, S. N. Lisboa, N. Ribeiro, A. Sitoe, and P. Meyfroidt. 2020. “Mapping Smallholder and Large-Scale Cropland Dynamics with a Flexible Classification System and Pixel-Based Composites in an Emerging Frontier of Mozambique.” REMOTE SENSING OF ENVIRONMENT 239 (111611), doi:10.1016/j.rse.2019.111611.
- Breiman, L., J. H. Friedman, R. A. Olshen, and C. J. Stone. 1984. Classification and Regression Trees, Vol. 40. New York: Routledge.
- Chen, P., F. Ouyang, G. Wang, H. Qi, W. Xu, W. Yang, Y. Zhang, et al. 2021. “Droplet Distributions in Cotton Harvest aid Applications Vary with the Interactions among the Unmanned Aerial Vehicle Spraying Parameters.” INDUSTRIAL CROPS AND PRODUCTS 163 (113324), doi:10.1016/j.indcrop.2021.113324.
- Cohen, J. 1960. “A Coefficient of Agreement for Nominal Scales.” EDUCATIONAL AND PSYCHOLOGICAL MEASUREMENT 20 (1): 37–46. doi:10.1177/001316446002000104.
- Elnashar, A., L. Wang, B. Wu, W. Zhu, and H. Zeng. 2021. “Synthesis of Global Actual Evapotranspiration from 1982 to 2019.” Earth System Science Data 13 (2): 447–480. doi:10.5194/essd-13-447-2021.
- Gorelick, N., M. Hancher, M. Dixon, S. Ilyushchenko, D. Thau, and R. Moore. 2017. “Google Earth Engine: Planetary-Scale Geospatial Analysis for Everyone.” REMOTE SENSING OF ENVIRONMENT 202: 18–27. doi:10.1016/j.rse.2017.06.031.
- Kibret, K. S., C. Marohn, and G. Cadisch. 2020. “Use of Modis evi to map Crop Phenology, Identify Cropping Systems, Detect Land use Change and Drought Risk in Ethiopia – an Application of Google Earth Engine.” European Journal of Remote Sensing 53 (1): 176–191. doi:10.1080/22797254.2020.1786466.
- Li, H., D. Fu, C. Huang, F. Su, Q. Liu, G. Liu, S. Wu, et al. 2020. “An Approach to High-Resolution Rice Paddy Mapping Using Time-Series Sentinel-1 sar Data in the mun River Basin, Thailand.” Remote Sensing 12 (23): 3959. doi:10.3390/rs12233959.
- Liu, L., X. Xiao, Y. Qin, J. Wang, X. Xu, Y. Hu, Z. Qiao, et al. 2020. “Mapping Cropping Intensity in China Using Time Series Landsat and Sentinel-2 Images and Google Earth Engine.” REMOTE SENSING OF ENVIRONMENT 239 (111624), doi:10.1016/j.rse.2019.111624.
- Luo, C., B. Qi, H. Liu, D. Guo, L. Lu, Q. Fu, Y Shao, et al. 2021. “Using Time Series Sentinel-1 Images for Object-Oriented Crop Classification in Google Earth Engine.” Remote Sensing 13 (4): 561. doi:10.3390/rs13040561.
- Magidi, J., L. Nhamo, S. Mpandeli, and T. Mabhaudhi. 2021. “Application of the Random Forest Classifier to map Irrigated Areas Using Google Earth Engine.” Remote Sensing 13 (5): 876. doi:10.3390/rs13050876.
- Markos, A., N. Sims, and G. Giuliani. 2023. “Beyond the sdg 15.3.1 Good Practice Guidance 1.0 Using the Google Earth Engine Platform: Developing a Self-Adjusting Algorithm to Detect Significant Changes in Water use Efficiency and net Primary Production.” Big Earth Data 7 (1): 59–80. doi:10.1080/20964471.2022.2076375.
- Naboureh, A., J. Bian, G. Lei, and A. Li. 2021. “A Review of Land use/Land Cover Change Mapping in the China-Central Asia-West Asia Economic Corridor Countries.” Big Earth Data 5 (2): 237–257. doi:10.1080/20964471.2020.1842305.
- Nagasubramanian, K., S. Jones, S. Sarkar, A. K. Singh, A. Singh, and B. Ganapathysubramanian. 2018. “Hyperspectral Band Selection Using Genetic Algorithm and Support Vector Machines for Early Identification of Charcoal rot Disease in Soybean Stems.” Plant Methods 14(1). doi:10.1186/s13007-018-0349-9.
- Otsu, N. 1979. “A Threshold Selection Method from Gray-Level Histograms.” IEEE Transactions on Systems, Man, and Cybernetics 9 (1): 62–66. doi:10.1109/TSMC.1979.4310076.
- Paludo, A., W. R. Becker, J. Richetti, L. C. D. A. Silva, and J. A. Johann. 2020. “Mapping Summer Soybean and Corn with Remote Sensing on Google Earth Engine Cloud Computing in Parana State - Brazil.” International Journal of Digital Earth 13 (12): 1624–1636. doi:10.1080/17538947.2020.1772893.
- Perilla, G. A., and J. Mas. 2019. “High-resolution Mapping of Protected Agriculture in Mexico, Through Remote Sensing Data Cloud Geoprocessing.” European Journal of Remote Sensing 52 (1): 532–541. doi:10.1080/22797254.2019.1686430.
- Phalke, A. R., M. özdoğan, P. S. Thenkabail, T. Erickson, N. Gorelick, K. Yadav, et al. 2020. “Mapping Croplands of Europe, Middle East, Russia, and Central Asia Using Landsat, Random Forest, and Google Earth Engine.” ISPRS JOURNAL OF PHOTOGRAMMETRY AND REMOTE SENSING 167: 104–122. doi:10.1016/j.isprsjprs.2020.06.022.
- Saah, D., G. Johnson, B. Ashmall, G. Tondapu, K. Tenneson, M. Patterson, A. Poortinga, et al. 2019. “Collect Earth: An Online Tool for Systematic Reference Data Collection in Land Cover and use Applications.” ENVIRONMENTAL MODELLING & SOFTWARE 118: 166–171. doi:10.1016/j.envsoft.2019.05.004.
- Sheykhmousa, M., M. Mahdianpari, H. Ghanbari, F. Mohammadimanesh, P. Ghamisi, and S. Homayouni. 2020. “Support Vector Machine Versus Random Forest for Remote Sensing Image Classification: A Meta-Analysis and Systematic Review.” IEEE Journal of Selected Topics in Applied Earth Observations and Remote Sensing 13: 6308–6325. doi:10.1109/JSTARS.2020.3026724.
- Tang, W., J. Hu, H. Zhang, P. Wu, and H. He. 2015. “Kappa Coefficient: A Popular Measure of Rater Agreement.” Shanghai Archives of Psychiatry 27 (1): 62–67. doi:10.11919/j.issn.1002-0829.215010.
- Thieme, A., S. Yadav, P. C. Oddo, J. M. Fitz, S. Mccartney, L. King, J. Keppler, et al. 2020. “Using Nasa Earth Observations and Google Earth Engine to map Winter Cover Crop Conservation Performance in the Chesapeake bay Watershed.” REMOTE SENSING OF ENVIRONMENT 248 (111943), doi:10.1016/j.rse.2020.111943.
- Tiwari, V., M. A. Matin, F. M. Qamer, W. L. Ellenburg, B. Bajracharya, K. Vadrevu, B. R. Rushi, et al. 2020. “Wheat Area Mapping in Afghanistan Based on Optical and sar Time-Series Images in Google Earth Engine Cloud Environment.” Frontiers in Environmental Science 8 (77), doi:10.3389/fenvs.2020.00077.
- Tucker, C. J., J. H. Elgin, J. E. Mcmurtrey, and C. J. Fan. 1979. “Monitoring Corn and Soybean Crop Development with Hand-Held Radiometer Spectral Data.” REMOTE SENSING OF ENVIRONMENT 8 (3): 237–248. doi:10.1016/0034-4257(79)90004-X.
- Wang, S., G. Azzari, and D. B. Lobell. 2019a. “Crop Type Mapping Without Field-Level Labels: Random Forest Transfer and Unsupervised Clustering Techniques.” REMOTE SENSING OF ENVIRONMENT 222: 303–317. doi:10.1016/j.rse.2018.12.026.
- Wang, G., Y. Lan, H. Qi, P. Chen, A. Hewitt, and Y. Han. 2019b. “Field Evaluation of an Unmanned Aerial Vehicle (uav) Sprayer: Effect of Spray Volume on Deposition and the Control of Pests and Disease in Wheat.” PEST MANAGEMENT SCIENCE 75 (6): 1546–1555. doi:10.1002/ps.5321.
- Xu, W., W. Yang, S. Chen, C. Wu, P. Chen, and Y. Lan. 2020. “Establishing a Model to Predict the Single Boll Weight of Cotton in Northern Xinjiang by Using High Resolution uav Remote Sensing Data.” COMPUTERS AND ELECTRONICS IN AGRICULTURE 179: 105762. doi:10.1016/j.compag.2020.105762.
- Yan, Y., and Y. Ryu. 2021. “Exploring Google Street View with Deep Learning for Crop Type Mapping.” ISPRS JOURNAL OF PHOTOGRAMMETRY AND REMOTE SENSING 171: 278–296. doi:10.1016/j.isprsjprs.2020.11.022.
- Yang, Z., S. Duan, X. Dai, Y. Sun, and M. Liu. 2022. “Mapping of Lakes in the Qinghai-Tibet Plateau from 2016 to 2021: Trend and Potential Regularity.” International Journal of Digital Earth 15 (1): 1692–1714. doi:10.1080/17538947.2022.2131008.
- Yang, Z., W. Li, Q. Chen, S. Wu, S. Liu, and J. Gong. 2019. “A Scalable Cyberinfrastructure and Cloud Computing Platform for Forest Aboveground Biomass Estimation Based on the Google Earth Engine.” International Journal of Digital Earth 12 (9): 995–1012. doi:10.1080/17538947.2018.1494761.
- Yang, W., W. Xu, C. Wu, B. Zhu, P. Chen, L. Zhang, Y. Lan, et al. 2021. “Cotton Hail Disaster Classification Based on Drone Multispectral Images at the Flowering and Boll Stage.” COMPUTERS AND ELECTRONICS IN AGRICULTURE 180: 105866. doi:10.1016/j.compag.2020.105866.
- Yi, L., Y. Lan, H. Kong, F. Kong, and X. Han. 2019. “Exploring the Potential of uav Imagery for Variable Rate Spraying in Cotton Defoliation Application.” International Journal of Precision Agricultural Aviation 2 (1): 42–45. doi:10.33440/j.ijpaa.20190201.0018.
- Yin, H., A. Brandão, J. Buchner, D. Helmers, B. G. Iuliano, N. E. Kimambo, K. E. Lewinska, et al. 2020. “Monitoring Cropland Abandonment with Landsat Time Series.” REMOTE SENSING OF ENVIRONMENT 246 (111873), doi:10.1016/j.rse.2020.111873.
- Yu, F., W. Du, Z. Guo, C. Zhou, D. Wang, and T. Xu. 2019. “Uav Hyperspectral Inversion Modeling of Rice Nitrogen Content Based on Woa-elm.” International Journal of Precision Agricultural Aviation 2 (2): 43–48. doi:10.33440/J.IJPAA.20190202.39.
- Yuan, H., G. Yang, C. Li, Y. Wang, J. Liu, H. Yu, H. Feng, et al. 2017. “Retrieving Soybean Leaf Area Index from Unmanned Aerial Vehicle Hyperspectral Remote Sensing: Analysis of rf, ann, and svm Regression Models.” Remote Sensing 9 (4): 309. doi:10.3390/rs9040309.
- Yue, L., B. Li, S. Zhu, Q. Yuan, and H. Shen. 2023. “A Fully Automatic and High-Accuracy Surface Water Mapping Framework on Google Earth Engine Using Landsat Time-Series.” International Journal of Digital Earth 16 (1): 210–233. doi:10.1080/17538947.2023.2166606.
- Zhang, H., and K. Yemoto. 2019. “Uas-based Remote Sensing Applications on the Northern Colorado Limited Irrigation Research Farm.” International Journal of Precision Agricultural Aviation 1 (2): 1–10. doi:10.33440/j.ijpaa.20190202.50.